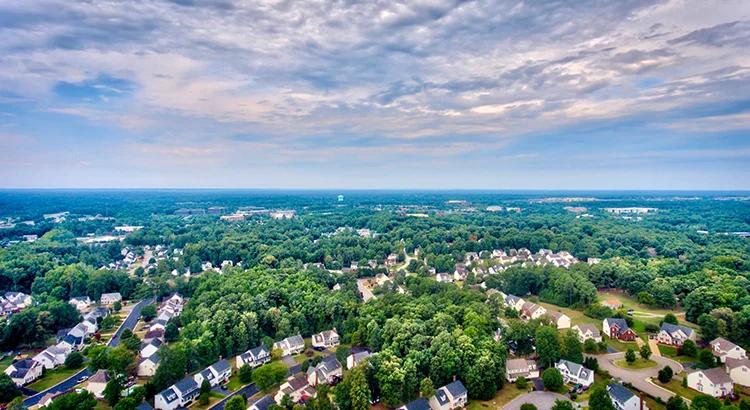
This is a question we should all be asking ourselves
Our market is incredibly diverse, and changing rapidly Values may vary, not just by neighborhood, but by street Your home isn't necessarily worth what your neighbors' home is The current market is what sets the value of your home
So, do you know what your home is worth in today's market?
Contact me for a confidential, no obligation assessment of your home's value.
With the rapid shift that’s happened in the housing market this year, some people are raising concerns that we’re destined to repeat the crash we saw in 2008 Though there are some parallels, the current market conditions differ significantly from those of the dot-com bubble in 2000 This time around the market presents a much more stable and secure landscape than it did previously, thanks to significantly reduced levels of foreclosure. Here’s a look at why there won’t be a wave of foreclosures flooding the market.
Milpitas
What's in the Milpitas data?
Milpitas’ single-family housing market decreased to $1.4 million with 17 homes sold. There was an increase in new listings with 52 units. The number of condo and townhome sales increased to $1 million since last November with 13 units sold and 45 new listings. Buyers have remained aggressive, with offer prices persisting to be around 100%. Due to only 6% of sales being finalized, the market is experiencing a supply shortage. Combined with surging demand, the cost of buying continues to increase, creating an imbalance between the pricing range and active options in the marketplace.
Listings
Listings
mber2022
mber2022
Single Family Homes
The median sales price has slightly increased from $1 450m last year's November to $1 460m this year
Condos & Townhomes
The median sales price has increased from $928k last November 2021 to $1m by November 2022
AVGDays OntheMarket
Single Family Homes
The average time on the market has increased from 19 days in November 2021, to 21 days this year.
Condos & Townhomes
The average time on the market has gone up from 19 days last year November 2021, to 23 days this year
Overbids
Single Family Homes
The overbid percentage has decreased from 113.1% last year's November, to 96.7% this year.
Condos & Townhomes
The overbid percentage decreased from 104% of November 2021, to 96 2% a year later
Fremont
What's in the Fremont data?
Fremont’s single-family housing market decreased to $1.4 million median sold price with 65 homes sold. There was an increase in new listings at 162 units. The number of condo and townhome sales decreased to $795k with 24 units sold and 116 new listings. Buyers have remained aggressive, with offer prices persisting to be around 100%. Due to only 6% of sales being finalized, the market is experiencing a supply shortage. Combined with surging demand, the cost of buying continues to increase, creating an imbalance between the pricing range and active options in the marketplace.
The median sales price has decreased from $1 5m in November 2021 to $1 4m in November 2022
Condos & Townhomes
The median sales price has decreased from $807k in November 2021 and $795k in November 2022.
AVGDays OntheMarket
Single Family Homes
The average time on market increased from 20 days last November 2021, to 23 days by November 2022.
Condos & Townhomes
The average time on market increased from 19 days in November 2021, to 44 days this year
Overbids
Single Family Homes
The overbid percentage decreased from 111.30% last November 2021 to 95.4% a year later.
Condos & Townhomes
The overbid percentage decreased from 104 7% last November 2021 to 96 3% a year later
Newark
What's in the Newark data?
Newark’s median sold price for single-family homes in November decreased to $1.1 million with 18 homes sold and the number of new listings increased to 46. The number of condo and townhome sales decreased to $705k with 6 units sold and 11 new listings. Buyers have remained aggressive, with offer prices persisting to be around 100%. Due to only 6% of sales being finalized, the market is experiencing a supply shortage. Combined with surging demand, the cost of buying continues to increase, creating an imbalance between the pricing range and active options in the marketplace.
LISTINGS FOR SALE SOLD LISTINGS
ingle Family Homes ast 12 months, year-over-year.
ondos & Townhomes ast 12 months, year-over-year
Single Family Homes
The median sales price slightly decreased from $1 3m in November 2021 to $1 1m in November 2022
Condos & Townhomes
The median sales price has decreased from $877k in November 2021 and $705k in November 2022.
AVGDays OntheMarket
Single Family Homes
The average time on market increased from 19 days last November 2021 to 26 days by November 2022
Condos & Townhomes
The average time on market increased from 29 days in November 2021, to 33 days this year
Overbids
Single Family Homes
The overbid percentage has decreased from 109.5% last November 2021 to 94.2% a year later.
Condos & Townhomes
The overbid percentage has decreased from 105 7% last November 2021 to 100% a year later
Union City
What's in the Union City data?
Union City’s single-family housing market decreased to $1.2 million median sold price with 19 homes sold and an increase in new listings at 40 units. The number of condos & townhomes decreased to $570k with 5 units sold and 26 new listings. Buyers have remained aggressive, with offer prices persisting to be around 100%. Due to only 6% of sales being finalized, the market is experiencing a supply shortage. Combined with surging demand, the cost of buying continues to increase, creating an imbalance between the pricing range and active options in the marketplace.
26
er2022
ber2022
Single Family Homes
The median sales price has decreased from $1 3m last November 2021 to $1 2m on November 2022
Condos & Townhomes
The median sales price has decreased from $710k last November 2021 to $570k on November 2022.
AVGDays OntheMarket
Single Family Homes
The average time on market is up from 11 days last November 2021, to 33 days by November 2022.
Condos & Townhomes
The average time on market is from 18 days last November 2021, to 39 days by November 2022
Overbids
Single Family Homes
The overbid percentage is down to 112.9% last November 2021 which decreased to 93.5% a year later.
Condos & Townhomes
The overbid percentage has gone down from 102 7% last November 2021 to 97.8% a year later.
Hayward
What's in the Hayward data?
Hayward’s single-family housing market decreased to $849k with 65 homes sold. There was an increase to 191 new listings. The number of condo and townhome sales increased to $700k with 26 units sold and 71 new listings. Buyers have remained aggressive, with offer prices persisting to be around 100%. Due to only 6% of sales being finalized, the market is experiencing a supply shortage. Combined with surging demand, the cost of buying continues to increase, creating an imbalance between the pricing range and active options in the marketplace.
The median sales price decreased from $900k in November 2021 to $849k in November 2022
Condos & Townhomes
The median sales price increased from $574k in November 2021 and $700k in November 2022.
AVGDays OntheMarket
Single Family Homes
The average days on market increased from 20 days last November 2021 to 36 days by November 2022.
Condos & Townhomes
The average days on market increased from 22 days in November 2021 to 29 days this year
Overbids
Single Family Homes
The overbid percentage decreased from 106.8% last November 2021 to 94.8% a year later.
Condos & Townhomes
The overbid percentage decreased from 104 2% last November 2021 to 96 2% a year later
Castro Valley
What's in the Castro Valley data?
Castro Valley’s single-family housing market decreased to $1.1 million with 23 homes sold and the number of new listings has increased to 72 new units. The number of condo & townhomes sales decreased to $796k with 3 units sold and 10 new listings. Buyers have remained aggressive, with offer prices persisting to be around 100%. Due to only 6% of sales being finalized, the market is experiencing a supply shortage. Combined with surging demand, the cost of buying continues to increase, creating an imbalance between the pricing range and active options in the marketplace.
The median sales price has decreased from $1 3m last November 2021 to $1 1m in November 2022
Condos & Townhomes
The median sales price has decreased from $854k last November 2021 to $796k in November 2022.
AVGDays OntheMarket
Single Family Homes
The average time on market is from 22 days last November 2021 up to 35 days by November 2022.
Condos & Townhomes
The average time on market is up from 11 days last November 2021, to 23 days in November 2022
Overbids
Single Family Homes
The overbid percentage has decreased from 110.6% last November 2021 to 95.3% a year later.
Condos & Townhomes
The overbid percentage has gone down from 103% last November 2021 to 92 8% a year later
San Leandro
What's in the San Leandro data?
San Leandro’s single-family housing market increased monthover-month to $886 thousand, with 25 homes sold, and the number of new listings has increased to 95 units. The number of condo & townhome sales decreased month-overmonth to $505 thousand, with 9 units sold and 32 new listings. Buyers have remained aggressive, with offer prices persisting to be around 100%. Due to only 6% of sales being finalized, the market is experiencing a supply shortage. Combined with surging demand, the cost of buying continues to increase, creating an imbalance between the pricing range and active options in the marketplace.
32
SanLeandro
Single Family Homes
The median sales price increased from $844k in November 2021 to $889k in November 2022
Condos & Townhomes
The median sales price decreased from $540k in November 2021 and $505k in November 2022.
AVGDays OntheMarket
Single Family Homes
The average days on market increased from 17 days last November 2021 to 33 days by November 2022
Condos & Townhomes
The average days on market increased from 13 days in November 2021 to 45 days this year
Overbids
Single Family Homes
The overbid percentage decreased from 109.7% last November 2021 to 102.2% a year later.
Condos & Townhomes
The overbid percentage decreased from 105 6% last November 2021 to 94 9% a year later
Tri-Cities
Fremont,Newark&UnionCity
What's in the Tri-Cities data?
Tri-Cities single-family housing market decreased to $1.3 million with 102 homes sold and the number of new listings increased to 248. The number of condo and townhome sales decreased to $699k with 35 units sold and 152 new listings. Buyers have remained aggressive, with offer prices persisting to be around 100%. Combined with surging demand, the cost of buying continues to increase, creating an imbalance between the pricing range and active options in the marketplace.
condominium sales in Milpitas, Pleasanton, San Ramon, from sources deemed rights reserved. Each
Single Family Homes
The median sales price decreased from $1.4m in November 2021 to $1.3m in November 2022.
Condos & Townhomes
The median sales price decreased from $797k in November 2021 and $699k in November 2022.
AVGDays OntheMarket
Single Family Homes
The average time on market increased from 18 days last November 2021, to 26 days by November 2022.
Condos & Townhomes
The average time on market increased from 20 days in November 2021 to 42 days this year
Overbids
Single Family Homes
The overbid percentage decreased from 111.4% last November 2021 to 94.9% a year later.
Condos & Townhomes
The overbid percentage decreased from 104 5% last November 2021 to 97 1% a year later
Pleasanton
What's in the Pleasanton data?
Pleasanton’s single-family housing market decreased to $1.6 million with 32 homes sold and the number of new listings increased to 74. The number of condo and townhome sales decreased to $825k with 11 units sold and 31 new listings. Buyers have remained aggressive, with offer prices persisting to be around 100%. Combined with surging demand, the cost of buying continues to increase, creating an imbalance between the pricing range and active options in the marketplace.
31
Single Family Homes
The median sales price decreased from $1 7m in November 2021 to $1 6m in November 2022
Condos & Townhomes
The median sales price decreased from $880k in November 2021 and $825k in November 2022
AVGDays OntheMarket
Single Family Homes
The average time on market increased from 10 days last November 2021 to 47 days by November 2022.
Condos & Townhomes
The average time on market increased from 29 days in November 2021 to 39 days this year
Overbids
Single Family Homes
The overbid percentage decreased from 109.3% last November 2021 to 87.7% a year later.
Condos & Townhomes
The overbid percentage decreased from 104 10% last November 2021 to 94 2% a year later
San Ramon
What's in the San Ramon data?
San Ramon’s single-family housing market decreased to $1.5 million, with 38 homes sold and an increase in new listings increased to 62. The number of condo and townhome sales increased month-over-month to $800k with 14 units sold and 45 new listings. Buyers have remained aggressive, with offer prices persisting to be around 100%. Combined with surging demand, the cost of buying continues to increase, creating an imbalance between the pricing range and active options in the marketplace.
The median sales price decreased from $1 6m in November 2021 to $1 5m in November 2022
Condos & Townhomes
The median sales price increased from $725k in November 2021 and $800 in November 2022.
AVGDays OntheMarket
Single Family Homes
The average time on market increased from 8 days last November 2021 to 36 days by November 2022.
Condos & Townhomes
The average time on market increased from 18 days in November 2021 to 44 days this year
Overbids
Single Family Homes
The overbid percentage decreased from 108.9% last November 2021 to 93.8% a year later.
Condos & Townhomes
The overbid percentage decreased from 102 2% last November 2021 to 95 8% a year later
Livermore
What's in the Livermore data?
Livermore’s single-family housing market decreased month-over-month to $1.1 million with 52 homes sold and the number of new listings increased to 154. The number of condo and townhome sales decreased to $700k with 5 units sold and 26 new listings. Buyers have remained aggressive, with offer prices persisting to be around 100%. Combined with surging demand, the cost of buying continues to increase, creating an imbalance between the pricing range and active options in the marketplace.
Msales in Milpitas, Pleasanton, San Ramon, sources deemed reserved. Each ket
Condo
& Townhomes
26
New Listings
5
Sold Listings
1.6
Months of Inventory
$700K
Median Sale Price 93.6%
Median Sale vs List
51
Avg Days on Market
Last 12 months, year over year
vember2022
November2022
Single Family Homes
The median sales price slightly decreased from $1 192m in November 2021 to $1 110m in November 2022
Condos & Townhomes
The median sales price decreased from $830k in November 2021 and $700k in November 2022.
AVGDays OntheMarket
Single Family Homes
The average time on market increased from 13 days last November 2021 to 27 days by November 2022.
Condos & Townhomes
The average timee on market increased from 15 days in November 2021 to 51 days this year
Overbids
Single Family Homes
The overbid percentage decreased from 105.4% last November 2021 to 95.4% a year later.
Condos & Townhomes
The overbid percentage decreased from 102.5% last November 2021 to 93.6% a year later.