Daniel Fridman - Unlocked December 2023 Market Report | Peninsula Estates
Peninsula Estates
San Francisco County
Jump to San Francisco County Report
San Mateo County
Jump to San Mateo County Report
Belmont
Jump to Belmont Report
Jump to Burlingame Report Burlingame
Jump to Daly City Report Daly City
Foster City
Jump to Foster City Report
Half Moon Bay
Jump to Half Moon Bay Report
Hillsborough
Jump to Hillsborough Report
Jump to Millbrae Report
Jump to Pacifica Report
San Bruno
Jump to San Bruno Report
San Carlos
Jump to San Carlos Report
San Mateo
Jump to San Mateo Report
South San Francisco
Jump to South San Francisco Report
What’syourhome reallyworthin today’smarket?
That's the question you should be asking yourself.
Our market is incredibly diverse and rapidly changing. Values vary not just by neighborhood but by street. Your home isn't necessarily worth what your neighbors' home is. It's the current market that sets the value of your home.
So, do you know what your home is worth in today's market?
Icanhelp...
Contact me for a confidential, no obligation assessment of your home's value.
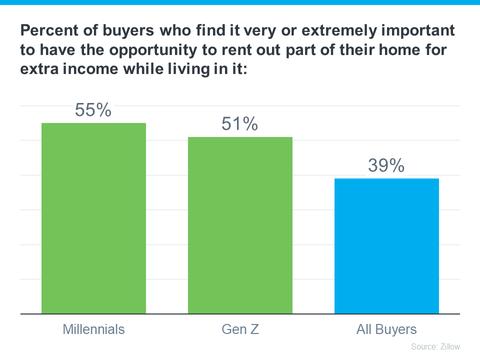
HowtoturnHomeownership intoaSideHustle
Does the rising cost of just about everything these days make your dream of owning your own home feel less within reach? According to Bankrate, many people are seeking additional income through side hustles, possibly to cope with those increasing expenses and save for a home. This trend is particularly popular with younger individuals who may be dealing with student loan debt (see graph below):
Here are two strategies that can not only make homeownership more affordable in the short term, but turn it into a lucrative side hustle that can pay off down the road.
HOW TO BUDGET FOR UNEXPECTED
Unlock homeownership confidently! Prepare for hidden costs like inspections and renovations. Take control with a strategic plan:
Save for Unexpected Costs
1
Ensure a worry-free home with a proactive maintenance plan! Allocate 1-2% of your home's value yearly for repairs, creating a financial safety net. Even $20 a week adds up, offering peace of mind for unexpected expenses. Safeguard your home and finances with a well-crafted budget.
2
3
Keep your appliances and systems in good shape.
Elevate your homeownership with proactive care! Craft a seasonal to-do list, from flushing your water heater to changing filters and cleaning gutters. Enjoy smooth operation, reduce repair frequency, and discover the joy of a well-maintained home.
Consider getting a home warranty
Secure your home's future with American Home Shield® Our budget-friendly plans handle repairs and replacements, giving you peace of mind in homeownership.
Contact me, your Real Estate Expert, for support and to learn more about AHS.
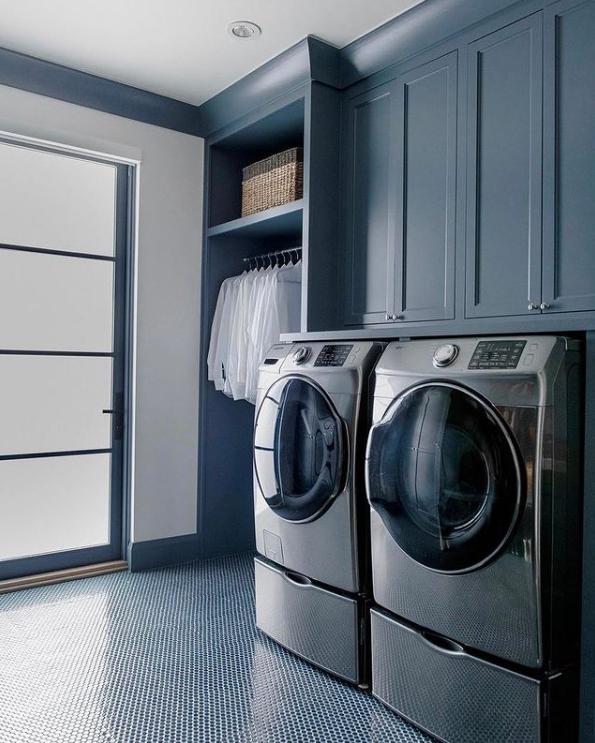
Looking to lighten the mood in your laundry room?
EIGHTEYECATCHING
Laundry Room Colors
To Look Out For
These refreshing colors make the wash-and-dry chore a little more pleasant.
Tranquil Blue
View it here
Eight Colrs fo Laundry
Sage Green
View it here
White
View it here
Yellow
View it here
Gray
View it here
Dusty Pink
View it here
View it here
Navy Blue Purple
View it here
Create a tranquil laundry space with Benjamin Moore's Beach Glass Its light blue shade, coupled with a subtle gray undertone, offers a clean and versatile aesthetic that avoids any baby nursery associations.
Transform your space with earthy tones like October Mist and Gloucester Sage from Benjamin Moore Test out the trendy sage in your laundry room for a lowcommitment update easy to change and customize, ensuring lasting satisfaction with your design choice.
Create an elegant laundry room with Chantilly Lace by Benjamin Moore The classic white choice adds sophistication, opens up the space, and simplifies stain detection
Elevate your laundry space with the energizing touch of yellow. Behr's Roasted Corn or Upbeat bring warmth and optimism, while Pearly White offers a mellow option a yellow-based white that brings a perfect harmony of vibrancy and calmness.
Gray remains a top choice for laundry room walls, providing a timeless and serene backdrop A soft gray for a whisper of sophistication, easily personalized with printed patterned tile flooring or Behr's bold 2024 Color of the Year, Cracked Pepper
Sherwin-Williams' Rosebud for a touch of romance in laundry rooms. The dusty pink hue, paired with gold accents, adds a luxurious and warm atmosphere.
Navy as the key to a striking laundry room Beyond lighter blues, navy paired with lighter accents or white fixtures, especially Benjamin Moore's Hale Navy, creates a bold choice that makes the laundry room stand out.
Dare to take a style risk in your laundry room with a pop of color. Opt for the subtle smoky lavender of Farrow & Ball's Peignoir for a neutral touch or go all-out glam with Backdrop's dark and vampy McQueen, drawing inspiration from the famous fashion designer.
There were 305 single-family homes for sale, providing 1.6 months of inventory. There were 102 new listings, and 189 homes sold at a median price of $1.5m. The median overbid percentage was at 106%, with an average of 30 days on the market.
There were 657 condo and townhome units for sale, providing 5.1 months of inventory. There were 116 new listings and 129 units sold at a median sale price of $1.1m. The median overbid percentage was at 100.1%, with an average of 55 days on the market.
SFH
Single-Family Homes
102 New Listings
189 Sold Listings
1.6 Months of Inventory
$1.5M Median Sale Price
106%
Median Sale vs List
30 Avg Days on Market
The data, sourced from MLS Listings Inc, includes all single-family homes, condos and townhomes in the California Area from November 2022 to November 2023. This may include preliminary data, and may vary from the time the data was gathered. All data is deemed reliable but not guaranteed. DRE# 01906450. Copyright KW Advisors Peninsula Estates | Burlingame | San Mateo 2023. Each office is independently owned and operated.
116
New Listings
129
Sold Listings
5.1
Months of Inventory
100.1%
Median Sale vs List
$1.1M
Median Sale Price
55
Avg Days on Market
SanFranciscoCounty
NOVEMBER 2022 - NOVEMBER 2023
Single-Family Homes
Last 12 months, year-over-year.
Condos & Townhomes
Last 12 months, year-over-year
Median SalesPrice
Single-Family Homes
The median sales price has increased from $1 5m last November 2022, to $1 54m as of November 2023
Condos & Townhomes
The median sales price has decreased from $1 15m last November 2022, to $1 12m as of November 2023
AVGDays OntheMarket
Single-Family Homes
The average time spent on the market went down from 34 days last November 2022, to 30 days as of November 2023
Condos & Townhomes
The average time spent on the market went up from 49 days in November 2022, to 55 days as of November 2023.
Overbids
Single-Family Homes
The overbid percentage has increased from 104 9% last November 2022, to 106% a year later
Condos & Townhomes
The overbid percentage has increased from 99.4% last November 2022, to 100.1% a year later.
SanMateo County
What's in the San Mateo Cou data?
There were 459 single-family homes for sale providing 1.6 months of inventory. There we new listings, and 282 homes sold at a media price of $1.7m. The median overbid percenta was at 102 8%, with an average of 25 days o market.
There were 205 condo and townhome units sale, providing 3 months of inventory. There 81 new listings and 68 units sold at a median price of $925k. The median overbid percenta was at 98.9%, with an average of 44 days on market
SFH
Single-Family Homes
239 New Listings
1.6 Months of Inventory
282 Sold Listings
$1.7M
Median Sale Price
102.8%
Median Sale vs List
25 Avg Days on Market
urced from MLS Listings Inc, includes all single-family homes, condos and the California Area from November 2022 to November 2023. This may minary data, and may vary from the time the data was gathered. All data is ble but not guaranteed. DRE# 01906450. Copyright KW Advisors Peninsula Burlingame | San Mateo 2023. Each office is independently owned and
Listings 3 Months of Inventory
Listings
NOVEMBER 2022 - NOVEMBER 2023
Single-Family Homes
Last 12 months, year-over-year.
Condos & Townhomes
Last 12 months, year-over-year
Median SalesPrice
Single-Family Homes
The median sales price has increased from $1 7m last November 2022, to $1 72m as of November 2023
Condos & Townhomes
The median sales price has increased from $889k last November 2022, to $925k as of November 2023
AVGDays OntheMarket
Single-Family Homes
The average time spent on the market went down from 27 days last November 2022, to 25 days as of November 2023
Condos & Townhomes
The average time spent on the market went down from 46 days in November 2022, to 44 days as of November 2023.
Overbids
Single-Family Homes
The overbid percentage has increased from 98 6% last November 2022, to 102 8% a year later
Condos & Townhomes
The overbid percentage has increased from 97.5% last November 2022, to 98.9% a year later.
Belm
What's in the
There were 9 singleproviding 0.5 month new listings, and 17 of $1.9m. The media 107.3%, with an aver
There were 4 condo providing 0 months new listings and 0 u price of $0. The med at 0%, with an avera
Single-Family Homes
7 New Listings
17 Sold Listings
0.5 Months of Inventory
$1.9M Median Sale Price
107.3%
Median Sale vs List
11 Avg Days on Market
all single-family homes, condos and 2022 to November 2023. This may time the data was gathered. All data is 01906450. Copyright KW Advisors Peninsula office is independently owned and
Condo & Townhomes
3
New Listings
0
Sold Listings
Months of Inventory $0
Median Sale Price 0%
Median Sale vs List 0 Avg Days on Market 0
Single-Family Homes
Last 12 months, year-over-year.
Condos & Townhomes
Last 12 months, year-over-year
Median SalesPrice
Single-Family Homes
The median sales price has increased from $1 7m last November 2022, to $1 9m as of November 2023
Condos & Townhomes
The median sales price has decreased from $760k last November 2022, to $0 as of November 2023
AVGDays OntheMarket
Single-Family Homes
The average time spent on the market went down from 38 days last November 2022, to 11 days as of November 2023
Condos & Townhomes
The average time spent on the market went down from 48 days in November 2022, to 0 days as of November 2023.
Overbids
Single-Family Homes
The overbid percentage has increased from 100 4% last November 2022, to 107 3% a year later
Condos & Townhomes
The overbid percentage has decreased from 95.1% last November 2022, to 0% a year later.
Burli
What's in the
There were 20 single providing 1.1 months new listings, and 18 h of $2.6m. The media 99.7%, with an averag
There were 4 condo a providing 2 months o new listings and 2 un price of $1m. The me at 96.6%, with an ave market.
Single-Family Homes
11 New Listings
18 Sold Listings
1.1 Months of Inventory
$2.6M Median Sale Price
99.7%
Median Sale vs List
27 Avg Days on Market
single-family homes, condos and 2022 to November 2023. This may the data was gathered. All data is Copyright KW Advisors Peninsula office is independently owned and
2 New Listings
& Townhomes
2 Sold Listings
2 Months of Inventory $1M Median Sale Price 96.6%
Median Sale vs List 42 Avg Days on Market
Burlingame
NOVEMBER 2022 - NOVEMBER 2023
Single-Family Homes
Last 12 months, year-over-year.
Condos & Townhomes
Last 12 months, year-over-year
Median SalesPrice
Single-Family Homes
The median sales price has increased from $2 6m last November 2022, to $2 65m as of November 2023
Condos & Townhomes
The median sales price has decreased from $1 2m last November 2022, to $1m as of November 2023
AVGDays OntheMarket
Single-Family Homes
The average time spent on the market went down from 30 days last November 2022, to 27 days as of November 2023
Condos & Townhomes
The average time spent on the market went up from 39 days in November 2022, to 42 days as of November 2023.
Overbids
Single-Family Homes
The overbid percentage has increased from 98 2% last November 2022, to 99 7% a year later
Condos & Townhomes
The overbid percentage has increased from 95.5% last November 2022, to 96.6% a year later.
Single-Family Homes
29 New Listings
25 Sold Listings
1.4 Months of Inventory
$1.1M Median Sale Price
107.1%
Median Sale vs List
24 Avg Days on Market
ta, sourced from MLS Listings Inc, includes all single-family homes, condos and townhomes in the California Area from November 2022 to November 2023. This may preliminary data, and may vary from the time the data was gathered. All data is reliable but not guaranteed. DRE# 01906450. Copyright KW Advisors Peninsula | Burlingame | San Mateo 2023. Each office is independently owned and
7
New Listings
4 Sold Listings
4.3
Months of Inventory
$778K
Median Sale Price 94.1%
Median Sale vs List 56 Avg Days on Market
Median SalesPrice
Single-Family Homes
The median sales price has decreased from $1 18m last November 2022, to $1 13m as of November 2023
Condos & Townhomes
The median sales price has increased from $628k last November 2022, to $778k as of November 2023
AVGDays OntheMarket
Single-Family Homes
The average time spent on the market went down from 30 days last November 2022, to 24 days as of November 2023
Condos & Townhomes
The average time spent on the market went up from 49 days in November 2022, to 56 days as of November 2023.
Overbids
Single-Family Homes
The overbid percentage has increased from 98 5% last November 2022, to 107 1% a year later
Condos & Townhomes
The overbid percentage has decreased from 101.4% last November 2022, to 94.1% a year later.
FosterCity
What's in the Foster City data?
There were 4 single-family homes for sale, providing 0.5 months of inventory. There were 5 new listings, and 8 homes sold at a median price of $2.3M. The median overbid percentage was at 101.2%, with an average of 32 days on the market.
There were 21 condo and townhome units for sale, providing 2.1 months of inventory. There were 9 new listings and 10 units sold at a median sale price of $1.1m. The median overbid percentage was at 101.5%, with an average of 18 days on the market.
SFH
Single-Family Homes
5 New Listings
8 Sold Listings
0.5 Months of Inventory
$2.3M Median Sale Price
101.2%
Median Sale vs List
32 Avg Days on Market
The data, sourced from MLS Listings Inc, includes all single-family homes, condos and townhomes in the California Area from November 2022 to November 2023. This may include preliminary data, and may vary from the time the data was gathered. All data is deemed reliable but not guaranteed. DRE# 01906450. Copyright KW Advisors Peninsula Estates | Burlingame | San Mateo 2023. Each office is independently owned and operated.
9
New Listings
10
Sold Listings
2.1
Months of Inventory
$1.1M
Median Sale Price
101.5%
Median Sale vs List
18 Avg Days on Market
NOVEMBER 2022 - NOVEMBER 2023
Single-Family Homes
Last 12 months, year-over-year.
Condos & Townhomes
Last 12 months, year-over-year
Median SalesPrice
Single-Family Homes
The median sales price has increased from $1 9m last November 2022, to $2 3m as of November 2023
Condos & Townhomes
The median sales price has decreased from $1 4m last November 2022, to $1 1m as of November 2023
AVGDays OntheMarket
Single-Family Homes
The average time spent on the market went down from 39 days last November 2022, to 32 days as of November 2023
Condos & Townhomes
The average time spent on the market went down from 52 days in November 2022, to 18 days as of November 2023.
Overbids
Single-Family Homes
The overbid percentage has increased from 93 8% last November 2022, to 101 2% a year later
Condos & Townhomes
The overbid percentage has increased from 97.3% last November 2022, to 101.5% a year later.
HalfMoon Bay
What's in the Half Moon Bay data?
There were 26 single-family homes for sale, providing 4.3 months of inventory. There were 10 new listings, and 6 homes sold at a median price of $1.5m. The median overbid percentage was at 100 8%, with an average of 31 days on the market
There were 2 condo and townhome units for sale, providing 1 month of inventory. There was 1 new listing and 2 units sold at a median sale price of $1m. The median overbid percentage was at 97.3%, with an average of 13 days on the market.
SFH
Single-Family Homes
10 New Listings
6 Sold Listings
4.3 Months of Inventory
$1.5M Median Sale Price
100.8%
Median Sale vs List
31 Avg Days on Market
The data, sourced from MLS Listings Inc, includes all single-family homes, condos and townhomes in the California Area from November 2022 to November 2023. This may include preliminary data, and may vary from the time the data was gathered. All data is deemed reliable but not guaranteed. DRE# 01906450. Copyright KW Advisors Peninsula Estates | Burlingame | San Mateo 2023. Each office is independently owned and operated.
Condo & Townhomes
1 New Listing
2 Sold Listings
1 Month of Inventory $1M Median Sale Price 97.3%
Median Sale vs List 13 Avg Days on Market
HalfMoonBay
NOVEMBER 2022 - NOVEMBER 2023
Single-Family Homes
Last 12 months, year-over-year.
Condos & Townhomes
Last 12 months, year-over-year
Median SalesPrice
Single-Family Homes
The median sales price has decreased from $1 7m last November 2022, to $1 5m as of November 2023
Condos & Townhomes
The median sales price has increased from $922k last November 2022, to $1m as of November 2023
AVGDays OntheMarket
Single-Family Homes
The average time spent on the market went up from 29 days last November 2022, to 31 days as of November 2023
Condos & Townhomes
The average time spent on the market went down from 15 days in November 2022, to 13 days as of November 2023.
Overbids
Single-Family Homes
The overbid percentage has increased from 100 1% last November 2022, to 100 8% a year later
Condos & Townhomes
The overbid percentage has decreased from 101.5% last November 2022, to 97.3% a year later.
Hillsborough
What's in the Hillsborough data?
There were 30 single-family homes for sale, providing 5 months of inventory There were 4 new listings, and 6 homes sold at a median price of $5.1m. The median overbid percentage was at 99.1%, with an average of 52 days on the market.
There was no data for condo and townhouse units this month.
SFH
Single-Family Homes
4 New Listings
6 Sold Listings
5 Months of Inventory
$5.1M Median Sale Price
99.1% Median Sale vs List
52 Avg Days on Market
The data, sourced from MLS Listings Inc, includes all single-family homes, condos and townhomes in the California Area from November 2022 to November 2023. This may include preliminary data, and may vary from the time the data was gathered. All data is deemed reliable but not guaranteed. DRE# 01906450. Copyright KW Advisors Peninsula Estates | Burlingame | San Mateo 2023. Each office is independently owned and operated.
CONDO
Condo & Townhomes
No data for this month.
Hillsborough
NOVEMBER 2022 - NOVEMBER 2023
LISTINGS FOR SALE SOLD LISTINGS
Single-Family Homes
Last 12 months, year-over-year.
Condos & Townhomes
Nodatatodispla�
Last 12 months, year-over-year
Median SalesPrice
Single-Family Homes
The median sales price has decreased from $7 2m last November 2022, to $5 1m as of November 2023
Condos & Townhomes
No data for this month
AVGDays OntheMarket
Single-Family Homes
The average time spent on the market went up from 49 days last November 2022, to 52 days as of November 2023
Condos & Townhomes
No data for this month
Overbids
Single-Family Homes
The overbid percentage has increased from 94 3% last November 2022, to 99 1% a year later
Condos & Townhomes
No data for this month
Millb
What's in the
There were 6 single-fa providing 0.6 months new listings, and 10 h of $1.7m. The median 105.6%, with an avera
There were 4 condo a providing 4 months of new listings and 1 uni of $765k. The median 100.8%, with an avera
Single-Family Homes
3 New Listings
10 Sold Listings
0.6 Months of Inventory
$1.7M Median Sale Price
105.6% Median Sale vs List
24 Avg Days on Market
single-family homes, condos and 2022 to November 2023. This may the data was gathered. All data is Copyright KW Advisors Peninsula office is independently owned and
Listing
NOVEMBER 2022 - NOVEMBER 2023
Single-Family Homes
Last 12 months, year-over-year.
Condos & Townhomes
Last 12 months, year-over-year
Median SalesPrice
Single-Family Homes
The median sales price has decreased from $2m last November 2022, to $1 7m as of November 2023
Condos & Townhomes
The median sales price has decreased from $1 1m last November 2022, to $765k as of November 2023
AVGDays OntheMarket
Single-Family Homes
The average time spent on the market went up from 20 days last November 2022, to 24 days as of November 2023
Condos & Townhomes
The average time spent on the market went down from 80 days in November 2022, to 5 days as of November 2023.
Overbids
Single-Family Homes
The overbid percentage has increased from 101 9% last November 2022, to 105 6% a year later
Condos & Townhomes
The overbid percentage has increased from 96.4% last November 2022, to 100.8% a year later.
Pacifi
What's in the
There were 28 singleproviding 1.9 months new listings, and 15 h of $1.2m. The median 104.3%, with an avera
There were 14 condo sale, providing 7 mont 4 new listings and 2 u price of $725k. The m was at 100.3%, with a market.
Single-Family Homes
18 New Listings
15 Sold Listings
1.9 Months of Inventory
$1.2M Median Sale Price
104.3% Median Sale vs List
24 Avg Days on Market
single-family homes, condos and 2022 to November 2023. This may the data was gathered. All data is Copyright KW Advisors Peninsula office is independently owned and
& Townhomes 4 New Listings 7 Months of Inventory
Median Sale Price 100.3% Median Sale vs List 15 Avg Days on Market 2 Sold Listings
NOVEMBER 2022 - NOVEMBER 2023
Single-Family Homes
Last 12 months, year-over-year.
Condos & Townhomes
Last 12 months, year-over-year
Median SalesPrice
Single-Family Homes
The median sales price has increased from $1 2m last November 2022, to $1 26m as of November 2023
Condos & Townhomes
The median sales price has decreased from $750k last November 2022, to $725k as of November 2023
AVGDays OntheMarket
Single-Family Homes
The average time spent on the market went down from 30 days last November 2022, to 24 days as of November 2023
Condos & Townhomes
The average time spent on the market went down from 56 days in November 2022, to 15 days as of November 2023.
Overbids
Single-Family Homes
The overbid percentage has increased from 97 7% last November 2022, to 104 3% a year later
Condos & Townhomes
The overbid percentage has increased from 93.9% last November 2022, to 100.3% a year later.
SanB
What's in the
There were 11 singleproviding 0.8 months new listings, and 14 h of $1.3m. The median 102.8%, with an avera
There were 15 condo sale, providing 2.5 mo were 5 new listings an sale price of $513k. T percentage was at 99 days on the market.
Single-Family Homes
12 New Listings
14 Sold Listings
0.8 Months of Inventory
$1.3M Median Sale Price
102.8% Median Sale vs List
22 Avg Days on Market
single-family homes, condos and 2022 to November 2023. This may the data was gathered. All data is Copyright KW Advisors Peninsula office is independently owned and
5
New Listings
6 Sold Listings
2.5
Months of Inventory
$513K
Median Sale Price 99.7%
Median Sale vs List
30 Avg Days on Market
Condos & Townhomes
Last 12 months, year-over-year
Median SalesPrice
Single-Family Homes
The median sales price has decreased from $1 4m last November 2022, to $1 3m as of November 2023
Condos & Townhomes
The median sales price has increased from $422k last November 2022, to $513k as of November 2023
AVGDays OntheMarket
Single-Family Homes
The average time spent on the market went down from 24 days last November 2022, to 22 days as of November 2023
Condos & Townhomes
The average time spent on the market went down from 37 days in November 2022, to 30 days as of November 2023.
Overbids
Single-Family Homes
The overbid percentage has increased from 99 5% last November 2022, to 102 8% a year later
Condos & Townhomes
The overbid percentage has increased from 94.7% last November 2022, to 99.7% a year later.
Sa
What's
There we providing new listin of $2m. T 100.2%, w
There we sale, prov 3 new list price of $ was at 10 market.
Single-Family Homes
20 New Listings
1.5 Months of Inventory
100.2% Median Sale vs List
17 Sold Listings
$2M Median Sale Price
23 Avg Days on Market
condos and 2023. This may gathered. All data is Advisors Peninsula owned and
3
New Listings
1
Sold Listing
10
Months of Inventory
$1.6M
Median Sale Price
100.3%
Median Sale vs List
7 Avg Days on Market
SanCarlos
NOVEMBER 2022 - NOVEMBER 2023
Single-Family Homes
Last 12 months, year-over-year.
Condos & Townhomes
Last 12 months, year-over-year
Median SalesPrice
Single-Family Homes
The median sales price has decreased from $2 3m last November 2022, to $2m as of November 2023
Condos & Townhomes
The median sales price has increased from $965k last November 2022, to $1 6m as of November 2023
AVGDays OntheMarket
Single-Family Homes
The average time spent on the market went up from 20 days last November 2022, to 23 days as of November 2023
Condos & Townhomes
The average time spent on the market went down from 24 days in November 2022, to 7 days as of November 2023.
Overbids
Single-Family Homes
The overbid percentage has increased from 98 5% last November 2022, to 100 2% a year later
Condos & Townhomes
The overbid percentage has increased from 99.1% last November 2022, to 100.3% a year later.
SanMateo
What's in the San Mateo data?
There were 41 single-family homes for sale, providing 1.2 months of inventory. There were 27 new listings, and 34 homes sold at a median price of $1.6m. The median overbid percentage was at 101.9%, with an average of 20 days on the market.
There were 53 condo and townhome units for sale, providing 2.9 months of inventory. There were 19 new listings and 18 units sold at a median sale price of $981k. The median overbid percentage was at 98.4%, with an average of 63 days on the market.
SFH
Single-Family Homes
27 New Listings
34 Sold Listings
1.2 Months of Inventory
$1.6M Median Sale Price
101.9%
Median Sale vs List
20 Avg Days on Market
The data, sourced from MLS Listings Inc, includes all single-family homes, condos and townhomes in the California Area from November 2022 to November 2023. This may include preliminary data, and may vary from the time the data was gathered. All data is deemed reliable but not guaranteed. DRE# 01906450. Copyright KW Advisors Peninsula Estates | Burlingame | San Mateo 2023. Each office is independently owned and operated.
19
New Listings
18
Sold Listings
2.9
Months of Inventory
98.4%
Median Sale vs List
$981K
Median Sale Price
63
Avg Days on Market
SanMateo
NOVEMBER 2022 - NOVEMBER 2023
Single-Family Homes
Last 12 months, year-over-year.
Condos & Townhomes
Last 12 months, year-over-year
Median SalesPrice
Single-Family Homes
The median sales price has decreased from $1 68m last November 2022, to $1 66m as of November 2023
Condos & Townhomes
The median sales price has increased from $975k last November 2022, to $981k as of November 2023
AVGDays OntheMarket
Single-Family Homes
The average time spent on the market went up from 18 days last November 2022, to 20 days as of November 2023
Condos & Townhomes
The average time spent on the market went up from 51 days in November 2022, to 63 days as of November 2023.
Overbids
Single-Family Homes
The overbid percentage has increased from 100 1% last November 2022, to 101 9% a year later
Condos & Townhomes
The overbid percentage has increased from 96.1% last November 2022, to 98.4% a year later.
SouthSan Francisco
What's in the South San Francisco data?
There were 10 single-family homes for sale, providing 0.6 months of inventory. There were 10 new listings, and 18 homes sold at a median pric of $1.1m. The median overbid percentage was at 104 7%, with an average of 18 days on the marke
There were 19 condo and townhome units for sale, providing 3.2 months of inventory. There were 8 new listings and 6 units sold at a median sale price of $757k. The median overbid percentage was at 100.3%, with an average of 29 days on the market.
Single-Family Homes
10 New Listings
18 Sold Listings
0.6 Months of Inventory
$1.1M Median Sale Price
104.7%
Median Sale vs List
18 Avg Days on Market
8
New Listings
6 Sold Listings
3.2
Months of Inventory
$757K
Median Sale Price
100.3%
Median Sale vs List
29 Avg Days on Market
Condos & Townhomes Last 12 months, year-over-year
Median SalesPrice
Single-Family Homes
The median sales price has decreased from $1 17m last November 2022, to $1 15m as of November 2023
Condos & Townhomes
The median sales price has increased from $702k last November 2022, to $757k as of November 2023
AVGDays OntheMarket
Single-Family Homes
The average time spent on the market went up from 17 days last November 2022, to 18 days as of November 2023
Condos & Townhomes
The average time spent on the market went down from 63 days in November 2022, to 29 days as of November 2023.
Overbids
Single-Family Homes
The overbid percentage has increased from 98 5% last November 2022, to 104 7% a year later
Condos & Townhomes
The overbid percentage has increased from 98.3% last November 2022, to 100.3% a year later.