Celeste Johnson - December 2023 Market Report | Palo Alto Area
Palo Alto area
Palo Alto Los Altos
Jump to Palo Alto Report
Redwood City
Jump to Redwood City Report
Portola Valley
Jump to Portola Valley Report
Menlo Park
Jump to Menlo Report
Atherton
Jump to Atherton Report
Jump to Los Altos Report
San Jose
Jump to San Jose Report
Mountain View
Jump to Mountain View
San Mateo County
Jump to San Mateo County
Santa Clara County
Jump to Santa Clara County
Monterey County
Jump to Monterey County Report
Santa Cruz County
Jump to Santa Cruz County Report
East Palo Alto
Jump to East Palo Alto Report
Sunnyvale
Jump to Sunnyvale Report
Santa Clara City
Jump to Santa Clara City Report
Saratoga
Jump to Saratoga Report
What’syourhome reallyworthin today’smarket?
That's the question you should be asking yourself.
Our market is incredibly diverse and rapidly changing. Values vary not just by neighborhood but by street. Your home isn't necessarily worth what your neighbors' home is. It's the current market that sets the value of your home.
So, do you know what your home is worth in today's market?
Icanhelp...
Contact me for a confidential, no obligation assessment of your home's value.
HowtoturnHomeownership intoaSideHustle
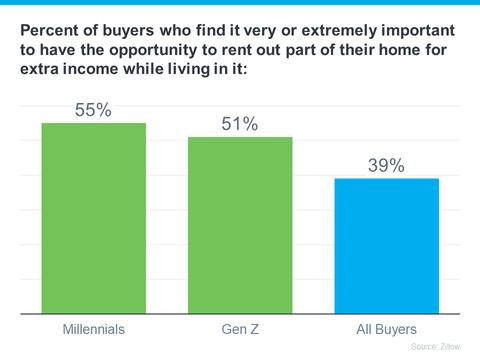
Does the rising cost of just about everything these days make your dream of owning your own home feel less within reach? According to Bankrate, many people are seeking additional income through side hustles, possibly to cope with those increasing expenses and save for a home. This trend is particularly popular with younger individuals who may be dealing with student loan debt (see graph below):
Here are two strategies that can not only make homeownership more affordable in the short term, but turn it into a lucrative side hustle that can pay off down the road.
HOW TO BUDGET FOR UNEXPECTED
Unlock homeownership confidently! Prepare for hidden costs like inspections and renovations. Take control with a strategic plan:
Save for Unexpected Costs
1
Ensure a worry-free home with a proactive maintenance plan! Allocate 1-2% of your home's value yearly for repairs, creating a financial safety net. Even $20 a week adds up, offering peace of mind for unexpected expenses. Safeguard your home and finances with a well-crafted budget.
2
3
Keep your appliances and systems in good shape.
Elevate your homeownership with proactive care! Craft a seasonal to-do list, from flushing your water heater to changing filters and cleaning gutters. Enjoy smooth operation, reduce repair frequency, and discover the joy of a well-maintained home.
Consider getting a home warranty
Secure your home's future with American Home Shield® Our budget-friendly plans handle repairs and replacements, giving you peace of mind in homeownership.
Contact me, your Real Estate Expert, for support and to learn more about AHS.
Looking to lighten the mood in your laundry room?
EIGHTEYECATCHING
Laundry Room Colors
To Look Out For
These refreshing colors make the wash-and-dry chore a little more pleasant.
Tranquil Blue
View it here
Eight Colrs fo Laundry
Sage Green
View it here
White
View it here
Yellow
View it here
Gray
View it here
Dusty Pink
View it here
View it here
Navy Blue Purple
View it here
Create a tranquil laundry space with Benjamin Moore's Beach Glass Its light blue shade, coupled with a subtle gray undertone, offers a clean and versatile aesthetic that avoids any baby nursery associations.
Transform your space with earthy tones like October Mist and Gloucester Sage from Benjamin Moore Test out the trendy sage in your laundry room for a lowcommitment update easy to change and customize, ensuring lasting satisfaction with your design choice.
Create an elegant laundry room with Chantilly Lace by Benjamin Moore The classic white choice adds sophistication, opens up the space, and simplifies stain detection
Elevate your laundry space with the energizing touch of yellow. Behr's Roasted Corn or Upbeat bring warmth and optimism, while Pearly White offers a mellow option a yellow-based white that brings a perfect harmony of vibrancy and calmness.
Gray remains a top choice for laundry room walls, providing a timeless and serene backdrop A soft gray for a whisper of sophistication, easily personalized with printed patterned tile flooring or Behr's bold 2024 Color of the Year, Cracked Pepper
Sherwin-Williams' Rosebud for a touch of romance in laundry rooms. The dusty pink hue, paired with gold accents, adds a luxurious and warm atmosphere.
Navy as the key to a striking laundry room Beyond lighter blues, navy paired with lighter accents or white fixtures, especially Benjamin Moore's Hale Navy, creates a bold choice that makes the laundry room stand out.
Dare to take a style risk in your laundry room with a pop of color. Opt for the subtle smoky lavender of Farrow & Ball's Peignoir for a neutral touch or go all-out glam with Backdrop's dark and vampy McQueen, drawing inspiration from the famous fashion designer.
There were 65 single-family homes for sale, providing 1.8 months of inventory. There were 17 new listings, and 19 homes sold at a median price of $2.9m. The median overbid percentage was at 99.8%, with an average of 33 days on the market.
There were 18 condo and townhome units for sale, providing 2.2 months of inventory. There were 5 new listings and 6 units sold at a median sale price of $1.6m. The median overbid percentage was at 101.8%, with an average of 36 days on the market.
SFH
Single-Family Homes
17 New Listings
19 Sold Listings
1.8 Months of Inventory
$2.9M Median Sale Price
99.8% Median Sale vs List
33 Avg Days on Market
The data, sourced from InfoSparks and Broker Metrics, includes all single-family homes, condos and townhomes in the California Area above from November 2022 to November 2023. This may include preliminary data, and may vary from the time the data was gathered. All data is deemed reliable but not guaranteed. DRE# 01511642. Copyright KW Advisors Palo Alto 2023. Each office is independently owned and operated.
Condo & Townhomes
5
New Listings
6
Sold Listings
2.2
Months of Inventory
$1.6M
Median Sale Price
101.8%
Median Sale vs List
36 Avg Days on Market
PaloAlto
NOVEMBER 2022 - NOVEMBER 2023
Single-Family Homes
Last 12 months, year-over-year
Condos & Townhomes
Last 12 months, year-over-year
Median SalesPrice
Single-Family Homes
The median sales price has decreased from $3 3m last November 2022, to $2 9m as of November 2023
Condos & Townhomes
The median sales price has increased from $1m last November 2022, to $1 6m as of November 2023
AVGDays OntheMarket
Single-Family Homes
The average time spent on the market went up from 31 days last November 2022, to 33 days as of November 2023
Condos & Townhomes
The average time spent on the market went up from 33 days in November 2022, to 36 days as of November 2023.
Overbids
Single-Family Homes
The overbid percentage has increased from 99 4% last November 2022, to 99 8% a year later
Condos & Townhomes
The overbid percentage has increased from 91.1% last November 2022, to 101.8% a year later.
Redwood City
What's in the Redwood City data?
There were 84 single-family homes for sale, providing 1 month of inventory. There were 30 new listings, and 31 homes sold at a median price of $2.1m. The median overbid percentage was at 99%, with an average of 35 days on the market
There were 18 condo and townhome units for sale, providing 2.4 months of inventory. There were 8 new listings and 6 units sold at a median sale price of $1.1m. The median overbid percentage was at 98%, with an average of 35 days on the market.
Single-Family Homes
30 New Listings
1 Month of Inventory
31 Sold Listings
$2.1M Median Sale Price
99% Median Sale vs List
35 Avg Days on Market
The data, sourced from InfoSparks and Broker Metrics, includes all single-family homes, condos and townhomes in the California Area above from November 2022 to November 2023. This may include preliminary data, and may vary from the time the data was gathered. All data is deemed reliable but not guaranteed. DRE# 01511642. Copyright KW Advisors Palo Alto 2023. Each office is independently owned and operated.
Condo & Townhomes
8
New Listings
6 Sold Listings
2.4
Months of Inventory
$1.1M
Median Sale Price 98%
Median Sale vs List 35 Avg Days on Market
RedwoodCity
NOVEMBER 2022 - NOVEMBER 2023
Single-Family Homes
Last 12 months, year-over-year.
Condos & Townhomes
Last 12 months, year-over-year
Median SalesPrice
Single-Family Homes
The median sales price has increased from $1 8m last November 2022, to $2 1m as of November 2023
Condos & Townhomes
The median sales price has increased from $1m last November 2022, to $1 1m as of November 2023
AVGDays OntheMarket
Single-Family Homes
The average time spent on the market went up from 32 days last November 2022, to 35 days as of November 2023
Condos & Townhomes
The average time spent on the market went up from 20 days in November 2022, to 35 days as of November 2023.
Overbids
Single-Family Homes
The overbid percentage has increased from 95 8% last November 2022, to 99% a year later
Condos & Townhomes
The overbid percentage has increased from 96.8% last November 2022, to 98% a year later.
Portola Valley
What's in the Portola Valley data?
There were 20 single-family homes for sale, providing 2.3 months of inventory. There were 6 new listings, and 6 homes sold at a median price of $3.8m. The median overbid percentage was at 92 1%, with an average of 49 days on the market
There was no data for condo and townhouse units this month.
SFH
Single-Family Homes
6 New Listings
6 Sold Listings
2.3 Months of Inventory
$3.8 Median Sale Price
92.1% Median Sale vs List
49 Avg Days on Market
The data, sourced from InfoSparks and Broker Metrics, includes all single-family homes, condos and townhomes in the California Area above from November 2022 to November 2023. This may include preliminary data, and may vary from the time the data was gathered. All data is deemed reliable but not guaranteed. DRE# 01511642. Copyright KW Advisors Palo Alto 2023. Each office is independently owned and operated.
CONDO
Condo & Townhomes
No data for this month.
Single-Family Homes
Last 12 months, year-over-year.
No data for this month
Condos & Townhomes
Last 12 months, year-over-year
Median SalesPrice
Single-Family Homes
The median sales price has decreased from $4 4m last November 2022, to $3 8m as of November 2023
Condos & Townhomes
No data for this month
AVGDays OntheMarket
Single-Family Homes
The average time spent on the market went down from 62 days last November 2022, to 49 days as of November 2023
Condos & Townhomes
No data for this month
Overbids
Single-Family Homes
The overbid percentage has decreased from 98 4% last November 2022, to 92 1% a year later
Condos & Townhomes
No data for this month
MenloPark
What's in the Menlo Park data?
There were 53 single-family homes for sale, providing 2.1 months of inventory. There were 12 new listings, and 24 homes sold at a median price of $3.4m. The median overbid percentage was at 99.2%, with an average of 52 days on the market.
There were 22 condo and townhome units for sale, providing 7.5 months of inventory. There were 4 new listings and 6 units sold at a median sale price of $1.7m. The median overbid percentage was at 97.2%, with an average of 61 days on the market.
Single-Family Homes
12 New Listings
24 Sold Listings
2.1 Months of Inventory
$3.4M Median Sale Price
99.2%
Median Sale vs List
52 Avg Days on Market
Condo & Townhomes
4
New Listings
6 Sold Listings
7.5
Months of Inventory
$1.7M
Median Sale Price 97.2%
Median Sale vs List
61 Avg Days on Market
Single-Family Homes
Last 12 months, year-over-year.
Condos & Townhomes
Last 12 months, year-over-year
Median SalesPrice
Single-Family Homes
The median sales price has increased from $2 8m last November 2022, to $3 4m as of November 2023
Condos & Townhomes
The median sales price has increased from $1m last November 2022, to $1 7m as of November 2023
AVGDays OntheMarket
Single-Family Homes
The average time spent on the market went up from 28 days last November 2022, to 52 days as of November 2023
Condos & Townhomes
The average time spent on the market went down from 63 days in November 2022, to 61 days as of November 2023.
Overbids
Single-Family Homes
The overbid percentage has increased from 95 9% last November 2022, to 99 2% a year later
Condos & Townhomes
The overbid percentage has increased from 91% last November 2022, to 97.2% a year later.
Atherton
What's in the Atherton data?
There were 35 single-family homes for sale, providing 2.1 months of inventory. There were 5 new listings, and 8 homes sold at a median price of $6.2m. The median overbid percentage was at 91.5%, with an average of 44 days on the market.
There was no data for condo and townhouse units this month.
SFH
Single-Family Homes
5 New Listings
8 Sold Listings
2.1 Months of Inventory
$6.2M Median Sale Price
91.5% Median Sale vs List
44 Avg Days on Market
The data, sourced from InfoSparks and Broker Metrics, includes all single-family homes, condos and townhomes in the California Area above from November 2022 to November 2023. This may include preliminary data, and may vary from the time the data was gathered. All data is deemed reliable but not guaranteed. DRE# 01511642. Copyright KW Advisors Palo Alto 2023. Each office is independently owned and operated.
CONDO
Condo & Townhomes
No data for this month.
NOVEMBER 2022 - NOVEMBER 2023
Single-Family Homes
Last 12 months, year-over-year.
Condos & Townhomes
Last 12 months, year-over-year
Median SalesPrice
Single-Family Homes
The median sales price has decreased from $10m last November 2022, to $6 2m as of November 2023
Condos & Townhomes
The median sales price has decreased from $787k last November 2022, to $0 as of November 2023
AVGDays OntheMarket
Single-Family Homes
The average time spent on the market went down from 84 days last November 2022, to 44 days as of November 2023
Condos & Townhomes
The average time spent on the market went down from 12 days in November 2022, to 0 days as of November 2023.
Overbids
Single-Family Homes
The overbid percentage has decreased from 93 9% last November 2022, to 91 5% a year later
Condos & Townhomes
The overbid percentage has decreased from 95.5% last November 2022, to 0% a year later.
LosAltos
What's in the Los Altos data?
There were 36 single-family homes for sale, providing 0.8 months of inventory. There were 18 new listings, and 18 homes sold at a median price of $4.2m. The median overbid percentage was at 104%, with an average of 14 days on the market.
There were 11 condo and townhome units for sale, providing 2.3 months of inventory. There were 2 new listings and 2 units sold at a median sale price of $1.6m. The median overbid percentage was at 95%, with an average of 50 days on the market.
Single-Family Homes
18 New Listings
18 Sold Listings
0.8 Months of Inventory
$4.2M Median Sale Price
104% Median Sale vs List
14 Avg Days on Market
single-family homes, to November the data was Copyright KW
Condo & Townhomes
2
New Listings
2 Sold Listings
2.3
Months of Inventory
$1.6M
Median Sale Price 95%
Median Sale vs List 50 Avg Days on Market
LosAltos
NOVEMBER 2022 - NOVEMBER 2023
Single-Family Homes
Last 12 months, year-over-year.
Condos & Townhomes
Last 12 months, year-over-year
Median SalesPrice
Single-Family Homes
The median sales price has increased from $3 8m last November 2022, to $4 2m as of November 2023
Condos & Townhomes
The median sales price has increased from $974k last November 2022, to $1 6m as of November 2023
AVGDays OntheMarket
Single-Family Homes
The average time spent on the market went down from 30 days last November 2022, to 14 days as of November 2023
Condos & Townhomes
The average time spent on the market went up from 15 days in November 2022, to 50 days as of November 2023.
Overbids
Single-Family Homes
The overbid percentage has increased from 94 4% last November 2022, to 103 7% a year later
Condos & Townhomes
The overbid percentage has decreased from 96% last November 2022, to 95% a year later.
SanJose
What's in the San Jose data?
There were 476 single-family homes for sale, providing 0.8 months of inventory. There were 230 new listings, and 260 homes sold at a median price of $1.4m. The median overbid percentage was at 101.6%, with an average of 22 days on the market.
There were 321 condo and townhome units for sale, providing 1 3 months of inventory There were 103 new listings and 105 units sold at a median sale price of $800k. The median overbid percentage was at 101.2%, with an average of 30 days on the market.
Single-Family Homes
230 New Listings
260 Sold Listings
0.8 Months of Inventory
$1.4M Median Sale Price
101.6%
Median Sale vs List
22 Avg Days on Market
etrics, includes all single-family homes, from November 2022 to November vary from the time the data was guaranteed. DRE# 01511642. Copyright KW Advisors Palo Alto 2023. Each office is independently owned and operated.
103
New Listings
105 Sold Listings
1.3
Months of Inventory
$800K
Median Sale Price
101.2%
Median Sale vs List
30 Avg Days on Market
Single-Family Homes
Last 12 months, year-over-year.
Condos & Townhomes
Last 12 months, year-over-year
Median SalesPrice
Single-Family Homes
The median sales price has increased from $1 40M last November 2022, to $1 47M as of November 2023
Condos & Townhomes
The median sales price has increased from $778K last November 2022, to $800K as of November 2023
AVGDays OntheMarket
Single-Family Homes
The average time spent on the market went down from 25 days last November 2022, to 22 days as of November 2023
Condos & Townhomes
The average time spent on the market went down from 37 days in November 2022, to 30 days as of November 2023.
Overbids
Single-Family Homes
The overbid percentage has increased from 96% last November 2022, to 101 6% a year later
Condos & Townhomes
The overbid percentage has increased from 96.9% last November 2022, to 101.2% a year later.
Mountain View
What's in the Mountain View data?
There were 40 single-family homes for sale, providing 0.7 months of inventory. There were 24 new listings, and 19 homes sold at a median price of $2.5m. The median overbid percentage was at 104%, with an average of 13 days on the market
There were 42 condo and townhome units for sale, providing 1.3 months of inventory. There were 18 new listings and 19 units sold at a median sale price of $1.1m. The median overbid percentage was at 98.7%, with an average of 28 days on the market.
Single-Family Homes
24 New Listings
19 Sold Listings
0.7 Months of Inventory
$2.5M Median Sale Price
104% Median Sale vs List
13 Avg Days on Market
etrics, includes all single-family homes, from November 2022 to November vary from the time the data was guaranteed. DRE# 01511642. Copyright KW Advisors Palo Alto 2023. Each office is independently owned and operated.
18
New Listings
19
Sold Listings
1.3
Months of Inventory
$1.1M
Median Sale Price 98.7%
Median Sale vs List
28 Avg Days on Market
NOVEMBER 2022 - NOVEMBER 2023
Single-Family Homes
Last 12 months, year-over-year.
Condos & Townhomes
Last 12 months, year-over-year
Median SalesPrice
Single-Family Homes
The median sales price has decreased from $2 7m last November 2022, to $2 5m as of November 2023
Condos & Townhomes
The median sales price has decreased from $1 2m last November 2022, to $1 1m as of November 2023
The average time spent on the market went down from 37 days last November 2022, to 13 days as of November 2023
Condos & Townhomes
The average time spent on the market went down from 29 days in November 2022, to 28 days as of November 2023.
Single-Family Homes
The overbid percentage has increased from 94 2% last November 2022, to 104% a year later
Condos & Townhomes
The overbid percentage has increased from 96.8% last November 2022, to 98.7% a year later.
SanMateo County
What's in the San Mateo County data?
There were 390 single-family homes for sale, providing 1.4 months of inventory. There were 202 new listings, and 279 homes sold at a median price of $1.7m. The median overbid percentage was at 100 9%, with an average of 25 days on the market.
There were 183 condo and townhome units for sale, providing 2.2 months of inventory. There were 72 new listings and 69 units sold at a median sale price of $922k. The median overbid percentage was at 99%, with an average of 44 days on the market
Single-Family Homes
202 New Listings
279 Sold Listings
1.4 Months of Inventory
$1.7M Median Sale Price
100.9%
Median Sale vs List
25 Avg Days on Market
etrics, includes all single-family homes, from November 2022 to November vary from the time the data was guaranteed. DRE# 01511642. Copyright KW Advisors Palo Alto 2023. Each office is independently owned and operated.
72
New Listings
69
Sold Listings
2.2
Months of Inventory
$922K
Median Sale Price 99%
Median Sale vs List 44 Avg Days on Market
SanMateo
NOVEMBER 2022 - NOVEMBER 2023
Single-Family Homes
Last 12 months, year-over-year.
Condos & Townhomes
Last 12 months, year-over-year
Median SalesPrice
Single-Family Homes
The median sales price has increased from $1 71m last November 2022, to $1 73m as of November 2023
Condos & Townhomes
The median sales price has increased from $889k last November 2022, to $922k as of November 2023
AVGDays OntheMarket
Single-Family Homes
The average time spent on the market went down from 28 days last November 2022, to 25 days as of November 2023
Condos & Townhomes
The average time spent on the market went down from 48 days in November 2022, to 44 days as of November 2023.
Overbids
Single-Family Homes
The overbid percentage has increased from 98 7% last November 2022, to 100 9% a year later
Condos & Townhomes
The overbid percentage has increased from 97.6% last November 2022, to 98.8% a year later.
SantaClara County
What's in the Santa Clara County data?
There were 586 single-family homes for sale, providing 1 month of inventory. There were 513 new listings, and 544 homes sold at a median price of $1.7m. The median overbid percentage was at 101 7%, with an average of 20 days on the market.
There were 334 condo and townhome units for sale, providing 1.3 months of inventory. There were 227 new listings and 225 units sold at a median sale price of $930k. The median overbid percentage was at 100.2%, with an average of 23 days on the market
SFH
Single-Family Homes
513 New Listings
1 Month of Inventory
544 Sold Listings
$1.7M Median Sale Price
101.7%
Median Sale vs List
20 Avg Days on Market
The data, sourced from InfoSparks and Broker Metrics, includes all single-family homes, condos and townhomes in the California Area above from November 2022 to November 2023. This may include preliminary data, and may vary from the time the data was gathered. All data is deemed reliable but not guaranteed. DRE# 01511642. Copyright KW Advisors Palo Alto 2023. Each office is independently owned and operated.
227
New Listings
225
Sold Listings
1.3
Months of Inventory
100.2%
Median Sale vs List
$930K
Median Sale Price
23
Avg Days on Market
SantaClaraCounty
NOVEMBER 2022 - NOVEMBER 2023
Single-Family Homes
Last 12 months, year-over-year.
Condos & Townhomes
Last 12 months, year-over-year
Median SalesPrice
Single-Family Homes
The median sales price has increased from $1 5m last November 2022, to $1 7m as of November 2023
Condos & Townhomes
The median sales price has increased from $885k last November 2022, to $930k as of November 2023
AVGDays OntheMarket
Single-Family Homes
The average time spent on the market went down from 25 days last November 2022, to 20 days as of November 2023
Condos & Townhomes
The average time spent on the market went down from 36 days in November 2022, to 23 days as of November 2023.
Overbids
Single-Family Homes
The overbid percentage has increased from 98 7% last November 2022, to 101 7% a year later
Condos & Townhomes
The overbid percentage has increased from 98.7% last November 2022, to 100.2% a year later.
Monterey County
What's in the Monterey County data?
There were 453 single-family homes for sale, providing 2.2 months of inventory. There were 148 new listings, and 123 homes sold at a median price of $944k. The median overbid percentage was at 92 1%, with an average of 41 days on the market.
There were 70 condo and townhome units for sale, providing 3.3 months of inventory. There were 20 new listings and 12 units sold at a median sale price of $702k. The median overbid percentage was at 101%, with an average of 56 days on the market
SFH
Single-Family Homes
148 New Listings
123 Sold Listings
2.2 Months of Inventory
$944K Median Sale Price
92.1% Median Sale vs List
41 Avg Days on Market
The data, sourced from InfoSparks and Broker Metrics, includes all single-family homes, condos and townhomes in the California Area above from November 2022 to November 2023. This may include preliminary data, and may vary from the time the data was gathered. All data is deemed reliable but not guaranteed. DRE# 01511642. Copyright KW Advisors Palo Alto 2023. Each office is independently owned and operated.
20
New Listings
12
Sold Listings
3.3
Months of Inventory
$702K
Median Sale Price 101%
Median Sale vs List 56 Avg Days on Market
MontereyCounty
NOVEMBER 2022 - NOVEMBER 2023
Single-Family Homes
Last 12 months, year-over-year.
Condos & Townhomes
Last 12 months, year-over-year
Median SalesPrice
Single-Family Homes
The median sales price has increased from $819k last November 2022, to $944k as of November 2023
Condos & Townhomes
The median sales price has increased from $630k last November 2022, to $702k as of November 2023
AVGDays OntheMarket
Single-Family Homes
The average time spent on the market went down from 46 days last November 2022, to 41 days as of November 2023
Condos & Townhomes
The average time spent on the market went up from 36 days in November 2022, to 56 days as of November 2023.
Overbids
Single-Family Homes
The overbid percentage has increased from 85 9% last November 2022, to 92 1% a year later
Condos & Townhomes
The overbid percentage has increased from 97.7% last November 2022, to 100.5% a year later.
SantaCruz County
What's in the Santa Cruz County data?
There were 358 single-family homes for sale, providing 2.5 months of inventory. There were 82 new listings, and 66 homes sold at a median price of $1.3m. The median overbid percentage was at 95 2%, with an average of 43 days on the market
There were 92 condo and townhome units for sale, providing 2 months of inventory. There were 31 new listings and 22 units sold at a median sale price of $712k. The median overbid percentage was at 97%, with an average of 30 days on the market.
SFH
Single-Family Homes
82 New Listings
66 Sold Listings
2.5 Months of Inventory
$1.3M Median Sale Price
95.2% Median Sale vs List
43 Avg Days on Market
The data, sourced from InfoSparks and Broker Metrics, includes all single-family homes, condos and townhomes in the California Area above from November 2022 to November 2023. This may include preliminary data, and may vary from the time the data was gathered. All data is deemed reliable but not guaranteed. DRE# 01511642. Copyright KW Advisors Palo Alto 2023. Each office is independently owned and operated.
SantaCruzCounty
NOVEMBER 2022 - NOVEMBER 2023
Single-Family Homes
Last 12 months, year-over-year.
Condos & Townhomes
Last 12 months, year-over-year
Median SalesPrice
Single-Family Homes
The median sales price has increased from $1 2m last November 2022, to $1 3m as of November 2023
Condos & Townhomes
The median sales price has decreased from $805k last November 2022, to $712k as of November 2023
AVGDays OntheMarket
Single-Family Homes
The average time spent on the market went up from 39 days last November 2022, to 43 days as of November 2023
Condos & Townhomes
The average time spent on the market went up from 23 days in November 2022, to 30 days as of November 2023.
Overbids
Single-Family Homes
The overbid percentage has decreased from 96 4% last November 2022, to 95 2% a year later
Condos & Townhomes
The overbid percentage has increased from 96.1% last November 2022, to 97.3% a year later.
East PaloAlto
What's in the East Palo Alto data?
There were 10 single-family homes for sale, providing 0.8 months of inventory. There were 2 new listings, and 3 homes sold at a median price of $946K. The median overbid percentage was at 97%, with an average of 23 days on the market
There was 1 condo and townhome unit for sale, providing 0 months of inventory. There were 0 new listings and 1 unit sold at a median sale price of $865k. The median overbid percentage was at 94.5%, with an average of 0 days on the market.
SFH
Single-Family Homes
2 New Listings
0.8 Months of Inventory
3 Sold Listings
$946K
Median Sale Price
97%
Median Sale vs List
23 Avg Days on Market
ta, sourced from InfoSparks and Broker Metrics, includes all single-family homes, and townhomes in the California Area above from November 2022 to November This may include preliminary data, and may vary from the time the data was gathered. All data is deemed reliable but not guaranteed. DRE# 01511642. Copyright KW Advisors Palo Alto 2023. Each office is independently owned and operated.
New Listings
1 Sold Listing
0
Months of Inventory
$865K
Median Sale Price 94.5%
Median Sale vs List 0 Avg Days on Market
Single-Family Homes
Last 12 months, year-over-year.
Condos & Townhomes
Last 12 months, year-over-year
Median SalesPrice
Single-Family Homes
The median sales price has increased from $785k last November 2022, to $946k as of November 2023
Condos & Townhomes
The median sales price has increased from $432k last November 2022, to $865k as of November 2023
AVGDays OntheMarket
Single-Family Homes
The average time spent on the market went down from 97 days last November 2022, to 23 days as of November 2023
Condos & Townhomes
The average time spent on the market stayed from 0 days in November 2022, to 0 days as of November 2023.
Overbids
Single-Family Homes
The overbid percentage has increased from 94 6% last November 2022, to 97% a year later
Condos & Townhomes
The overbid percentage has increased from 93.5% last November 2022, to 94.5% a year later.
Sunnyvale
What's in the Sunnyvale data?
There were 51 single-family homes for sale, providing 0.5 months of inventory. There were 27 new listings, and 30 homes sold at a median price of $2.3m. The median overbid percentage was at 108.8%, with an average of 18 days on the market.
There were 42 condo and townhome units for sale, providing 1 month of inventory. There were 15 new listings and 17 units sold at a median sale price of $1.2m. The median overbid percentage was at 103.9%, with an average of 23 days on the market.
Single-Family Homes
27 New Listings
30 Sold Listings
0.5 Months of Inventory
$2.3M Median Sale Price
108.8% Median Sale vs List
18 Avg Days on Market
includes all single-family homes, from November 2022 to November vary from the time the data was guaranteed. DRE# 01511642. Copyright KW Advisors Palo Alto 2023. Each office is independently owned and operated.
15
New Listings
17
Sold Listings
1
Month of Inventory
103.9%
Median Sale vs List
$1.2M
Median Sale Price
23
Avg Days on Market
Sunnyvale
NOVEMBER 2022 - NOVEMBER 2023
Single-Family Homes
Last 12 months, year-over-year.
Condos & Townhomes
Last 12 months, year-over-year
Median SalesPrice
Single-Family Homes
The median sales price has increased from $2 1m last November 2022, to $2 3m as of November 2023
Condos & Townhomes
The median sales price has increased from $1 21m last November 2022, to $1 28m as of November 2023
AVGDays OntheMarket
Single-Family Homes
The average time spent on the market went down from 23 days last November 2022, to 18 days as of November 2023
Condos & Townhomes
The average time spent on the market went down from 37 days in November 2022, to 23 days as of November 2023.
Overbids
Single-Family Homes
The overbid percentage has increased from 103 3% last November 2022, to 108 8% a year later
Condos & Townhomes
The overbid percentage has increased from 94.8% last November 2022, to 103.9% a year later.
SantaClara City
What's in the Santa Clara City data?
There were 50 single-family homes for sale, providing 0.6 months of inventory. There were 21 new listings, and 37 homes sold at a median price of $1.7m. The median overbid percentage was at 105 6%, with an average of 19 days on the market
There were 39 condo and townhome units for sale, providing 0.8 months of inventory. There were 17 new listings and 17 units sold at a median sale price of $950k. The median overbid percentage was at 102.6%, with an average of 32 days on the market.
SFH
Single-Family Homes
21 New Listings
37 Sold Listings
0.6 Months of Inventory
$1.7M Median Sale Price
105.6%
Median Sale vs List
19 Avg Days on Market
etrics, includes all single-family homes, ove from November 2022 to November may vary from the time the data was guaranteed. DRE# 01511642. Copyright KW Advisors Palo Alto 2023. Each office is independently owned and operated.
17
New Listings
17
Sold Listings
0.8
Months of Inventory
$950K
Median Sale Price
102.6%
Median Sale vs List
32
Avg Days on Market
Median SalesPrice
Single-Family Homes
The median sales price has increased from $1 70m last November 2022, to $1 71m as of November 2023
Condos & Townhomes
The median sales price has increased from $815k last November 2022, to $950k as of November 2023
AVGDays OntheMarket
Single-Family Homes
The average time spent on the market went down from 21 days last November 2022, to 19 days as of November 2023
Condos & Townhomes
The average time spent on the market went up from 26 days in November 2022, to 32 days as of November 2023.
Overbids
Single-Family Homes
The overbid percentage has increased from 101 7% last November 2022, to 105 6% a year later
Condos & Townhomes
The overbid percentage has increased from 96.7% last November 2022, to 102.6% a year later.
Saratoga
What's in the Saratoga data?
There were 41 single-family homes for sale, providing 1.2 months of inventory. There were 14 new listings, and 20 homes sold at a median price of $3.4m. The median overbid percentage was at 101.5%, with an average of 20 days on the market.
There was 1 condo and townhome unit for sale, providing 0 months of inventory. There was 1 new listing and 2 units sold at a median sale price of $1.5m. The median overbid percentage was at 102.2%, with an average of 0 days on the market.
SFH
Single-Family Homes
14 New Listings
20 Sold Listings
1.2 Months of Inventory
$3.4M Median Sale Price
101.5%
Median Sale vs List
20 Avg Days on Market
sourced from InfoSparks and Broker Metrics, includes all single-family homes, townhomes in the California Area above from November 2022 to November may include preliminary data, and may vary from the time the data was data is deemed reliable but not guaranteed. DRE# 01511642. Copyright KW Advisors Palo Alto 2023. Each office is independently owned and operated.
Condo & Townhomes
1
New Listing
2 Sold Listings
0
Months of Inventory
$1.5M
Median Sale Price 102.2%
Median Sale vs List 0 Avg Days on Market
NOVEMBER 2022 - NOVEMBER 2023
Single-Family Homes
Last 12 months, year-over-year.
Condos & Townhomes
Last 12 months, year-over-year
Median SalesPrice
Single-Family Homes
The median sales price has decreased from $3 5m last November 2022, to $3 4m as of November 2023
Condos & Townhomes
The median sales price has decreased from $1 9m last November 2022, to $1 5m as of November 2023
AVGDays OntheMarket
Single-Family Homes
The average time spent on the market went down from 33 days last November 2022, to 20 days as of November 2023
Condos & Townhomes
The average time spent on the market went down from 39 days in November 2022, to 0 days as of November 2023.
Overbids
Single-Family Homes
The overbid percentage has increased from 91 1% last November 2022, to 101 5% a year later
Condos & Townhomes
The overbid percentage has increased from 97.2% last November 2022, to 102.2% a year later.