Jump to Southern/Central Marin Southern/Central Marin
What’syourhome reallyworthin today’smarket?
That's the question you should be asking yourself.
Our market is incredibly diverse and rapidly changing. Values vary not just by neighborhood but by street. Your home isn't necessarily worth what your neighbors' home is. It's the current market that sets the value of your home.
So, do you know what your home is worth in today's market?
Icanhelp...
Contact me for a confidential, no obligation assessment of your home's value.
TheTruthAboutDownPayments (It’sNotWhatYouThink)
Buying a home is exciting… until you start thinking about the down payment. That’s when the worry can set in.
“I’ll never save enough.”
“I need a small fortune just to get started.”
“I guess I’ll just rent forever.”
Sound familiar? You’re not alone. And you’re definitely not out of luck.
Here’s the thing: a lot of what you’ve heard about down payments just isn’t true. And once you know the facts, you might realize you’re a lot closer to owning a home than you think.
Let’s break it all down and bust some big down payment myths while we’re at it.
Smart Strategies for a Mortgage Application
Avoid paying off debts or collections without professional advice.
Don't have your credit report pulled too many times - this can hurt your credit score. 3 4 5 6 1 2
Always consult your mortgage professional before making large financial moves. Use verified funds for deposits to prevent closing delays.
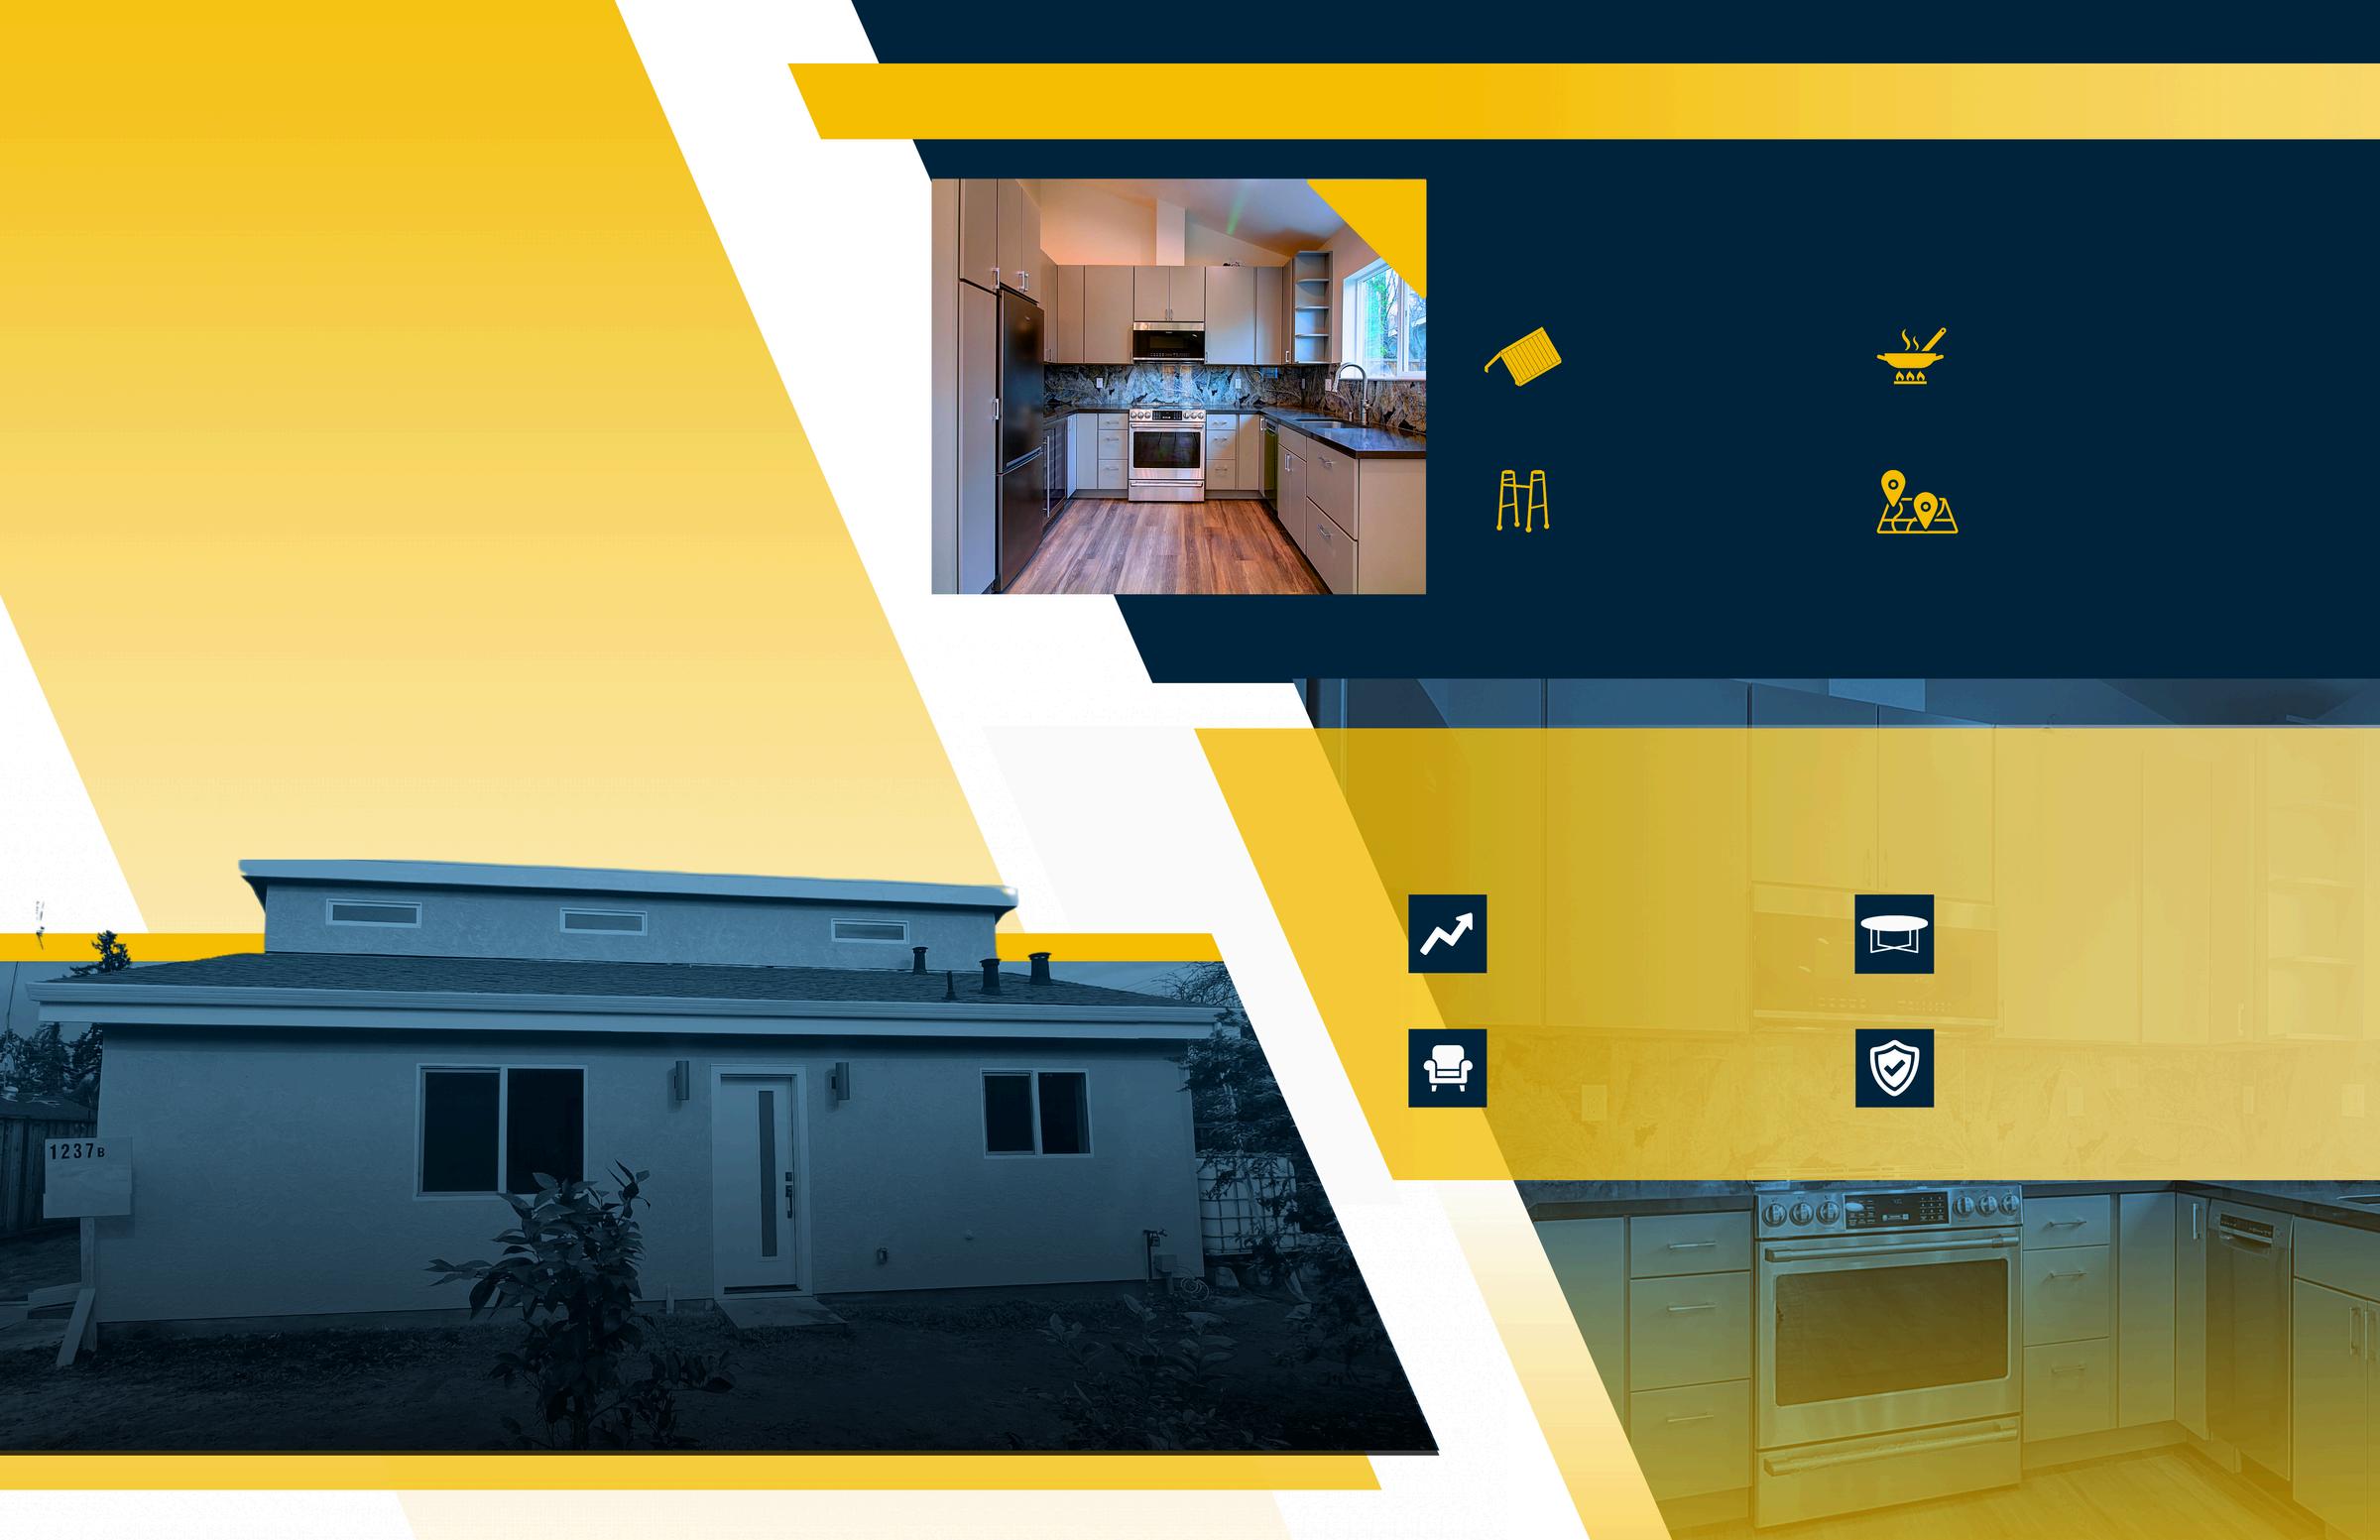
HomeRenovationsThatCanMakea BIG IMPACT AccordingtoExperts
Enhancing Property Value and Family Living Space with an Acton ADU
The Anenberg-Essert family in Campbell collaborated with Acton ADU to create a versatile, comfortable, and valuable addition to their property. This ADU project is a shining example of how a well-designed accessory dwelling unit can increase property value and serve a family’s unique needs.
GoalsandVision
The family envisioned an ADU that would function as an independent living space for family members, enhance their property’s worth, and provide seamless integration with the main home They wanted a space that balanced privacy with connectivity, feeling like a natural extension of their residence
Design and Construction Details
Constructed at 747 square feet, this ADU was designed with modern, high-quality finishes to serve both aesthetic and practical needs. Key features include:
Vaulted Ceilings
Creates a spacious, open atmosphere
Senior-Friendly Living
Safe, independent space for elderly family members
Fully Equipped Kitchen
Modern amenities for everyday convenience
Open Living Area
Multipurpose area for relaxation and entertainment
Results and Impact
The completion of the Anenberg-Essert ADU led to several valuable outcomes:
Increased Property Value
The ADU addition significantly boosted property value
Flexible Living Space
A versatile space for family, guests, or as a rental
Modern Comforts
High-end finishes and amenities enhance both function and style.
Enhanced Family Living
The ADU enriches the AnenbergEssert family’s home with both privacy and connection
VENDOR DIRECTORY
When it comes to home ownership, knowing who you can trust is crucial. That's why we've curated a select list of trusted vendors who are ready to help with your home goals.
Alameda
What's in the Alameda data?
There were 1,319 single-family homes for sale, providing 2.2 months of inventory. There were 757 new listings, and 602 homes sold at a median price of $1.2m. The median overbid percentage was at 45.6%, with an average of 26 days on the market.
There were 769 condo and townhome units for sale, providing 5 2 months of inventory There were 262 new listings and 147 units sold at a median sale price of $685k. The median overbid percentage was at 19.1%, with an average of 41 days on the market.
He-Family Homes
7 ings
602 Sold Listings
2 of Inventory
$1.2M Median Sale Price
.6% Sale vs List
26 Avg Days on Market
sourced from InfoSparks, includes all single-family homes, condos and in the California Area above from July 2024 to July 2025. This may include data, and may vary from the time the data was gathered. All data is deemed not guaranteed. DRE# 01995149. Copyright KW Advisors San Francisco | Napa Valley 2025. Each office is independently owned and operated.
262
New Listings 5.2
147 Sold Listings
Months of Inventory $685K
Median Sale Price 19.1%
Median Sale vs List 41 Avg Days on Market
Alameda
JULY 2024 - JULY 2025
Single-Family Homes
Last 12 months, year-over-year.
Condos & Townhomes
Last 12 months, year-over-year
Single-Family Homes
The median sale price has decreased from $1 3m last July 2024, to $1 2m as of July 2025
Condos & Townhomes
The median sale price has decreased from $750k last July 2024, to $685k as of July 2025
AVGDays OntheMarket
Single-Family Homes
The average time spent on the market went up from 19 days last July 2024, to 26 days as of July 2025
Condos & Townhomes
The average time spent on the market went up from 27 days in July 2024, to 41 days as of July 2025.
Overbids
Single-Family Homes
The overbid percentage has decreased from 75% last July 2024, to 45 6% a year later
Condos & Townhomes
The overbid percentage has decreased from 39.8% last July 2024, to 19.1% a year later.
Contra Costa
What's in the Contra Costa data?
There were 1,702 single-family homes for sale, providing 2.7 months of inventory. There were 968 new listings, and 657 homes sold at a median price of $859k. The median overbid percentage was at 100%, with an average of 31 days on the market.
There were 605 condo and townhome units for sale, providing 3.7 months of inventory. There were 292 new listings and 162 units sold at a median sale price of $555k. The median overbid percentage was at 99.4%, with an average of 40 days on the market
Single-Family Homes
968 New Listings
657 Sold Listings
2.7 Months of Inventory
$859K Median Sale Price
100%
Median Sale vs List
31 Avg Days on Market
The data, sourced from InfoSparks, includes all single-family homes, condos and townhomes in the California Area above from July 2024 to July 2025. This may include preliminary data, and may vary from the time the data was gathered. All data is deemed reliable but not guaranteed. DRE# 01995149. Copyright KW Advisors San Francisco | Napa Valley 2025. Each office is independently owned and operated.
292
New Listings
162 Sold Listings
3.7
Months of Inventory $555K
Median Sale Price 99.4%
Median Sale vs List 40 Avg Days on Market
ontraCosta
JULY
2024 - JULY 2025
TINGS FOR SALE SOLD LISTINGS
Family Homes
2 months, year-over-year.
s & Townhomes
2 months, year-over-year
Median SalesPrice
Single-Family Homes
The median sale price has decreased from $915k last July 2024, to $859k as of July 2025
Condos & Townhomes
The median sale price has decreased from $605k last July 2024, to $555k as of July 2025
AVGDays OntheMarket
Single-Family Homes
The average time spent on the market went up from 23 days last July 2024, to 31 days as of July 2025
Condos & Townhomes
The average time spent on the market went up from 34 days in July 2024, to 40 days as of July 2025.
Overbids
Single-Family Homes
The overbid percentage has decreased from 100 7% last July 2024, to 100% a year later
Condos & Townhomes
The overbid percentage has decreased from 100% last July 2024, to 99.4% a year later.
Napa County
What's in the Napa County data?
There were 478 single-family homes for sale, providing 6.9 months of inventory. There were 94 new listings, and 83 homes sold at a median price of $925k. The median overbid percentage was at 98 6%, with an average of 57 days on the market
There were 64 condo and townhome units for sale, providing 6.6 months of inventory. There were 4 new listings and 10 units sold at a median sale price of $670k. The median overbid percentage was at 98.4%, with an average of 78 days on the market.
Single-Family Homes
94 New Listings
83 Sold Listings
6.9 Months of Inventory
$925K
Median Sale Price
98.6%
Median Sale vs List
57 Avg Days on Market
The data, sourced from InfoSparks, includes all single-family homes, condos and townhomes in the California Area above from July 2024 to July 2025. This may include preliminary data, and may vary from the time the data was gathered. All data is deemed reliable but not guaranteed. DRE# 01995149. Copyright KW Advisors San Francisco | Napa Valley 2025. Each office is independently owned and operated.
4
New Listings
10 Sold Listings
6.6
Months of Inventory
$670K
Median Sale Price 98.4%
Median Sale vs List 78 Avg Days on Market
NapaCounty
JULY 2024 - JULY 2025
Single-Family Homes
Last 12 months, year-over-year.
Condos & Townhomes
Last 12 months, year-over-year
Median SalesPrice
Single-Family Homes
The median sale price has decreased from $1m last July 2024, to $925k as of July 2025
Condos & Townhomes
The median sale price has increased from $490k last July 2024, to $670k as of July 2025
AVGDays OntheMarket
Single-Family Homes
The average time spent on the market went up from 55 days last July 2024, to 57 days as of July 2025
Condos & Townhomes
The average time spent on the market went up from 60 days in July 2024, to 78 days as of July 2025.
Overbids
Single-Family Homes
The overbid percentage has decreased from 100% last July 2024, to 98 6% a year later
Condos & Townhomes
The overbid percentage has increased from 98.2% last July 2024, to 98.4% a year later.
San Francisco County
What's in the San Francisco County data?
There were 227 single-family homes for sale, providing 1.2 months of inventory. There were 159 new listings, and 188 homes sold at a median price of $1.6m. The median overbid percentage was at 110.2%, with an average of 27 days on the market.
There were 551 condo and townhome units for sale, providing 3.1 months of inventory. There were 208 new listings and 174 units sold at a median sale price of $1.1m. The median overbid percentage was at 99.7%, with an average of 62 days on the market.
Single-Family Homes
159 ew Listings
188 Sold Listings
1.2 Months of Inventory
$1.6M Median Sale Price
110.2%
Median Sale vs List
27 Avg Days on Market
The data, sourced from InfoSparks, includes all single-family homes, condos and townhomes in the California Area above from July 2024 to July 2025. This may include preliminary data, and may vary from the time the data was gathered. All data is deemed reliable but not guaranteed. DRE# 01995149. Copyright KW Advisors San Francisco | Napa Valley 2025. Each office is independently owned and operated.
208
New Listings
174
Sold Listings
3.1
Months of Inventory
$1.1M
Median Sale Price 99.7%
Median Sale vs List
62 Avg Days on Market
SanFranciscoCounty
JULY 2024 - JULY 2025
LISTINGS FOR SALE SOLD LISTINGS
Single-Family Homes
Last 12 months, year-over-year.
Condos & Townhomes
Last 12 months, year-over-year
Median SalesPrice
Single-Family Homes
The median sale price has increased from $1 6m last July 2024, to $1 63m as of July 2025
Condos & Townhomes
The median sale price has decreased from $1 2m last July 2024, to $1 1m as of July 2025
AVGDays OntheMarket
Single-Family Homes
The average time spent on the market went up from 24 days last July 2024, to 27 days as of July 2025
Condos & Townhomes
The average time spent on the market went up from 54 days in July 2024, to 62 days as of July 2025.
Overbids
Single-Family Homes
The overbid percentage has increased from 109 8% last July 2024, to 110 2% a year later
Condos & Townhomes
The overbid percentage has decreased from 100% last July 2024, to 99.7% a year later.
SanMateo County
What's in the San Mateo Cou data?
There were 514 single-family homes for sale, providing 1.7 months of inventory. There wer new listings, and 361 homes sold at a media price of $1.9m. The median overbid percenta was at 100 3%, with an average of 25 days on market.
There were 310 condo and townhome units f sale, providing 3.3 months of inventory. Ther were 136 new listings and 87 units sold at a median sale price of $998k. The median over percentage was at 100%, with an average of days on the market
136
New Listings
87
Sold Listings
3.3
Months of Inventory
$998K
Median Sale Price 100%
Median Sale vs List 37 Avg Days on Market
SanMateoCounty
JULY 2024 - JULY 2025
LISTINGS FOR SALE SOLD LISTINGS
Single-Family Homes
Last 12 months, year-over-year.
Condos & Townhomes
Last 12 months, year-over-year
Median SalesPrice
Single-Family Homes
The median sale price has decreased from $2m last July 2024, to $1 9m as of July 2025
Condos & Townhomes
The median sale price has decreased from $1m last July 2024, to $998k as of July 2025
AVGDays OntheMarket
Single-Family Homes
The average time spent on the market went up from 22 days last July 2024, to 25 days as of July 2025
Condos & Townhomes
The average time spent on the market went up from 28 days in July 2024, to 37 days as of July 2025.
Overbids
Single-Family Homes
The overbid percentage has decreased from 103 1% last July 2024, to 100 3% a year later
Condos & Townhomes
The overbid percentage has remained the same from 100% last July 2024, to 100% a year later.
SantaC County
What's in the Sant County data?
There were 1,038 single-fam providing 1.5 months of inve new listings, and 715 homes price of $1.8m. The median o was at 100 8%, with an avera market.
There were 762 condo and to sale, providing 2.7 months of were 443 new listings and 27 median sale price of $1m. Th percentage was at 100%, wit days on the market
homes, condos and 2025. This may include gathered. All data is deemed Advisors San Francisco | Napa Valley 2025. Each office is independently owned and operated. 8M
Price Market
443
New Listings
276 Sold Listings
2.7
Months of Inventory
$1M
Median Sale Price 100%
Median Sale vs List
31 Avg Days on Market
antaClaraCounty
JULY 2024 - JULY 2025
TINGS FOR SALE SOLD LISTINGS
Family Homes
2 months, year-over-year.
s & Townhomes
2 months, year-over-year
Median SalesPrice
Single-Family Homes
The median sale price has increased from $1 86m last July 2024, to $1 88m as of July 2025
Condos & Townhomes
The median sale price has increased from $950k last July 2024, to $1000k as of July 2025
AVGDays OntheMarket
Single-Family Homes
The average time spent on the market went up from 16 days last July 2024, to 23 days as of July 2025
Condos & Townhomes
The average time spent on the market went up from 23 days in July 2024, to 31 days as of July 2025.
Overbids
Single-Family Homes
The overbid percentage has decreased from 103 3% last July 2024, to 100 8% a year later
Condos & Townhomes
The overbid percentage has decreased from 100.7% last July 2024, to 100% a year later.
Solano County
What's in the Sola data?
There were 882 single-family providing 3 months of invent new listings, and 297 homes price of $595k. The median o was at 100%, with an average market.
There were 93 condo and tow sale, providing 3.6 months of were 33 new listings and 22 sale price of $351k. The med percentage was at 100%, wit days on the market
homes, condos and 2025. This may include gathered. All data is deemed Advisors San Francisco | Napa Valley 2025. Each office is independently owned and operated.
New Listings 3.6 Months of Inventory
Listings
Median SalesPrice
Single-Family Homes
The median sale price has increased from $590k last July 2024, to $595k as of July 2025
Condos & Townhomes
The median sale price has decreased from $402k last July 2024, to $351k as of July 2025
AVGDays OntheMarket
Single-Family Homes
The average time spent on the market went up from 45 days last July 2024, to 48 days as of July 2025
Condos & Townhomes
The average time spent on the market went up from 38 days in July 2024, to 59 days as of July 2025.
Overbids
Single-Family Homes
The overbid percentage has remained the same from 100% last July 2024, to 100% a year later
Condos & Townhomes
The overbid percentage has remained the same from 100% last July 2024, to 100% a year later.
Sonoma County
What's in the Sonoma data?
There were 1,130 single-family homes for sale, providing 3.5 months of inventory. There were 312 new listings, and 379 homes sold at a median price of $850k. The median overbid percentage was at 99.5%, with an average of 55 days on the market.
There were 150 condo and townhome units for sale, providing 3.8 months of inventory. There were 39 new listings and 37 units sold at a median sale price of $449k. The median overbid percentage was at 100%, with an average of 70 days on the market.
Single-Family Homes
312 New Listings
379 Sold Listings
3.5 Months of Inventory
$850K
Median Sale Price
99.5%
Median Sale vs List
55 Avg Days on Market
The data, sourced from InfoSparks, includes all single-family homes, condos and townhomes in the California Area above from July 2024 to July 2025. This may include preliminary data, and may vary from the time the data was gathered. All data is deemed reliable but not guaranteed. DRE# 01995149. Copyright KW Advisors San Francisco | Napa Valley 2025. Each office is independently owned and operated.
39
New Listings
37 Sold Listings
3.8
Months of Inventory
$449K
Median Sale Price 100%
Median Sale vs List
70 Avg Days on Market
SonomaCounty
JULY 2024 - JULY 2025
LISTINGS FOR SALE
Single-Family Homes
Last 12 months, year-over-year.
Condos & Townhomes
Last 12 months, year-over-year
Median SalesPrice
Single-Family Homes
The median sale price has remained the same from $850k last July 2024, to $850k as of July 2025
Condos & Townhomes
The median sale price has increased from $435k last July 2024, to $449k as of July 2025
AVGDays OntheMarket
Single-Family Homes
The average time spent on the market went up from 45 days last July 2024, to 55 days as of July 2025
Condos & Townhomes
The average time spent on the market went up from 52 days in July 2024, to 70 days as of July 2025.
Overbids
Single-Family Homes
The overbid percentage has decreased from 100% last July 2024, to 99 5% a year later
Condos & Townhomes
The overbid percentage has remained the same from 100% last July 2024, to 100% a year later.
Southern/ Central Marin
What's in the Southern/Central Marin data?
There were 365 single-family homes for sale, providing 2.4 months of inventory. There were 92 new listings, and 164 homes sold at a median price of $1.6m. The median overbid percentage was at 98.6%, with an average of 43 days on the market.
There were 128 condo and townhome units for sale, providing 3.1 months of inventory. There were 40 new listings and 37 units sold at a median sale price of $675k. The median overbid percentage was at 98.1%, with an average of 94 days on the market.
Single-Family Homes
92 New Listings
164 Sold Listings
2.4 Months of Inventory
$1.6M Median Sale Price
98.6%
Median Sale vs List
43 Avg Days on Market
The data, sourced from InfoSparks, includes all single-family homes, condos and townhomes in the California Area above from July 2024 to July 2025. This may include preliminary data, and may vary from the time the data was gathered. All data is deemed reliable but not guaranteed. DRE# 01995149. Copyright KW Advisors San Francisco | Napa Valley 2025. Each office is independently owned and operated.
New Listings
3.1
Months of Inventory 98.1%
Median Sale vs List
Median SalesPrice
Single-Family Homes
The median sale price has increased from $1 5m last July 2024, to $1 6m as of July 2025
Condos & Townhomes
The median sale price has decreased from $805k last July 2024, to $675k as of July 2025
AVGDays OntheMarket
Single-Family Homes
The average time spent on the market went up from 38 days last July 2024, to 43 days as of July 2025
Condos & Townhomes
The average time spent on the market went up from 39 days in July 2024, to 94 days as of July 2025.
Overbids
Single-Family Homes
The overbid percentage has decreased from 100% last July 2024, to 98 6% a year later
Condos & Townhomes
The overbid percentage has decreased from 100% last July 2024, to 98.1% a year later.