SEPTEMBERUPDATEBY
Welcome to Fall! I hope you had a great summer. Now it’s back to work, school, and time for our next selling season. As you’ll see from the charts below, it was a slow summer for real estate. Typically, September and October are great months to sell and buy, as more homes are on the market. Buyers can again focus after digging themselves out of Burning Man or trying to catch that flight home from their far-away vacation. I spent some time in New Zealand and Australia in August, and the airports were packed!
While the Market Action Index has strengthened in the last few weeks, prices have settled in a bit of a plateau. We are currently in a Seller’s market, so prices will likely resume climbing should this trend persist. We seem to be in a low inventory, low sales situation. With interest rates remaining high, when this will change is unknown.

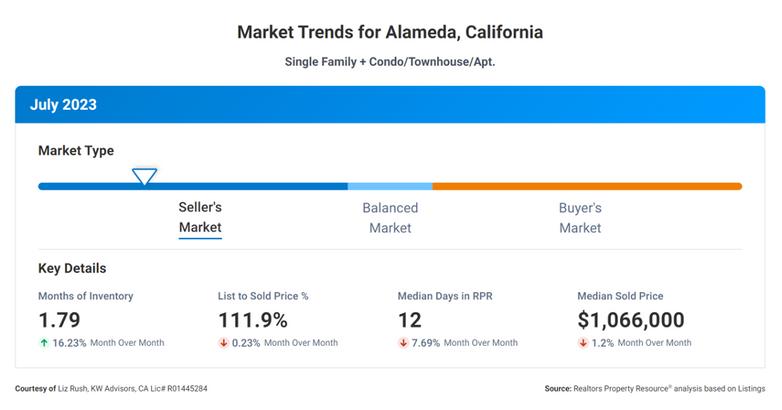
First, let's talk about the "Months Supply of Inventory," which measures how many months it would take to sell all the current homes if no new listings were added. Currently, the months supply of inventory stands at 1.79. This indicates that there is a relatively low inventory of homes available for sale compared to the demand in the market. This number has gone up +16% in the last month.
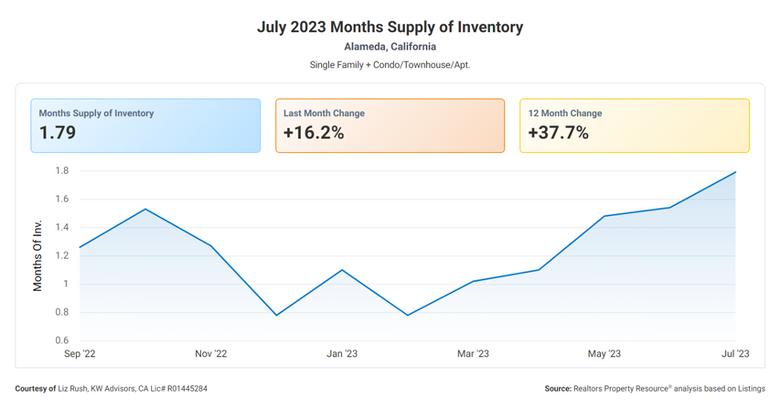
Now, let's turn our attention to the "12-Month Change in Months of Inventory," a metric that tells us how much the supply of homes has changed over the past year. In this case, we see a significant increase of 37.7% in the months of inventory. This suggests that there has been a notable increase in the number of homes available for sale compared to the previous year.
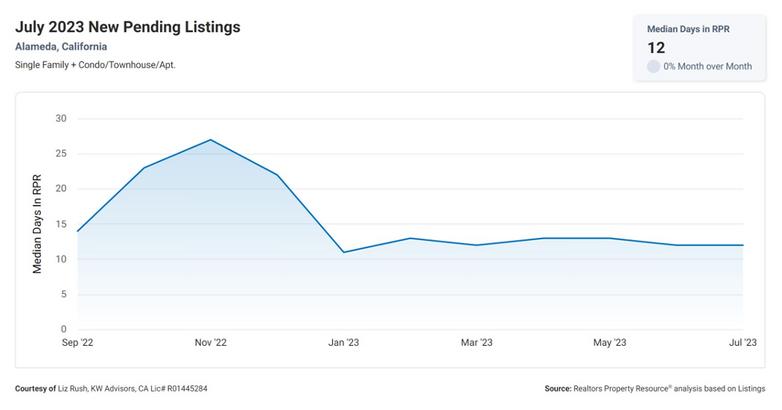
Let's consider the "Median Days Homes are On the Market." This metric provides us with an idea of how long it takes, on average, for a home to sell once it is listed. Currently, the median days homes are on the market is just 12 days. This indicates a fast-paced market where homes are selling relatively quickly.
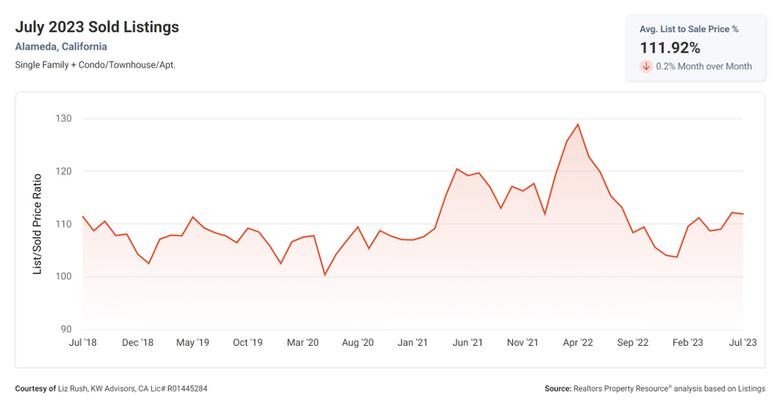
Next, we have the "List to Sold Price Percentage." This metric compares the final selling price of a home to its initial listing price. A percentage of 111.9% implies that, on average, homes are selling for slightly higher than their initial asking price. This suggests that agents are pricing homes closer to the actual market value, as opposed to 2020, when most homes were selling 2050% higher than the asking price.
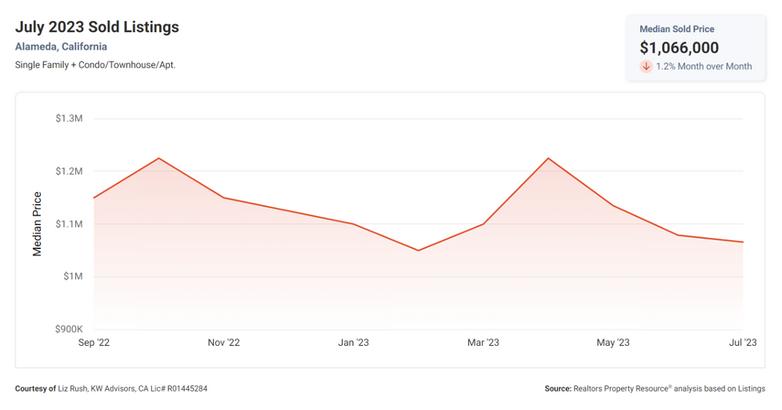
Lastly, let's talk about the "Median Sold Price," which gives us an idea of the midpoint price of recently sold homes. Currently, the median sold price stands at $1,066,000. This indicates that the market is seeing a relatively high average price for homes that are being sold.
If you are a buyer, this information suggests that you may face intense competition and must act quickly when finding a home. On the other hand, sellers may benefit from the current market conditions, as there is a demand for homes and the potential for higher selling prices.

Remember, these metrics provide a snapshot of Alameda's current real estate market. It’s always essential to consult with a real estate professional for a comprehensive analysis and personalized advice regarding your situation.

I hope you found this information helpful in navigating the real estate landscape. If you want information on another area in the East Bay, reach out, and I can create a market snapshot for you. Happy buying and selling!

