1.1 SOLUTIONS
1
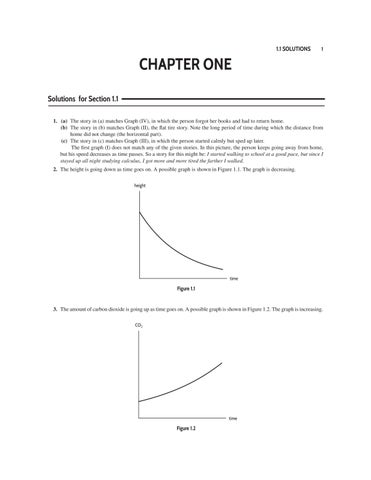
CHAPTER ONE Solutions for Section 1.1 1. (a) The story in (a) matches Graph (IV), in which the person forgot her books and had to return home. (b) The story in (b) matches Graph (II), the fat tire story. Note the long period of time during which the distance from home did not change (the horizontal part). (c) The story in (c) matches Graph (III), in which the person started calmly but sped up later. The frst graph (I) does not match any of the given stories. In this picture, the person keeps going away from home, but his speed decreases as time passes. So a story for this might be: I started walking to school at a good pace, but since I stayed up all night studying calculus, I got more and more tired the farther I walked. 2. The height is going down as time goes on. A possible graph is shown in Figure 1.1. The graph is decreasing. height
time
Figure 1.1
3. The amount of carbon dioxide is going up as time goes on. A possible graph is shown in Figure 1.2. The graph is increasing. CO2
time
Figure 1.2
2
Chapter One /SOLUTIONS 4. The number of air conditioning units sold is going up as temperature goes up. A possible graph is shown in Figure 1.3. The graph is increasing. AC units
temperature
Figure 1.3
5. The noise level is going down as distance goes up. A possible graph is shown in Figure 1.4. The graph is decreasing. noise level
distance
Figure 1.4
6. If we let t represent the number of years since 1900, then the population increased between t = 0 and t = 40, stayed approximately constant between t = 40 and t = 50, and decreased for t ≥ 50. Figure 1.5 shows one possible graph. Many other answers are also possible. population
20
40
60
years 80 100 120 since 1900
Figure 1.5
1.1 SOLUTIONS
3
7. Amount of grass G = f (r) increases as the amount of rainfall r increases, so f (r) is an increasing function. 8. We are given information about how atmospheric pressure P = f (ℎ) behaves when the altitude ℎ decreases: as altitude ℎ decreases the atmospheric pressure P increases. This means that as altitude ℎ increases the atmospheric pressure P decreases. Therefore, P = f (ℎ) is a decreasing function. 9. We are given information about how battery capacity C = f (T ) behaves when air temperature T decreases: as T decreases, battery capacity C also decreases. This means that increasing temperature T increases battery capacity C. Therefore, C = f (T ) is an increasing function. 10. Time T = f (m) increases as m increases, so f (m) is increasing. 11. The attendance A = f (P ) decreases as the price P increases, so f (P ) is a decreasing function. 12. The cost of manufacturing C = f (v) increases as the number of vehicles manufactured v increases, so f (v) is an increasing function. 13. We are given information about how commuting time, T = f (c) behaves as the number of cars on the road c decreases: as c decreases, commuting time T also decreases. This means that increasing the number of cars on the road c increases commuting time T . Therefore, T = f (c) is an increasing function. 14. The statement f (4) = 20 tells us that W = 20 when t = 4. In other words, in 2019, Argentina produced 20 million metric tons of wheat. 15. (a) If we consider the equation C = 4T − 160 simply as a mathematical relationship between two variables C and T , any T value is possible. However, if we think of it as a relationship between cricket chirps and temperature, then C cannot be less than 0. Since C = 0 leads to 0 = 4T − 160, and so T = 40 F, we see that T cannot be less than 40 F. In addition, we are told that the function is not defned for temperatures above 134 . Thus, for the function C = f (T ) we have Domain = All T values between 40 F and 134 F = All T values with 40 ≤ T ≤ 134 = [40, 134].
(b) Again, if we consider C = 4T − 160 simply as a mathematical relationship, its range is all real C values. However, when thinking of the meaning of C = f (T ) for crickets, we see that the function predicts cricket chirps per minute between 0 (at T = 40 F) and 376 (at T = 134 F). Hence, Range = All C values from 0 to 376 = All C values with 0 ≤ C ≤ 376 = [0, 376].
16. (a) The statement f (19) = 415 means that C = 415 when t = 19. In other words, in the year 2019, the concentration of carbon dioxide in the atmosphere was 415 ppm. (b) The expression f (22) represents the concentration of carbon dioxide in the year 2022. 17. (a) At p = 0, we see r = 8. At p = 3, we see r = 7. (b) When p = 2, we see r = 10. Thus, f (2) = 10. 18. Substituting x = 5 into f (x) = 2x + 3 gives f (5) = 2(5) + 3 = 10 + 3 = 13. 19. Substituting x = 5 into f (x) = 10x − x2 gives f (5) = 10(5) − (5)2 = 50 − 25 = 25. 20. We want the y-coordinate of the graph at the point where its x-coordinate is 5. Looking at the graph, we see that the y-coordinate of this point is 3. Thus f (5) = 3.
4
Chapter One /SOLUTIONS
21. Looking at the graph, we see that the point on the graph with an x-coordinate of 5 has a y-coordinate of 2. Thus f (5) = 2. 22. In the table, we must fnd the value of f (x) when x = 5. Looking at the table, we see that when x = 5 we have f (5) = 4.1 23. (a) We are asked for the value of y when x is zero. That is, we are asked for f (0). Plugging in we get f (0) = (0)2 + 2 = 0 + 2 = 2. (b) Substituting we get f (3) = (3)2 + 2 = 9 + 2 = 11. (c) Asking what values of x give a y-value of 11 is the same as solving y = 11 = x2 + 2 x2 = 9
√ x = ± 9 = ±3.
We can also solve this problem graphically. Looking at Figure 1.6, we see that the graph of f (x) intersects the line y = 11 at x = 3 and x = −3. Thus, when x equals 3 or x equals −3 we have f (x) = 11. y f (x)
11 x −6 −3
3
6
Figure 1.6 (d) No. No matter what, x2 is greater than or equal to 0, so y = x2 + 2 is greater than or equal to 2. 24. The year 2018 was 2 years before 2020 so 2018 corresponds to t = 2. Thus, an expression that represents the statement is: f (2) = 7.088.
25. The year 2020 was 0 years before 2020 so 2020 corresponds to t = 0. Thus, an expression that represents the statement is: f (0) meters. 26. The year 1949 was 2020 − 1949 = 71 years before 2020 so 1949 corresponds to t = 71. Similarly, we see that the year 2000 corresponds to t = 20. Thus, an expression that represents the statement is: f (71) = f (20).
27. The year 2018 was 2 years before 2020 so 2018 corresponds to t = 2. Similarly, t = 3 corresponds to the year 2017. Thus, f (3) and f (2) are the average annual sea level values, in meters, in 2017 and 2018, respectively. Because 11 millimeters is the same as 0.011 meters, the average sea level in 2018, f (2), is 0.011 less than the sea level in 2017 which is f (3). An expression that represents the statement is: f (2) = f (3) − 0.011. Note that there are other possible equivalent expressions, such as: f (2) − f (3) = −0.011.
1.1 SOLUTIONS
5
28. (a) Since the potato is getting hotter, the temperature is increasing. The temperature of the potato eventually levels o˙ at the temperature of the oven, so the best answer is graph (III). (b) The vertical intercept represents the temperature of the potato at time t = 0 or just before it is put in the oven. 29. (a) The graph shows that the yield increases as more kg of seeds are planted. Moreover the yield initially increases very rapidly but then levels o˙ at about 2.5 tons, meaning there is little beneft from continuing to increase the quantity of seed. (b) We see that at 80 kg the graph is almost a horizontal line, meaning that any additional seed planted will not impact the crop yield, so it is not worth the cost of planting additional seed. 30. (a) f (30) = 10 means that the value of f at t = 30 was 10. In other words, the temperature at time t = 30 minutes was 10 C. So, 30 minutes after the object was placed outside, it had cooled to 10 C. (b) The intercept a measures the value of f (t) when t = 0. In other words, when the object was initially put outside, it had a temperature of a C. The intercept b measures the value of t when f (t) = 0. In other words, at time b the object’s temperature is 0 C. 31. (a) Since N = f (ℎ), the statement f (500) = 100, means that if ℎ = 500, then N = 100. This tells us that at an elevation of 500 feet above sea level, there are 100 species of bats. (b) The vertical intercept k is on the N-axis, so it represents the value of N when ℎ = 0. The intercept, k, is the number of bat species at sea level. The horizontal intercept, c, represents the value of ℎ when N = 0. The intercept, c, is the lowest elevation above which no bats are found. 32. The number of species of algae is low when there are few snails or lots of snails. The greatest number of species of algae (about 10) occurs when the number of snails is at a medium level (around 125 snails per square meter.) The graph supports the statement that diversity peaks at intermediate predation levels, when there are an intermediate number of snails. 33. (a) From the graph, we estimate f (3) = 0.14. This means that after 3 hours, the level of nicotine is about 0.14 mg. (b) About 4 hours. (c) The vertical intercept is 0.4. It represents the level of nicotine in the blood right after the cigarette is smoked. (d) A horizontal intercept would represent the value of t when N = 0, or the number of hours until all nicotine is gone from the body. 34. (a) The original deposit is the balance, B, when t = 0, which is the vertical intercept. The original deposit was $1000. (b) It appears that f (10) 2200. The balance in the account after 10 years is about $2200. (c) When B = 5000, it appears that t 20. It takes about 20 years for the balance in the account to reach $5000. 35. (a) The statement f (10) = 0.2 means that C = 0.2 when t = 10. In other words, CFC consumption was 0.2 million tons in 1997. (b) The vertical intercept is the value of C when t = 0. It represents CFC consumption in 1987. (c) The horizontal intercept is the value of t when C = 0. It represents the year when CFC consumption is expected to be zero. 36. (a) The graph shows maximum range is about 78 miles and it occurs at approximately 65 F. (b) The graph is decreasing for temperatures above 65 F, so above 65 F, every increase in the temperature will reduce the range. 37. (a) We see that the defcit is decreasing during this time period. (b) The statement f (4) = 485 means that the defcit was 485 billion dollars in 2014. (c) We can estimate the location of 4 on the horizontal axis, since the graph covers 2011–2015, corresponding to 1 ≤ t ≤ 5. The value 485 on the vertical axis is then the corresponding y-coordinate. These values, and a dot at the corresponding point, are shown in Figure 1.7. billion $
D = f (t) 485
4
Figure 1.7
t (years since 2010)