Deal Capsule Transactions in Life Sciences & Chemicals July 2020
“
With more and more countries in temporary lockdown, M&A activity in Life Sciences and Chemicals clearly fell below last year’s level in Q2 2020. Yet, market conditions could be indicative of a cautious recovery.
”
CHRISTIAN KLINGBEIL | PARTNER, KPMG IN GERMANY
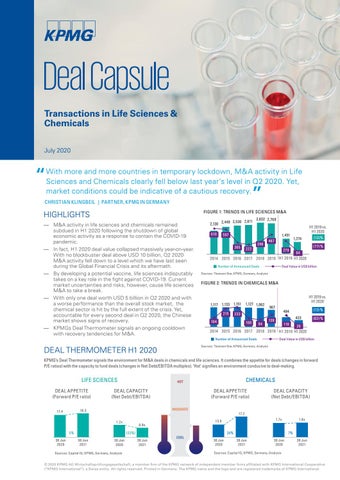
FIGURE 1: TRENDS IN LIFE SCIENCES M&A
HIGHLIGHTS — M&A activity in life sciences and chemicals remained subdued in H1 2020 following the shutdown of global economic activity as a response to contain the COVID-19 pandemic. — In fact, H1 2020 deal value collapsed massively year-on-year. With no blockbuster deal above USD 10 billion, Q2 2020 M&A activity fell down to a level which we have last seen during the Global Financial Crisis and its aftermath. — By developing a potential vaccine, life sciences indisputably takes on a key role in the fight against COVID-19. Current market uncertainties and risks, however, cause life sciences M&A to take a break. — With only one deal worth USD 5 billion in Q2 2020 and with a worse performance than the overall stock market, the chemical sector is hit by the full extent of the crisis. Yet, accountable for every second deal in Q2 2020, the Chinese market shows signs of recovery. — KPMGs Deal Thermometer signals an ongoing cooldown with recovery tendencies for M&A.
2,530 2,611 2,130 2,449 610
2,832 2,768
597
1,451 265
296
467
222
279
H1 2019 vs. H1 2020 (12)%
1,274
(77) % 64
2014 2015 2016 2017 2018 2019 H1 2019 H1 2020 Number of Announced Deals
Deal Value in US$ billion
Sources: Thomson One; KPMG, Germany, Analysis
FIGURE 2: TRENDS IN CHEMICALS M&A
1,117 1,133 1,151 215
1,127 1,062
H1 2019 vs. H1 2020 967
104
100
84
(13) %
484
233
423
139
110
(82) %
20
2014 2015 2016 2017 2018 2019 H1 2019 H1 2020 Number of Announced Deals
Deal Value in US$ billion
Sources: Thomson One; KPMG, Germany, Analysis
DEAL THERMOMETER H1 2020
KPMG’s Deal Thermometer signals the environment for M&A deals in chemicals and life sciences. It combines the appetite for deals (changes in forward P/E ratios) with the capacity to fund deals (changes in Net Debt/EBITDA multiples). ‘Hot’ signifies an environment conducive to deal-making.
LIFE SCIENCES DEAL APPETITE (Forward P/E ratio)
DEAL CAPACITY (Net Debt/EBITDA)
1.2x
0.8x
30 Jun 2021
30 Jun 2020
Sources: Capital IQ; KPMG, Germany, Analysis
DEAL CAPACITY (Net Debt/EBITDA)
17.2
7%
24% 30 Jun 2021
COOL
30 Jun 2020
1.8x
1.7x
13.9
(33%)
5% 30 Jun 2020
DEAL APPETITE (Forward P/E ratio) MODERATE
18.3
17.4
CHEMICALS
HOT
30 Jun 2021
30 Jun 2020
30 Jun 2021
Sources: Capital IQ; KPMG, Germany, Analysis
© 2020 KPMG AG Wirtschaftsprüfungsgesellschaft, a member firm of the KPMG network of independent member firms affiliated with KPMG International Cooperative (“KPMG International”), a Swiss entity. All rights reserved. Printed in Germany. The KPMG name and the logo and are registered trademarks of KPMG International.