Deal Capsule
After navigating a year of unprecedented headwinds, chemicals deal landscape rebounded strongly in 2021. Moderate valuations and portfolio optimisation with sustainability as a new focus area of investment, are expected to drive the M&A activity going forward.
CHRISTIAN KLINGBEIL | PARTNER, KPMG IN GERMANY
HIGHLIGHTS
Sustained tailwinds in specialty chemical and petrochemical subsectors drove the M&A activity in chemicals.
The focus of M&A activities was on enhancing portfolio and expanding the geographical footprint in existing and new end-markets.
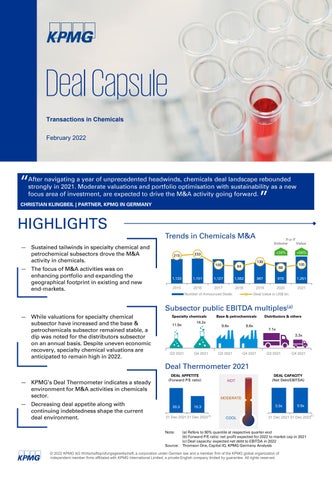
While valuations for specialty chemical subsector have increased and the base & petrochemicals subsector remained stable, a dip was noted for the distributors subsector on an annual basis. Despite uneven economic recovery, specialty chemical valuations are anticipated to remain high in 2022.
KPMG’s Deal Thermometer indicates a steady environment for M&A activities in chemicals sector.


Decreasing deal appetite along with continuing indebtedness shape the current deal environment.
Trends in Chemicals M&A
Deal Thermometer 2021
© 2022 KPMG AG Wirtschaftsprüfungsgesellschaft, a corporation under German law and a member firm of the KPMG global organization of independent member firms affiliated with KPMG International Limited, a private English company limited by guarantee. All rights reserved.
Transactions in Chemicals
February 2022
” “
public EBITDA
Subsector
multiples(a)
Y-o-Y Volume Value +28% +56% Q3 2021 Q3 2021 Q4 2021 Q3 2021 Q4 2021 Q4 2021 Note: (a) Refers to 90% quantile at respective quarter-end (b) Forward P/E ratio: net profit expected for 2022 to market cap in 2021 (c) Deal capacity: expected net debt to EBITDA in 2022 Source: Thomson One, Capital IQ, KPMG Germany Analysis Base & petrochemicals Distributors & others Specialty chemicals 0.9x 0.9x 31 Dec 2021 31 Dec 2022 20.3 15.3 31 Dec 2021 31 Dec 2022(b) (c) DEAL CAPACITY (Net Debt/EBITDA) DEAL APPETITE (Forward P/E ratio) HOT MODERATE COOL 7.1x 3.3x 11.9x 14.2x 9.6x 9.6x 1,133 1,151 1,127 1,062 967 979 1,251 215 233 100 84 139 68 105 0 500 1.000 1.500 2015 2016 2017 2018 2019 2020 2021 Number of Announced Deals Deal Value in US$ bn.