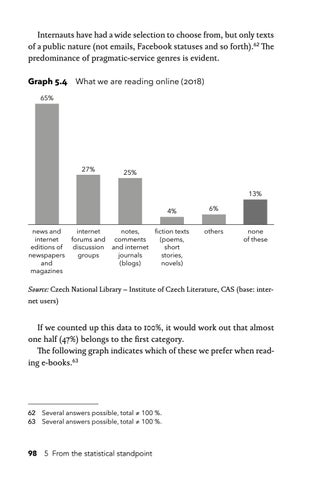
Internauts have had a wide selection to choose from, but only texts of a public nature (not emails, Facebook statuses and so forth).62 The predominance of pragmatic-service genres is evident. Graph 5.4 What we are reading online (2018) 65%
27%
25% 13% 4%
news and internet notes, fiction texts internet forums and comments (poems, editions of discussion and internet short newspapers groups journals stories, and (blogs) novels) magazines
6% others
none of these
Source: Czech National Library – Institute of Czech Literature, CAS (base: internet users)
If we counted up this data to 100%, it would work out that almost one half (47%) belongs to the first category. The following graph indicates which of these we prefer when reading e-books.63
62 Several answers possible, total ≠ 100 %. 63 Several answers possible, total ≠ 100 %.
98 5 From the statistical standpoint Ukázka elektronické knihy, UID: KOS290456
Graph 5.5 Which devices we use to read e-books (2018) 43% 39%
smartphone
computer/notebook
35%
34%
tablet
e-reader
Source: Czech National Library – Institute of Czech Literature, CAS (base: internet users)
Perhaps surprisingly the e-reader comes in last, even though we are asking specifically about e-books. However, this trend has recently (since about 2012) been evident all over the world, as its rise, starting in 2007 with the first version of Amazon’s Kindle, has come to a halt. Talking of the digital sphere, it only remains for us to look at how often we open books; here we present both printed books and audio-books for comparison. What do we find? That just less than one fifth of the adult population (19%) use e-books, and even fewer use audio-books (19%). The number of regular readers of printed books is eight times higher than the number of readers of e-books and 33 times higher than the number of audio-book listeners.
5 From the statistical standpoint 99 Ukázka elektronické knihy, UID: KOS290456
Graph 5.6 Printed books, e-books and audio-books – how often (2018) 22%
22% 82%
86%
22%
33%
10% 5%
printed books
4% e-books
2%
10%
1%
audio-books
never occasionally (once a fortnight) rarely (once a month, once a quater and less often) regularly (daily/several times a week)
Source: Czech National Library – Institute of Czech Literature, CAS (base: all)
READING AND OTHER MEDIA ACTIVITIES It is now about a century since reading lost its monopoly over information. Since around that time we have been living in media polygamy, and it has come to be just one of several media activities. Let us now imagine this “media pie-graph” of the number of minutes we spend on individual media during an average day, though it does have to be pointed out at the same time that it is becoming increasingly difficult to say where one medium begins and another one ends. The boundaries are getting blurred, particularly with regard to user behaviour. We watch television on the internet (live or from the archive), we listen to the radio, stream music and download movies from Netflix and YouTube. On the social networks we read articles 100 5 From the statistical standpoint Ukázka elektronické knihy