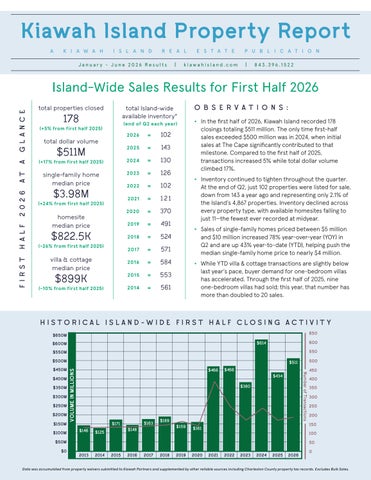
Island-Wide Sales Results for First Half 2026
total properties closed 178
(+5% from first half 2025)
total dollar volume
$511M
(+17% from first half 2025)
single-family home median price
$3.98M
(+24% from first half 2025)
homesite median price
$822.5K
(-26% from first half 2025 )
villa & cottage median price
$899K
(-10% from first half 2025)
total Island-wide available inventory* (end of Q2 each year)
OBSERVATIONS:
• In the first half of 2026, Kiawah Island recorded 178 closings totaling $511 million. The only time first-half sales exceeded $500 million was in 2024, when initial sales at The Cape significantly contributed to that milestone. Compared to the first half of 2025, transactions increased 5% while total dollar volume climbed 17%.
• Inventory continued to tighten throughout the quarter. At the end of Q2, just 102 properties were listed for sale, down from 143 a year ago and representing only 2.1% of the Island’s 4,867 properties. Inventory declined across every property type, with available homesites falling to just 11—the fewest ever recorded at midyear.
• Sales of single-family homes priced between $5 million and $10 million increased 78% year-over-year (YOY) in Q2 and are up 43% year-to-date (YTD), helping push the median single-family home price to nearly $4 million.
• While YTD villa & cottage transactions are slightly below last year’s pace, buyer demand for one-bedroom villas has accelerated. Through the first half of 2025, nine one-bedroom villas had sold; this year, that number has more than doubled to 20 sales.
HISTORICAL
ISLAND-WIDE FIRST HALF CLOSING ACTIVITY
FIRST HALF 2026 KIAWAH ISLAND CLOSINGS SNAPSHOT
ISLAND-WIDE INVENTORY COMPARISON
KIAWAH ISLAND REAL ESTATE SALES DATA
President Dan Whalen's Note:
It has been an outstanding first half of 2026 for Kiawah Island Real Estate. YTD, KIRE has closed 112 transactions totaling $383.3 million—a 3.7% increase in transactions and a 13.9% increase in sales volume YOY. Those results represent 76% of the Island’s total sales volume.
One of the year’s defining trends has been the strength of the luxury market, particularly the increase in homes sold between $5 million and $10 million. While the release of Ocean Pines Phase Two residences has provided buyers with welcomed new inventory, overall supply remains exceptionally limited.
With only 2.1% of Kiawah Island’s properties currently on the market and buyer demand continuing to outpace available inventory, today’s market presents a compelling opportunity for property owners considering a sale. If you’ve been thinking about selling, we’d love to provide an up-to-date assessment of your property’s value.