Kiawah Island Property Report A
K I A W A H
I S L A N D
R E A L
2026 First Quarter Results
|
E S T A T E
kiawahisland.com
P U B L I C A T I O N
|
843.396.1522
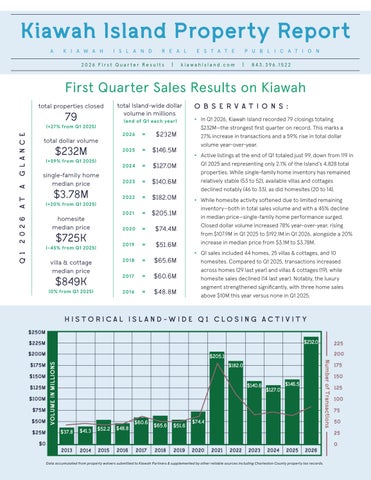
First Quarter Sales Results on Kiawah total properties closed
79
(end of Q1 each year)
total dollar volume
$232M
A
(+59% from Q1 2025)
single-family home median price
AT
G L A N C E
(+27% from Q1 2025)
(+20% from Q1 2025)
$3.78M
2 0 2 6
homesite median price
$725K
(-45% from Q1 2025)
Q 1
total Island-wide dollar volume in millions
villa & cottage median price
$849K
(0% from Q1 2025)
O B S E R V AT I O N S : • In Q1 2026, Kiawah Island recorded 79 closings totaling $232M—the strongest first quarter on record. This marks a
2026
=
$232M
2025
=
$146.5M
2024
=
$127.0M
Q1 2025 and representing only 2.1% of the Island’s 4,828 total
2023
=
$140.6M
relatively stable (53 to 52), available villas and cottages
• While homesite activity softened due to limited remaining
2022
=
$182.0M
2021
=
$205.1M
2020
=
$74.4M
2 0 19
=
$51.6M
2018
=
$65.6M
2017
=
$60.6M
2 0 16
=
$48.8M
27% increase in transactions and a 59% rise in total dollar volume year-over-year.
• Active listings at the end of Q1 totaled just 99, down from 119 in properties. While single-family home inventory has remained declined notably (46 to 33), as did homesites (20 to 14). inventory—both in total sales volume and with a 45% decline in median price—single-family home performance surged. Closed dollar volume increased 78% year-over-year, rising from $107.9M in Q1 2025 to $192.1M in Q1 2026, alongside a 20% increase in median price from $3.1M to $3.78M.
• Q1 sales included 44 homes, 25 villas & cottages, and 10 homesites. Compared to Q1 2025, transactions increased across homes (29 last year) and villas & cottages (19), while homesite sales declined (14 last year). Notably, the luxury segment strengthened significantly, with three home sales above $10M this year versus none in Q1 2025.
HISTORICAL ISL AND-WI DE Q1 CLOSING ACTIVIT Y $250M $232.0
$225M $200M
$125M $100M $75M $50M $25M $0
VOLUME IN MILLIONS
$150M
200
$205.1
Number of Transactions
$175M
225
$182.0
$140.6
$37.8
$41.3
$52.2
2013
2014
2015
$48.8
2016
$60.6
$65.6
$51.6
$127.0
$146.5
$74.4
175 150 125 100 75 50 25
2017
2018
2019
2020
2021
2022
2023
2024
2025
2026
Data accumulated from property waivers submitted to Kiawah Partners & supplemented by other reliable sources including Charleston County property tax records.
0