Kiawah Island Property Report A
K I A W A H
I S L A N D
R E A L
|
2025 Results in Review
E S T A T E
kiawahisland.com
P U B L I C A T I O N
|
843.396.1522
YEAR-END ISLAND-WIDE SALES RESULTS FOR 2025 total properties closed
335
2 02 5
=
$851.0M
2 02 4
=
$1.07B*
2 023
=
$735.0M
single-family home median price
2 02 2
=
$742.0M
$3.4M
2 021
=
$1.04B
(+14% from 2024)
2 02 0
=
$807.3M
homesite median price
2 019
=
$300.4M
$995k
2 01 8
=
$376.0M
(+47% from 2024)
2 017
=
$321.1M
villa & cottage median price
2 016
=
$312.2M
2 01 5
=
$362.3M
2 014
=
$311.3M
$851M
$913k
(-37% from 2024)*
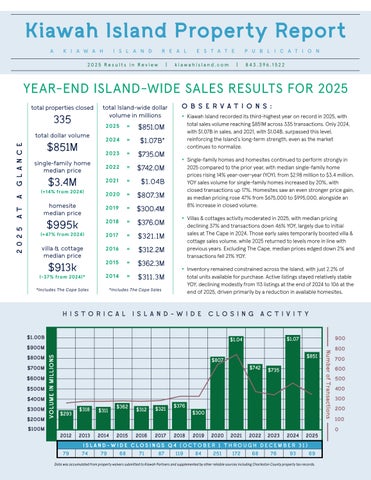
O B S E R V AT I O N S : • Kiawah Island recorded its third-highest year on record in 2025, with
total sales volume reaching $851M across 335 transactions. Only 2024, with $1.07B in sales, and 2021, with $1.04B, surpassed this level, reinforcing the Island’s long-term strength, even as the market continues to normalize.
• Single-family homes and homesites continued to perform strongly in
2025 compared to the prior year, with median single-family home prices rising 14% year-over-year (YOY), from $2.98 million to $3.4 million. YOY sales volume for single-family homes increased by 20%, with closed transactions up 17%. Homesites saw an even stronger price gain, as median pricing rose 47% from $675,000 to $995,000, alongside an 8% increase in closed volume.
• Villas & cottages activity moderated in 2025, with median pricing
declining 37% and transactions down 46% YOY, largely due to initial sales at The Cape in 2024. Those early sales temporarily boosted villa & cottage sales volume, while 2025 returned to levels more in line with previous years. Excluding The Cape, median prices edged down 2% and transactions fell 21% YOY.
• Inventory remained constrained across the Island, with just 2.2% of
total units available for purchase. Active listings stayed relatively stable YOY, declining modestly from 113 listings at the end of 2024 to 106 at the end of 2025, driven primarily by a reduction in available homesites.
*Includes The Cape Sales
*Includes The Cape Sales
H I S TOR I C AL
I SL AN D -W I DE
C LOS I N G
$1.00B
AC T I V I T Y
900
$1.07
$1.04
$800M $700M $600M $500M $400M $300M $200M $100M
$851
$807 $742
$293
$318
2012
2013
79
74
$311
2014
$362
2015
$312
2016
$321
2017
$735
$376 $300
2018
2019
2020
2021
2022
2023
2024
2025
ISLAND-WIDE CLOSINGS Q4 (OCTOBER 1 THROUGH DECEMBER 31) 79
68
71
87
119
84
251
172
68
76
93
69
Data was accumulated from property waivers submitted to Kiawah Partners and supplemented by other reliable sources including Charleston County property tax records.
Number of Transactions
$900M
VOLUME IN MILLIONS
AT
A
G L A N C E
total dollar volume
2 0 2 5
total Island-wide dollar volume in millions
800 700 600 500 400 300 200 100 0