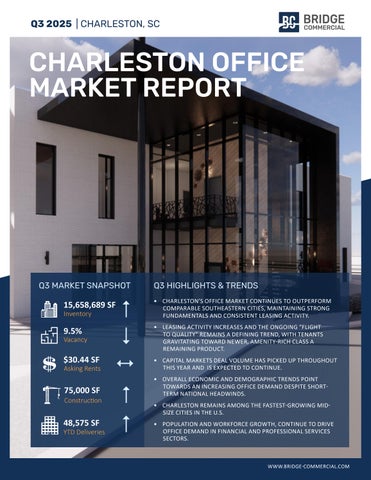
Q3 2025 | CHARLESTON, SC
CHARLESTON OFFICE MARKET REPORT
Q3 MARKET SNAPSHOT
Q3 HIGHLIGHTS & TRENDS
15,658,689 SF
• CHARLESTON’S OFFICE MARKET CONTINUES TO OUTPERFORM COMPARABLE SOUTHEASTERN CITIES, MAINTAINING STRONG FUNDAMENTALS AND CONSISTENT LEASING ACTIVITY.
9.5%
• LEASING ACTIVITY INCREASES AND THE ONGOING “FLIGHT TO QUALITY” REMAINS A DEFINING TREND, WITH TENANTS GRAVITATING TOWARD NEWER, AMENITY-RICH CLASS A REMAINING PRODUCT.
$30.44 SF
Asking Rents
• CAPITAL MARKETS DEAL VOLUME HAS PICKED UP THROUGHOUT THIS YEAR AND IS EXPECTED TO CONTINUE.
75,000 SF
• OVERALL ECONOMIC AND DEMOGRAPHIC TRENDS POINT TOWARDS AN INCREASING OFFICE DEMAND DESPITE SHORTTERM NATIONAL HEADWINDS.
Inventory
Vacancy
Construction
48,575 SF
YTD Deliveries
• CHARLESTON REMAINS AMONG THE FASTEST-GROWING MIDSIZE CITIES IN THE U.S. • POPULATION AND WORKFORCE GROWTH, CONTINUE TO DRIVE OFFICE DEMAND IN FINANCIAL AND PROFESSIONAL SERVICES SECTORS.
WWW.BRIDGE-COMMERCIAL.COM
Q3 2025 charleston OFFICE MARKET REPORT
SUBMARKET SUMMARY UNDER CONSTRUCTION PROPOSED CONSTRUCTION
78 52
UPPER NORTH CHARLESTON 9.8% Vacant $24.49 FS
17A
MOUNT PLEASANT
26
DANIEL ISLAND
5.6% Vacant $36.33 FS
19.0% Vacant $29.16 FS
SUMMERVILLE 5.1% Vacant $31.47 FS
526
LOWER NORTH CHARLESTON
17
10.9% Vacant $26.31 FS
WEST ASHLEY
17
DOWNTOWN 6.7% Vacant $41.53 FS
9.4% Vacant $30.05 FS
TOTAL INVENTORY SF
DIRECT VACANT SF
SUBLEASE VACANT SF
TOTAL VACANT SF
WEIGHTED ASKING RENT
Downtown/Class A
2,268,459
147,300
12,099
159,399
$44.24
7.0%
-
-
TOTAL DOWNTOWN
3,554,513
223,502
13,019
236,521
$41.53
6.7%
-
-
Daniel Island
1,878,736
142,616
213,669
356,285
$29.16
19.0%
-
-
Lower North Charleston
3,161,108
287,365
56,907
344,272
$26.31
10.9%
-
-
Upper North Charleston
2,555,810
163,919
87,540
251,459
$24.49
9.8%
-
-
Mount Pleasant
2,245,676
93,621
31,472
125,093
$36.33
5.6%
-
10,000
Summerville
1,087,562
55,889
-
55,889
$31.47
5.1%
75,000
48,575
West Ashley
1,175,284
110,912
-
110,912
$30.05
9.4%
-
TOTAL SUBURBAN
12,104,176
854,322
389,588
1,243,910
$27.49
10.3%
75,000
58,575
TOTAL MARKET
15,658,689
1,077,824
402,607 1,480,431
$30.44
9.5%
75,000
58,575
SUBMARKET
UNDER VACANCY CONSTRUCTION RATE SF
Bridge tracks buildings 10,000 SF and greater, excluding medical office and user-owned buildings. Bridge uses only internal research within its Charleston office for market research reporting. PG. 2
YTD DELIVERIES SF
-
Source: Bridge Commercial WWW.BRIDGE-COMMERCIAL.COM
Q3 2025 charleston OFFICE MARKET REPORT
CHARLESTON’S OFFICE MARKET HEATS UP AS DEMAND OUTPACES SUPPLY
LEASING ACTIVITY PICKS UP THROUGHOUT THE REGION
Q3 2025 RECAP • Leasing activity has gained momentum across the region, with both downtown and suburban submarkets seeing increased tenant demand, driven by new deliveries, adaptive reuse projects, and continued interest from growing industries. • Positive absorption has persisted through Q3, reflecting steady tenant expansion and limited moveouts. • Overall vacancy is down to 9.5%, well below national and regional averages. • Most submarkets are now back to single digit vacancy: Downtown (6.7%), Mount Pleasant (5.6%), Summerville (5.1%), Upper North Charleston (9.8%), and West Ashley (9.4%).
700 NEXTON SQUARE Regus leases approximately 25,000 SF of space at 700 Nexton Square in Summerville.
Photo courtesy of Regus.com
• Class A properties and new construction projects continue to command $50–$60/SF Full Service Rents, highlighting demand for premier space. • Newer developments on the Upper Peninsula, including Morrison Yard (135,000 SF) and The Morris (106,000 SF), are fully leased. • Renovated, well-located Class B buildings are seeing renewed activity as tenants look for cost-sensitive alternatives.
CONSTRUCTION & DEVELOPMENT SURGES AHEAD
ASHLEY OVERLOOK Southeastern College leased 36,417 SF of space at Ashley Overlook in North Charleston. Photo courtesy of CBRE
• Suburban growth continues to be anchored by Nexton. Ongoing projects include The HUB Building 2, scheduled for completion in Q4 2025, and Dayfield Park Phase 2, expected in Q2 2026. • Atelier Phase 1 is now complete, with Phase 2 underway, signaling continued demand for high-end suburban product. • Adaptive reuse remains a development theme; projects such as The Navy Yard and 200 Meeting Street, exemplify the trend toward repositioning unique, well-located properties. • Developers are responding to sustained demand. Approximately 300,000 SF of new office space is planned or proposed on the Upper Peninsula (including Magnolia, Flagship II, and Courier Square).
174 MEETING STREET GSA leases 15,039 SF at 174 Meeting Street in Downtown Charleston.
INVESTMENT SALES ARE ON THE RISE • Office investment volume has rebounded with approximately $346 million traded over the past 12 months, up 50% year over year. • While most transactions remain under $20 million, regional capital are re-entering for value-add plays. • Fourthline Capital’s acquisition of 200 Meeting Street for $45.75 million, or $300 per square foot, demonstrates investor confidence in Charleston’s office market. BRIDGE-COMMERCIAL.COM
880 ISLAND PARK DRIVE Jones Trading leases 11,419 SF at 880 Island Park Drive on Daniel Island. Photo courtesy of Loopnet
PG. 3
Q3 2025 charleston OFFICE MARKET REPORT
OFFICE OPPORTUNITIES
Faber Pointe OFFICE SPACE FOR LEASE 4105 FABER PLACE DRIVE, NORTH CHARLESTON, SC 29405
THE HUB (PHASE 2) Summerville 43,675 SF Available
174 MEETING Downtown 4,000 - 14,502 SF Available
THE LANDING Daniel Island 23,759 SF Available
ATELIER Summerville 9,000 SF Available
FABER POINTE North Charleston 6,459 SF Available
DAYFIELD PARK Summerville 2,000 - 10,000 SF Available
TOWN @COOPER Clements Ferry 5,000 - 36,000 SF Available
Developed, Leased and Managed by Holder Properties
FABER CROSSING North Charleston 2,975 SF Available OFFICE SPACE FOR LEASE
2,032 RSF - 34,816 RSF CLASS A OFFICE
MARK MATTISON SIOR, CCIM
Executive Vice President +1 843 437 1545 mark.mattison@bridge-commercial.com
OFFICE ADVISORS
$28.00 RSF FULL SERVICE
LOCATED IN HIGHLY SOUGHT-AFTER EXECUTIVE PARK AT FABER PLACE
COLBY FARMER
Associate +1 978 998 9243 colby.farmer@bridge-commercial.com
MICHAEL KELLY
Associate +1 843 568 2970 michael.kelly@bridge-commercial.com
WWW.BRIDGE-COMMERCIAL.COM MARK A. MATTISON, CCIM, SIOR Executive Vice President mark.mattison@bridge-commercial.com
PETER FENNELLY, MCR, SIOR, SLCR President peter.fennelly@bridge-commercial.com COLBY FARMER Associate Vice President colby.farmer@bridge-commercial.com DANIEL PELLEGRINO Executive Vice President daniel.pellegrino@bridge-commercial.com MATT JOHNSON Associate matt.johnson@bridge-commercial.com
INVESTMENT SALES HAGOOD S. MORRISON, II, SIOR Executive Vice President hs.morrison@bridge-commercial.com
SIGN UP FOR MARKET REPORTS AT BRIDGE-COMMERCIAL.COM BRIDGE COMMERCIAL 25 Calhoun Street, Suite 220 Charleston, SC 29401 Tel +1 843 535 8600 info@bridge-commercial.com Bridge Commercial uses only internal research within its Charleston office for its market data. Bridge Commercial makes no guarantees, representations or warranties of any kind, expressed or implied, including warranties of content, accuracy and reliability. Any interested party should do their own research as to the accuracy of the information. Bridge Commercial excludes warranties arising out of this document and excludes all liability for loss and damages arising out of this document.