Q2 2023
GLEN ELLYN
LOCAL REAL ESTATE GUIDE


METHODOLOGY
Overview of Terms and Glen Ellyn Submarkets
CLOSED:closed transaction reflecting the final sales price (does not include any seller credits)
CONTRACTED:contingent or pending transaction reflecting the latest asking price
CONTRACT TIME:number of days between the first list date and the contracted date (does not include time from contract to close)
HOME INVENTORY:number of homes currently available for sale
MEDIAN:middle value of a given dataset (all report values are medians, which are less impacted by outliers than averages)
PRICE DISCOUNTS:percentage difference between the initial list and recorded sale price
PRICE PER SQ. FT:ratio of the median price to the median sq. footage of a closed transaction as a relative price measure
NORTHWEST (West of Main St. / North of Pennsylvania Ave. to St. Charles Rd.)
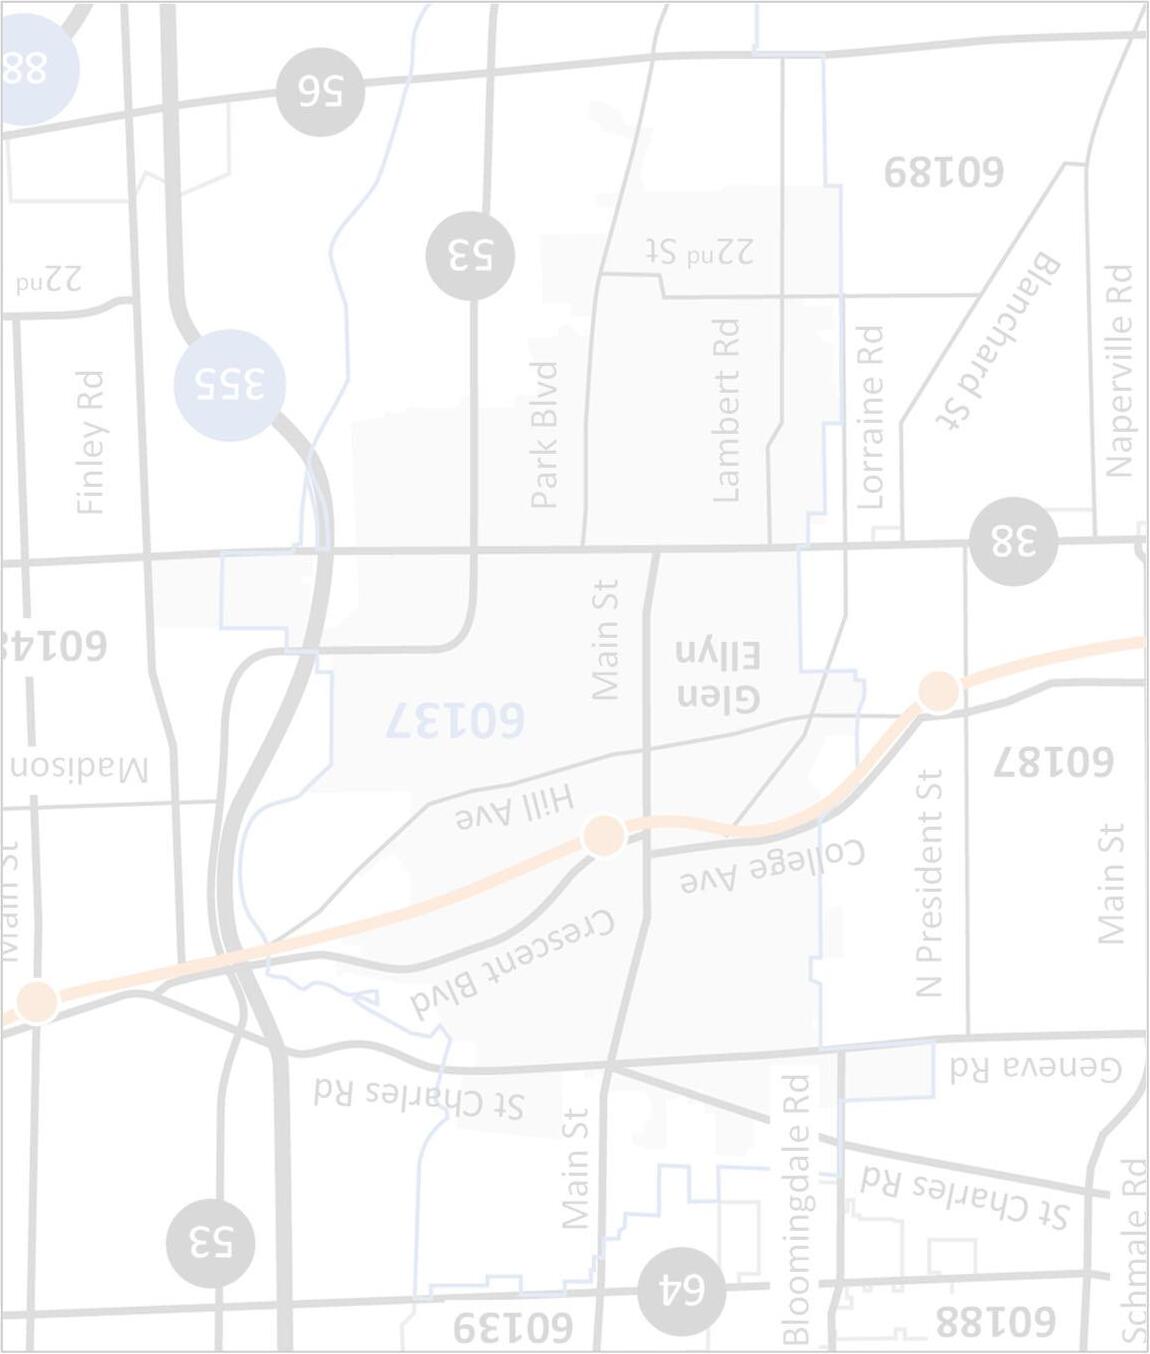
NORTHEAST
(East of Main St. / North of Crescent Blvd. to St. Charles Rd. )
CENTRAL WEST (West of Park Blvd. / South of Pennsylvania Ave. to Roosevelt Rd.)
CENTRAL EAST (East of Park Blvd. / South of Crescent Blvd. to Roosevelt Rd.
SOUTH (South of Roosevelt Rd.)
Note: All figures represent detached single-family homes unless otherwise specified. Price range data based on the village of Glen Ellyn. Submarket figures based on the approximate areas identified on map above and do not include every home within village limits.
2
MARKET SUMMARY
“Seller’s Market” Continues in Late Spring / Early Summer


Short Market Times List to Contract Days (Q2) Less than a week across price ranges and submarkets, except Central East (slightly longer) Limited Price Discounts Sale Price Discounts (Q2) Majority of homes across price ranges and submarkets selling at or above asking price
Sale Prices Sale Price / Price Per Sq. Ft. (Q2) Home Inventory (June) 42% “Seller’s market” with 15+ year low of available homesthis time of year Fewer Available Homes Lower Activity New Home Listings (Q2) Contracted Homes (Q2) 18% 40% Closed Homes (Q2) 12% 3
Overall flat relative prices, but some variability in price ranges and submarkets Flattening
NEW LISTINGS
 By Price Range
New listings were down 40% in Q2 with the largest declines concentrated in the middle of the market ($400K –$800K range)
Overall listing activity now back to 2013 levels or lower; homes priced below $400K are down dramatically with rising values
What looked like a listings bottom with more activity in Q1 gave way to further declines
Rolling Last 12 Months (YoY%)
Apr. –Jun. (YoY%) 4
132 178 91 99 0 100 200 300 400 500 '08 '09 '10 '11 '12 '13 '14 '15 '16 '17 '18 '19 '20 '21 '22 '23 <$400K $400K –$599K $600K –$799K $800K+ (-33%) (-27%) (-19%) (-13%) Price Range'23'22% <$400K 3751-27% $400K - $599K 4288-52% $600K - $799K 2145-53% $800K+ 3541-15%
By Submarket
Q2 experienced lower new listing activity across submarkets
Large increase in Northwest for Q1 kept this submarket higher for the last 12 months even after recent declines
South submarket declined dramatically with less than 10 total new listings in Q2
Northwest 2440-40% Northeast 1014-29% Central West 3141-24% Central East 1835-49%
Apr. –Jun. (YoY%)
5
Rolling Last 12 Months (YoY%) 102 26 94 84 45 0 50 100 150 200 250 300 '08 '09 '10 '11 '12 '13 '14 '15 '16 '17 '18 '19 '20 '21 '22 '23 Northwest Northeast Central West Central East South (-46%) (+3%) (-18%) (-51%) (-31%) Submarket'23'22%
South 935-74%
CONTRACTED HOMES
 Price
Price
Contracted homes declined nearly 20% for the quarter; homes priced under $400K increased some following major declines
Month of June experienced the largest monthly decline (almost 30%) after a soft April and flatter May
Contracts likely to decline based on fewer new listings and low inventory Apr.
–Jun. (YoY%) 6
110 138 65 58 0 50 100 150 200 250 300 '08 '09 '10 '11 '12 '13 '14 '15 '16 '17 '18 '19 '20 '21 '22 '23 <$400K $400K –$599K $600K –$799K $800K+ (-22%) (-22%) (-20%) (-37%)
<$400K
$400K - $599K 3549-29% $600K - $799K
$800K+
By
Range Rolling Last 12 Months (YoY%)
Price Range'23'22%
333010%
1924-21%
2433-27%
Glen Ellyn submarkets were lower for Q2; two areas had less than 10 contracts
Significant increases following the pandemic have returned to historical contract levels (below in some cases)
Northeast submarket has the lowest level of contract activity generally (also the smallest map area analyzed)
Northwest Northeast Central West
Central East South
Submarket'23'22%
Northwest 2125-16%
Northeast 710-30%
Central West 2627-4%
Central East 1317-24%
South 718-61%
7
Apr. –Jun. (YoY%) (-23%) 58 17 68 70 37 0 50 100 150 200 '08 '09 '10 '11 '12 '13 '14 '15 '16 '17 '18 '19 '20 '21 '22 '23
By Submarket Rolling Last 12 Months (YoY%)
(-47%) (-19%) (-24%) (-38%)
CLOSED HOMES

Closed homes declined over 10% in Q2 primarily driven by higher end homes over $800K (down nearly 50%)
April closings increased slightly following more activity in the first quarter, but fell 15%+ during May and June
Closing activity following overall declines in contracts with low home availability Apr.
–Jun. (YoY%) 8
Last 12 Months (YoY%) 115 144 62 66 0 50 100 150 200 250 300 '08 '09 '10 '11 '12 '13 '14 '15 '16 '17 '18 '19 '20 '21 '22 '23 <$400K $400K –$599K $600K –$799K $800K+ (-24%) (-20%) (-30%) (-32%)
<$400K
$400K - $599K
$600K - $799K
$800K+
By Price Range Rolling
Price Range'23'22%
282040%
4853-9%
22220%
2039-49%
Glen Ellyn submarkets mostly lower for Q2, except Central West (flat)
Central areas remain the most active for closings and held up better than other submarkets for the quarter
Closed activity now trending below prepandemic levels over the last 12 months
9
Rolling Last 12 Months (YoY%) Apr. –Jun. (YoY%) 59 19 70 73 41 0 50 100 150 200 '08 '09 '10 '11 '12 '13 '14 '15 '16 '17 '18 '19 '20 '21 '22 '23 Northwest Northeast Central West Central East South (-32%) (-18%) (-23%) (-40%) (-24%) Submarket'23'22% Northwest 1824-25% Northeast 58-38% Central West 26260% Central East 2022-9% South 717-59%
By Submarket
HOME INVENTORY
By Price Range
Available homes declined over 40% in Q2 from levels that were already historically low
Homes priced over $800K currently represent 45%+ of all inventory with this price range increasing and others falling
Scarce inventory expected to continue driving “seller’s market” conditions

Jun. Trends (Relative%)
Jun. Quarter End (YoY%)
29% 22% 24% 23% 16% 24% 23% 28% 37% 26% 20% 21% 17% 25% 11% 27% 34% 31% 15% 47% 0% 25% 50% 75% 100% '19'20'21'22'23 <$400K $400K –$599K $600K –$799K $800K+
10
6 10 4 18 0 25 50 75 100 125 150 '08 '09 '10 '11 '12 '13 '14 '15 '16 '17 '18 '19 '20 '21 '22 '23 <$400K $400K –$599K $600K –$799K $800K+ (-58%) (-60%) (-75%) (+80%)
By Submarket
Home inventory is down meaningfully across submarkets, despite North areas avoiding further declines
Extremely limited home availability in all areas (10 homes or less in all submarkets)
Mix of inventory is atypical given how few homes are available across Glen Ellyn
Jun. Trends (Relative%)
Jun. Quarter End (YoY%)
Northwest Northeast Central West Central East South
Northwest
23% 21% 18% 19% 31% 14% 14% 14% 4% 10% 19% 23% 31% 32% 34% 31% 34% 23% 26% 17% 15% 8% 13% 19% 7% 0% 25% 50% 75% 100% '19'20'21'22'23
Northeast Central West Central East South
11
9 3 10 5 2 0 20 40 60 80 '08 '09 '10 '11 '12 '13 '14 '15 '16 '17 '18 '19 '20 '21 '22 '23
(+50%) (0%) (-33%) (-78%) (-58%)
CONTRACT TIME
By Price Range

Days between listing date and contract signing have been low (mostly less than two weeks) for a couple years
During Q2 homes mostly matched last year (only a day difference) by going under contract in under a week across price ranges
Expect contract times to remain short with very limited home availability
Apr. –Jun. (YoY%) 12
Last
Months (YoY%) 9 7 5 6 0 25 50 75 100 125 150 175 '08 '09 '10 '11 '12 '13 '14 '15 '16 '17 '18 '19 '20 '21 '22 '23 <$400K $400K –$599K $600K –$799K $800K+ (+17%) (0%) (-38%) (0%) Price Range'23'22% <$400K 6520% $400K - $599K 5425% $600K - $799K 5425% $800K+ 5425%
Rolling
12
By Submarket
Contract times were fast during the quarter with fewer closings
Days to contract trend is mostly flat overall with a small movement creating large percentage changes
Homes on the market for more than two weeks could be overpriced or have other factors impacting time / interest
13
Apr. –Jun. (YoY%) 7 4 9 7 11 0 25 50 75 100 125 '08 '09 '10 '11 '12 '13 '14 '15 '16 '17 '18 '19 '20 '21 '22 '23 Northwest Northeast Central West Central East South (-64%) (-36%) (0%) (+120%) (0%) Submarket'23'22% Northwest 6520% Northeast 48-50% Central West 5425% Central East 94125% South 34-25%
Rolling Last 12 Months (YoY%)
PRICE DISCOUNTS
Price discounts were limited in Q2 with most homes sold at asking price or a slight premium
Homes priced below $400K continued to have a very minor discount (2% or less) over the last 12 months
Price discounts expected to remain narrow given limited home inventory

Apr. –Jun. (YoY%) 14
Last
Months
98% 100% 100% 100% 80% 85% 90% 95% 100% '08 '09 '10 '11 '12 '13 '14 '15 '16 '17 '18 '19 '20 '21 '22 '23 <$400K $400K –$599K $600K –$799K $800K+ (0%) (0%) (0%) (0%) Price Range'23'22% <$400K 100%99%1% $400K - $599K 101%101%0% $600K - $799K 102%102%0% $800K+ 101%101%0%
By Price Range Rolling
12
(YoY%)
By Submarket
All Glen Ellyn submarkets experienced full asking price or more for closed sales during the quarter
While only one area (Northeast) saw a higher premium versus last year, each submarket showed strong closing prices
Despite Q1 showing some negotiability, discounts mostly disappeared in the spring and early summer
Apr. –Jun. (YoY%)
Submarket'23'22%
Northwest 100%101%-1%
Northeast 101%99%2%
Central West 101%102%-1%
Central East 100%101%-1%
South 102%105%-4%
Rolling Last 12 Months (YoY%)
99% 100% 99% 99% 98% 80% 85% 90% 95% 100% '08 '09 '10 '11 '12 '13 '14 '15 '16 '17 '18 '19 '20 '21 '22 '23
Northwest Northeast Central West Central East South
15
(+2%) (-1%) (0%) (-2%) (0%)
PRICE PER SQ. FT.
 By Price Range
Price per sq. ft. was roughly flat in Q2 with the middle of the market ($400K –$800K) increasing and the ends slightly softening
Relative prices set new records from $400K –$800K for the last 12 months after the strong quarter
While price growth is mixed, above $400K continues to remain strong
16
Rolling Last 12 Months (YoY%) Apr. –Jun. (YoY%) $204 $252 $276 $313 $75 $125 $175 $225 $275 $325 '08 '09 '10 '11 '12 '13 '14 '15 '16 '17 '18 '19 '20 '21 '22 '23 <$400K $400K –$599K $600K –$799K $800K+ (+6%) (-5%) (+13%) (+11%) Price Range'23'22% <$400K $217$224-3% $400K
$599K $255$2464% $600K
$799K $279$24813% $800K+ $311$315-1%
-
-
Most submarkets were up for the quarter, except the Western areas
Strong increase for Northeast again in Q2 despite lower overall closed sale prices (driven by home size mix); also represents only 5 transactions
Central West declined in Q2 and had the largest drop in overall closed sale prices
17
Apr. –Jun. (YoY%) $266 $319 $282 $301 $223 $100 $125 $150 $175 $200 $225 $250 $275 $300 $325 '08 '09 '10 '11 '12 '13 '14 '15 '16 '17 '18 '19 '20 '21 '22 '23
(+22%) (0%) (+8%) (+2%) (+12%)
Northeast
Central
Central East
South $228$2223%
By Submarket Rolling Last 12 Months (YoY%)
Northwest Northeast Central West Central East South
Submarket'23'22% Northwest $265$295-10%
$347$29418%
West $275$298-8%
$318$3016%
CLOSED SALE PRICES
By Submarket

Overall sale prices were mostly lower for Q2, except Central East and South
Central East and South are also the only submarkets higher over the last 12 months
South remains on the lower end of prices
Low closed volume and home mix resulting in declines (price per sq. ft. a better metric)
Apr. –Jun. (YoY%)
Submarket'23'22%
Northwest $588K$763K-23%
Northeast $762K$908K-16%
Central West $465K$658K-29%
Central East $825K$772K7%
South $450K$430K5%
Rolling Last 12 Months (YoY%)
$525 $785 $526 $690 $451 $250 $350 $450 $550 $650 $750 $850 $950 '08 '09 '10 '11 '12 '13 '14 '15 '16 '17 '18 '19 '20 '21 '22 '23 Northwest Northeast Central West Central East South K (-4%) K (-5%) K (-8%) K (+5%)
K K K K 18
K K K (+16%) K K
CLOSED SALE VOLUME
By Submarket

Overall closed sale volume for Glen Ellyn was down 20%+ for the quarter and now 25%+ lower over the last 12 months
Central East (largest map area) was the only submarket that increased overall sales volume in Q2
Central submarkets remain the largest sale volume areas in Glen Ellyn
Apr. –Jun. (YoY%)
Submarket'23'22%
Northwest $11M$18M-37%
Northeast $5M$9M-50%
Central West $13M$19M-33%
Central East $18M$17M7%
South $3M$8M-56%
Rolling Last 12 Months (YoY%)
$34 $18 $42 $54 $20 $0 $25 $50 $75 $100 $125 '08 '09 '10 '11 '12 '13 '14 '15 '16 '17 '18 '19 '20 '21 '22 '23
West Central East South M (-29%) M (-23%) M (-28%)
Northwest Northeast Central
M (-16%)
M M M M M 19
M
M
(-42%)


COMPARING HOME
Analyzing Glen Ellyn Home Types for Q2 2023 New Listings135740 Contracted Homes111932 Home Inventory3818 Contract Time5 days5 days5 days Price Discounts101%102%102% Price per Sq. Ft. $261$225$176 Closed Sale Price$510K$424K$198K Home TypeSingle FamilyTown HousesCondos 20 Closed Homes1181128 11% 0% 0% 25% 42% 12% 18% 40% 14% 17% 2% 17% 75% 15% 31% 53% 1% 7% 2% 0% 27% 4% 23% 11%
TYPES
COMPARING SUBURBS
Analyzing Western Suburb Markets
SuburbMedian PriceQ2 YoY%Price / Sq. Ft.Q2 YoY%Contract DaysQ2 YoY% Clarendon Hills$959K29%$282-7%860% Downers Grove$503K9%$2493%620% Elmhurst$545K-13%$2983%950% Glen Ellyn$510K-11%$2610%525% Hinsdale$1.2M2%$3170%1043% Lisle$456K1%$2112%50% Lombard$360K-2%$2303%4-20% Western Springs$663K-12%$295-12%40% Westmont$394K-3%$212-4%980% Wheaton$486K-4%$2423%4-20%
21


Compass is a licensed real estate broker and abides by federa l, state and local equal housing opportunity laws. All materialpr esented herein is intended for informational purposes only, is compiled from sources deemed reliable but is subject to errors, omissions, and changes with out notice. Sources include Midwest Real Estate Data LLC. This is not intended to solicit property already listed. Glen Ellyn Office 479 N Main St, Suite 230 Glen Ellyn, IL 60137 www.kellystetlerrealestate.com Kelly Stetler 630.750.9551 kelly.stetler@compass.com Teresa Parry 810.569.0078 teresa.parry@compass.com Christina Corso 815.922.0459 christinacorso@compass.com
