TYLIN PROJECT NO. 10599 JULY 11, 2025 PAGE 1 OF 1
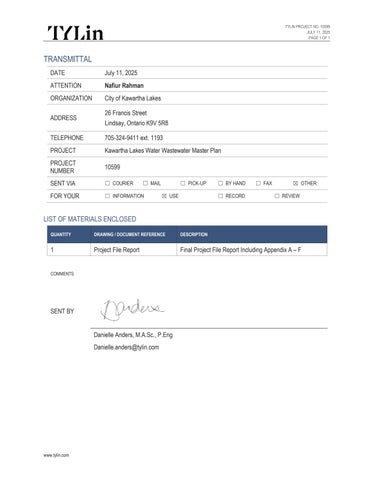
TRANSMITTAL DATE
July 11, 2025
ATTENTION
Nafiur Rahman
ORGANIZATION
City of Kawartha Lakes
ADDRESS
26 Francis Street Lindsay, Ontario K9V 5R8
TELEPHONE
705-324-9411 ext. 1193
PROJECT
Kawartha Lakes Water Wastewater Master Plan
PROJECT NUMBER
10599
SENT VIA
☐ COURIER
FOR YOUR
☐ INFORMATION
☐ PICK-UP ☒ USE
☐ BY HAND ☐ RECORD
☐ FAX
☒ OTHER ☐ REVIEW
LIST OF MATERIALS ENCLOSED QUANTITY
DRAWING / DOCUMENT REFERENCE
DESCRIPTION
1
Project File Report
Final Project File Report Including Appendix A – F
COMMENTS
SENT BY Danielle Anders, M.A.Sc., P.Eng Danielle.anders@tylin.com
www.tylin.com
T/Lin Memorandum Project:
City of Kawartha Lakes Water and Wastewater Master Plan Update
Project No.:
10599
Date
January 22, 2025
To
City of Kawartha Lakes: Nafiur Rahman
From
Abe Khademi
Subject
Summary of Master Plan Deliverables
Nafiur: Here is the summary of the Master Plan Deliverables, suitable for sharing on the Project Website:
TM-1: BACKGROUND INFORMATION AND NEEDS REVIEW This deliverable will constitute a formal record of the information provided and will document how it will be used. • Draft Technical Memorandum Posted to Project Website: N/A. (This is an internal review of technical information and studies. It is a Project Management resource, not required/intended for public review)
TM-2: FIELD INVESTIGATION RECOMMENDATIONS The Terms of Reference for this project identified a number of Provisional Items relating to possible field investigations to supplement the available information in order to inform the capacity assessment. These items included sanitary sewer flow monitoring; pumping station drawdown tests; and fire flow and C-Factor testing. • Draft Technical Memorandum Posted to Project Website: N/A. (This is an internal review of available data, and recommendations for additional investigations)
TM-3: WASTEWATER FLOW MONITORING REPORT The Wastewater Flow Monitoring Report includes the testing methodology summaries, Key system maps and site configuration and operational details, field observations and wastewater flow monitoring summaries. This data is being used to calibrate the baseline wastewater models for the communities of Lindsay, Bobcaygeon and Fenelon Falls. •
Draft Technical Memorandum Posted to Project Website: N/A. [Please reach out to the project team if you would like to review this document]
• Final Technical Memorandum Posted to Project Website: February 2025
3381 Steeles Ave. East, Suite 315 | Toronto, Ontario M2H 3S8 Canada | T 905.738.5700 | www.tylin.com
T/Lin
CITY OF KAWARTHA LAKES WATER AND WASTEWATER MASTER PLAN UPDATE PAGE 2 of 3 JANUARY 22, 2025
TM-4: WATER AND WASTEWATER SYSTEM CAPACITY AND CONDITION ASSESSMENT These documents will provide a facility-by facility summary of the current capacities of the facilities. In the case of the treatment facilities, additional information about the process capacity and limitations will also be provided. •
Draft Technical Memorandum Posted to Project Website: June 2024
•
Final Technical Memorandum Posted to Project Website: February 2025
TM-5: WATER AND WASTEWATER SERVICES DEMAND ASSESSMENT This memorandum details the population planning data, and the methodology by which it was assigned to the “build-out conditions” model. The recommended infrastructure improvements will be added to the “build-out” model networks, coded specifically so that the pipes can be deactivated for existing conditions scenarios. •
Draft Technical Memorandum Posted to Project Website: June 2024
•
Final Technical Memorandum Posted to Project Website: February 2025
TM-6: HYDRAULIC MODELLING TECHNICAL MEMORANDUM A modelling methodology memorandum will document how the models will be used for the network analyses, along with results of the Baseline and Buildout Servicing Assessments. •
Technical Memorandum Posted to Project Website: February 2025
TM-7: UNCOMMITTED RESERVE CAPACITY ASSESSMENT Water and Wastewater System Maps, displaying the build-out modelling scenario results as reserve flow, but converted into equivalent residential units. This will assist the City in considering development applications submitted after the Master Plan is finalised. •
Technical Memorandum Posted to Project Website: February 2025
TM-8: CAPITAL INFRASTRUCTURE DEVELOPMENT AND IMPLEMENTATION PLAN Project lists with cost estimates developed on standard unit pricing and details regarding required permits and approvals. This will be included in a technical memorandum describing the assumptions and procedures.
PROJECT NUMBER 10599
T/Lin •
CITY OF KAWARTHA LAKES WATER AND WASTEWATER MASTER PLAN UPDATE PAGE 3 of 3 JANUARY 22, 2025
Technical Memorandum Posted to Project Website: February 2025
CLASS EA PROJECT FILE REPORT The final summary of all project work is designed to meet the requirements of the Class Environmental Assessment process. Key information from Technical Memorandums (TM-1, TM-2, and TM-3) has been summarized and included in the Project File Report, which is available upon request. Additionally, TM-4, TM-5, TM-6, TM-7, and TM-8 are fully incorporated as part of this Project File Report. This deliverable will be provided for a 30-Day Public Review prior to issuing the formal Notice of Completion for the Project: •
Report Posted to Project Website: February 2025
PROJECT NUMBER 10599
Project File Report
Water and Wastewater Servicing and Capacity Master Plan January 2025 City of Kawartha Lakes
Kawarthai Jump In
T/Lin
Kawartha Lakes Project File Report Kawartha Lakes Water Wastewater Servicing and Capacity Master Plan
Executive Summary The City of Kawartha Lakes has experienced a significant increase in growth over the recent years which is driving the demands for improvements and upgrades to its water and wastewater infrastructure. The City retained T.Y. Lin International Canada Inc. (TYLin) in 2022 to complete the Water and Wastewater Master Plan based on the new Growth Management Strategy initiated in 2021. The Master Plan will identify the existing servicing constraints and provide a long-term water and wastewater servicing strategy that supports existing communities and growth to 2051 and beyond. To characterize the capacity to service the growth projections through the Master Plan update process and identify the existing servicing constraints, TM4 provided a desktop capacity assessment of each of the water and wastewater facilities owned by the City of Kawartha Lakes. This analysis included City provided planning development information to assess projected growth for each community. This memorandum is intended to review and document the facility capacities through the various communities in the City. For the treatment plants, the reserve capacity is analyzed through two distinct approaches, reserve capacity to 80% rated capacity where a Class Environmental Assessment for a plant expansion is typically triggered, and reserve capacity to 100% rated capacity. The capacity of the City of Kawartha Lakes owned Water Treatment Plants (WTP), Booster Pumping Stations (BPS), Wastewater Treatment Plants (WWTP) and Sewage Pumping Stations (SPS) are summarized in the following tables. This capacity assessment reviewed and extracted information from existing documentation provided by the City of Kawartha Lakes, including but not limited to: ► Ontario Drinking Water Works Permits/Licenses (DWWP/DWWL); ► Permit to Take Water (PTTW); ► Environmental Compliance Approvals (ECAs); ► Engineer’s Reports; ► Annual Performance Reports; ► SCADA Data; and, ► Meetings with facility operators.
T/Lin
Project Number 10599 January 2025
Page | ii
Kawartha Lakes Project File Report Kawartha Lakes Water Wastewater Servicing and Capacity Master Plan
The review of capacity information from existing documents was supplemented with design calculations to obtain theoretical process capacities where published process capacities have not been documented. The facility capacities are summarized in the following tables: ► Table ES-1: Water Treatment Plants o
The City owns a total of 21 water treatment plants
o
Water treatment plants are sized based on Maximum Day Demands (MDD)
o
The table summarizes the rated MDD capacity of each facility, the highest reported MDD from the past years, the percentage of the plant’s capacity utilized in that highest reported MDD, and the remaining MDD capacity to 80% of the plant capacity and 100% of the plant capacity
o
Planning for treatment plant expansions is typically started as a plant nears 80% capacity.
► Table ES-2: Water Booster Pumping Stations o
The City owns two booster pumping stations
o
These are considered separate from the high-lift pumps at the treatment plants, whose capacities are typically tied to the rated capacities of the plants themselves
o
The firm capacity of each station is identified, which considers the pumping capacity with the largest pump out-of-service
► Table ES-3: Water Storage Facilities o
The City owns five storage facilities (elevated tanks and in-ground reservoirs)
o
These are considered separate from storage included as part of the water treatment plants themselves
► Table ES-4: Wastewater Treatment Plants: o
The City owns a total of six wastewater treatment plants
o
Wastewater treatment plants are sized based on the Average Day Flows (ADF)
o
The table summarizes the rated ADF capacity of each facility, the highest reported ADF from the past years, the percentage of the plant’s capacity utilized in that highest reported ADF, and the remaining ADF capacity to 80% of the plant capacity and 100% of the plant capacity
o
Planning for treatment plant expansions is typically started as a plant nears 80% capacity.
► Table ES-5: Sewage Pumping Stations:
T/Lin
Project Number 10599 January 2025
Page | iii
Kawartha Lakes Project File Report Kawartha Lakes Water Wastewater Servicing and Capacity Master Plan
o
The City owns 28 sewage pumping stations
o
The firm capacity of each station is identified, which considers the pumping capacity with the largest pump out-of-service
T/Lin
Project Number 10599 January 2025
Page | iv
Kawartha Lakes Project File Report Kawartha Lakes Water Wastewater Servicing and Capacity Master Plan
Table ES-1: Water Treatment Plant Capacity Summary Reserve Reserve Capacity to Capacity to 80% of 100% of 3 Rated [m /d] Rated [m3/d]
Plant
Rated Capacity [m3/d]
5-Year Max Demand [m3/d]
5-Year Capacity [%]
Lindsay WTP
22,730
13,213
58%
4,971
9,517
Bobcaygeon WTP
5,184
3,575
69%
572
1,609
Fenelon Falls WTP
4,100
1,693
41%
1,587
2,407
Woodville WTP
588
322
55%
148
266
Birch Point WTP
360
198
55%
90
162
Canadiana Shores WTP
984
268
27%
519
716
Janetville WTP
449
242
54%
117
207
Kings Bay WTP
409
235
57%
92
174
Kinmount WTP
340
88
26%
184
252
Manilla WTP
157
86
55%
40
71
Manorview WTP
302
67
22%
175
235
Mariposa Estates WTP
72
67
93%
-9
5
Norland WTP
264
186
70%
25
78
Omemee WTP
461
92
20%
277
369
Pinewood WTP
590
274
46%
198
316
Pleasant Point WTP
490
145
30%
247
345
Sonya WTP
170
78
46%
58
92
Southview Estates WTP
484
143
30%
244
341
Victoria Place WTP
331
298
90%
-33
34
Western Trent/Palmina WTP
294
240
82%
-5
54
T/Lin
Project Number 10599 January 2025
Page | v
Kawartha Lakes Project File Report Kawartha Lakes Water Wastewater Servicing and Capacity Master Plan
Plant
Rated Capacity [m3/d]
5-Year Max Demand [m3/d]
5-Year Capacity [%]
Woodfield WTP
295
83
28%
Reserve Reserve Capacity to Capacity to 80% of 100% of 3 Rated [m /d] Rated [m3/d] 153
212
Table ES-2: Water Booster Pumping Station Capacity Summary Community
Station
Firm Capacity [m3/d]
Lindsay
Thornhill Road BPS
22,800
Lindsay
Oakwood BPS
1,390
Table ES-3: Water Storage Capacity Summary Community
Storage Facility
Volume
Rechlorination?
Lindsay
Thornhill Road Reservoir
9,000 m3
Yes
Lindsay
Verulam Road Elevated Tank
2,650 m3
Yes
Oakwood
Oakwood Reservoir
232 m3
Bobcaygeon
Dunn Street Elevated Tank
4,400 m3
Fenelon Falls
Church Street Standpipe
2,450 m3
Yes
Table ES-4: Wastewater Treatment Plant Capacity Summary Reserve Reserve Capacity to Capacity to 80% of 100% of Rated [m3/d] Rated [m3/d]
Wastewater Treatment Plant
Rated Capacity [m3/d]
5-Year Avg Flow [m3/d]
5-Year Capacity [%]
Lindsay WPCP
24,500
14,178
58%
5,422
10,322
Bobcaygeon WPCP
3,055
2,583
85%
-139
472
T/Lin
Project Number 10599 January 2025
Page | vi
Kawartha Lakes Project File Report Kawartha Lakes Water Wastewater Servicing and Capacity Master Plan
Fenelon Falls WPCP
1,800
1,158
64%
282
642
Omemee WWTP
1,353
590
44%
492
763
Coboconk WWTP
421
411
98%
-74
10
King’s Bay WWTP
170
46
27%
90
124
Table ES-5: Sewage Pumping Station Capacity Summary
T/Lin
Community
Station
Firm Capacity [L/s]
Lindsay
Fairgrounds SPS
18.0
Lindsay
Jennings Creek SPS
550.0
Lindsay
Lindsay St North SPS
400.0
Lindsay
Logie Street SPS
69.1
Lindsay
Mary Street SPS
20.0
Lindsay
Ridout Street SPS
360.0
Lindsay
Rivera Park SPS
732.0
Lindsay
Riverview Estates SPS
8.4
Lindsay
Wellington Street SPS
6.9
Bobcaygeon
SPS #1 (Canal St. E SPS)
35.6
Bobcaygeon
SPS #2 (Lance St. SPS)
13.9
Bobcaygeon
SPS #3 (Bolton St. SPS)
6.7
Bobcaygeon
SPS #4 (Main St. SPS)
6.3
Bobcaygeon
SPS #5 (Front St. W SPS)
13.9
Bobcaygeon
SPS #6 (Anne St. SPS)
61.0
Bobcaygeon
SPS #7 (Near Island Bay SPS)
42.0
Bobcaygeon
SPS #8 (Navigator Trail SPS)
18.9
Bobcaygeon
SPS #9 (Mill St. SPS)
18.9
Project Number 10599 January 2025
Page | vii
Kawartha Lakes Project File Report Kawartha Lakes Water Wastewater Servicing and Capacity Master Plan
Community
Station
Firm Capacity [L/s]
Bobcaygeon
SPS #10 (Little Bob Dr. SPS)
15.0
Bobcaygeon
SPS #11 (Riverside Dr. SPS)
14.1
Fenelon Falls
Colbourne Street SPS
50.0
Fenelon Falls
Ellice Street SPS
120.0
Fenelon Falls
Francis Street SPS
6.2
Omemee
Church Street SPS
45.0
Omemee
Sturgeon Road SPS
88.0
Table ES-6: Sewage Pumping Station Capacity Summary (cont’d) Community
Station
Firm Capacity [L/s]
Coboconk
South Water Street SPS (No. 1)
8.2
Coboconk
Water Street SPS (No. 2)
18.2
Coboconk
Main Street SPS (No. 3)
19.5
Upon completion of the capacity analysis, the following facility upgrades were identified for the following communities; ► Lindsay and Oakwood ► Bobcaygeon ► Fenelon Falls ► Omemee ► Woodville ► Small Water and Wastewater Systems The following results identify which facilities have current capacity and details the number of units the facility can accommodate at 80% and 100% plant capacity.
T/Lin
Project Number 10599 January 2025
Page | viii
Kawartha Lakes Project File Report Kawartha Lakes Water Wastewater Servicing and Capacity Master Plan
Table ES-7: Linsay Facilities Capacity Analysis Summary
Current Utilization
Required Buildout Capacity
Additional Units at 80% Capacity
Additional Units at 100% Capacity
1,900
4,500
Facility
Current Capacity
WTP
22,730 m3/day (MDD)
58%
62,031 m3/day (MDD)
Water Storage
11,650 m3
84%
29,591 m3
0
1,950
WPCP
24,500 m /day (ADF)
58%
44,239 m /day (ADF)
4,500
8,900
3
3
Table ES-8: Oakwood Facilities Capacity Analysis Summary
Facility
Current Capacity
Current Utilization
Required Buildout Capacity
Additional Units at 80% Capacity
Additional Units at 100% Capacity
Booster Pumping Station
1,390 m3
58%
1,073 m3
85
195
Water Storage
232 m3
138%
424 m3
0
0
Additional Units at 80% Capacity
Additional Units at 100% Capacity
Table ES-9: Bobcaygeon Facilities Capacity Analysis Summary
Facility
T/Lin
Current Capacity
Current Utilization
Required Buildout Capacity
Project Number 10599 January 2025
Page | ix
Kawartha Lakes Project File Report Kawartha Lakes Water Wastewater Servicing and Capacity Master Plan
WTP
5,184 m3/day (MDD)
69%
8,900 m3/day (MDD)
260
700
Water Storage
4,400 m3
48%
4,928 m3
1,150
1,850
WPCP
3,055 m3/day (ADF)
85%
5,594 m3/day (ADF)
0
475
Additional Units at 80% Capacity
Additional Units at 100% Capacity
Table ES-10: Fenelon Falls Facilities Capacity Analysis Summary
Facility
Current Capacity
Current Utilization
Required Buildout Capacity
WTP
4,100 m3/day (MDD)
41%
4,840 m3/day (MDD)
940
1,400
Water Storage
1,250 m3
111%
2,808 m3
600
1,100
WPCP
1,800 m3/day (ADF)
64%
2,708 m3/day (ADF)
300
600
Additional Units at 80% Capacity
Additional Units at 100% Capacity
100
150
Table ES-11: Omememe Facilities Capacity Analysis Summary
Facility
Current Capacity
Current Utilization
Required Buildout Capacity
WTP
461 m3/day (MDD)
20%
1,164 m3/day (MDD)
T/Lin
Project Number 10599 January 2025
Page | x
Kawartha Lakes Project File Report Kawartha Lakes Water Wastewater Servicing and Capacity Master Plan
Water Storage
16 m3
497 m3
327%
3
WPCP
1,353 m /day (ADF)
0
0
450
Satisfies Projected Planned Growth
3
1,063 m /day (ADF)
44%
Table ES-12: Woodville Facilities Capacity Analysis Summary
Facility
Current Capacity
Current Utilization
Required Buildout Capacity
Additional Units at 80% Capacity
Additional Units at 100% Capacity
WTP
588 m3/day (MDD)
59%
799 m3/day (MDD)
40
80
Water Storage
1,160 m3
14%
341 m3
N/A
N/A
The capital investments required for the proposed water and wastewater system upgrades are provided below. Please refer to Section 10 and Section 11 for a detailed project list. Table ES-13: Water System Upgrades Upgrade ID
Type
Project Description
Lindsay 2031 Upgrades
T/Lin
WAT-LIN-01
Watermain
WAT-LIN-02
Watermain
Project Number 10599 January 2025
New 400mm WM from the New Tank along Angeline St to Exist. WM on Angeline St New 400mm WM along St Joseph Rd from Colborne St W and Kent St W; New 400mm along Kent St W between St Joseph Rd and Commerce Rd
Page | xi
Kawartha Lakes Project File Report Kawartha Lakes Water Wastewater Servicing and Capacity Master Plan
Upgrade ID
Type
Project Description
WAT-LIN-03
Watermain
WAT-LIN-04
Watermain
WAT-LIN-06
Watermain
WAT-LIN-10
Watermain
WAT-LIN-11
WTP
Upgrade WM from 250mm to 300mm along Commerce Rd Upgrade WM from 100/150/250mm to 300mm along Glenelg St W Upgrade WM from 250/450mm to 600mm along Mary St W New 300mm WM along Lindsay St S, South of Logie St WTP Capacity Increase
WAT-LIN-12
Storage
New Elevated Tank
WAT-LIN-13
Storage
WAT-LIN-15
Watermain
Thornhill Road Reservoir Expansion New 300 mm WM for Tribute Lands
Lindsay 2041 Upgrades WAT-LIN-05
Watermain
Upgrade WM from 250mm to 400mm along Angeline St S
Lindsay 2051 Upgrades WAT-LIN-07
Watermain
WAT-LIN-08
Watermain
WAT-LIN-09
Watermain
WAT-LIN-14
Watermain
Upgrade WM from 300mm to 400mm along Dobson St and Proposed 400mm Extension to Verulam St S Upgrade WM from 200/300mm to 400mm along Verulam Rd and Proposed 400mm Extension New 200mm WM along Verulam Rd St, South of Dobson St Extension New 400mm WM Flato Land Trunk Loop
Bobcaygeon 2031 Upgrades WAT-BOB-01
T/Lin
Watermain
Project Number 10599 January 2025
Upgrade WM from 150mm to 200mm from North St to the intersection of Hillview Dr and Balaclava St
Page | xii
Kawartha Lakes Project File Report Kawartha Lakes Water Wastewater Servicing and Capacity Master Plan
Upgrade ID
Type
WAT-BOB-03
Watermain
WAT-BOB-04
Watermain
WAT-BOB-05
Watermain
WAT-BOB-06
Watermain
WAT-BOB-08
Watermain
WAT-BOB-10 Bobcaygeon 2041 Upgrades
WTP
WAT-BOB-02
Watermain
WAT-BOB-07
Watermain
Bobcaygeon 2051 Upgrades WAT-BOB-09 Fenelon Falls 2031 Upgrades
Storage
WAT-FF-01
Storage
WAT-FF-02
Watermain
WAT-FF-03
Watermain
WAT-FF-04
Watermain
WAT-FF-07
Watermain
WAT-FF-08 Fenelon Falls 2041 Upgrades WAT-FF-05 WAT-FF-06 Woodville Upgrades WAT-WV-01
Storage
New 200mm WM east of Concession Rd New 200mm WM east of Concession Rd New 200mm WM east of Concession Rd New 200mm WM east of Concession Rd New 150mm WM west of Lindsay St Booster Pumping Station
WTP Storage
Reservoir Storage expansion WTP Capacity Increase
WTP
WTP Capacity Increase
T/Lin
Project Number 10599 January 2025
Project Description Upgrade WM from 150mm to 200mm along Canal St E, Boyd St to Island Bay Dr Upgrade WM from 150mm to 200mm from Need St to East St S Upgrade WM from 150mm to 200mm running parallel to Mill St New twinned 250mm WM from WTP to Front St New 250mm WM along Balaclava St WTP Capacity Increase Upgrade WM from 150mm to 200mm along Sherwood St and Park St New 150mm from Cedartree Lane to Riverside Dr Reservoir Storage expansion
Page | xiii
Kawartha Lakes Project File Report Kawartha Lakes Water Wastewater Servicing and Capacity Master Plan
Upgrade ID
Type
Project Description
WAT-OAK-01
Watermain
Upgrade WM from 100/150mm to 250mm along Colborne St W towards Oakwood
WAT-OAK-02
Storage
Oakwood Reservoir Upgrades
Oakwood Upgrades
Table ES-14: Water Infrastructure Costs - By Community Water System
Forecasted Growth [Res. Units]
Estimated Capital Costs
Cost/Unit
Lindsay
23,501
$477,160,000
$20,304
Oakwood
93
$5,980,000
$64,301
Bobcaygeon
2,261
$77,450,000
$34,255
Fenelon Falls
1,498
$33,280,000
$22,213
Woodville
148
$7,150,000
$48,311
TOTAL
27,501
$601,020,000
-
Table ES-15: Wastewater System Upgrades Upgrade ID
Type
Project Description
Lindsay 2031 Upgrades
T/Lin
Project Number 10599 January 2025
Page | xiv
Kawartha Lakes Project File Report Kawartha Lakes Water Wastewater Servicing and Capacity Master Plan
Upgrade ID
Type
WW-LIN-02
Sewer
WW-LIN-03
Sewer
WW-LIN-04
Sewer
WW-LIN-05
Sewer
WW-LIN-17
Sewer
WW-LIN-20
Sewer
WW-LIN-33 WW-LIN-34 WW-LIN-36
WPCP SPS SPS
WW-LIN-40
Sewer
WW-LIN-41
Sewer
WW-LIN-43
SPS
WW-LIN-44
Sewer
WW-LIN-45
Sewer
WW-LIN-46
Sewer
Project Description Sewer Upgrade to 300mm from 200mm between Laurent Blvd and Angeline St S Sewer Upgrade to 300mm along Angeline St S Sewer Upgrade to 375mm from 300mm along Auk Trail Sewer Upgrade to 375mm from 300mm along Adelaide St S Sewer Upgrade to 300mm from 250mm west of McLaughing Rd Sewer Upgrade to 375mm from 300mm along Lindsay St S between Kent St and Glenelg St WPCP Capacity Increase Rideout St SPS upgrades Riverview St SPS Upgrades New 375mm Sewers for Tribute Lands New 300mm along Lindsay St S Mary St SPS and Forcemain Upgrade Sewer Upgrade to 250mm from 225mm along Wolfe St Sewer Upgrade to 300mm along Durham St Sewer Upgrade to 300mm along Huron St
Lindsay 2041 Upgrades
T/Lin
WW-LIN-01
Sewer
WW-LIN-06
Sewer
WW-LIN-07
Sewer
Project Number 10599 January 2025
Sewer Upgrade to 250mm from 200mm along Laurent Blvd Sewer Upgrade to 600mm along Albert St S Sewer Upgrade to 600mm from 450mm along Durham St W
Page | xv
Kawartha Lakes Project File Report Kawartha Lakes Water Wastewater Servicing and Capacity Master Plan
Upgrade ID
T/Lin
Type
WW-LIN-08
Sewer
WW-LIN-09
Sewer
WW-LIN-10
Sewer
WW-LIN-11
Sewer
WW-LIN-12
Sewer
WW-LIN-13
Sewer
WW-LIN-14
Sewer
WW-LIN-15
Sewer
WW-LIN-16
Sewer
WW-LIN-21
Sewer
WW-LIN-22
Sewer
Project Number 10599 January 2025
Project Description Sewer Upgrade to 600mm from 450mm along Sussex St S between Glenelg St and Durham St Sewer Upgrade to 600mm from 500mm along Sussex St S from south of Kent St Sewer Upgrade to 600mm from 500mm along Kent St W between Sussex St and Victoria Ave Sewer Upgrade to 600mm from 500mm along Victoria Ave N Sewer Upgrade to 600mm from 500mm along Wellington St between Victoria Ave and Cambridge St Sewer Upgrade to 600mm from 500mm along Cambridge St N between Wellington St and Bond St Sewer Upgrade to 600mm from 500mm along Bond St W between Cambridge St and William St Sewer Upgrade to 600mm from 500mm along William St N between Bond St and Francis St Sewer Upgrade to 600mm from 525mm along Francis St, east of Francis St Sewer Upgrade to 300mm from 200mm along Logan Lane Sewer Upgrade to 375mm from 200mm along Maguire St
Page | xvi
Kawartha Lakes Project File Report Kawartha Lakes Water Wastewater Servicing and Capacity Master Plan
Upgrade ID
Type
WW-LIN-23
Sewer
WW-LIN-24
Sewer
WW-LIN-25
Sewer
WW-LIN-26
Sewer
WW-LIN-27
Sewer
WW-LIN-28
Sewer
WW-LIN-29
Sewer
WW-LIN-30
Sewer
WW-LIN-31
Sewer
WW-LIN-35
SPS
WW-LIN-37
SPS
WW-LIN-38
Sewer
WW-LIN-39
Sewer
WW-LIN-42
SPS
Project Description Sewer Upgrade to 250mm from 200mm along Maguire St, east of Logan Lane Sewer Upgrade to 600mm along Logie St Sewer Upgrade to 450mm from 375mm from Parkside St and crossing perpendicularly to Hillside Dr Sewer Upgrade to 500mm from 450mm along Logie St from Hillside Dr to Riverview Rd Sewer Upgrade to 500mm from 450mm along Logie St from Hillside Dr to Riverview Rd New 600mm Sewer along Highway 36 New 600mm along W Wilson Rd New 600mm along Lagoon St New 600mm along Lagoon St to Lindsay WPCP Logie St SPS and Forcemain Upgrades Lindsay Fairground SPS upgrades New sewers 300mm to 600mm for Flato Developments North of Pigeon Lake Rd New sewers 300 mm to 450mm for Flato Developments South of Pigeon Lake Rd Two New SPSs and Forcemain for Flato Lands
Lindsay 2051 Upgrades WW-LIN-18
T/Lin
Sewer
Project Number 10599 January 2025
Sewer Upgrade to 250mm from 200mm from the south
Page | xvii
Kawartha Lakes Project File Report Kawartha Lakes Water Wastewater Servicing and Capacity Master Plan
Upgrade ID
Type
Project Description
WW-LIN-19
Sewer
WW-LIN-32
Sewer
end of Heritage Way and then crossing Angeline St to Chadwin Dr Sewer Upgrade to 300mm from 225mm along Angeline St N, between Chadwin Dr and Regent St Sewer Upgrade to 400mm from 375mm along William St. N
Bobcaygeon 2031 Upgrades WW-BOB-01
Sewer
WW-BOB-08 WW-BOB-10
WPCP SPS
WW-BOB-11
SPS
Sewer Upgrade to 300mm from 200mm along Helen St WPCP Capacity Increase Front Street SPS Upgrades Anne Street SPS and Forcemain Upgrades
Bobcaygeon 2041 Upgrades WW-BOB-02
Sewer
WW-BOB-03
Sewer
WW-BOB-12 Bobcaygeon 2051 Upgrades
SPS
WW-BOB-04
Sewer
WW-BOB-05
Sewer
WW-BOB-06
Sewer
WW-BOB-07
Sewer
WW-BOB-09 Fenelon Falls 2031 Upgrades
SPS
WW-FF-01
Sewer
WW-FF-02
Sewer
WW-FF-13
WPCP
T/Lin
Project Number 10599 January 2025
Sewer Upgrade to 300mm from 200mm along West St Sewer Upgrade to 200mm from 150mm south of the end of Little Bob Dr Little Bob Drive SPS Upgrades Sewer Upgrade to 250mm from 200mm along Helen St Sewer Upgrade to 250mm from 200mm along Cedartree Ln Sewer Upgrade to 300mm from 250mm along Front St W Sewer Upgrade to 350mm from 300mm along Need St Need St SPS Upgrades Sewer Upgrade to 300mm from 200mm along Bond St E Sewer Upgrade to 250mm from 200mm along Lindsay St WPCP Capacity Increase
Page | xviii
Kawartha Lakes Project File Report Kawartha Lakes Water Wastewater Servicing and Capacity Master Plan
Upgrade ID
Type
WW-FF-14
SPS
WW-FF-15
SPS
WW-FF-16 Fenelon Falls 2041 Upgrades
SPS
WW-FF-03
Sewer
WW-FF-04
Sewer
WW-FF-05
Sewer
WW-FF-06
Sewer
WW-FF-07
Sewer
WW-FF-08
Sewer
WW-FF-09
Sewer
WW-FF-10
Sewer
WW-FF-11
Sewer
Project Description Colborne St SPS Forcemain Upgrade and Forcemain Upgrade Ellice St SPS Upgrades and Forcemain Upgrades Francis St SPS Upgrades Sewer Upgrade to 300mm from 200mm along Bond St E Sewer Upgrade to 375mm from 200mm along Elgin St Sewer Upgrade to 375mm from 250mm along Clifton St Sewer Upgrade to 375mm along Francis St W Sewer Upgrade to 375mm from 300mm along Colborne St Sewer Upgrade to 450mm from 400mm along Lindsay St Sewer Upgrade to 600mm from 450mm along Elliot St to Ellice St SPS New 250mm sewer West of Sturgeon Point Rd New 200mm sewer along Short St
Fenelon Falls 2051 Upgrades WW-FF-12 Omemee Upgrades WW-OME-01
T/Lin
Sewer
Sewer
Project Number 10599 January 2025
Sewer Upgrade to 250mm from 200mm along Francis St E to Francis St SPS Sewer Upgrade to 450mm from 300mm
Page | xix
Kawartha Lakes Project File Report Kawartha Lakes Water Wastewater Servicing and Capacity Master Plan
Table ES-16: Wastewater Infrastructure Costs – By Community Wastewater System
Forecasted Growth [Res. Units]
Estimated Capital Costs
Cost/Unit
Lindsay
23,501
$357,190,000
$15,199
Bobcaygeon
2,261
$70,350,000
$31,110
Fenelon Falls
1,498
$55,250,000
$36,877
Omemee
427
$4,960,000
$11,616
TOTAL
27,687
$487,750,000
-
T/Lin
Project Number 10599 January 2025
Page | xx
Kawartha Lakes Project File Report Kawartha Lakes Water Wastewater Servicing and Capacity Master Plan
Table of Contents Executive Summary....................................................................................................................... ii 1
2
Introduction............................................................................................................................. 1 1.1
Purpose ........................................................................................................................ 1
1.2
Study Area.................................................................................................................... 1
1.3
Class EA Process........................................................................................................... 2
1.4
Stakeholder Consultation........................................................................................... 4
1.5
Project Team................................................................................................................ 4
Background Information ........................................................................................................ 5 2.1
Annual Performance Results...................................................................................... 5
2.2
CCTV Records............................................................................................................... 5
2.3
Detailed System Maps ................................................................................................ 5
2.4
Record Drawings ......................................................................................................... 5
2.5
Flow Monitoring Data and Reports........................................................................... 6
2.6
GIS Data........................................................................................................................ 6
2.7
Model Files................................................................................................................... 6
2.8
Operations Manuals .................................................................................................... 7
2.9
Planning Information.................................................................................................. 7
2.10
Reports ......................................................................................................................... 7
2.11
SCADA Data ................................................................................................................. 7
2.12
Water Billing Records ................................................................................................. 8
2.13
Water/Wastewater Asset Inventory .......................................................................... 8
2.14
Water/Wastewater Master Plan ................................................................................ 8
3
Existing Water and Wastewater Facilities............................................................................. 9
4
Planning Considerations....................................................................................................... 15 4.1
4.2
T/Lin
Summary of Planning Forecasts .............................................................................. 15 4.1.1
Lindsay Planning Forecast....................................................................................................15
4.1.2
Bobcaygeon Planning Forecast..........................................................................................17
4.1.3
Fenelon Falls Planning Forecast.........................................................................................21
4.1.4
Omemee Planning Forecast ................................................................................................21
4.1.5
Woodville Planning Forecast...............................................................................................22
4.1.6
Small System Planning Forecasts ......................................................................................27
Water and Wastewater Servicing Basis................................................................... 28 Project Number 10599 January 2025
Page | xxii
Kawartha Lakes Project File Report Kawartha Lakes Water Wastewater Servicing and Capacity Master Plan
4.3
4.2.2
Peaking Factors – Wastewater............................................................................................29
Forecasted Servicing Needs by Community ........................................................... 29 4.3.1
Lindsay Facility Capacity Analysis......................................................................................29
4.3.2
Oakwood Facility Capacity Analysis..................................................................................30
4.3.3
Bobcaygeon Facility Capacity Analysis............................................................................31
4.3.4
Fenelon Falls Facility Capacity Analysis ...........................................................................32
Omemee ..................................................................................................................... 33
4.5
Woodville ................................................................................................................... 34
4.6
Small Water Systems ................................................................................................ 34 4.6.1
Janetville......................................................................................................................................35
4.6.2
Kinmount ....................................................................................................................................36
4.6.3
Manilla .........................................................................................................................................36
4.6.4
Omemee .....................................................................................................................................36
4.6.5
Pinewood....................................................................................................................................36
Small Wastewater Systems....................................................................................... 37 4.7.1
Coboconk ...................................................................................................................................37
4.7.2
King’s Bay....................................................................................................................................37
Capacity Assessment of Water Systems.............................................................................. 38 5.1
6
Peaking Factors – Water .......................................................................................................28
4.4
4.7
5
4.2.1
Water Model Development...................................................................................... 38 5.1.1
Water Model Inputs................................................................................................................38
5.1.2
Water Modeling Details ........................................................................................................38
5.1.3
Water Demand Distribution ................................................................................................39
5.2
Water System Analysis.............................................................................................. 39
5.3
Existing Water System Constraints ......................................................................... 39
Capacity Assessment of Wastewater Systems.................................................................... 48 6.1
T/Lin
Wastewater Model Development............................................................................ 48 6.1.1
Wastewater Model Inputs ....................................................................................................48
6.1.2
Wastewater Model Calibration...........................................................................................48
6.1.3
Rainfall and Flow Monitoring Data ...................................................................................49
6.1.4
Historical Wastewater Model Calibration.......................................................................49
6.1.5
Dry Weather Flow (DWF) Calibration...............................................................................49
6.1.6
Wet Weather Flow (WWF)....................................................................................................49
6.1.7
Wastewater Load Distribution ............................................................................................49
Project Number 10599 January 2025
Page | xxiii
Kawartha Lakes Project File Report Kawartha Lakes Water Wastewater Servicing and Capacity Master Plan
6.2
6.1.8
Modelled Baseline Scenario.................................................................................................50
6.1.9
Modelled 2051 Scenario .......................................................................................................50
Existing Wastewater System Constraints................................................................ 50
7
Problem Statement ............................................................................................................... 59
8
Inventory of the Environments............................................................................................ 60
9
8.1
Natural Environment ................................................................................................ 60
8.2
Assessment of Archaeological Potential................................................................. 60
Identification and Evaluation of Alternative Solutions..................................................... 62 9.1
Evaluation Methodology .......................................................................................... 62
9.2
Water and Wastewater Servicing Alternatives ...................................................... 63 9.2.1
Alternative 1 – Do Nothing..................................................................................................63
9.2.2
Alternative 2 – Limit Community Growth.......................................................................63
9.2.3
Alternative 3 – Water Conservation (Water & Wastewater) and I/I Reduction (Wastewater)..............................................................................................................................63
9.2.4 9.3
Alternative 4 – Expand & Enhance Water & Wastewater Infrastructure ............64
Evaluation of Water & Wastewater System Alternatives...................................... 64
10 Recommended Water System Upgrades ............................................................................ 65 10.1
Cost of Recommended Water Infrastructure ......................................................... 66
11 Recommended Wastewater System Upgrades .................................................................. 77 11.1
Cost of Recommended Wastewater Infrastructure ............................................... 80
12 Consultation Process and Activities .................................................................................... 97 12.1
Stakeholder Contact List .......................................................................................... 97
12.2
Notice of Study Commencement ............................................................................ 97
12.3
Public Consultation Centre (PCC #1)....................................................................... 98 12.3.1 Notice of Public Consultation Centre (PCC #1)............................................................98 12.3.2 Public Consultation Centre (PCC #1) Event ...................................................................98
12.4
Public Consultation Centre (PCC #2)....................................................................... 98 12.4.1 Notice of Public Consultation Centre (PCC #2)............................................................98 12.4.2 Public Consultation Centre (PCC #2) Event ...................................................................99
12.5
First Nations Consultation...................................................................................... 100
12.6
Notice of Study Completion and Report Review................................................. 100
12.7
Summary of Class EA Milestone Dates.................................................................. 101
13 Conclusions and Recommendations ................................................................................. 102
T/Lin
Project Number 10599 January 2025
Page | xxiv
Kawartha Lakes Project File Report Kawartha Lakes Water Wastewater Servicing and Capacity Master Plan
List of Appendices APPENDIX A – PUBLIC CONSULTATION APPENDIX A1 – STAKEHOLDER CONTACT LIST APPENDIX A2 – NOTICE OF COMMENCEMENT APPENDIX A3 – PCC1 APPENDIX A4 – PCC2 APPENDIX A5 – NOTICE OF COMPLETION APPENDIX B - COMPREHENSIVE WATER/WASTEWATER SYSTEM CAPACITY ASSESSMENT (TECHNICAL MEMORANDUM 4) APPENDIX C – SERVICING NEEDS ASSESSMENT (TECHNICAL MEMORANDUM 5) APPENDIX D – NATURAL HERITAGE CONSTRAINTS STUDY APPENDIX E – MAPS FOR EACH COMMUNITY IDENTIFYING HIGH ARCHAEOLOGICAL POTENTIAL APPENDIX F – CAPITAL IMPLEMENTATION PLAN (TECHNICAL MEMORANDUM 8)
List of Figures Figure 1-1: City of Kawartha Lakes Study Area.................................................................................................... 2 Figure 1-2: Class EA Planning Flow Chart .............................................................................................................. 3 Figure 4-1: Lindsay Projected Development.......................................................................................................19 Figure 4-2: Bobcaygeon Projected Development.............................................................................................20 Figure 4-3: Fenelon Falls Projected Development............................................................................................23 Figure 4-4: Omemee Projected Development ...................................................................................................24 Figure 4-5: Woodville Projected Development..................................................................................................25 Figure 4-6: Oakwood Projected Development ..................................................................................................26 Figure 5-1: Lindsay Existing Network; 2051 Peak Hour Demand................................................................40 Figure 5-2: Lindsay Existing Network; 2051 Maximum Day + Fire Flow Demand................................41 Figure 5-3: Bobcaygeon Existing Network; 2051 Peak Hour Demand......................................................42 Figure 5-4: Bobcaygeon Existing Network; 2051 Maximum Day + Fire Flow Demand......................43 Figure 5-5: Fenelon Falls Existing Network; 2051 Peak Hour Demand.....................................................44 Figure 5-6: Fenelon Falls Existing Network; 2051 Maximum Day + Fire Flow Demand.....................45 Figure 5-7: Woodville Existing Network; 2051 Peak Hour Demand ..........................................................46 Figure 5-8: Woodville Existing Network; 2051 Maximum Day + Fire Flow Demand...........................47 Figure 6-1: Lindsay Existing Network; 2051 DWF .............................................................................................51 Figure 6-2: Lindsay Existing Network; 2051 WWF ............................................................................................52
T/Lin
Project Number 10599 January 2025
Page | xxv
Kawartha Lakes Project File Report Kawartha Lakes Water Wastewater Servicing and Capacity Master Plan
Figure 6-3: Bobcaygeon Existing Network; 2051 DWF ...................................................................................53 Figure 6-4: Bobcaygeon Existing Network; 2051 WWF ..................................................................................54 Figure 6-5: Fenelon Falls Existing Network; 2051 DWF ..................................................................................55 Figure 6-6: Fenelon Falls Existing Network; 2051 WWF .................................................................................56 Figure 6-7: Omemee Existing Network; 2051 DWF..........................................................................................57 Figure 6-8: Omemee Existing Network; 2051 WWF.........................................................................................58 Figure 10-1: Proposed Water System Upgrades – Lindsay ...........................................................................73 Figure 10-2: Proposed Water System Upgrades - Bobcaygeon..................................................................74 Figure 10-3: Proposed Water System Upgrades – Fenelon Falls ................................................................75 Figure 10-4: Proposed Water System Upgrades - Woodville ......................................................................76 Figure 11-1: Proposed Wastewater System Upgrades – Lindsay................................................................93 Figure 11-2: Proposed Wastewater System Upgrades – Bobcaygeon......................................................94 Figure 11-3: Proposed Wastewater System Upgrades – Fenelon Falls.....................................................95 Figure 11-4: Proposed Wastewater System Upgrades – Omemee ............................................................96
List of Tables Table 1-1: Key Project Team Members ................................................................................................................... 4 Table 3-1: Water Treatment Plant Capacity Summary....................................................................................11 Table 3-2: Water Booster Pumping Station Capacity Summary..................................................................12 Table 3-3: Water Storage Capacity Summary ....................................................................................................12 Table 3-4: Wastewater Treatment Plant Capacity Summary ........................................................................13 Table 3-5: Sewage Pumping Station Capacity Summary...............................................................................13 Table 4-1: Lindsay Planning Forecast Details .....................................................................................................16 Table 4-2: Bobcaygeon Planning Forecast Details ...........................................................................................18 Table 4-3: Fenelon Falls Planning Forecast Details ..........................................................................................21 Table 4-4: Omemee Planning Forecast Details..................................................................................................21 Table 4-5: Woodville Planning Information ........................................................................................................22 Table 4-6: Small Water System Servicing Needs...............................................................................................27 Table 4-7: City of Kawartha Lakes Water and Wastewater Design Criteria.............................................28 Table 4-8: Lindsay Facilities Capacity Analysis Summary...............................................................................29 Table 4-9: Oakwood Facilities Capacity Analysis Summary ..........................................................................31 Table 4-10: Bobcaygeon Facilities Capacity Analysis Summary ..................................................................31 Table 4-11: Fenelon Falls Facilities Capacity Analysis Summary .................................................................32 Table 4-12: Omemee Facilities Capacity Analysis Summary.........................................................................33 Table 4-13: Woodville Facilities Capacity Analysis Summary .......................................................................34 Table 4-14: Small Water System Servicing Needs ............................................................................................35
T/Lin
Project Number 10599 January 2025
Page | xxvi
Kawartha Lakes Project File Report Kawartha Lakes Water Wastewater Servicing and Capacity Master Plan
Table 4-15 – Small Wastewater System Servicing Needs..............................................................................37 Table 9-1: Water and Wastewater Evaluation Criteria ....................................................................................62 Table 9-2: Evaluation Scoring...................................................................................................................................63 Table 10-1: Proposed Water System Upgrades – Cost Estimate ................................................................67 Table 10-2 : Water Infrastructure Costs – By Community .............................................................................72 Table 11-1: Proposed Wastewater System Upgrades – Cost Estimate.....................................................80 Table 11-2: Water Infrastructure Costs – By Community...............................................................................92 Table 12-1: Schedule of Class EA Milestones .................................................................................................. 101 Table 13-1: Water Infrastructure Costs - By Community ............................................................................ 102 Table 13-2: Wastewater Infrastructure Costs – By Community ................................................................ 102
T/Lin
Project Number 10599 January 2025
Page | xxvii
Kawartha Lakes
Project File Report Kawartha Lakes Water Wastewater Servicing and Capacity Master Plan
1 Introduction 1.1 Purpose The City of Kawartha Lakes (the City) has retained T. Y. Lin International Canada Inc. (TYLin) to update their Water and Wastewater Master Plan, in compliance with the Class Environmental Assessment Process. The largest urbanized communities within the City (Lindsay, Bobcaygeon and Fenelon Falls) are serviced via municipal water distribution and wastewater collection networks. Omemee is serviced through a municipal wastewater system, and Woodville has a municipal water network. The City is currently experiencing growth, mandated by the Province of Ontario. Based on current planning forecasts, the City is expected to grow to a population of approximately 130,000 people and 46,600 jobs by the year 2051. The objective of this study is to assess any capacity deficiencies within the existing water and wastewater systems relating to the forecasted growth. The study will also identify the preferred alternatives to upgrade the systems where required to alleviate any capacity deficiencies to service the growth while providing the desired level of service to all residents and businesses. A review and analysis of the existing services will allow the City to coordinate municipal infrastructure planning with its Official Plan review, to ensure that the policies developed in each are compatible with one another and that the services are available in time to service the projected growth. This Project File Report documents the planning process that was followed, the study area, a summary of the background information, the problem/opportunity statement, the evaluation of the alternative water and wastewater solutions, the public consultation, and the preferred infrastructure upgrade solutions.
1.2 Study Area The study area encompasses the City’s entire geographical region which includes the communities identified in Figure 1-1.
T/Lin
Project Number 10599 January 2025
Page | 1
Kawartha Jump In
Project File Report Kawartha Lakes Water Wastewater Servicing and Capacity Master Plan
Figure 1-1: City of Kawartha Lakes Study Area Both Municipal Water and Sanitary Systems: 6. Bobcaygeon
Tory Hii: M nden
5. Fenlon Falls 17. King's Bay 10. Lindsay 13. Omemee
Gooderham
Irondale
K nmount
Kawartha
washago
Park
Woodview
Brechin
A
Buckhorn
Kawartha
Lakes
Municipal Water System Only: 11. Birch Point Estates 18. Canadiana Shores 19. Janetville 1. Kinmount 10. Lindsay (Chandlers Corner) 10. Lindsay (Oakwood) 12. Manilla 21. Manorview (Bethany) 16. Mariposa Estates
Station
2. Norland 22. Pinewood (Pontypool) 15. Pleasant Point 14. Sonya 8. Southview Estates 9. Victoria Place 4. Western Trent/Palmina (Bolsover) 20. Woodfield (Bethany) 7. Woodville
Curve Lake
o
Beaverton
•
Lakefield
Er dgenorth
Cann ngton Peterborough
Georgina Sunder and
Keene
East Gwillimbury
Uxbr dge
Rosen*
y^
Municipal Wastewater System Only: 3. Coboconk
port Perry
Newmarket
Campoeicroft
1.3 Class EA Process The Class Environmental Assessment (EA) process was developed by the Municipal Engineers Association, in consultation with the Ministry of the Environment, Conservation and Parks (MECP), as an alternative method to Individual Environmental Assessments for recurring municipal projects that were similar in nature, usually limited in scale and with predictable range of environmental effects which were responsive to mitigating measures. A Class EA Master Plan is a long-range plan that ties together the various needs of an overall system, and is typically comprised of a set of separate projects that are to be individually implemented over an extended period of time. A Master Plan considers the individual needs of a system within a broader context, and integrates infrastructure needs with environmental assessment planning principals. Master Plans address Phase 1 and 2 of the Municipal Class EA process and include a stakeholder consultation program. Figure 1-2 illustrates the Class EA planning flowchart. These projects will then become a part of a larger management system and be distributed geographically throughout the Study Area. Implementation of these projects will occur in accordance with the respective planning horizons and certain projects (Schedule B and C projects) will require detailed investigation to satisfy the additional MCEA requirements.
T/Lin
Project Number 10599 January 2025
Page | 2
Kawartha Jump In
Project File Report Kawartha Lakes Water Wastewater Servicing and Capacity Master Plan
The plan is to fulfill the Municipal Class EA requirements for exempt projects that are identified and to outline additional work that may be required to identify schedule B and C projects, which are typically facilities upgrades (i.e., sewage pumping stations, reservoirs, booster pumping stations and water/wastewater treatment plants) due to capacity increases or watermain and sewers projects in environmentally/archaeologically sensitive areas. A Master Plan is typically subject to the approval of the municipality for which it was prepared. Prior to being approved, a clear and concise Master Plan report is made available for review and comment by the public and review agencies. Following consideration of any public comment and subsequent approval of the Master Plan, the report is reviewed periodically to determine whether there is a need for formal updating of the Master Plan. Details on how and when a specific Master Plan will be reviewed are generally documented in that Master Plan. The Class EA planning flow chart can be seen below. It is based off the 2023 Municipal Class Environmental Assessment (MCEA) - Municipal Engineers Association (MEA) flow chart. Figure 1-2: Class EA Planning Flow Chart
lYLin
Project Number 10599 January 2025
Page | 3
Kawartha Lakes
Project File Report Kawartha Lakes Water Wastewater Servicing and Capacity Master Plan
1.4 Stakeholder Consultation The public consultation portion of the EA process is described below in Section 12 0with associated materials provided in Appendix A.
1.5 Project Team The key members of the project team are listed in Table 1-1. Table 1-1: Key Project Team Members
T/Lin
Nafiur Rahman
Project Manager, City of Kawartha Lakes
Abe Khademi, P.Eng.
Project Manager, TYLin
Project Number 10599 January 2025
Page | 4
Kawartha Lakes
Project File Report Kawartha Lakes Water Wastewater Servicing and Capacity Master Plan
2 Background Information The City of Kawartha Lakes provided a variety of background information related to the water and wastewater system for the various communities within the municipal boundary. A preliminary review of the received data was conducted. This section summarizes the analysis of the information provided and TYLin’s intended use of that information.
2.1 Annual Performance Results The Annual Reports prepared by Ontario Clean Water Agency (OCWA) for the majority of the City’s facilities were provided. Annual performance reports for the drinking water systems for 22 communities from the year 2017 to 2021 are available. Annual wastewater performance reports for the treatment plants at Babcaygeon, Fenelon Falls, King’s Bay, Lindsay, and Omemee were also provided by the City from the year 2017 to 2021.
2.2 CCTV Records Closed Circuit Television (CCTV) inspection reports for the Babcaygeon, Fenelon Falls, Lindsay, Omemee, and Coboconk were provided by the City. While the existing network configuration will be formed primarily based on the GIS information provided, there may be instances where the records provided are not conclusive. In these cases, available CCTV reports can be consulted to potentially confirm existing pipe diameters, alignments, etc. During the model calibration, we identified sources of higher-than-expected inflows into the wastewater system, and the CCTV data could support identification of specific inflow sources (through defects in pipes, as an example).
2.3 Detailed System Maps Sanitary sewer system maps for Bobcaygeon, Coboconk, Fenelon, Kings Bay, Lindsay, and Omemee were available. Water distribution maps for 22 communities are also available. The detailed system maps have been incorporated as required into this project.
2.4 Record Drawings Drawings related to the water distribution system, sanitary system, pumping stations, sewage pumping stations, and water treatment plant for 22 communities were received.
T/Lin
Project Number 10599 January 2025
Page | 5
Kawartha Lakes
Project File Report Kawartha Lakes Water Wastewater Servicing and Capacity Master Plan
2.5 Flow Monitoring Data and Reports The following reports were received and preliminarily reviewed: ► Flow Monitoring and Analysis of Sanitary Sewers in Bobcaygeon, CIVICA, September 2015.pdf - Report documents the results of the characterization of 11 Sanitary Pumping Stations within the Bobcaygeon Sanitary Sewer System. ► Flow Monitoring of Fenelon Falls Sanitary System - Flowmetrix.pdf - Report presents short term flow monitoring study for the 17 flow monitoring sites in the Town of Fenelon Falls (Duration - 9 months). ► Flow Monitoring of Lindsay Sanitary Sewer Collection System, AECOM, March 2012.pdf Study comprised of 13 flow monitors installed in drainage areas 2 and 6 of Lindsay sanitary sewer collection system. ► FM Consolidation Report-Civica.pdf - Flow Monitor consolidation study for the city. ► Sanitary Sewer Flow Monitoring, Lindsay, Cole, March 2014.pdf - Study involves flow monitoring of the sanitary sewers within the Town of Lindsay.
2.6 GIS Data GIS data for the water and wastewater system for Bobcaygeon, Fenelon Falls, and Lindsay were received in the form of shapefiles. Some background GIS information such as municipal boundary, roads were also provided and will be used in preparing various maps.
2.7 Model Files The City has provided existing water and wastewater hydraulic models for the Bobcaygeon, Fenelon Falls, and Lindsay. The existing water distribution model is in Bentley’s WaterGEMS Hydraulic Modelling software whereas sanitary sewer system is represented in Bentley’s SewerGEMS Hydraulic Modelling software. TYLin understands that the City has been using hydraulic models that were last updated in 2015, and since then has experienced growth and system improvements/modifications which may not be fully captured in the current models. Existing hydraulic models will be compared with the GIS data to identify any data gaps and will be updated accordingly to establish baseline conditions. The water and wastewater models are critical tools in forecasting constraints through applying growth scenarios that will form the basis of the Masterplan infrastructure recommendations.
T/Lin
Project Number 10599 January 2025
Page | 6
Kawartha Lakes
Project File Report Kawartha Lakes Water Wastewater Servicing and Capacity Master Plan
2.8 Operations Manuals Drinking water system operation manuals for 21 communities have been provided by the City. Wastewater treatment plant operation manuals are also available for Bobcaygeon, Coboconk, Fenelon Falls, and Lindsay.
2.9 Planning Information The City has provided Official Planning and Zoning information in the form of reports and shapefiles. City’s Official Plan for the year 2012 and draft Official Plan for 2022 is available. The City’s long-range Planning information forms the basis for the Infrastructure Master Planning, as it establishes the overall servicing objective for the Master Plan.
2.10 Reports The City has provided various past study and investigation reports which are summarized below: ► Bobcaygeon – Water treatment plant capacity review ► City of Kawartha Lakes – Growth management Discussion paper, and DC background study ► Fenelon Falls – Water treatment plant upgrade report, treated water storage review, and wastewater system capacity upgrade EA report. ► Lindsay – Water pollution control plant upgrade EA report, Henry St elevated storage tank assessment, WPCP field inspection report, and WPCP water intake and pumping station assessment. ► Mary St SPS – Design and EA review, Mary St SPS EA report ► Omemee – SPS flow rate analysis, water servicing EA report, and WPCP ESR ► Woodville – Field program report, pumping test assessment, water system improvement report, capacity assessment report, and municipal servicing study.
2.11 SCADA Data SCADA data for 20 facilities were provided by the City in the form of spreadsheets. Water treatment plant and sewage treatment plant discharge flows from the year 2017 to 2022 is available. Sewage pumping station discharge flows for the Fenelon Falls, Lindsay, and Omemee were also provided for the last five years.
T/Lin
Project Number 10599 January 2025
Page | 7
Kawartha Lakes
Project File Report Kawartha Lakes Water Wastewater Servicing and Capacity Master Plan
2.12 Water Billing Records The City has provided water consumption reports for the 17 communities for the period from 2017 to 2021.
2.13 Water/Wastewater Asset Inventory The information of all the water and wastewater assets were provided in the form of spreadsheets. These are four spreadsheets containing details about water and wastewater facilities and sewage pumping stations.
2.14 Water/Wastewater Master Plan The City of Kawartha Lakes Water and Wastewater Master Plans were reviewed to provide a detailed model audit. Each existing system was reviewed to further understand capacity requirements and constraints. Available GIS data was then reviewed as a comparison QAQC procedure. The available Water and Wastewater models were then updated.
T/Lin
Project Number 10599 January 2025
Page | 8
Kawartha Lakes
Project File Report Kawartha Lakes Water Wastewater Servicing and Capacity Master Plan
3 Existing Water and Wastewater Facilities The City of Kawartha Lakes provides municipal water servicing to 21 individual communities, and wastewater servicing to six communities. A complete inventory of the City of Kawartha Lakes facilities is included the Comprehensive Water/Wastewater System Capacity Assessment (Technical Memorandum 4), which is included in this Project File Report as Appendix B. To characterize the capacity to service the growth projections through the Master Plan update process and identify the existing servicing constraints, TM-4 provided a desktop capacity assessment of each of the water and wastewater facilities owned by the City of Kawartha Lakes. As we consider the servicing needs of the forecasted growth through the various communities which comprise the City of Kawartha Lakes, we will use the information contained in this section (and the details provided in TM-4) to identify which facilities might have to be expanded in order to provide the servicing needs of the ultimate buildout. For the treatment plants, the reserve capacity is analyzed through two distinct approaches, reserve capacity to 80% rated capacity where a Class Environmental Assessment for a plant expansion is typically triggered, and reserve capacity to 100% rated capacity. This capacity assessment reviewed and extracted information from existing documentation provided by the City of Kawartha Lakes, including: ► Ontario Drinking Water Works Permits/Licenses (DWWP/DWWL); ► Permit to Take Water (PTTW); ► Environmental Compliance Approvals (ECAs); ► Engineer’s Reports; ► Annual Performance Reports; ► SCADA Data; and, ► Meetings with facility operators. The review of capacity information from existing documents was supplemented with design calculations to obtain theoretical process capacities where published process capacities have not been documented. The facility capacities are summarized in the following tables: ► Table 3-1: Water Treatment Plants
T/Lin
o
The City owns a total of 21 water treatment plants
o
Water treatment plants are sized based on Maximum Day Demands (MDD) Project Number 10599 January 2025
Page | 9
Kawartha Lakes
o
Project File Report Kawartha Lakes Water Wastewater Servicing and Capacity Master Plan
The table summarizes the rated MDD capacity of each facility, the highest reported MDD from the past years, the percentage of the plant’s capacity utilized in that highest reported MDD, and the remaining MDD capacity to 80% of the plant capacity and 100% of the plant capacity
o
Planning for treatment plant expansions is typically started as a plant nears 80% capacity.
► Table 3-2: Water Booster Pumping Stations o
The City owns two booster pumping stations
o
These are considered separate from the high-lift pumps at the treatment plants, whose capacities are typically tied to the rated capacities of the plants themselves
o
The firm capacity of each station is identified, which considers the pumping capacity with the largest pump out-of-service
► Table 3-3: Water Storage Facilities o
The City owns five storage facilities (elevated tanks and in-ground reservoirs)
o
These are considered separate from storage included as part of the water treatment plants themselves
► ► Table 3-4: Wastewater Treatment Plants o
The City owns a total of six wastewater treatment plants
o
Wastewater treatment plants are sized based on the Average Day Flows (ADF)
o
The table summarizes the rated ADF capacity of each facility, the highest reported ADF from the past years, the percentage of the plant’s capacity utilized in that highest reported ADF, and the remaining ADF capacity to 80% of the plant capacity and 100% of the plant capacity
o
Planning for treatment plant expansions is typically started as a plant nears 80% capacity.
► Table 3-5: Sewage Pumping Stations o
The City owns 28 sewage pumping stations
o
The firm capacity of each station is identified, which considers the pumping capacity with the largest pump out-of-service
T/Lin
Project Number 10599 January 2025
Page | 10
Kawartha Lakes
Project File Report Kawartha Lakes Water Wastewater Servicing and Capacity Master Plan
Table 3-1: Water Treatment Plant Capacity Summary
I
Reserve Reserve Capacity to Capacity to 80% of 100% of Rated [m3/d] Rated [m3/d]
Plant
Rated Capacity [m3/d]
5-Year Max Demand [m3/d]
5-Year Capacity [%]
Lindsay WTP
22,730
13,213
58%
1,900
4,500
Bobcaygeon WTP
5,184
3,575
69%
260
700
Fenelon Falls WTP
4,100
1,693
41%
940
1400
Woodville WTP
588
322
55%
40
80
Birch Point WTP
360
198
55%
90
162
Canadiana Shores WTP
984
268
27%
519
716
Janetville WTP
449
242
54%
117
207
Kings Bay WTP
409
235
57%
92
174
Kinmount WTP
340
88
26%
184
252
Manilla WTP
157
86
55%
40
71
Manorview WTP
302
67
22%
175
235
Mariposa Estates WTP
72
67
93%
-9
5
Norland WTP
264
186
70%
25
78
Omemee WTP
461
92
20%
277
369
Pinewood WTP
590
274
46%
198
316
Pleasant Point WTP
490
145
30%
247
345
T/Lin
Project Number 10599 January 2025
Page | 11
Kawartha Lakes
Project File Report Kawartha Lakes Water Wastewater Servicing and Capacity Master Plan
Reserve Reserve Capacity to Capacity to 80% of 100% of 3 Rated [m /d] Rated [m3/d]
Plant
Rated Capacity [m3/d]
5-Year Max Demand [m3/d]
5-Year Capacity [%]
Sonya WTP
170
78
46%
58
92
Southview Estates WTP
484
143
30%
244
341
Victoria Place WTP
331
298
90%
-33
34
Western Trent/Palmin a WTP
294
240
82%
-5
54
Woodfield WTP
295
83
28%
153
212
Table 3-2: Water Booster Pumping Station Capacity Summary Community
Station
Firm Capacity [m3/d]
Lindsay
Thornhill Road BPS
22,800
Lindsay
Oakwood BPS
1,390
Table 3-3: Water Storage Capacity Summary Community
Storage Facility
Volume
Rechlorination?
Lindsay
Thornhill Road Reservoir
9,000 m3
Yes
Lindsay
Verulam Road Elevated Tank
2,650 m3
Yes
Oakwood
Oakwood Reservoir
232 m3
Bobcaygeon
Dunn Street Elevated Tank
4,400 m3
Fenelon Falls
Church Street Standpipe
2,450 m3
T/Lin
Project Number 10599 January 2025
Yes
Page | 12
Kawartha Lakes
Project File Report Kawartha Lakes Water Wastewater Servicing and Capacity Master Plan
Table 3-4: Wastewater Treatment Plant Capacity Summary Reserve Reserve Capacity to Capacity to 80% of 100% of Rated [m3/d] Rated [m3/d]
Wastewater Treatment Plant
Rated Capacity [m3/d]
5-Year Avg Flow [m3/d]
5-Year Capacity [%]
Lindsay WPCP
24,500
14,178
58%
5,422
10,322
Bobcaygeon WPCP
3,055
2,583
85%
-139
472
Fenelon Falls WPCP
1,800
1,158
64%
282
642
Omemee WWTP
1,353
590
44%
492
763
Coboconk WWTP
421
411
98%
-74
10
King’s Bay WWTP
170
46
27%
90
124
Table 3-5: Sewage Pumping Station Capacity Summary
T/Lin
Community
Station
Firm Capacity [L/s]
Lindsay
Fairgrounds SPS
18.0
Lindsay
Jennings Creek SPS
550.0
Lindsay
Lindsay St North SPS
400.0
Lindsay
Logie Street SPS
69.1
Lindsay
Mary Street SPS
20.0
Lindsay
Ridout Street SPS
360.0
Lindsay
Rivera Park SPS
732.0
Lindsay
Riverview Estates SPS
8.4
Lindsay
Wellington Street SPS
6.9
Bobcaygeon
SPS #1 (Canal St. E SPS)
35.6
Bobcaygeon
SPS #2 (Lance St. SPS)
13.9
Project Number 10599 January 2025
Page | 13
Kawartha Lakes
Project File Report Kawartha Lakes Water Wastewater Servicing and Capacity Master Plan
Community
Station
Firm Capacity [L/s]
Bobcaygeon
SPS #3 (Bolton St. SPS)
6.7
Bobcaygeon
SPS #4 (Main St. SPS)
6.3
Bobcaygeon
SPS #5 (Front St. W SPS)
13.9
Bobcaygeon
SPS #6 (Anne St. SPS)
61.0
Bobcaygeon
SPS #7 (Near Island Bay SPS)
42.0
Bobcaygeon
SPS #8 (Navigator Trail SPS)
18.9
Bobcaygeon
SPS #9 (Mill St. SPS)
18.9
Bobcaygeon
SPS #10 (Little Bob Dr. SPS)
15.0
Bobcaygeon
SPS #11 (Riverside Dr. SPS)
14.1
Fenelon Falls
Colbourne Street SPS
50.0
Fenelon Falls
Ellice Street SPS
120.0
Fenelon Falls
Francis Street SPS
6.2
Omemee
Church Street SPS
45.0
Omemee
Sturgeon Road SPS
88.0
Table 3-5: Sewage Pumping Station Capacity Summary (cont’d)
T/Lin
Community
Station
Firm Capacity [L/s]
Coboconk
South Water Street SPS (No. 1)
8.2
Coboconk
Water Street SPS (No. 2)
18.2
Coboconk
Main Street SPS (No. 3)
19.5
Project Number 10599 January 2025
Page | 14
Kawartha Lakes
Project File Report Kawartha Lakes Water Wastewater Servicing and Capacity Master Plan
4 Planning Considerations The basis for all Master Planning activities is ultimately the growth forecast for the municipality. Once these forecasts are established, we commence the process of determining what the future servicing needs will be in order to accommodate this growth while ensuring that the municipality’s intended level-of-service is provided to the new service areas, but also maintained for existing residents and businesses. A complete summary of the City of Kawartha Lakes planning forecasts is included in the Servicing Needs Assessment (Technical Memorandum 5), which is included in this Project File Report as Appendix C.
4.1 Summary of Planning Forecasts The City of Kawartha Lakes Growth Management Strategy was reviewed and compared with the List of Current Developments Under Review. The List of Current Developments included development statistics for only Lindsay, Bobcaygeon and Fenelon Falls. For the rest of the communities, City of Kawartha Lakes Growth Management Strategy (May 2011) was utilized to determine the growth on a community-wide basis. These statistics were categorized as build out conditions. Within each of the municipalities, a number of Planning Categories were identified in order to establish a general anticipated sequencing of growth, but this is not a formal process – development of all parcels within Category “P1” does not have to be completed before development in Category “P2” can commence.
4.1.1 Lindsay Planning Forecast The planning priorities in Lindsay have been subdivided into six individual categories, as identified in Table 4-1. These categories are generic, and there is no guarantee nor stipulation that development in one category must be completed before development in other categories can commence. The categories are broadly described as follows: ► P1: Committed - Existing (Agreement+Buildout started prior to 2024) ► P2A: Northwest Trunk, Southeast Development Charge By-Law ► P2B: Other 2011 Growth Management Strategy ► P3: Bromont Residential (Angeline) - GMS+Municipal Zoning Order (MZO), Flato Residential & Commercial (inside Settlement boundary) ► P4: Bromont MZO (Callaghan); Flato MZO
T/Lin
Project Number 10599 January 2025
Page | 15
Kawartha Lakes
Project File Report Kawartha Lakes Water Wastewater Servicing and Capacity Master Plan
► P5: Other Employment Table 4-1: Lindsay Planning Forecast Details Planning Category
Description
Existing
P1
P2A
P2B
T/Lin
Committed Existing (Agreement +Buildout started prior to 2024)
Northwest Trunk, Southeast Development Charges By-Law
Other 2011 Growth Management Strategy
Residential Units
Residential Population
I/C/I Lot Area [ha]
10,210
23,046
153.0
1,135
2,611
5.6
11,345
25,657
158.6
8,792
20,222
24.9
20,137
45,878
183.6
2,266
5,212
2.4
22,403
51,090
186.0
Project Number 10599 January 2025
Page | 16
Kawartha Lakes
Project File Report Kawartha Lakes Water Wastewater Servicing and Capacity Master Plan
Planning Category
Description
Residential Units
Residential Population
I/C/I Lot Area [ha]
P3
Bromont (Angeline) MZO, Flato Res. & Com. (Inside Settlement Boundary) & others
1,462
3,363
4.4
23,865
54,453
190.4
23,865
54,453
190.4
P4
Bromont MZO (Callaghan); Flato MZO
9,846
22,646
0.0
33,711
77,098
190.4
0
0
128.7
33,711
77,098
319.0
P5
Other Employment
A map of the anticipated development parcels is provided in Figure 4-1.
4.1.2 Bobcaygeon Planning Forecast provides a summary of the existing and planned development statistics for Bobcaygeon. The planning horizon includes Committed Future and Committed Existing and properties identified in the Growth Management Strategy. The map of planned development in Bobcaygeon is provided in Figure 4-2.
T/Lin
Project Number 10599 January 2025
Page | 17
Kawartha Lakes
Project File Report Kawartha Lakes Water Wastewater Servicing and Capacity Master Plan
Table 4-2: Bobcaygeon Planning Forecast Details Planning Category
Description
Existing P1
P2
P3
T/Lin
Committed - Existing
Committed - Future
Other 2011 Growth Management Strategy
Residential Units
Residential Population
I/C/I Lot Area [ha]
1,513
3,595
4.0
103
237
0.0
1,616
3,832
4.0
366
842
2.2
1,982
4,674
6.2
1,766
4,063
18.0
3,748
8,736
24.2
Project Number 10599 January 2025
Page | 18
¯ LIN-E-1-20 LIN-G-24 LIN-G-1
Legend
LIN-G-21
LIN-G-22
LIN-E-1-17
LIN-G-2 LIN-E-AIR
LIN-G-19
LIN-G-25
Landuse_Type
LIN-I-1EC LIN-E-1-2 LIN-E-1-3 LIN-E-1-14 LIN-G-26
LIN-I-BB
LIN-I-W LIN-I-V
Vacant/ Unserviced
LIN-E-1-4 LIN-E-1-7
LIN-E-1-10
LIN-G-3
Settlement Boundary
LIN-G-20
LIN-I-AA
LIN-E-1-12
LIN-I-KK
LIN-E-1-9
Committed - Existing
LIN-E-1-15 LIN-FLATO-3
Committed - Future MZO
LIN-E-1-5 LIN-E-1-13
Projected Future
LIN-I-U
LIN-G-4
LIN-FLATO-7
LIN-I-X LIN-E-1-11
LIN-E-1-1
LIN-E-1-8 LIN-FLATO-8
LIN-E-1-6
LIN-G-32 LIN-I-Y
LIN-I-Z1
LIN-I-Z2
LIN-I-Z3
LIN-I-WEL
LIN-I-A
LIN-FLATO-1
LIN-G-30
LIN-G-28
LIN-I-6EC
LIN-E-1-19
LIN-I-M
LIN-I-C LIN-E-1-18
LIN-I-E LIN-I-D
LIN-I-FF LIN-I-1-23
LIN-E-2-1 LIN-I-H3
LIN-I-GG LIN-I-HH
LIN-I-H2
LIN-G-6
LIN-I-P
LIN-I-H1
LIN-G-10
LIN-G-16 LIN-G-14
LIN-I-SCH
LIN-I-2
LIN-SPA-1-09
LIN-SPA-1-08
LIN-FLATO-13
LIN-FLATO-12
LIN-FLATO-11
LIN-I-2
LIN-SPA-1-06
LIN-SPA-1-21
LIN-I-3 LIN-I-4 LIN-I-5
LIN-SPA-1-02
Kawartha Lakes W-WW Master Plan
LIN-I-2
LIN-SPA-1-04 LIN-SPA-1-03
LIN-I-6
Figure 4-1:Lindsay LindsayDevelopments Projected Development
LIN-E-MEL
0
0.375 0.75
1.5
2.25
3 Kilometers
TY Lin Project #: 10599
LIN-BRO-1
LIN-SPA-1-07
LIN-BRO-8
LIN-FLATO-10
LIN-G-31 LIN-G-15
LIN-I-SKY
LIN-G-11
LIN-FLATO-9
LIN-I-II
LIN-I-4EC LIN-G-6
LIN-FLATO-2
LIN-I-JJ
LIN-I-J LIN-I-HAM
LIN-FLATO-6
LIN-I-Q
LIN-I-N
LIN-I-EE
LIN-G-6
LIN-FLATO-5
LIN-G-27
LIN-I-B
Projected Future - Employment Only
LIN-FLATO-4
DRAWN BY: JA Sources: Esri, HERE, Garmin, Intermap, increment P Corp.,
DATE: January 2025
¯ Legend Settlement Boundary
BOB-G-ARI
Category
BOB-G-8 BOB-G-RIV
Commited - Existing Commited - Future Projected Future
BOB-G-1 BOB-I-A
BOB-I-B
BOB-G-ROK-2&3
BOB-C-KAW
BOB-G-PRI
BOB-I-C BOB-G-5
BOB-G-ROK-1B BOB-G-ROK-1A BOB-G-3
BOB-G-COT
BOB-G-6A BOB-G-7
BOB-G-6B
Kawartha Lakes W-WW Master Plan
BOB-I-WAR
Figure 4-2: Bobcaygeon Projected Development Bobcaygeon Planning Information 0
500
1,000
1,500
2,000 Meters
SCALE:1:20,000
Sources: Esri, HERE, Garmin, Intermap, increment P Corp.,
TY Lin Project #: DATE: January 2025 10599
Kawartha Lakes
Project File Report Kawartha Lakes Water Wastewater Servicing and Capacity Master Plan
4.1.3 Fenelon Falls Planning Forecast Table 4-3 provides a summary of the existing and planned development statistics for Fenelon Falls. The map of planned development in Fenelon Falls is provided in Figure 4-3. Table 4-3: Fenelon Falls Planning Forecast Details Planning Category
Description
Existing P1
P2
Committed Existing
2011 Growth Management Strategy
Residential Units
Residential Population
I/C/I Lot Area [ha]
903
2,502
11
178
409
0.0
1,081
2,911
11
1,320
3,036
0.0
2,401
5,947
11
4.1.4 Omemee Planning Forecast Table 4-4 provides a summary of the existing and forecasted development statistics for Omemee. The map of planned development in Fenelon Falls is provided in Figure 4-4. Table 4-4: Omemee Planning Forecast Details Planning Category
Description
Existing P1
P2
T/Lin
Committed Existing
2011 Growth Management Strategy
Residential Units
Residential Population
I/C/I Lot Area [ha]
0
1,035
7
30
69
0.0
30
1,104
7
427
982
0.0
457
2,086
7
Project Number 10599 January 2025
Page | 21
Kawartha Lakes
Project File Report Kawartha Lakes Water Wastewater Servicing and Capacity Master Plan
4.1.5 Woodville Planning Forecast Table 4-5 provides a summary of the existing and planned development statistics for Woodville. The map of planned development in Fenelon Falls is provided in Figure 4-5. Table 4-5: Woodville Planning Information Planning Category
Description
Existing Buildout
T/Lin
2011 Growth Management Strategy
Residential Units
Residential Population
I/C/I Lot Area [ha]
0
619
0
148
363
0.0
148
982
0
Project Number 10599 January 2025
Page | 22
1 12 D RO A
T
CO UN TY
TR EE AL BE RT S
PR IN
S DD DO
CE
ST
FEN-G-2
S
S
EE TR
RE
ET
T
WE
ST
STRE
T SH OR
RO
T
BO RN ES
T ST RE E
NE DY DR IV E
FEN-G-4
G KIN
T
TR EE
T
TR EE MU RR AY S
L IN DS AY S
ER AN SW AY
FEN-I-G
FEN-I-H
PE
R
ST RE
D OA
T
JU NI
TR O IN
VE T
NP
TR EE
AD RO
FEN-I-B
OT S
IV E DR
IO N
8
EL LI
DA L IS JAN
ET TRE
SS NCE CO
ET
N
AD RO
EET ST R
E STR
ST WE
E IOL OR
O AD TY R COUN
EET ST R
EO RG STU
KE N
T
Committed - Future
IN S EL G
N HELE
Urban Settlement Boundary Committed - Existing
CL IFT ON
RE E
8
Category
CO L ST
AD
TR EE T
JO HN ST RE E
T
Y
OA K
Legend
NT
ST RE E
ET
U CO
QU EE N
FEN-MOOR
FEN-MUSK
¯
REET
STREET
FEN-G-1
ET
FEN-I-E FEN-MUR HW
T
S ICE EL L
E RIV R IV RD
L RIA UST IND
FEN-G-6
ET TR E
C WY
EN SC RE DC O O
E
K PAR
AD 121
VE DRI
N FRA
CIS
EE STR
TE
AST
COUNTY RO
Kawartha Lakes W-WW Master Plan B RA YS
Figure 4-3: Fenelon Falls Projected Development Fenelon Falls
1.2
Kilometers 1.6
T
0.8
TH SO U
0.4
EET ST R
0.2
EE TR
ST WE
0
SCALE:1:11,852
Sources: Esri, HERE, Garmin, Intermap, increment P Corp.,
TY Lin Project #: DATE: January 2025 10599
¯ OME-G-2
OME-G-1
Legend Urban Settlement Boundary
OME-G-3
OME-G-4
Category
OME-G-5
2011 Growth Management Strategy Active development application
OME-C-1 OME-G-8
TY Lin Project #: 10599
OME-G-9
Kawartha Lakes W-WW Master Plan Figure 4-4: Omemee Projected Omemee Planning Information Development 0
125
250
500
750
1,000 Meters
SCALE:1:10,000
Sources: Esri, HERE, Garmin, Intermap, increment P Corp.,
DRAWN BY: JA
DATE: January 2025
¯ Legend Settlement boundary Woodville Developments
WDV-G-4
WDV-G-3
WDV-G-2
WDV-G-1
TY Lin Project #: 10599
Kawartha Lakes W-WW Master Plan FigureWoodville 4-5: Woodville Projected Planning information Development 0
125
250
500
750
1,000 Meters
SCALE:1:10,000
Sources: Esri, HERE, Garmin, Intermap, increment P Corp.,
DRAWN BY: JA
DATE: January 2025
¯ Legend
OWD-G-1
Oakwood_developments Settlement Boundary
OWD-G-2 OWD-G-4
OWD-G-3
TY Lin Project #: 10599
OWD-G-5 Kawartha Lakes W-WW Master Plan Figure 4-6: Oakwood Projected Oakwood Developments Development
0
0.125 0.25
0.5
0.75
1 Kilometers
DRAWN BY: JA Sources: Esri, HERE, Garmin, Intermap, increment P Corp.,
DATE: January 2025
Kawartha Lakes
Project File Report Kawartha Lakes Water Wastewater Servicing and Capacity Master Plan
4.1.6 Small System Planning Forecasts The growth projections for the Small Water Systems are presented in Table 4-6. In many of these communities, there are no formal significant development applications that have been identified at this time, and servicing approvals will have to be considered as planning considerations evolve. For others, though, there are known development opportunities, and the servicing needs associated with those potential developments are identified. Note that a forecasted growth of “0” does not imply that development applications will not be considered. Table 4-6: Small Water System Servicing Needs
T/Lin
Community
Forecasted Population Growth
Birch Point
0
Canadiana Shores
0
Coboconk
16
Janetville
186
Kings Bay
106
Kinmount
329
Manilla
150
Manorview
0
Mariposa
0
Norland
12
Pinewood
366
Pleasant Point
0
Sonya
0
Southview Estates
0
Victoria Place
0
Western Trent/Palmina
23
Woodfield
21
Project Number 10599 January 2025
Page | 27
Kawartha Lakes
Project File Report Kawartha Lakes Water Wastewater Servicing and Capacity Master Plan
4.2 Water and Wastewater Servicing Basis In order to establish the overall community-by-community servicing needs, we consider the following process: 1. The servicing needs of the existing serviced community are based on historical data. ► While there can certainly be some year-to-year variation, it is generally understood that the best estimate of the servicing needs of a community are those from the previous calendar year; ► Water demands are often influenced by annual precipitation, with years with higher rainfall often resulting in reduced water consumption (largely due to less lawn watering); ► Conversely, wastewater flows generally increase with rainfall, as wastewater systems are generally susceptible to some degree of rainfall-induced inflow and infiltration; ► In order to account for these potential variations, historical water demands and wastewater flows (from annual reports from the treatment facilities) from the past five years (2019 through 2023) were considered. 2. The servicing needs of the forecasted developments will be based on the City of Kawartha Lakes Infrastructure Guidelines (2023). Table 4-7 lists the design criteria used to determine the water and wastewater servicing needs. Table 4-7: City of Kawartha Lakes Water and Wastewater Design Criteria
Zoning
Water – Average Day Demand (ADD)
Water – Maximum Date Peaking Factor
Wastewater – Average Flow
Wastewater – Peaking Factor
Wastewater – I&I Allowance
Residential
450 Lpcd
(see below)
450 Lpcd
Harmon
0.26 L/ha/s
Industrial, Commercial
0.40 L/ha/s
1.0
0.40 L/ha/s
1.0
0.26 L/ha/s
Institutional
0.40 L/ha/s
1.0
0.32 L/ha/s
1.0
0.26 L/ha/s
4.2.1 Peaking Factors – Water Table 3-1 of the MECP Design Guidelines identify Maximum Day Peaking Factors based on the size of a community. The factors applicable to Kawartha Lakes communities are as follows: ► 500 – 1,000 residents: 2.75 ► 1,001 – 2,000 residents: 2.50
T/Lin
Project Number 10599 January 2025
Page | 28
Kawartha Lakes
Project File Report Kawartha Lakes Water Wastewater Servicing and Capacity Master Plan
► 2,001 – 3,000 residents: 2.25 ► 3,001 – 10,000 residents: 2.00 ► 10,001 – 25,000 residents: 1.90 ► 25,001 – 50,000 residents: 1.80 ► 50,001 – 75.000 residents: 1.75
4.2.2 Peaking Factors – Wastewater Peaking factors for residential wastewater design flows are calculated based on the Harmon Formula as follows: H = 1 + (14 ⁄ (4 + P0.5)) H being the Harmon peaking factor and P the design population in thousands, noting that the minimum permissible peaking factor is 2.0.
4.3 Forecasted Servicing Needs by Community Detailed calculations for each community are provided in Appendix C, and are summarised below. In this summary, we are focusing on the system-wide servicing needs. In particular, we are considering the Water Treatment Plant (WTP) capacity, the required Water Storage, and the Water Pollution Control Plan (WPCP) capacity.
4.3.1 Lindsay Facility Capacity Analysis The below table summarizes the capacity analysis of the different facilities based on the forecasted growth in Lindsay. Table 4-8: Lindsay Facilities Capacity Analysis Summary
Facility
WTP
T/Lin
Current Capacity
Current Utilization
Required Buildout Capacity
22,730 m3/day (MDD)
58%
62,031 m3/day (MDD)
Project Number 10599 January 2025
Additional Units at 80% Capacity
Additional Units at 100% Capacity
1,900
4,500
Page | 29
Kawartha Lakes
Project File Report Kawartha Lakes Water Wastewater Servicing and Capacity Master Plan
Current Capacity
Current Utilization
Required Buildout Capacity
Additional Units at 80% Capacity
Additional Units at 100% Capacity
Water Storage
11,650 m3
84%
29,591 m3
0
1,950
WPCP
24,500 m3/day (ADF)
58%
44,239 m3/day (ADF)
4,500
8,900
Facility
The Lindsay WTP capacity, the available water storage and the WPCP capacity will all need to be upgraded to accommodate the required buildout capacity of Lindsay. These projects will trigger EA studies that should be initiated before the facilities reach 80% of their current rated capacities. For Lindsay, the water storage Class EA should be commenced as soon as possible. The water storage deficit can be resolved with the construction of a new Northwest elevated tank and expansion of the Thornhill Reservoir. For the Lindsay WPCP, the maximum day flows will need to continue to be bypassed using the equalization lagoons, as the current plant cannot handle the maximum day flows. The treatment capacity upgrades for both the WTP and WPCP will require Schedule ‘C’ Class EA studies to be completed, and the water storage will require a Schedule ‘B’ Class EA study.
4.3.2 Oakwood Facility Capacity Analysis The below table summarizes the capacity analysis of the different facilities in the wake of the forecasted growth in Oakwood.
T/Lin
Project Number 10599 January 2025
Page | 30
Kawartha Lakes
Project File Report Kawartha Lakes Water Wastewater Servicing and Capacity Master Plan
Table 4-9: Oakwood Facilities Capacity Analysis Summary Additional Units at 80% Capacity
Additional Units at 100% Capacity
Facility
Current Capacity
Current Utilization
Required Buildout Capacity
Booster Pumping Station
1,390 m3
58%
1,073 m3
85
195
Water Storage
232 m3
138%
424 m3
0
0
The Oakwood Reservoir will need to be expanded to accommodate the existing and required buildout capacity of Oakwood. This EA studies for the water storage Class EA will be classified as a Schedule ‘B’ Class EA and should be commenced as soon as possible.
4.3.3 Bobcaygeon Facility Capacity Analysis The below table summarizes the capacity analysis of the different facilities based on the forecasted growth in Bobcaygeon. Table 4-10: Bobcaygeon Facilities Capacity Analysis Summary
Facility
Current Capacity
Current Utilization
Required Buildout Capacity
Additional Units at 80% Capacity
Additional Units at 100% Capacity
WTP
5,184 m3/day (MDD)
69%
8,900 m3/day (MDD)
260
700
Water Storage
4,400 m3
48%
4,928 m3
1,150
1,850
WPCP
3,055 m3/day (ADF)
85%
5,594 m3/day (ADF)
0
475
The Bobcaygeon WTP capacity, the available water storage and the WPCP capacity will all need to
T/Lin
Project Number 10599 January 2025
Page | 31
Kawartha Lakes
Project File Report Kawartha Lakes Water Wastewater Servicing and Capacity Master Plan
be upgraded to accommodate the full forecasted buildout. The treatment capacity upgrades will require Schedule ‘C’ Class EA studies to be completed, and the water storage will require a Schedule ‘B’ Class EA study. These should all be initiated before the facilities reach 80% of their current rated capacities. The Bobcaygeon WPCP is already operating at greater than 80% of its rated capacity. Planning for upgrades to this facility should be initiated immediately.
4.3.4 Fenelon Falls Facility Capacity Analysis The below table summarizes the capacity analysis of the different facilities based on the forecasted growth in Fenelon Falls. Table 4-11: Fenelon Falls Facilities Capacity Analysis Summary Additional Units at 80% Capacity
Additional Units at 100% Capacity
Facility
Current Capacity
Current Utilization
Required Buildout Capacity
WTP
4,100 m3/day (MDD)
41%
4,840 m3/day (MDD)
940
1,400
Water Storage
1,250 m3
111%
2,808 m3
600
1,100
WPCP
1,800 m3/day (ADF)
64%
2,708 m3/day (ADF)
300
600
The Fenelon Falls WTP capacity, the available water storage and the WPCP capacity will need to be upgraded to accommodate the required buildout capacity. The treatment capacity upgrades will require Schedule ‘C’ Class EA studies to be completed, and the water storage will require a Schedule ‘B’ Class EA study. These studies should be initiated before the facilities reach 80% of their current rated capacities. The available water storage in the Fenelon Falls standpipe is currently deficient, because the majority of the total volume stored is below 16 m of water elevation (above grade), and therefore not available at the required residual system pressure. If a booster pumping station can be installed
T/Lin
Project Number 10599 January 2025
Page | 32
Kawartha Lakes
Project File Report Kawartha Lakes Water Wastewater Servicing and Capacity Master Plan
at the base of the standpipe, then the full storage volume would be available, and the deficiency mitigated, addressing the immediate need to upgrade the Fenelon Falls standpipe. Additional water storage capacity is still required to accommodate the required buildout capacity. This storage capacity volume can also be accommodated at the WTP to offset upgrades or replacement of the existing standpipe, contingent that the sizing of the water supply can meet future maximum day demands, and the high lift pumping station can provided maximum day demands and fire flows. Lastly, due to some of the operational and historical records of overflows at the Fenelon Falls WPCP, there is not sufficient capacity at the WPCP to handle peak flow events that may arise during major storms, with no means of equalization storage as discussed at the Lindsay WPCP.
4.4 Omemee The below table summarizes the capacity analysis of the different facilities based on the forecasted growth in Omemee. Table 4-12: Omemee Facilities Capacity Analysis Summary
Facility
Current Capacity
Current Utilization
Required Buildout Capacity
Additional Units at 80% Capacity
Additional Units at 100% Capacity
WTP
461 m3/day (MDD)
20%
1,164 m3/day (MDD)
100
150
Water Storage
16 m3
327%
497 m3
0
0
450
Satisfies Projected Planned Growth
3
WPCP
1,353 m /day (ADF)
3
44%
1,063 m /day (ADF)
The Omemee WTP capacity and the available water storage will need to be upgraded to accommodate the required buildout capacity. A Class EA Schedule B study was completed by AECOM in 2015 that evaluated upgrading/expanding the Omemee water system to maintain compliance with applicable regulations and accommodate future growth.
T/Lin
Project Number 10599 January 2025
Page | 33
Kawartha Lakes
Project File Report Kawartha Lakes Water Wastewater Servicing and Capacity Master Plan
Several alternatives were formulated and evaluated during this study and the “Do Nothing” alternative emerged as the preferred solution. The other alternatives suggest that a sustainable community water system will not be financially viable at the existing level of development charges and user fees, requiring additional funding. As such, recommendation at this time is to not upgrade the water infrastructure related to the WTP and Reservoir and to utilize the existing WTP capacity for the first phase of growth.
4.5 Woodville The below table summarizes the capacity analysis of the different facilities based on the forecasted growth in Woodville. Table 4-13: Woodville Facilities Capacity Analysis Summary
Facility
Current Capacity
Current Utilization
Required Buildout Capacity
Additional Units at 80% Capacity
Additional Units at 100% Capacity
WTP
588 m3/day (MDD)
59%
799 m3/day (MDD)
40
80
Water Storage
1,160 m3
14%
341 m3
N/A
N/A
The Woodville WTP capacity will need to be upgraded to accommodate the required buildout capacity. The treatment capacity upgrades will require Schedule ‘C’ Class EA studies to be completed. This study should be initiated before the facilities reach 80% of their current rated capacities.
4.6 Small Water Systems The treatment needs for the small water systems are detailed in Table 4-14.
T/Lin
Project Number 10599 January 2025
Page | 34
Kawartha Lakes
Project File Report Kawartha Lakes Water Wastewater Servicing and Capacity Master Plan
Table 4-14: Small Water System Servicing Needs
Water System
Forecasted Population Growth
Additional MDD Water Servicing Need [m3/d]
Reserve Treatment Capacity [m3/day]
Treatment Capacity Available?
Birch Point
0
0
162
Yes
Canadiana Shores
0
0
716
Yes
Janetville
186
209
207
No (see 4.6.1)
Kings Bay
106
119
174
Yes
Kinmount
329
370
252
No (see 4.6.2)
Manilla
150
169
71
No (see 4.6.3)
Manorview
0
0
235
Yes
Mariposa
0
0
5
Yes
Norland
12
14
78
Yes
Omemee
2,686
3,022
369
No (see 4.6.4)
Pinewood
366
412
316
No (see 4.6.5)
Pleasant Point
0
0
345
Yes
Sonya
0
0
92
Yes
Southview Estates
0
0
341
Yes
Victoria Place
0
0
33
Yes
Western Trent/Palmina
23
26
54
Yes
Woodfield
21
24
212
Yes
4.6.1 Janetville Presently, the entire community of Janetville is connected to the water distribution system, and the identified development blocks are adjacent to already-serviced areas. While the forecasted water servicing need is only slightly above the reserve treatment plant capacity, the maximum day demands at Janetville WTP have been fairly consistent over the past five years. It is assumed that a plant expansion would be warranted to service the proposed growth, and that planning for this expansion should be considered.
T/Lin
Project Number 10599 January 2025
Page | 35
Kawartha Lakes
Project File Report Kawartha Lakes Water Wastewater Servicing and Capacity Master Plan
4.6.2 Kinmount Presently, the Kinmount water distribution network is located primarily in the southeast, servicing small areas on either side of the river. The contemplated development is primarily located to the west of the community. The contemplated development is located near the wells, so it may be feasible to connect the new developments to the water supply. There is sufficient space at the Kinmount WTP site to consider a facility expansion. It is therefore assumed that a plant expansion would be warranted to service the proposed growth, and that planning for this expansion should be considered.
4.6.3 Manilla Presently, the Manilla drinking water system supplies a single neighbourhood along Robmar Crescent and John Street. The contemplated development is situated immediately to the east of the existing distribution system, and immediately adjacent to Well #2. It is therefore assumed that a plant expansion would be warranted to service the proposed growth, and that planning for this expansion should be considered.
4.6.4 Omemee While Omemee is one of the larger communities within the City of Kawartha Lakes, the Omemee drinking water system services only a single neighbourhood in the western limits of the community. Of the forecasted development in Omemee, only the developments immediately to the north of the existing service area appear to be feasible for connecting to the existing water supply. A detailed water servicing review for Omemee is recommended to assess the potential expansion to the existing service area, but an expansion to the water treatment plant capacity is not anticipated to be required at this time.
4.6.5 Pinewood Presently, the Pinewood drinking water system supplies only the northern portion of the community. While servicing all of the contemplated growth would require a treatment capacity increase, not all of the forecasted development lands are adjacent to the existing service area. If not all of the development lands are to be connected to the drinking water system, then a facility expansion might not be needed. A detailed water servicing review for Pinewood is recommended to assess the potential expansion to the existing service area, but an expansion to the water treatment plant capacity is not
T/Lin
Project Number 10599 January 2025
Page | 36
Kawartha Lakes
Project File Report Kawartha Lakes Water Wastewater Servicing and Capacity Master Plan
anticipated to be required at this time.
4.7 Small Wastewater Systems The treatment needs for the small water systems are detailed in Table 4-15. Table 4-15 – Small Wastewater System Servicing Needs Wastewater System
Forecasted Population Growth
Additional ADF Wastewater Servicing Need [m3/d]
Reserve Treatment Capacity [m3/day]
Treatment Capacity Available?
Coboconk
16
7
10
Limited (see 4.7.1)
King’s Bay
106
48
87
Yes (see 4.7.2)
The information presented in Table 4-15 also assumes that all new development will be connected to the wastewater collection system, which is not necessarily the case. The individual systems where treatment capacity may not be available are discussed further in the following sections.
4.7.1 Coboconk Presently, the portion of Coboconk that has sanitary servicing is limited to the central area of the community, centred on Water Street and Cameron Street. While there is some available servicing capacity, this is very limited. In 2019, the annual average flows to the Coboconk lagoons reached 98% of the facility capacity. Given that there is no land available to accommodate an expansion to the existing lagoon system and that the contemplated developments are in the western portion of the community and not adjacent to the existing service area, and expansion to the existing facility is likely not warranted.
4.7.2 King’s Bay Presently, the entire community of King’s Bay is connected to the sanitary collection system, and it will likely be proposed to service the contemplated development to the King’s Bay Environmental Centre. While the current facility is receiving fairly low flows, overall, the loadings to the facility are relatively high. Given that there is no redundancy to the two Rotating Biological Contactors (RBCs), a detailed servicing capacity assessment is recommended.
T/Lin
Project Number 10599 January 2025
Page | 37
Kawartha Lakes
Project File Report Kawartha Lakes Water Wastewater Servicing and Capacity Master Plan
5 Capacity Assessment of Water Systems This section provides a capacity review of the existing water systems and identifies infrastructure needs to support projected population growth in the urban areas of Lindsay, Bobcaygeon, Fenelon Falls, and Woodville. It includes an analysis of current water system demands and performance, along with an assessment of the system’s operating capacity. Using population growth projections and design criteria based on Ministry of the Environment, Conservation and Parks (MECP) guidelines and the City’s design standards, water demand forecasts were developed. These projections form the basis for determining future infrastructure requirements up to the 2051 planning horizon.
5.1 Water Model Development The City of Kawartha Lakes uses WaterGEMS as its primary modeling platform. Existing models were updated using the latest GIS data from the City, with asset IDs added for better tracking. Assumptions addressed discrepancies such as assigning diameters to zero-diameter mains.
5.1.1 Water Model Inputs ► Pipe Roughness: C-Factors assigned per the City’s 2021 Infrastructure Guidelines. ► Junction Elevations: Based on new watermains and DEM data from 5m contour OpenData. ► Facility Data: Extracted from O&M manuals, record drawings, and operational setpoints.
5.1.2 Water Modeling Details ► Water Treatment Plants (WTPs): Modeled as reservoirs with fixed HGLs representing Clearwell HGL; pumps included per design setpoints. ► Booster Pumping Stations (BPS): Based on storage and pump design points. ► Water Storage Tanks: Updated with geometry and operating levels from O&M manuals. In steady-state modelling, HGL assumptions in elevated tanks and reservoirs should be as follows:
T/Lin
o
Average Day Demand (ADD): Bottom of Equalization Storage
o
Max Day Demand (MDD): Bottom of Equalization Storage
o
Peak Hour Demand (PHD): Bottom of Equalization Storage
o
Minimum Hour Demand (MIN): Top of Equalization Storage
o
Maximum Day plus Fire Flow (MDD+FF): Bottom of Fire Storage.
Project Number 10599 January 2025
Page | 38
Kawartha Lakes
Project File Report Kawartha Lakes Water Wastewater Servicing and Capacity Master Plan
5.1.3 Water Demand Distribution Demands were distributed in model based on land use at a parcel level: ► Residential Lands: Units were assigned based on City’s data for housing types, with demands calculated per person. ► ICI Parcels: Identified by zoning, with demands calculated based on parcel area. Parcels were aggregated to the nearest model node, and demands were input as “Customer Meters,” populated in the model as: ► Residential lands: Demand based on population units. ► Employment lands: Entered as a base demand.
5.2 Water System Analysis The model simulations are set up as Steady state for all scenarios in WaterGEMS. There are four main scenarios set up under existing condition: ► Average Day Demand (ADD) ► Maximum Day Demand (MDD) ► Peak Hour Demand (PHD) ► Minimum Hour Demand (MIN) ► Maximum Day Demand Plus Fire Flow (MDD+FF) The calculation type is set as Hydraulic only for all scenarios and Fire Flow for the “Maximum Day plus Fire Flow” scenario.
5.3 Existing Water System Constraints Acceptable levels of service in this study are defined as the following: ► System pressure at model nodes is greater than 275 kPa and less than 690 kPa under peak hour demand scenario ► System available fire flow is greater than 75 L/s for residential nodes and 100 to 200 L/s for Employment nodes The performance of the existing system was assessed under peak hour demand (PHD) and maximum day plus fire flow (MDD+FF) conditions, using 2051 population projections. Below figures illustrate the existing system constraints for Lindsay, Bobcaygeon, Fenelon Falls, and Woodville.
T/Lin
Project Number 10599 January 2025
Page | 39
¯ HWY 35
LAGOON RD
THUNDER BRIDGE RD
D
EGLINGTON ST
& 35
ST D OA
IE LO G
201 - 300 mm
WELDON RD
PIGEON LAKE RD
KAWARTHA DR
501 - 900 mm Lindsay 2031 Developments Lindsay 2041 Developments Lindsay 2051 Developments Settlement Boundary
PARKSIDE DR
COUNTY RD 36
ST
"
101 - 200 mm
FIELDSIDE RD
DUKE ST
OK
CO
ST
ANGELINE ST S
HWY 7 & 35
LAURENT BLVD
RIVERVIEW RD
WOLFE ST
LINDSAY ST S
MARY ST W
> 100 PSI Diameter
301 - 500 mm
GEORG IAN ST
HURON ST
MILL ST
ALBERT ST S
ADELAIDE ST S
MCLAUGHLIN RD
DURHAM ST W
91 - 100 PSI
< 100 mm
Verulam Tank
$
DOMINION DR
RIDOUT ST
RUSSELL ST W
51 - 90 PSI
COLBORNE ST E
KING ST
KENT ST W
BR
HWY 7B
GREENFIELD RD
ELM TREE RD
MONARCH RD
DEW DROP INN RD
WELLINGTON ST
$
Tank <= 40 PSI
POST RD
BOND ST
Reservoir
Pressure
VERULAM RD N
REGENT ST
COLBORNE ST W
ST PAUL ST
Thornhill BPS
" $
41 - 50 PSI
NEE DHAM ST
ST PATRICK ST
ELM CRT
POTTINGER ST
WILLIAM ST N
ADELAID E ST N
OA K ST
DANIE L CRT
Legend
WALSH RD
ST DAVID ST
DR
A RD P A RK R
SIMPSON RD
ST PETER ST
ORCH
BLVD
LINDSAY ST N
DAV ID
P LA IN
COUNTY RD 36
CHAM
Road
WHEATFIELD RD
TY Lin Project #: 10599
Lindsay WTP and HLP
Kawartha Lakes W-WW Master Plan HWY 7 & 35
1.5
2.25
DRAWN BY: HZ
D
HWY 7
3 Kilometers
ER R
0.375 0.75
HALT
0
Figure 5-1: Lindsay Existing Network; Lindsay Existing Network 2051 Constraints 2051 Peak Peak Hour Hour Demand Demand Pressures
GOLDENMILE RD
Sources: Esri, HERE, Garmin, Intermap, increment P Corp.,
DATE: January 2025
¯ HWY 35
LAGOON RD
THUNDER BRIDGE RD
EGLINGTON ST
& 35
ST D OA
ST LO G
IE ST
RIVERVIEW RD
WELDON RD
PIGEON LAKE RD
KAWARTHA DR
501 - 900 mm Lindsay 2051 Developments Lindsay 2041 Developments Lindsay 2031 Developments
PARKSIDE DR
Settlement Boundary
COUNTY RD 36
OK
CO
ANGELINE ST S
HWY 7 & 35
LAURENT BLVD
101 - 200 mm
FIELDSIDE RD
DUKE ST
"
Diameter
201 - 300 mm
WOLFE ST
LINDSAY ST S
MARY ST W
> 200 L/s
301 - 500 mm
GEORG IAN ST
HURON ST
MILL ST
ALBERT ST S
ADELAIDE ST S
MCLAUGHLIN RD
DURHAM ST W
151 - 200 L/s
< 100 mm
Verulam Tank
$
DOMINION DR
RIDOUT ST
RUSSELL ST W
101 - 150 L/s
COLBORNE ST E
KING ST
KENT ST W
BR
HWY 7B
$ GREENFIELD RD
ELM TREE RD
MONARCH RD
DEW DROP INN RD
WELLINGTON ST
< 75 L/s
POST RD
BOND ST
Available Fire Flow
VERULAM RD N
COLBORNE ST W
ST PAUL ST
Thornhill BPS
REGENT ST
" Reservoir $ Tank
76 - 100 L/s
NEE DHAM ST
ST PATRICK ST
ELM CRT
POTTINGER ST
WILLIAM ST N
ADELAID E ST N
OA K ST
DANIE L CRT
Legend
WALSH RD
ST DAVID ST
D
SIMPSON RD
ST PETER ST
DR
A RD P A RK R
BLVD
LINDSAY ST N
DAV ID
ORCH
P LA IN
COUNTY RD 36
CHAM
Road
WHEATFIELD RD
TY Lin Project #: 10599
Lindsay WTP and HLP
Kawartha Lakes W-WW Master Plan HWY 7 & 35
1.5
2.25
DRAWN BY: HZ
D
HWY 7
3 Kilometers
ER R
0.375 0.75
HALT
0
Lindsay Existing Network 2051 Constraints Figure 5-2: Lindsay Existing Network; Maximum Day Demand+Fire Flow 2051 Maximum Day + Fire Flow Demand Available Fire Flow
GOLDENMILE RD
Sources: Esri, HERE, Garmin, Intermap, increment P Corp.,
DATE: January 2025
6 RD 3
6 C OU NT Y RD 3
9
CO UN TY
4 RD
RD ERS
RD
ST T AN NE S
ST
PO SNAKE
ST
Diameter
E
<= 100 mm 101 - 150 mm
INT R D
M IL
L
151 - 200 mm
N CRT SYLVA
201 - 300 mm Bocaygeon 2031 Developments
ST
Bocaygeon 2041 Developments Bocaygeon 2051 Developments
ST
E AV
S
PA RK
LAN
DR
AY DR
T EAS
Settlement Boundary
R VE D RI K R R PA
ST
> 100 PSI
S RT PO
EST OR EF D L O
AN DB
91 - 100 PSI
IL TR A
ORS IGAT NAV
S
PAR K
ST
ST
NS IN M
ISL
T EAS
DR
W ST
E ST
ST S
E RF PE
US CT
G KIN
D BOY
T EAS
RK PA
T
G KIN
ST
ST
S RK PA
W
D NEE
LE CO
ST
ST
51 - 90 PSI
N
T
"
W
41 - 50 PSI
ST
ST
L NA CA
Pressure
<= 40 PSI
S MAIN
ST
T EN S QUE
" Reservoir $ Tank
R DA D CE EE R R T
T EAS
ST
Reservoir
ST NT FRO
ST
MA IN
T
Legend
R
N
ES DUK
T
D DE RSI
27
ST
H
E RIV
T EAS
SE P
1 FR
MA IN T
ES JAN
D HEA
ST WE
D8 YR
JO
COUNTY RD 8
8 RD
NS DUN
T TH S KE ST NOR DU
T
ST N
T
ST
NT COU
NTY COU
T
Tank
RS
T EAS
ST T AVA AS ACL LAV BAL BALAC
DS REI
ST WE
S RTH NO
$
LO TAY
HEL EN
RD ERS
ST
ST
MA IN S T MA MA IN S IN T ST
V OLI ICK TB
T KS BIC
K BIC
D AR
FR 128
TY UN CO
V OLI
HS COS
KS BIC
ALM
¯
Road
T EAS
CO ES UN TU TY RI RD AN 2 RD 4
ST
E AN
S
EGO GR MC R RD
Y UNT CO 3 RD 6
TY UN CO
24
L RY BER
RD CH RAN
RD
RD
24
T EAS
RD
Kawartha Lakes W-WW Master Plan
3 RD
TY UN CO
Y CK RO
RD
S
RK PA 24 T Y RD UN TY CO UN CO
ST
K OA
LAKELAND RD
6
0
T UN CO
500
D2 YR
BobcaygeonExisting 2051 Network; Figure 5-3: Bobcaygeon Network 2051 Constraints 2051Existing Peak Hour Demand Peak Hour Demand Pressures
4
1,000
1,500
2,000 Meters
SCALE:1:20,000
Sources: Esri, HERE, Garmin, Intermap, increment P Corp.,
TY Lin Project #: DATE: January 2025 10599
6 RD 3
6 C OU NT Y RD 3
9
CO UN TY
4 RD
RD ERS
RD
ST MA IN
ST
AN NE S
ST
T
L EST
151 - 200 L/s 201 - 250 L/s
E AN
Diameter
<= 100 mm
AY DR
101 - 150 mm
DR
SNAK
ST
AN DB
R FO
T RD E POIN
M IL
T EAS
L
151 - 200 mm
N CRT SYLVA
201 - 300 mm Bocaygeon 2031 Developments
ST
Bocaygeon 2041 Developments
ST
E AV
Bocaygeon 2051 Developments
S
PA RK
E OLD
101 - 150 L/s
AIL
S RT PO
E ST
TR ORS IGAT
S R VE D RI K R R PA
ST
NAV
ST
G KIN
ISL
T EAS
W ST
ST S
PAR K
ST
T EAS
NS IN M
TW
ST
DR
G KIN
D BOY
N
S TU EC RF E P
T
76 - 100 L/s
D NEE
S RK PA
ST
<= 75 L/s
ST
T
LE CO
T
S
" Reservoir $ Tank
Available Fire Flow
T EAS
ST
L NA CA
Legend
R
R DA D CE EE R R T
S MAIN
ST
T EN S QUE
D DE RSI
N
ST
S RK PA
T
MA IN
T
"
S NT FRO
E RIV
27
ST
ES DUK
Reservoir TW
1 FR
T EAS
H
D HEA
ST WE
8 RD
T
ES JAN
SE P
T
ST N
T
ST
NTY COU
NT COU
COUNTY RD 8
D8 YR
NS DUN
T TH S KE ST NOR DU
JO
Tank
RS
T EAS
ST T AVA AS ACL LAV BAL BALAC
DS REI
ST WE
ST RTH NO
$
LO TAY
HEL EN
RD ERS
ST
ST
MA IN S T MA MA IN S IN T ST
V OLI ICK TB
T KS BIC
K BIC
D AR
FR 128
TY UN CO
V OLI
HS COS
KS BIC
ALM
¯
Settlement Boundary
T EAS
Road
CO ES UN TU TY RI RD AN 2 RD 4
ST
E AN
S
EGO GR MC R RD
Y UNT CO 3 RD 6
TY UN CO
24
L RY BER
RD CH RAN
RD
RD
24
T EAS
RD
Kawartha Lakes W-WW Master Plan
3 RD
TY UN CO
Y CK RO
RD
S
RK PA 24 T Y RD UN TY CO UN CO
ST
K OA
LAKELAND RD
6
0
T UN CO
500
D2 YR
Bobcaygeon Figure 5-4: Bobcaygeon Existing Network; Existing Network 2051 Maximum Day 2051 + FireConstraints Flow Demand MDD+FF Available Fire Flow
4
1,000
1,500
2,000 Meters
SCALE:1:20,000
Sources: Esri, HERE, Garmin, Intermap, increment P Corp.,
TY Lin Project #: DATE: January 2025 10599
RT
RA IL
NO
¯
IN E
USH T
HL
S UG
AD
AR B
RO
LOUIS A ST CE
DD
" Reservoir $ Tank
AL
IN
DO
PR
BE
CO
RT
UN
ST
TY
RE
RO
ET
AD
12
1
REET
GAB LE STR EET
S
S
S
ST RE ET
TR EE
TW
ES T SHO R
EE
T
ST
HN
OR
NE
JO
$
AD
41 - 50 PSI
8
51 - 90 PSI 91 - 100 PSI > 100 PSI
Diameter
R IV
<= 100 mm
ED
T
EE
T
WA Y
NN
T
AY S
TR
NS
EE TR
DS MU
RR
AY S
LIN
RA TE
D
VE
OA
D
W
CR
ES
CE
NT
NI
PE
R
Fenelon Falls 2041 Developments ST
RE
ET
ICE
RIV ER
R IA
D RIV
US T
E ET
IN D
ST R
CH
Fenelon Falls 2031 Developments
EL L
WY
Urban Settlement Boundary
OA
T
JU
D OO
251 - 300 mm
TR
D
O IN
DA
201 - 250 mm
NR
EE
LI S
SS IO
TR
J AN
NCE
TS
151 - 200 mm
NP
ET
LI O
E R IV
ET
CO
T RE
D D8
EL
T RE
EO
GS E
ET
IN S
RG
KIN HEL
N
OA
EET
ER
STR
IO L R OA
ST
WE
OR
C
TY O UN
EL G RE N ST
101 - 150 mm
STU
KE
EE
YD
ON
TR
I FT
KS
CL
OA
E
ST
RE
ET
CO
LB
"
<= 40 PSI RO
Tank
RE
ST
ET
RE
ET
TR
TY
NS
Pressure
EET
UN
EE
T S TR
CO
QU
Reservoir
Legend
E
L PA RK
N
T RE
ET
E AS
T
CO UNTY RO
IVE
AD 121
DR
F RA
S C IS
RA
Kawartha Lakes W-WW Master Plan
BY ST RE
WE
ET
ST STR
Fenelon Falls Figure 5-5: Fenelon Falls Existing Network; Existing Network 2051 Constraints 2051 Peak Hour Demand Peak Hour Demand Pressures
EET SO U
Kilometers 2 TH
0
0.25
0.5
1
1.5
SCALE:1:15,000
Sources: Esri, HERE, Garmin, Intermap, increment P Corp.,
TY Lin Project #: DATE: January 2025 10599
RT
RA IL
NO
¯
IN E
USH T
HL
S UG
AD
AR B
RO
LOUIS A ST CE
DD
" Reservoir $ Tank
AL
IN
DO
PR
BE
CO
RT
UN
ST
TY
RE
RO
ET
AD
12
1
REET
GAB LE STR EET
S
S
S
ST RE ET
TR EE
TW
ES T SHO R
EE
T
ST
HN
OR
NE
JO
$
AD
76 - 100 L/s
8
101 - 150 L/s 151 - 200 L/s > 200 L/s
Diameter
R IV
< 100 mm
ED
T
NN
101 - 150 mm
EE
T
WA Y
T
AY S
TR
NS
EE TR
DS MU
RR
AY S
LIN
RA TE VE
D
D
W
Fenelon Falls 2041 Developments
CR
ES
CE
NT
NI
PE
R
ST
RE
ET
ICE
RIV ER
R IA
D RIV
US T
E ET
IN D
ST R
CH
Fenelon Falls 2031 Developments
EL L
WY
OA
T
JU
D OO
Urban Settlement Boundary
TR
D
O IN
DA
OA
EE
LI S
201 - 300 mm
NR
TR
J AN
SS IO
TS
NCE
LI O
151 - 200 mm
NP
ET
EL
E R IV
ET
CO
T RE
D D8
ET
T RE
EO
GS E
RE N ST
IN S
RG
KIN HEL
N
OA
EET
ER
STR
IO L R OA
ST
WE
OR
C
TY O UN
EL G
STU
KE
EE
YD
ON
TR
I FT
KS
CL
OA
E
ST
RE
ET
CO
LB
"
<= 75 L/s RO
Tank
RE
ST
ET
RE
ET
TR
TY
NS
Available Fire Flow
EET
UN
EE
T S TR
CO
QU
Reservoir
Legend
E
L PA RK
N
T RE
ET
E AS
T
CO UNTY RO
IVE
AD 121
DR
F RA
S C IS
RA
Kawartha Lakes W-WW Master Plan
BY ST RE
WE
ET
ST STR
Fenelon Falls Exist. 2051 Constraints Figure 5-6: Fenelon Falls Existing Network; Flow 2051Maximum MaximumDay DayDemand+Fire + Fire Flow Demand Available Fire Flow
EET SO U
Kilometers 2 TH
0
0.25
0.5
1
1.5
SCALE:1:15,000
Sources: Esri, HERE, Garmin, Intermap, increment P Corp.,
TY Lin Project #: DATE: January 2025 10599
¯ Legend
PRESSURE
40 - 50 PSI 51- 90 PSI
Diameter
50 - 100 mm
101 - 150 mm
WDV-G-4
151 - 200 mm
Woodville Developments
WDV-G-3
WDV-G-2
WDV-G-1
TY Lin Project #: 10599
Kawartha Lakes W-WW Master Plan Woodville Figure 5-7: Woodville Existing Network; Existing Network 2051 Constraints 2051 Peak Hour Demand Peak Hour Demand Pressures 0
125
250
500
750
1,000 Meters
SCALE:1:8,130
Sources: Esri, HERE, Garmin, Intermap, increment P Corp.,
DRAWN BY: HZ
DATE: January 2025
¯ Legend
Available Fire Flow <= 75 L/s
76 - 100 L/s
151 - 200 L/s
Diameter
50 - 100 mm
WDV-G-4
101 - 150 mm 151 - 200 mm
Woodville Developments
WDV-G-3
WDV-G-2
WDV-G-1
TY Lin Project #: 10599
Kawartha Lakes W-WW Master Plan Woodville Exist. Network 2051 Constraints Figure 5-8: Woodville Existing Network; Maximum Day Demand+Fire Flow 2051 Maximum Day + Fire Flow Demand Available Fire Flow 0
125
250
500
750
1,000 Meters
SCALE:1:8,130
Sources: Esri, HERE, Garmin, Intermap, increment P Corp.,
DRAWN BY: HZ
DATE: January 2025
Project File Report Kawartha Lakes Water Wastewater Servicing and Capacity Master Plan
6 Capacity Assessment of Wastewater Systems This section provides a capacity review of the existing wastewater systems and identifies infrastructure needs to support projected population growth in the urban areas of Lindsay, Bobcaygeon, Fenelon Falls, and Omemee. It includes an analysis of current wastewater system flows and performance, along with an assessment of the system’s operating capacity. Using population growth projections and design criteria based on Ministry of the Environment, Conservation and Parks (MECP) guidelines and the City’s design standards, wastewater flow forecasts were developed. These projections form the basis for determining future infrastructure requirements up to the 2051 planning horizon.
6.1 Wastewater Model Development The City of Kawartha Lakes uses SewerGEMS as its primary modeling platform. Existing models were updated using the latest GIS data from City, with asset IDs added for better tracking. Assumptions addressed discrepancies such as assigning diameters to zero-diameter mains.
6.1.1 Wastewater Model Inputs ► Pipe Roughness: A Manning’s Roughness Coefficient of 0.013 was applied to all sewer pipe elements, per the City’s 2021 Infrastructure Guidelines. ► Model Update: Extracted from O&M manuals, record drawings, and operational setpoints. ► Wastewater Treatment Plants (WWTPs): WWTPs are modeled as outfalls with a fixed backwater condition representing plant influent hydraulics. Required plant capacities will be assessed based on model results (peak flows). ► Sewage Pumping Stations: Sewage pumping stations are modeled as “EPS” elements, with updated on/off values and individual pump definitions based on documentation provided by CKL. It is understood that these pump curves are based on design capacity, not field inspections.
6.1.2 Wastewater Model Calibration The existing condition model was calibrated for both Dry Weather Flow (DWF) and Wet Weather Flow (WWF). DWF generation rates were calculated using measured flows during dry days, with the model routing flow downstream based on residential population and flow generation rates. For WWF, the wet-weather flow response was reviewed to estimate the peak Inflow and Infiltration (I/I) rate during each storm. The projected 1:25 I/I rate was used for the WWF
Project Number 10599 January 2025
Page | 48
Project File Report Kawartha Lakes Water Wastewater Servicing and Capacity Master Plan
component. Calibration was conducted first at upstream monitoring locations, progressing downstream to account for accumulated flows. Calibration criteria followed WaPUG standards: ► Peak flow matches within -15% to +25% ► Volume matches within -10% to +20% ► Hydrograph shape matches the observed event
6.1.3 Rainfall and Flow Monitoring Data Flow data was collected from January 2023 to October 2023, supplemented by data from a previous program in Lindsay (Nov 2021-Nov 2022). Thirty-seven monitoring stations across Lindsay, Fenelon Falls, and Bobcaygeon were analyzed. Rainfall data from nine Civica gauges (5 in Lindsay, 2 in each of Fenelon Falls and Bobcaygeon) was also used for analysis. For more information about the flow monitoring analysis, please refer to TM 3 of the Master Plan.
6.1.4 Historical Wastewater Model Calibration The City's original model was not calibrated; it was initially delivered as a steady-state model for Lindsay, Bobcaygeon, and Fenelon Falls. These models were transitioned to "EPS" (Extended Period Simulation) for more accurate capacity hydraulic analysis over time.
6.1.5 Dry Weather Flow (DWF) Calibration DWF rates were calibrated by averaging measured flows during dry periods. Data gaps or poorquality data were excluded.
6.1.6 Wet Weather Flow (WWF) Rainfall-Derived Inflow and Infiltration (I/I) was estimated from rates observed during the monitoring period, with the specific I/I rate detailed in TM3.
6.1.7 Wastewater Load Distribution Model sanitary loads were assigned to the nearest sewer or manhole through Input as “Property connections”, which includes: ► Sanitary Unit Loads o
Loading unit count (Population)
o
Unit Sanitary Load: Generation rate as per the calibration process and a respective sanitary patter was assigned per catchment area.
Project Number 10599 January 2025
Page | 49
Project File Report Kawartha Lakes Water Wastewater Servicing and Capacity Master Plan
6.1.8 Modelled Baseline Scenario The existing condition model is established using measured flows and utilizes the calibrated model as a baseline. For existing developments, the measured per capita dry weather flow (DWF), sanitary patterns (diurnal pattern), and peaking factors are used. Theoretical per capita DWF and I/I rates are used to characterize the flow from unmonitored areas, as per the City’s design criteria. The EPS set up for the baseline conditions supported the development of the TM4 – system capacity assessment.
6.1.9 Modelled 2051 Scenario For the future areas, per capita DWF and I/I rates are used, as per the City’s design criteria. The I/I rate was calculated based on the area of each parcel and assigned as baseflow (Inflow profiles). The sanitary patterns for future subcatchments are generated to produce a peak flow based on Harmon Peaking Factor. The 2051 scenario is modeled using steady-state simulations to assess the existing sewer system constraints. Sewage Pumping Stations (SPS) are modeled as outfalls, with the flow from these outfalls directed to the corresponding forcemain connection nodes. This approach assumes all flow from the SPS is transferred downstream, representing the worst-case scenario for downstream sewers. The flow at the outfall is then compared with the SPS-rated capacity to determine if any upgrades are required.
6.2 Existing Wastewater System Constraints Acceptable levels of service in this study are defined as the following: ► Free flow under the dry-weather flow (no surcharge); i.e., the maximum flow depth is below the obvert of the pipe, no surcharge of the pipe; and ► Limited Surcharge under Wet-weather flow – The pipe is operating under surcharge conditions, and the distance between the ground elevation and the HGL is greater than 1.8 m Exceptions would be made for the criteria considering the condition and location of the pipes. The performance of the existing system was assessed under Dry weather flow conditions and wet weather flow conditions, using 2051 population projections. Below figures illustrate the existing system constraints for Lindsay, Bobcaygeon, Fenelon Falls, and Omemee.
Project Number 10599 January 2025
Page | 50
¯ HWY 35
LAGOON RD
THUNDER BRIDGE RD
EGLINGTON ST
WELLINGTON ST
ST D OA BR
Lindsay 2041 Developments Lindsay 2051 Developments Road
KAWARTHA DR
PARKSIDE DR
ST
COUNTY RD 36
LO GI E
PIGEON LAKE RD
FIE LDS IDE RD
DUKE ST
ST
WELDON RD
WOLFE ST
LINDSAY ST S
OK
CO
ANG ELINE S T S
HWY 7 & 35
LAURENT BLVD
RIVERVIEW RD
GEORG IAN ST
HURON ST
MILL ST
ADE LAID E ST S
MCLAUGHLIN RD
GREENFIELD RD
DURHAM ST W
MARY ST W
> 100 %
DOMINION DR
RIDOUT ST
RUSSELL ST W
86 - 100 %
WALSH RD
Lindsay 2031 Developments
COLBORNE ST E
KING ST
KENT ST W
ALBERT ST S
MONA RCH RD
DEW DROP INN RD
& 35 HWY 7B
<= 85 %
POST RD
BOND ST
Pipe Capacity
VE RULAM RD N
COLBORNE ST W
ST PAUL ST
REGENT ST
Legend
Settlement Boundary
NEE DHAM ST
ST PATRICK ST
ELM CRT
POTTINGER ST
WILLIAM ST N
ADELAID E ST N
OA K ST
DANIE L CRT
ST DAVID ST
D
SIMPSON RD
ST PETER ST
DR
A RD P A RK R
BLVD
LINDSAY ST N
DAV ID
ORCH
P LA IN
COUNTY RD 36
CHAM
WHEATFIELD RD
TY Lin Project #: 10599
Kawartha Lakes W-WW Master Plan HWY 7 & 35
1.5
2.25
DRAWN BY: HZ
D
H
3 Kilometers
ER R
0.375 0.75
HALT
0
Figure 6-1: Lindsay Existing Network; Lindsay 2051 DWF 2051 Existing Buildout DWF
GOLDENMILE RD
Sources: Esri, HERE, Garmin, Intermap, increment P Corp.,
DATE: January 2025
¯ HWY 35
LAGOON RD
THUNDER BRIDGE RD
EGLINGTON ST
WELLINGTON ST
ST D OA BR
Lindsay 2041 Developments Lindsay 2051 Developments Road
KAWARTHA DR
PARKSIDE DR
ST IE
COUNTY RD 36
LO G
PIGEON LAKE RD
FIELDSIDE RD
DUKE ST
ST
WELDON RD
WOLFE ST
LINDSAY ST S
OK
CO
ANGELINE ST S
HWY 7 & 35
LAURENT BLVD
RIVERVIEW RD
GEORG IAN ST
HURON ST
MILL ST
ALBERT ST S
ADELAIDE ST S
MCLAUGHLIN RD
DURHAM ST W
MARY ST W
Conduit
DOMINION DR
RIDOUT ST
RUSSELL ST W
> 1.80 m
WALSH RD
Lindsay 2031 Developments
COLBORNE ST E
KING ST
KENT ST W
GREENFIELD RD
ELM TREE RD
MONARCH RD
DEW DROP INN RD
& 35 HWY 7B
<= 1.80 m
POST RD
BOND ST
Freeboard
VERULAM RD N
COLBORNE ST W
ST PAUL ST
REGENT ST
Legend
Settlement Boundary
NEE DHAM ST
ST PATRICK ST
ELM CRT
POTTINGER ST
WILLIAM ST N
ADELAID E ST N
OA K ST
DANIE L CRT
ST DAVID ST
D
SIMPSON RD
ST PETER ST
DR
A RD P A RK R
BLVD
LINDSAY ST N
DAV ID
ORCH
P LA IN
COUNTY RD 36
CHAM
WHEATFIELD RD
TY Lin Project #: 10599
Kawartha Lakes W-WW Master Plan HWY 7 & 35
1.5
2.25
DRAWN BY: HZ
D
HWY 7
3 Kilometers
ER R
0.375 0.75
HALT
0
FigureLindsay 6-2: Lindsay 2051 Existing Existing Network; Buildout 2051 WWF WWF
GOLDENMILE RD
Sources: Esri, HERE, Garmin, Intermap, increment P Corp.,
DATE: January 2025
¯ Legend Pipe Capacity <= 85% 86 - 100 % > 100 % Settlement Boundary Bobcaygeon development centroids 2031_Phasing_Bocaygeon_developments 2041_Phasing_Bocaygeon_developments 2051_Phasing_Bocaygeon_developments Bobcaygeon developments
Kawartha Lakes W-WW Master Plan Bobcaygeon 2051Existing Existing Figure 6-3: Bobcaygeon Network; 2051 DWF Buildout DWF 0
500
1,000
1,500
2,000 Meters
SCALE:1:20,000
Sources: Esri, HERE, Garmin, Intermap, increment P Corp.,
TY Lin Project #: DATE: January 2025 10599
¯ Legend Freeboard <= 1.80 m > 1.81 m Conduit Bobcaygeon development centroids 2031_Phasing_Bocaygeon_developments 2041_Phasing_Bocaygeon_developments 2051_Phasing_Bocaygeon_developments
Bobcaygeon developments Settlement Boundary
Kawartha Lakes W-WW Master Plan Bobcaygeon 2051Existing Existing Figure 6-4: Bobcaygeon Network; 2051 WWF Buildout WWF 0
500
1,000
1,500
2,000 Meters
SCALE:1:20,000
Sources: Esri, HERE, Garmin, Intermap, increment P Corp.,
TY Lin Project #: DATE: January 2025 10599
RT
RA IL
NO
¯
IN E
USH T
HL
S UG
AD
AR B
RO
LOUIS A ST CE
DD
S
S
ST RE ET
TR EE
UN
ST
CO
RT BE
IN
AL
PR
DO
S
TW
EE
T
<= 85 % RO
AD
86 - 100 %
8
> 100 % Urban Settlement Boundary
OR
NE
JO
ST
HN
RE
ST
ET
RE
ET
TR
TY
NS
Pipe Capacity
EET
UN
EE
T S TR
CO
QU
U 2031 developments centroids U 2041 developments centroids
U
ES T
SHO R
U
Legend
TY
RE
RO
ET
AD
12
1
REET
GAB LE STR EET
U
LB
ET
CO
Fenelon Falls 2031 Developments
U
Fenelon Falls 2041 Developments
RE
R IV
E
ST
ED
T
EE
T
WA Y
TR
NS
TR
DS
NN
EE
T
AY S
RA
R
MU
RR
AY S
TE VE
LIN
PE
U
ST
RE
D
U NI
OA
T
JU
TR
IV E
D
U
DR
OA
EE
DA
O IN
TR
LI S
NR
TS
J AN
SS IO
LI O
NCE
EL
NP
ET
D D8 R OA
ET
U
ET
CO
T RE TR E
T RE
EO
GS EN S
IN S
RG
KIN HEL
N
OA
EET
ER
STR
IO L
C
TY O UN
ST
WE
OR
U
EL G
STU
KE
EE
YD
ON
TR
I FT
KS
CL
OA
ET
U U W
ES
CE
NT
ICE
U
RIV ER
R IA
D RIV
US T
E ET
IN D
ST R
CH
CR
EL L
WY
D OO
E
L PA RK
N
T RE
ET
E AS
T
CO UNTY RO
IVE
AD 121
DR
F RA
S C IS
RA
Kawartha Lakes W-WW Master Plan
BY ST RE
WE
ET
ST STR
2051 Network; Figure 6-5: Fenelon Fenelon Falls Falls Existing 2051 DWFExisting Buildout DWF
EET SO U
Kilometers 2 TH
0
0.25
0.5
1
1.5
SCALE:1:15,000
Sources: Esri, HERE, Garmin, Intermap, increment P Corp.,
TY Lin Project #: DATE: January 2025 10599
RT
RA IL
NO
¯
IN E
USH T
HL
S UG
AD
AR B
RO
LOUIS A ST CE
S
ST RE ET
TR EE
UN
ST
CO
RT BE
IN
DD
S
Freeboard
AL
PR
DO
S
TW
<= 1.80 m
U
ES T
SHO R
EE
T
RO
U 2031 developments centroids U 2041 developments centroids
AD
8
Conduit
Urban Settlement Boundary
OR
NE
JO
ST
HN
RE
ST
ET
RE
ET
TR
TY
NS
> 1.80 m
EET
UN
EE
T S TR
CO
QU
U
Legend
TY
RE
RO
ET
AD
12
1
REET
GAB LE STR EET
U
LB
ET
CO
Fenelon Falls 2031 Developments
U
Fenelon Falls 2041 Developments
RE
R IV
E
ST
ED
T
EE
T
WA Y
TR
NS
TR
DS
NN
EE
T
AY S
RA
R
MU
RR
AY S
TE VE
LIN
PE
U
ST
RE
D
U NI
OA
T
JU
TR
IV E
D
U
DR
OA
EE
DA
O IN
TR
LI S
NR
TS
J AN
SS IO
LI O
NCE
EL
NP
ET
D D8 R OA
ET
U
ET
CO
T RE TR E
T RE
EO
GS EN S
IN S
RG
KIN HEL
N
OA
EET
ER
STR
IO L
C
TY O UN
ST
WE
OR
U
EL G
STU
KE
EE
YD
ON
TR
I FT
KS
CL
OA
ET
U U W
ES
CE
NT
ICE
U
RIV ER
R IA
D RIV
US T
E ET
IN D
ST R
CH
CR
EL L
WY
D OO
E
L PA RK
N
T RE
ET
E AS
T
CO UNTY RO
IVE
AD 121
DR
F RA
S C IS
RA
Kawartha Lakes W-WW Master Plan
BY ST RE
WE
ET
ST STR
2051 Network; Figure 6-6: Fenelon Fenelon Falls Falls Existing Existing Buildout WWF 2051 WWF
EET SO U
Kilometers 2 TH
0
0.25
0.5
1
1.5
SCALE:1:15,000
Sources: Esri, HERE, Garmin, Intermap, increment P Corp.,
TY Lin Project #: DATE: January 2025 10599
¯ Legend Pipe Capacity <= 85 % 86 - 100 % > 100 %
Omemee developments
Urban Settlement Boundary
TY Lin Project #: 10599
Kawartha Lakes W-WW Master Plan Omemee Wastewate 2051 Figure 6-7: Omemee Existing Network; Existing DWF 2051 DWF 0
125
250
500
750
1,000 Meters
SCALE:1:15,000
Sources: Esri, HERE, Garmin, Intermap, increment P Corp.,
DRAWN BY: JA
DATE: January 2025
¯ Legend Freeboard <= 1.80 m > 1.80 m
Conduit
U Omemee development centroids Omemee developments
U
Urban Settlement Boundary
U U U
U
U
U
TY Lin Project #: 10599
U Kawartha Lakes W-WW Master Plan Omemee Wastewate 2051 Figure 6-8: Omemee Existing Network; Existing WWF 2051 WWF 0
125
250
500
750
1,000 Meters
SCALE:1:15,000
Sources: Esri, HERE, Garmin, Intermap, increment P Corp.,
DRAWN BY: JA
DATE: January 2025
Project File Report Kawartha Lakes Water Wastewater Servicing and Capacity Master Plan
7 Problem Statement The City of Kawartha Lakes is committed to undertaking and updating Water and Wastewater Master Plans to determine how the City’s water and wastewater infrastructure will support growth while also preserving the level of service to existing residents and businesses. The Master Plan will develop a long-term strategy and capital forecast to support future growth through 2051, and to consider post-2051 impacts based on lands identified as supporting the full buildout of the City.
Project Number 10599 January 2025
Page | 59
Project File Report Kawartha Lakes Water Wastewater Servicing and Capacity Master Plan
8 Inventory of the Environments 8.1 Natural Environment Cambium Inc. (Cambium) was retained by TYLin to conduct a Natural Heritage Desktop Study. Data was obtained from provincial, municipal and other online resources for each Study Area, which includes the Settlement Areas of Bobcaygeon, Fenlon Falls, Lindsay and Omemee. The full report can be found in Appendix D. Each study area is within Ecoregion 6E. Development and site alteration are prohibited within provincially significant wetlands (PSW) and significant coastal wetlands in Ecoregions 5E, 6E and 7E. Proposed developments in the Lindsay and Omemee Study Areas encroach on Provincially Significant Wetlands (PSW) and significant woodlands, potentially impacting the connection of existing infrastructure to future developments. Watercourse crossings will be required in all Study Areas to connect existing infrastructure to proposed developments. Additionally, White-Tailed Deer Wintering Areas (Stratum 2) have been identified in the Bobcaygeon, Lindsay, and Omemee Study Areas, which may be impacted by future development connections. A list of species at risk (SAR), with potential to occur in the general vicinity of the Study Area was compiled. A list of Significant Wildlife Habitat (SWH) and Areas of Natural Scientific Interest (ANSI) were also identified through the desktop study. Based on the results of the desktop assessment, endangered or threatened species that had potential to be present within the Study Area were identified. Given the large geographic area that the Study Area occupies, there are a number of SAR, SWH, ANSI and endangered/threatened species. No field surveys were completed to inform on a site-specific level. See full report for the comprehensive screening list.
8.2 Assessment of Archaeological Potential An archaeological potential investigation was completed by Archaeological Services Inc. (ASI) for Lindsay, Bobcaygeon, Fenelon Falls, Omemee and Woodville to assess each community for high archaeological potential. High archaeological potential sites were determined based on the criteria listed in the Standards and Guidelines for Consultant Archaeologists Section 1.3.1 which area: ► Previously identified archaeological sites ► Proximity to water sources ► Physiographic features including elevated topography and well-draining soils
Project Number 10599 January 2025
Page | 60
Project File Report Kawartha Lakes Water Wastewater Servicing and Capacity Master Plan
► Areas of early Euro-Canadian settlement ► Early historical transportation routes The recommended next steps include the completion of a Stage 1 Archaeological Assessment should be completed in accordance with the Standards and Guidelines for Consultant Archaeologists as part of any detailed design activity. This could also be undertaken as a combined Stage 1-2 Archaeological Assessment as appropriate. If archaeological resources are found to be potentially impacted by the undertaking following Stage 2 assessment, the report will identify recommended actions to mitigate any adverse effects of the proposed undertaking on any archaeological resources present within the study area. Recommended mitigation should be completed prior to construction. Please refer to Appendix E for full mapping details for each community.
Project Number 10599 January 2025
Page | 61
Project File Report Kawartha Lakes Water Wastewater Servicing and Capacity Master Plan
9 Identification and Evaluation of Alternative Solutions 9.1 Evaluation Methodology All alternative water and wastewater solutions were comparatively and qualitatively evaluated based on criteria developed within the following main categories, which represent the broad definition of the environment in the EA Act. Within each main category, project-specific evaluation criteria have been developed based on a review of the Municipal Class EA, the existing conditions of the project area, the alternative watermain and sewer projects being considered, and the problem statement. The project-specific evaluation criteria are listed in Table 9-1. Table 9-1: Water and Wastewater Evaluation Criteria Category
Technical Merit
Natural Environment
Socio-Economic Environment
Description The technical feasibility, constructability, ease of access, operation and maintenance, and other engineering aspects of the alternative solution The potential impacts to the natural and physical components of the environment (i.e., air, land, water and biota) including natural and/or environmentally sensitive areas The potential impacts to residents, neighbourhoods, businesses, community character, social cohesion, historical/archaeological remains and heritage features, and community features
Project Number 10599 January 2025
Considerations
o
Functionality
o
Constructability
o
Impact on Natural Environment
o
Need for Greenbelt or Oak Ridges Moraine Crossings
o
Impact on Terrestrial or Aquatic Habitats
o
Cultural Heritage Impacts
o
Transportation Impacts and Road Closures
o
Impacts to Residents and Businesses
o
Odour and Air Quality
Page | 62
Project File Report Kawartha Lakes Water Wastewater Servicing and Capacity Master Plan
Category
Description
Financial Impact
The capital costs of the alternative solution
Considerations o
Anticipated Construction Cost
Each of the alternatives was evaluated comparatively and qualitatively against the considerations presented above and scored based on its impact relative to the other Alternatives, as shown in Table 9-2. Table 9-2: Evaluation Scoring Lowest Score
Medium Score
Highest Score
Based on the evaluation criteria, a qualitative “net effects analysis” has been applied to identify the potential effects on the environment and apply reasonable mitigative measures, identify the relative advantages and disadvantages, and propose the recommended solutions.
9.2 Water and Wastewater Servicing Alternatives The following discusses the various Master Planning-level alternatives that were developed in response to the problem statement and evaluated for both the City’s water and wastewater infrastructure systems.
9.2.1 Alternative 1 – Do Nothing This alternative does not consider any material changes to the existing water distribution and wastewater collection infrastructure systems while the City implements the recommendations and direction provided in its current Growth Optimization Strategy. While this alternative does not address the problem statement, it does provide a benchmark for evaluating the other alternatives as required by the Class EA process.
9.2.2 Alternative 2 – Limit Community Growth This is an adaptation of Alternative 1 in that, while it does not consider any material changes to the existing infrastructure, it seeks to limit the growth envisioned in the current Growth Optimization Strategy to the extent necessary based on the capacity that can be supported by the existing water and wastewater systems.
9.2.3 Alternative 3 – Water Conservation (Water & Wastewater) and I/I Reduction (Wastewater) Project Number 10599 January 2025
Page | 63
Project File Report Kawartha Lakes Water Wastewater Servicing and Capacity Master Plan
This alternative seeks to expand on Alternative 2 by attempting to provide for the growth mandated by the existing Growth Management Strategy without building new infrastructure through the reduction of water consumption and wastewater generation, as well as the reduction of infiltration/inflow to the existing sanitary sewer system. Water conservation would include a reduction in water demand through mandatory/voluntary conservation initiatives. Reduction of Infiltration/Inflow (I/I) would involve the identification and prioritization of areas and initiatives to reduce current I/I levels as well ensuring new infrastructure construction is considerate of this matter.
9.2.4 Alternative 4 – Expand & Enhance Water & Wastewater Infrastructure This alternative considers a combination of enhancements to, and extension of, the existing infrastructure systems to provide for mandated growth within the developed portion of the communities as well as the new growth areas encompassed in the urban boundary as envisioned in the existing Growth Management Strategy. This alternative provides the opportunity to optimize available and planned capacity within the existing municipal infrastructure while expanding into currently unserviced areas inside the settlement boundaries that have already been identified for development.
9.3 Evaluation of Water & Wastewater System Alternatives The following table presents the results of the evaluation process for each of the alternatives considered for both of the City’s water and wastewater systems. Alternative 4, being the expansion and enhancement of the City’s existing water and wastewater infrastructure, was identified as the preferred alternative as a result of Alternatives 1 through 3 not being able to satisfy the City’s (and Province’s) growth mandate.
Project Number 10599 January 2025
Page | 64
Project File Report Kawartha Lakes Water Wastewater Servicing and Capacity Master Plan
10 Recommended Water System Upgrades The proposed water system upgrades consist of the following: Lindsay Water System Upgrades ► WAT-LIN-01: New 400mm WM from the New Tank along Angeline St to Exist. WM on Angeline St ► WAT-LIN-02: New 400mm WM along St Joseph Rd from Colborne St W and Kent St W; New 400mm along Kent St W between St Joseph Rd and Commerce Rd ► WAT-LIN-03: Upgrade WM from 250mm to 300mm along Commerce Rd ► WAT-LIN-04: Upgrade WM from 100/150/250mm to 300mm along Glenelg St W ► WAT-LIN-06: Upgrade WM from 250/450mm to 600mm along Mary St W ► WAT-LIN-10: New 300mm WM along Lindsay St S, South of Logie St ► WAT-LIN-11: WTP Capacity Increase ► WAT-LIN-12: New Elevated Tank ► WAT-LIN-13: Thornhill Road Reservoir Expansion ► WAT-LIN-15: New 300 mm WM for Tribute Lands ► WAT-LIN-05: Upgrade WM from 250mm to 400mm along Angeline St S ► WAT-LIN-07: Upgrade WM from 300mm to 400mm along Dobson St and Proposed 400mm Extension to Verulam St S ► WAT-LIN-08: Upgrade WM from 200/300mm to 400mm along Verulam Rd and Proposed 400mm Extension ► WAT-LIN-09: New 200mm WM along Verulam Rd St, South of Dobson St Extension ► WAT-LIN-14: New 400mm WM Flato Land Trunk Loop Bobcaygeon Water System Upgrades ► WAT-BOB-01: Upgrade WM from 150mm to 200mm from North St to the intersection of Hillview Dr and Balaclava St ► WAT-BOB-03: Upgrade WM from 150mm to 200mm along Canal St E, Boyd St to Island Bay Dr ► WAT-BOB-04: Upgrade WM from 150mm to 200mm from Need St to East St S ► WAT-BOB-05: Upgrade WM from 150mm to 200mm running parallel to Mill St ► WAT-BOB-06: New twinned 250mm WM from WTP to Front St ► WAT-BOB-08: New 250mm WM along Balaclava St Project Number 10599 January 2025
Page | 65
Project File Report Kawartha Lakes Water Wastewater Servicing and Capacity Master Plan
► WAT-BOB-10: WTP Capacity Increase ► WAT-BOB-02: Upgrade WM from 150mm to 200mm along Sherwood St and Park St ► WAT-BOB-07: New 150mm from Cedartree Lane to Riverside Dr ► WAT-BOB-09: Reservoir Storage expansion Fenelon Falls Water System Upgrades ► WAT-FF-01: New 200mm WM east of Concession Rd ► WAT-FF-02: New 200mm WM east of Concession Rd ► WAT-FF-03: New 200mm WM east of Concession Rd ► WAT-FF-04: New 200mm WM east of Concession Rd ► WAT-FF-07: New 150mm WM west of Lindsay St ► WAT-FF-08: Booster Pumping Station ► WAT-FF-05: Reservoir Storage expansion ► WAT-FF-06: WTP Capacity Increase Woodville Water System Upgrades ► WAT-WV-01: WTP Capacity Increase Oakwood Water System Upgrades ► WAT-OAK-01: Upgrade WM from 100/150mm to 250mm along Colborne St W towards Oakwood ► WAT-OAK-02: Oakwood Reservoir Upgrades
10.1 Cost of Recommended Water Infrastructure The capital investments required for the proposed water system upgrades are provided below in Table 10-1. These Class D cost estimates were developed using recent rates (internal to TYLin), as shown in Appendix F (TM-8), and include pipe material costs, excavation, road restoration within the trench width for the watermain, necessary valves and hydrants as well as estimated engineering costs (10%) and contingency (30%). The unit costs assumed that areas in which pipes are being replaced are dense urban, meaning the watermains were replaced within a road. Class D cost estimates, including those provided in Table 10-1, are determined using unit costs based upon a comprehensive list of project requirements, and are only an indication of the total final project cost.
Project Number 10599 January 2025
Page | 66
Project File Report Kawartha Lakes Water Wastewater Servicing and Capacity Master Plan
Table 10-1: Proposed Water System Upgrades – Cost Estimate Upgrade ID
Type
Project Description
Length/Size
Class EA Status
Total Cost (2025 Dollars)
800 m
Exempt
$1,530,000
795 m
Exempt
$770,000
275 m
Exempt
$370,000
1117 m
Exempt
$1,650,000
1387 m
Exempt
$3,920,000
Lindsay 2031 Upgrades
WAT-LIN-01
Watermain
WAT-LIN-02
Watermain
WAT-LIN-03
Watermain
WAT-LIN-04
Watermain
WAT-LIN-06
Watermain
New 400mm WM from the New Tank along Angeline St to Exist. WM on Angeline St New 400mm WM along St Joseph Rd from Colborne St W and Kent St W; New 400mm along Kent St W between St Joseph Rd and Commerce Rd Upgrade WM from 250mm to 300mm along Commerce Rd Upgrade WM from 100/150/250 mm to 300mm along Glenelg St W Upgrade WM from
Project Number 10599 January 2025
Page | 67
Project File Report Kawartha Lakes Water Wastewater Servicing and Capacity Master Plan
Upgrade ID
Type
Project Description
Length/Size
Class EA Status
Total Cost (2025 Dollars)
250/450mm to 600mm along Mary St W New 300mm WM along Lindsay St S, South of Logie St WTP Capacity Increase New Elevated Tank Thornhill Road Reservoir Expansion New 300 mm WM for Tribute Lands
1007 m
Exempt
$1,240,000
62 MLD
Schedule C
$409,000,000
10 ML
Schedule B
$15,000,000
9 ML
Schedule B
$13,550,000
2085 m
Exempt
$2,570,000
Watermain
Upgrade WM from 250mm to 400mm along Angeline St S
1004 m
Exempt
$7,660,000
Watermain
Upgrade WM from 300mm to 400mm along Dobson St and Proposed 400mm
775 m
Exempt
$1,390,000
WAT-LIN-10
Watermain
WAT-LIN-11
WTP
WAT-LIN-12
Storage
WAT-LIN-13
Storage
WAT-LIN-15
Watermain
Lindsay 2041 Upgrades
WAT-LIN-05
Lindsay 2051 Upgrades
WAT-LIN-07
Project Number 10599 January 2025
Page | 68
Project File Report Kawartha Lakes Water Wastewater Servicing and Capacity Master Plan
Upgrade ID
Type
WAT-LIN-08
Watermain
WAT-LIN-09
Watermain
WAT-LIN-14
Watermain
Project Description Extension to Verulam St S Upgrade WM from 200/300mm to 400mm along Verulam Rd and Proposed 400mm Extension New 200mm WM along Verulam Rd St, South of Dobson St Extension New 400mm WM Flato Land Trunk Loop
Length/Size
Class EA Status
Total Cost (2025 Dollars)
3258 m
Exempt
$6,110,000
1315 m
Exempt
$1,330,000
6940 m
Exempt
$11,070,000
1020 m
Exempt
$1,240,000
1466 m
Exempt
$1,790,000
Bobcaygeon 2031 Upgrades
WAT-BOB-01
Watermain
WAT-BOB-03
Watermain
Upgrade WM from 150mm to 200mm from North St to the intersection of Hillview Dr and Balaclava St Upgrade WM from 150mm to 200mm along Canal St E, Boyd St
Project Number 10599 January 2025
Page | 69
Project File Report Kawartha Lakes Water Wastewater Servicing and Capacity Master Plan
Upgrade ID
Type
WAT-BOB-04
Watermain
WAT-BOB-05
Watermain
WAT-BOB-06
Watermain
WAT-BOB-08
Watermain
WAT-BOB-10
WTP
Project Description to Island Bay Dr Upgrade WM from 150mm to 200mm from Need St to East St S Upgrade WM from 150mm to 200mm running parallel to Mill St New twinned 250mm WM from WTP to Front St New 250mm WM along Balaclava St WTP Capacity Increase
Length/Size
Class EA Status
Total Cost (2025 Dollars)
276 m
Exempt
$340,000
294 m
Exempt
$360,000
358 m
Exempt
$400,000
256 m
Exempt
$290,000
8.9MLD
Schedule C
$68,250,000
669 m
Exempt
$810,000
274 m
Exempt
$210,000
Bobcaygeon 2041 Upgrades
WAT-BOB-02
Watermain
WAT-BOB-07
Watermain
Upgrade WM from 150mm to 200mm along Sherwood St and Park St New 150mm from Cedartree Lane to Riverside Dr
Bobcaygeon 2051 Upgrades
Project Number 10599 January 2025
Page | 70
Project File Report Kawartha Lakes Water Wastewater Servicing and Capacity Master Plan
Upgrade ID
Type
Project Description
Length/Size
Class EA Status
Total Cost (2025 Dollars)
WAT-BOB-09
Storage
Reservoir Storage expansion
1.5 ML
Schedule B
$3,760,000
693 m
Exempt
$700,000
262 m
Exempt
$270,000
790 m
Exempt
$800,000
624 m
Exempt
$630,000
739 m
Exempt
$580,000
13 MLD
Schedule B
$700,000
4.9 MLD
Schedule C
$4,850,000
2.9 ML
Schedule B
$24,750,000
0.8 MLD
Schedule C
$7,150,000
Fenelon Falls 2031 Upgrades
WAT-FF-01
Storage
WAT-FF-02
Watermain
WAT-FF-03
Watermain
WAT-FF-04
Watermain
WAT-FF-07
Watermain
WAT-FF-08
Storage
New 200mm WM east of Concession Rd New 200mm WM east of Concession Rd New 200mm WM east of Concession Rd New 200mm WM east of Concession Rd New 150mm WM west of Lindsay St Booster Pumping Station
Fenelon Falls 2041 Upgrades WAT-FF-05
WTP
WAT-FF-06
Storage
Reservoir Storage expansion WTP Capacity Increase
Woodville Upgrades WAT-WV-01
WTP
WTP Capacity Increase
Project Number 10599 January 2025
Page | 71
Project File Report Kawartha Lakes Water Wastewater Servicing and Capacity Master Plan
Upgrade ID
Type
Project Description
Length/Size
Class EA Status
Total Cost (2025 Dollars)
3258 m
Exempt
$4,390,000
0.5 ML
Schedule B
$1,590,000
TOTAL
$601,020,000
Oakwood Upgrades
WAT-OAK-01
Watermain
WAT-OAK-02
Storage
Upgrade WM from 100/150mm to 250mm along Colborne St W towards Oakwood Oakwood Reservoir Upgrades
Table 10-2 : Water Infrastructure Costs – By Community Water System
Forecasted Growth [Res. Units]
Estimated Capital Costs
Cost/Unit
Lindsay
23,501
$477,160,000
20,304
Bobcaygeon
2,261
$77,450,000
34,255
Fenelon Falls
1,498
$33,280,000
22,213
Woodville
148
$7,150,000
48,311
Oakwood
93
$5,980,000
64,301
TOTAL
27,501
$601,020,000
189,384
Project Number 10599 January 2025
Page | 72
¯
WAT-LIN-12 Proposed New Elevated Tank WAT-LIN-01 WAT-LIN-15 HWY 35
LAGOON RD
THUNDER BRIDGE RD
Legend
U U
U
U U
U
ORC H A
DR
ST
U U
U
Lindsay developments Road
U
WELDON RD
PIGEON LAKE RD
U
U
U
ST
LO GI E
U UU U U U U HWY 7 & 35
U
U
U
FIELDSIDE RD
U
U WHEATFIELD RD
U
U
TY Lin Project #: 10599
Lindsay WTP and HLP
U WAT-LIN-09
Kawartha Lakes W-WW Master Plan
GOLDENMILE RD
HALT ER R
Figure 10-1: Proposed WaterUpgrades System Lindsay Water System Upgrades - Lindsay
D
HWY 7
0
0.45
0.9
1.8
2.7
3.6 Kilometers
U Lindsay development Centroids # Pump " Reservoir $ Tank Settlement Boundary
Verulam Tank
U
COUNTY RD 36
U
WAT-LIN-10
GEORGIAN ST
U
U
UU U U # " UUU U U
U U UU
U
U
HURON ST
ST
U
Pipes
KAWARTHA DR
DUKE ST
OK CO
ANGELINE ST S
HWY 7 & 35
WAT-LIN-06
LAURENT BLVD
WAT-LIN-14
U PARKSIDE DR WAT-LIN-07 U
DURHAM ST W
MARY ST W
U
U
DOMINION DR
WOLFE ST
U
U WAT-LIN-11U Treatment U plant Ucapacity U increase UU U U U U U
LINDSAY ST S
WAT-LIN-05
MILL ST
U U
RUSSELL ST W
2031 Upgrades
WALSH RD
U U $
RIVERVIEW RD
RIDOUT ST
ALBERT ST S
ADELAIDE ST S
U
MCLAUGHLIN RD
U
KING ST
KENT ST W
GREENFIELD RD
ELM TREE RD
OPMAR RD
WAT-LIN-13 Reservoir Expansion
& 35
COLBORNE ST E
WAT-LIN-08
U U
WELLINGTON ST
OA D
HWY 7B
# $U
BR
DEW DROP INN RD
MONARCH RD
WAT-LIN-03
U
BOND ST
U U U U WAT-LIN-04 U U
UU U
2041 Upgrades
U
POST RD
COLBORNE ST W
ST PAUL ST
REGENT ST
NEEDHA M ST
U U
Oakwood Upgrades 2051 Upgrades
VERULAM RD N
ELM CRT
POTTINGER ST
ST PATRIC K ST
WAT-LIN-02
U
DANIEL CRT
WILLIAM ST N
ADELAIDE ST N
Thornhill BPS
HWY 7
R K RD
EGLINGTO N ST
OAK ST
FERGUSON DR
RD PA
SIMPSON RD
ST DAVID ST
DAVID
U U U UU U U U U U U U U U ST PETER ST
WAT-OAK-01
U U
LINDSAY ST N
U
U
U
U
PL A
COUNTY RD 36
CHA M
VD IN BL
DRAWN BY: JA Sources: Esri, HERE, Garmin, Intermap, increment P Corp.,
DATE: January 2025
¯
FR 128
WAT-BOB--08 V OLI RD ERS
HS COS
WAT-BOB-10
RD ALM
T
U
"
2041 Upgrades
W
TW GS KIN
ORS IGAT NAV
TE GS KIN
ISL
PO SNAKE
DR
AY DR
M IL
INT R D
101 - 150 mm
E LAN
EST OR EF D L O
AN DB
<= 100 mm
IL TR A
L
151 - 200 mm
WAT-BOB-03 N SYLVA
201 - 300 mm Settlement Boundary Bobcaygeon 2031 developments
CRT
Bobcaygeon 2041 developments Bobcaygeon 2051 developments
ST
WAT-BOB-05 R VE D RI K R R PA
NS IN M
WAT-BOB-09
E AV
DIAMETER
T DS BOY
DR
ST RK PA
ST
2031 Upgrades
S RT PO
L NA CA
U Bobcaygeon development centroids " WTP Upgrade $ Tank Upgrade
T ST HEL EN
ST
Legend
R
R DA D CE EE R R T
ST
T ES
EN QUE
D DE RSI
WAT-BOB-07
D NEE
WAT-BOB-02
U ST
ST
H
E RIV
27
N
U
S TU EC RF E P
SE P
U
U
1 FR
ST
L CO
JO
U
T EAS
U
T
T
T
WAT-BOB-06
ST
U
TW
ES DUK
RS
T
ES JAN
D HEA
S NT FRO
ST VA CLA
U U
ST
U
NS DUN
A BAL
ST WE
NT COU
T
ST
S RTH NO
U D8 YR
$
U
LO TAY
U
ST
DS REI
ST WE
U
ST
MA IN
K BIC
K BIC
D AR
AN NE S
WAT-BOB-01
T EAS
U
WAT-BOB-04
ST
U
ES TU RI
AN
RD
S
K OA RD
BE
3 RD 6
U
R RD
Y UNT CO
Y CK RO
RD
24
RD CH RAN
TY UN O C
RD
U
E AN YL RR
EGO GR MC
RK PA
LAKELAND RD
Kawartha Lakes W-WW Master Plan Figure 10-2: Proposed Water System Bobcaygeon Water System Upgrades Upgrades - Bobcaygeon
0
500
1,000
1,500
2,000 Meters
SCALE:1:20,000
Sources: Esri, HERE, Garmin, Intermap, increment P Corp.,
TY Lin Project #: DATE: January 2025 10599
RT
RA IL
NO
¯
IN E
USH T
HL
S UG
AD
AR B
RO
LOUIS A ST UN
ST
CO
RT BE
PR
AL
IN
DO
FEN-WAT-08/ S S TR Tank Upgrade EE T CE
S
DD ST RE ET
SHO R
EE
T
RO
AD
2031 Upgrades
8
2051 Upgrades
DIAMETER
OR
NE
JO
ST
HN
RE
ST
ET
RE
ET
TR
TY
NS
EET
UN
EE
T S TR
CO
QU
" WTP Upgrade $ Tank_upgrade U 2031 developments centroids U 2041 developments centroids
FEN-WAT-02
U
WE ST
U
Legend
TY
RE
RO
ET
AD
12
1
REET
GAB LE STR EET
FEN-WAT-06/ Water Treatment Plant Upgrade
U
$
FEN-WAT-01
<= 100 mm
U
101 - 150 mm
R IV ED
T
EE
T
WA Y
TR
NS
TR
DS
NN
EE
T
AY S
RA
R
MU
RR
AY S
TE VE
LIN
PE
U
U
FEN-WAT-7
ST
RE
D
NI
Fenelon Falls 2041 Developments
D
U JU
OA
T
Fenelon Falls 2031 Developments
OA
EE
LI S
TR
J AN
Urban Settlement Boundary
O IN
TR
251 - 300 mm
NR
TS
E
SS IO
LI O
R IV
NCE
EL
D DA
ET
NP
ET
D D8
T
T RE
CO
T RE R EE
IN S
201 - 250 mm
FEN-WAT-03
EO
GS N ST
151 - 200 mm
RG
KIN E HEL
N
OA
R OA
EL G
EET
ER
NT Y
STR
IO L
CO U
ST
WE
OR
U
U
STU
KE
EE
YD
ON
TR
I FT
KS
CL
OA
E
ST
RE
ET
CO
LB
"
ET
FEN-WAT-04
U U W
ES
CE
NT
ICE
U
RIV ER
R IA
D RIV
US T
E ET
IN D
ST R
CH
CR
EL L
WY
D OO
E
L PA RK
N
T RE
ET
E AS
T
CO UNTY RO
IVE
AD 121
DR
F RA
S C IS
RA
Kawartha Lakes W-WW Master Plan
BY ST RE
WE
ET
ST STR EET
Figure 10-3: Proposed Water System Fenelon Falls WaterFalls System Upgrades Upgrades - Fenelon
SO U
Kilometers 2 TH
0
0.25
0.5
1
1.5
SCALE:1:15,000
Sources: Esri, HERE, Garmin, Intermap, increment P Corp.,
TY Lin Project #: DATE: January 2025 10599
¯ Tank
+ $ Legend
" ) Reservoir $ Tank +
Diameter
50 - 100 mm
101 - 150 mm 151 - 200 mm
Settlement boundary
Woodville Developments
TY Lin Project #: 10599
Kawartha Lakes W-WW Master Plan
WAT-WV-01 WTP Capacity Increase
Figure 10-4: Proposed Water Upgrades System Woodville Water System Upgrades - Woodville 0
125
250
500
750
1,000 Meters
" ) SCALE:1:15,000
Sources: Esri, HERE, Garmin, Intermap, increment P Corp.,
DRAWN BY: JA
DATE: January 2025
Project File Report Kawartha Lakes Water Wastewater Servicing and Capacity Master Plan
11 Recommended Wastewater System Upgrades The proposed wastewater system upgrades consist of the following: Lindsay Wastewater System Upgrades ► WW-LIN-02: Sewer Upgrade to 300mm from 200mm between Laurent Blvd and Angeline St S ► WW-LIN-03: Sewer Upgrade to 300mm along Angeline St S ► WW-LIN-04: Sewer Upgrade to 375mm from 300mm along Auk Trail ► WW-LIN-05: Sewer Upgrade to 375mm from 300mm along Adelaide St S ► WW-LIN-17: Sewer Upgrade to 300mm from 250mm west of McLaughing Rd ► WW-LIN-20: Sewer Upgrade to 375mm from 300mm along Lindsay St S between Kent St and Glenelg St ► WW-LIN-33: WPCP Capacity Increase ► WW-LIN-34: Rideout St SPS upgrades ► WW-LIN-36: Riverview St SPS Upgrades ► WW-LIN-40: New 375mm Sewers for Tribute Lands ► WW-LIN-41: New 300mm along Lindsay St S ► WW-LIN-43: Mary St SPS and Forcemain Upgrade ► WW-LIN-44: Sewer Upgrade to 250mm from 225mm along Wolfe St ► WW-LIN-45: Sewer Upgrade to 300mm along Durham St ► WW-LIN-46: Sewer Upgrade to 300mm along Huron St ► WW-LIN-01: Sewer Upgrade to 250mm from 200mm along Laurent Blvd ► WW-LIN-06: Sewer Upgrade to 600mm along Albert St S ► WW-LIN-07: Sewer Upgrade to 600mm from 450mm along Durham St W ► WW-LIN-08: Sewer Upgrade to 600mm from 450mm along Sussex St S between Glenelg St and Durham St ► WW-LIN-09: Sewer Upgrade to 600mm from 500mm along Sussex St S from south of Kent St ► WW-LIN-10: Sewer Upgrade to 600mm from 500mm along Kent St W between Sussex St and Victoria Ave ► WW-LIN-11: Sewer Upgrade to 600mm from 500mm along Victoria Ave N ► WW-LIN-12: Sewer Upgrade to 600mm from 500mm along Wellington St between
Project Number 10599 January 2025
Page | 77
Project File Report Kawartha Lakes Water Wastewater Servicing and Capacity Master Plan
Victoria Ave and Cambridge St ► WW-LIN-13: Sewer Upgrade to 600mm from 500mm along Cambridge St N between Wellington St and Bond St ► WW-LIN-14: Sewer Upgrade to 600mm from 500mm along Bond St W between Cambridge St and William St ► WW-LIN-15: Sewer Upgrade to 600mm from 500mm along William St N between Bond St and Francis St ► WW-LIN-16: Sewer Upgrade to 600mm from 525mm along Francis St, east of Francis St ► WW-LIN-21: Sewer Upgrade to 300mm from 200mm along Logan Lane ► WW-LIN-22: Sewer Upgrade to 375mm from 200mm along Maguire St ► WW-LIN-23: Sewer Upgrade to 250mm from 200mm along Maguire St, east of Logan Lane ► WW-LIN-24: Sewer Upgrade to 600mm along Logie St ► WW-LIN-25: Sewer Upgrade to 450mm from 375mm from Parkside St and crossing perpendicularly to Hillside Dr ► WW-LIN-26: Sewer Upgrade to 500mm from 450mm along Logie St from Hillside Dr to Riverview Rd ► WW-LIN-27: Sewer Upgrade to 500mm from 450mm along Logie St from Hillside Dr to Riverview Rd ► WW-LIN-28: New 600mm Sewer along Highway 36 ► WW-LIN-29: New 600mm along W Wilson Rd ► WW-LIN-30: New 600mm along Lagoon St ► WW-LIN-31: New 600mm along Lagoon St to Lindsay WPCP ► WW-LIN-35: Logie St SPS and Forcemain Upgrades ► WW-LIN-37: Lindsay Fairground SPS upgrades ► WW-LIN-38: New sewers 300mm to 600mm for Flato Developments North of Pigeon Lake Rd ► WW-LIN-39: New sewers 300 mm to 450mm for Flato Developments South of Pigeon Lake Rd ► WW-LIN-42: Two New SPSs and Forcemain for Flato Lands ► WW-LIN-18: Sewer Upgrade to 250mm from 200mm from the south end of Heritage Way and then crossing Angeline St to Chadwin Dr ► WW-LIN-19: Sewer Upgrade to 300mm from 225mm along Angeline St N, between
Project Number 10599 January 2025
Page | 78
Project File Report Kawartha Lakes Water Wastewater Servicing and Capacity Master Plan
Chadwin Dr and Regent St ► WW-LIN-32: Sewer Upgrade to 400mm from 375mm along William St. N Bobcaygeon Wastewater System Upgrades ► WW-BOB-01: Sewer Upgrade to 300mm from 200mm along Helen St ► WW-BOB-08: WPCP Capacity Increase ► WW-BOB-10: Front Street SPS Upgrades ► WW-BOB-11: Anne Street SPS and Forcemain Upgrades ► WW-BOB-02: Sewer Upgrade to 300mm from 200mm along West St ► WW-BOB-03: Sewer Upgrade to 200mm from 150mm south of the end of Little Bob Dr ► WW-BOB-12: Little Bob Drive SPS Upgrades ► WW-BOB-04: Sewer Upgrade to 250mm from 200mm along Helen St ► WW-BOB-05: Sewer Upgrade to 250mm from 200mm along Cedartree Ln ► WW-BOB-06: Sewer Upgrade to 300mm from 250mm along Front St W ► WW-BOB-07: Sewer Upgrade to 350mm from 300mm along Need St ► WW-BOB-09: Need St SPS Upgrades Fenelon Falls Wastewater System Upgrades ► WW-FF-01: Sewer Upgrade to 300mm from 200mm along Bond St E ► WW-FF-02: Sewer Upgrade to 250mm from 200mm along Lindsay St ► WW-FF-13: WPCP Capacity Increase ► WW-FF-14: Colborne St SPS Forcemain Upgrade and Forcemain Upgrade ► WW-FF-15: Ellice St SPS Upgrades and Forcemain Upgrades ► WW-FF-16: Francis St SPS Upgrades ► WW-FF-03: Sewer Upgrade to 300mm from 200mm along Bond St E ► WW-FF-04: Sewer Upgrade to 375mm from 200mm along Elgin St ► WW-FF-05: Sewer Upgrade to 375mm from 250mm along Clifton St ► WW-FF-06: Sewer Upgrade to 375mm along Francis St W ► WW-FF-07: Sewer Upgrade to 375mm from 300mm along Colborne St ► WW-FF-08: Sewer Upgrade to 450mm from 400mm along Lindsay St ► WW-FF-09: Sewer Upgrade to 600mm from 450mm along Elliot St to Ellice St SPS ► WW-FF-10: New 250mm sewer West of Sturgeon Point Rd
Project Number 10599 January 2025
Page | 79
Project File Report Kawartha Lakes Water Wastewater Servicing and Capacity Master Plan
► WW-FF-11: New 200mm sewer along Short St ► WW-FF-12: Sewer Upgrade to 250mm from 200mm along Francis St E to Francis St SPS Omemee Wastewater System Upgrades ► WW-OME-01: Sewer Upgrade to 450mm from 300mm
11.1 Cost of Recommended Wastewater Infrastructure The capital investments required for the proposed wastewater system upgrades are provided below in Table 11-1. These Class D cost estimates were developed using recent rates (internal to TYLin), as shown in Appendix F (TM-8), and include pipe material costs, excavation, road restoration within the trench width for the watermain, necessary valves and hydrants as well as estimated planning studies/Class EAs, engineering costs (15%) and contingency (30%). The unit costs assumed that areas in which pipes are being replaced are dense urban, meaning the sewers were replaced within a road. Class D cost estimates, including those provided in Table 10-1, are determined using unit costs based upon a comprehensive list of project requirements, and are only an indication of the total final project cost. Table 11-1: Proposed Wastewater System Upgrades – Cost Estimate Upgrade ID
Length
Class EA Status
Total Cost (2025 Dollars)
Sewer
Sewer Upgrade to 300mm from 200mm between Laurent Blvd and Angeline St S
86 m
Exempt
$610,000
Sewer
Sewer Upgrade to 300mm along Angeline St S
629 m
Exempt
$3,270,000
Type
Project Description
Lindsay 2031 Upgrades
WW-LIN-02
WW-LIN-03
Project Number 10599 January 2025
Page | 80
Project File Report Kawartha Lakes Water Wastewater Servicing and Capacity Master Plan
Upgrade ID
Type
WW-LIN-04
Sewer
WW-LIN-05
Sewer
WW-LIN-17
Sewer
WW-LIN-20
Sewer
WW-LIN-33
WPCP
WW-LIN-34
SPS
WW-LIN-36
SPS
WW-LIN-40
Sewer
Project Description Sewer Upgrade to 375mm from 300mm along Auk Trail Sewer Upgrade to 375mm from 300mm along Adelaide St S Sewer Upgrade to 300mm from 250mm west of McLaughing Rd Sewer Upgrade to 375mm from 300mm along Lindsay St S between Kent St and Glenelg St WPCP Capacity Increase Rideout St SPS upgrades Riverview St SPS Upgrades New 375mm Sewers for Tribute Lands
Length
Class EA Status
Total Cost (2025 Dollars)
343 m
Exempt
$2,230,000
206 m
Exempt
$1,400,000
100 m
Exempt
$680,000
334 m
Exempt
$2,030,000
45 MLD
Schedule C
$206,000,000
508 L/s
Schedule B
$14,730,000
16 L/s
Schedule B
$460,000
1399 m
Exempt
$6,720,000
Project Number 10599 January 2025
Page | 81
Project File Report Kawartha Lakes Water Wastewater Servicing and Capacity Master Plan
Upgrade ID
Type
WW-LIN-41
Sewer
WW-LIN-43
SPS
WW-LIN-44
Sewer
WW-LIN-45
Sewer
WW-LIN-46
Sewer
Project Description New 300mm along Lindsay St S Mary St SPS and Forcemain Upgrade Sewer Upgrade to 250mm from 225mm along Wolfe St Sewer Upgrade to 300mm along Durham St Sewer Upgrade to 300mm along Huron St
Length
Class EA Status
Total Cost (2025 Dollars)
1129 m
Exempt
$5,070,000
60 L/s
Schedule B
$3,610,000
219 m
Exempt
$1,110,000
160 m
Exempt
$860,000
83 m
Exempt
$450,000
1024 m
Exempt
$5,180,000
464 m
Exempt
$2,970,000
191 m
Exempt
$1,370,000
Lindsay 2041 Upgrades
WW-LIN-01
Sewer
WW-LIN-06
Sewer
WW-LIN-07
Sewer
Sewer Upgrade to 250mm from 200mm along Laurent Blvd Sewer Upgrade to 600mm along Albert St S Sewer Upgrade to 600mm from 450mm
Project Number 10599 January 2025
Page | 82
Project File Report Kawartha Lakes Water Wastewater Servicing and Capacity Master Plan
Upgrade ID
Type
WW-LIN-08
Sewer
WW-LIN-09
Sewer
WW-LIN-10
Sewer
WW-LIN-11
Sewer
WW-LIN-12
Sewer
Project Description along Durham St W Sewer Upgrade to 600mm from 450mm along Sussex St S between Glenelg St and Durham St Sewer Upgrade to 600mm from 500mm along Sussex St S from south of Kent St Sewer Upgrade to 600mm from 500mm along Kent St W between Sussex St and Victoria Ave Sewer Upgrade to 600mm from 500mm along Victoria Ave N Sewer Upgrade to 600mm from 500mm along Wellington St
Length
Class EA Status
Total Cost (2025 Dollars)
269 m
Exempt
$1,930,000
221 m
Exempt
$1,590,000
122 m
Exempt
$880,000
292 m
Exempt
$2,100,000
128 m
Exempt
$920,000
Project Number 10599 January 2025
Page | 83
Project File Report Kawartha Lakes Water Wastewater Servicing and Capacity Master Plan
Upgrade ID
Type
WW-LIN-13
Sewer
WW-LIN-14
Sewer
WW-LIN-15
Sewer
WW-LIN-16
Sewer
Project Description between Victoria Ave and Cambridge St Sewer Upgrade to 600mm from 500mm along Cambridge St N between Wellington St and Bond St Sewer Upgrade to 600mm from 500mm along Bond St W between Cambridge St and William St Sewer Upgrade to 600mm from 500mm along William St N between Bond St and Francis St Sewer Upgrade to 600mm from 525mm along Francis St, east of Francis St
Length
Class EA Status
Total Cost (2025 Dollars)
130 m
Exempt
$930,000
186 m
Exempt
$1,340,000
145 m
Exempt
$1,040,000
83 m
Exempt
$600,000
Project Number 10599 January 2025
Page | 84
Project File Report Kawartha Lakes Water Wastewater Servicing and Capacity Master Plan
Upgrade ID
Type
WW-LIN-21
Sewer
WW-LIN-22
Sewer
WW-LIN-23
Sewer
WW-LIN-24
Sewer
WW-LIN-25
Sewer
WW-LIN-26
Sewer
Project Description Sewer Upgrade to 300mm from 200mm along Logan Lane Sewer Upgrade to 375mm from 200mm along Maguire St Sewer Upgrade to 250mm from 200mm along Maguire St, east of Logan Lane Sewer Upgrade to 600mm along Logie St Sewer Upgrade to 450mm from 375mm from Parkside St and crossing perpendicula rly to Hillside Dr Sewer Upgrade to 500mm from 450mm along Logie St from
Length
Class EA Status
Total Cost (2025 Dollars)
92 m
Exempt
$640,000
254 m
Exempt
$1,550,000
49 m
Exempt
$250,000
994 m
Exempt
$7,000,000
166 m
Exempt
$1,200,000
518 m
Exempt
$3,520,000
Project Number 10599 January 2025
Page | 85
Project File Report Kawartha Lakes Water Wastewater Servicing and Capacity Master Plan
Upgrade ID
Type
WW-LIN-27
Sewer
WW-LIN-28
Sewer
WW-LIN-29
Sewer
WW-LIN-30
Sewer
WW-LIN-31
Sewer
WW-LIN-35
SPS
WW-LIN-37
SPS
WW-LIN-38
Sewer
Project Description Hillside Dr to Riverview Rd Sewer Upgrade to 500mm from 450mm along Logie St from Hillside Dr to Riverview Rd New 600mm Sewer along Highway 36 New 600mm along W Wilson Rd New 600mm along Lagoon St New 600mm along Lagoon St to Lindsay WPCP Logie St SPS and Forcemain Upgrades Lindsay Fairground SPS upgrades New sewers 300mm to 600mm for Flato Development s North of Pigeon Lake Rd
Length
Class EA Status
Total Cost (2025 Dollars)
210 m
Exempt
$1,570,000
1782 m
Exempt
$10,660,000
131 m
Exempt
$930,000
515 m
Exempt
$3,080,000
98 m
Exempt
$590,000
176 L/s
Schedule B
$5,860,000
28 L/s
Schedule B
$810,000
2806 m
Exempt
$15,440,000
Project Number 10599 January 2025
Page | 86
Project File Report Kawartha Lakes Water Wastewater Servicing and Capacity Master Plan
Upgrade ID
WW-LIN-39
WW-LIN-42
Type
Sewer
SPS
Project Description New sewers 300 mm to 450mm for Flato Development s South of Pigeon Lake Rd Two New SPSs and Forcemain for Flato Lands
Length
Class EA Status
Total Cost (2025 Dollars)
2023 m
Exempt
$9,580,000
407 L/s (North SPS) 192 L/s (South SPS)
Schedule B
$19,520,000
576 m
Exempt
$3,060,000
236 m
Exempt
$1,270,000
95 m
Exempt
$580,000
Lindsay 2051 Upgrades
WW-LIN-18
Sewer
WW-LIN-19
Sewer
WW-LIN-32
Sewer
Sewer Upgrade to 250mm from 200mm from the south end of Heritage Way and then crossing Angeline St to Chadwin Dr Sewer Upgrade to 300mm from 225mm along Angeline St N, between Chadwin Dr and Regent St Sewer Upgrade to 400mm from 375mm
Project Number 10599 January 2025
Page | 87
Project File Report Kawartha Lakes Water Wastewater Servicing and Capacity Master Plan
Upgrade ID
Type
Project Description
Length
Class EA Status
Total Cost (2025 Dollars)
111 m
Exempt
$600,000
5.6 MLD
Schedule C
$46,500,000
61 L/s
Schedule B
$1,770,000.0 0
162 L/s
Schedule B
$10,450,000
61 m
Exempt
$330,000
198 m
Exempt
$930,000
15 L/s
Schedule B
$440,000
along William St. N Bobcaygeon 2031 Upgrades
WW-BOB-01
Sewer
WW-BOB-08
WPCP
WW-BOB-10
SPS
WW-BOB-11
SPS
Sewer Upgrade to 300mm from 200mm along Helen St WPCP Capacity Increase Front Street SPS Upgrades Anne Street SPS and Forcemain Upgrades
Bobcaygeon 2041 Upgrades
WW-BOB-02
Sewer
WW-BOB-03
Sewer
WW-BOB-12
SPS
Sewer Upgrade to 300mm from 200mm along West St Sewer Upgrade to 200mm from 150mm south of the end of Little Bob Dr Little Bob Drive SPS Upgrades
Project Number 10599 January 2025
Page | 88
Project File Report Kawartha Lakes Water Wastewater Servicing and Capacity Master Plan
Upgrade ID
Type
Project Description
Length
Class EA Status
Total Cost (2025 Dollars)
239 m
Exempt
$1,210,000
719 m
Exempt
$3,640,000
383 m
Exempt
$2,070,000
112 m
Exempt
$640,000
61 L/s
Schedule B
$1,770,000
142 m
Exempt
$770,000
277 m
Exempt
$1,400,000
Bobcaygeon 2051 Upgrades
WW-BOB-04
Sewer
WW-BOB-05
Sewer
WW-BOB-06
Sewer
WW-BOB-07
Sewer
WW-BOB-09
SPS
Sewer Upgrade to 250mm from 200mm along Helen St Sewer Upgrade to 250mm from 200mm along Cedartree Ln Sewer Upgrade to 300mm from 250mm along Front St W Sewer Upgrade to 350mm from 300mm along Need St Need St SPS Upgrades
Fenelon Falls 2031 Upgrades
WW-FF-01
Sewer
WW-FF-02
Sewer
Sewer Upgrade to 300mm from 200mm along Bond St E Sewer Upgrade to
Project Number 10599 January 2025
Page | 89
Project File Report Kawartha Lakes Water Wastewater Servicing and Capacity Master Plan
Upgrade ID
Type
WW-FF-13
WPCP
WW-FF-14
SPS
WW-FF-15
SPS
WW-FF-16
SPS
Project Description 250mm from 200mm along Lindsay St WPCP Capacity Increase Colborne St SPS Forcemain Upgrade and Forcemain Upgrade Ellice St SPS Upgrades and Forcemain Upgrades Francis St SPS Upgrades
Length
Class EA Status
Total Cost (2025 Dollars)
2.8 MLD
Schedule C
$20,400,000
145 L/s
Schedule B
$5,210,000
225 L/s
Schedule B
$9,580,000
50 L/s
Schedule B
$1,450,000
101 m
Exempt
$550,000
115 m
Exempt
$700,000
141 m
Exempt
$860,000
Fenelon Falls 2041 Upgrades
WW-FF-03
Sewer
WW-FF-04
Sewer
WW-FF-05
Sewer
Sewer Upgrade to 300mm from 200mm along Bond St E Sewer Upgrade to 375mm from 200mm along Elgin St Sewer Upgrade to 375mm from 250mm
Project Number 10599 January 2025
Page | 90
Project File Report Kawartha Lakes Water Wastewater Servicing and Capacity Master Plan
Upgrade ID
Type
WW-FF-06
Sewer
WW-FF-07
Sewer
WW-FF-08
Sewer
WW-FF-09
Sewer
WW-FF-10
Sewer
WW-FF-11
Sewer
Project Description along Clifton St Sewer Upgrade to 375mm along Francis St W Sewer Upgrade to 375mm from 300mm along Colborne St Sewer Upgrade to 450mm from 400mm along Lindsay St Sewer Upgrade to 600mm from 450mm along Elliot St to Ellice St SPS New 250mm sewer West of Sturgeon Point Rd New 200mm sewer along Short St
Length
Class EA Status
Total Cost (2025 Dollars)
341 m
Exempt
$2,050,000
116 m
Exempt
$710,000
76 m
Exempt
$480,000
605 m
Exempt
$4,340,000
1209 m
Exempt
$4,930,000
330 m
Exempt
$1,300,000
103 m
Exempt
$520,000
Fenelon Falls 2051 Upgrades WW-FF-12
Sewer
Sewer Upgrade to 250mm from 200mm
Project Number 10599 January 2025
Page | 91
Project File Report Kawartha Lakes Water Wastewater Servicing and Capacity Master Plan
Upgrade ID
Type
Project Description
Length
Class EA Status
Total Cost (2025 Dollars)
781 m
Exempt
$4,960,000
along Francis St E to Francis St SPS Omemee Upgrades WW-OME-01
Sewer
Sewer Upgrade to 450mm from 300mm
TOTAL
$487,750,000
Table 11-2: Water Infrastructure Costs – By Community Wastewater System
Forecasted Growth [Res. Units]
Estimated Capital Costs
Cost/Unit
Lindsay
23,501
$357,190,000
15,199
Bobcaygeon
2,261
$70,350,000
31,110
Fenelon Falls
1,498
$55,250,000
36,877
Omemee
427
$4,960,000
11,616
TOTAL
27,687
$487,750,000
94,802
Project Number 10599 January 2025
Page | 92
¯
WW-LIN-30 WW-LIN-33 WPCP Upgrade
HWY 35
WW-LIN-37 SPS Upgrade
THUNDER BRIDGE RD
U
ST D
OA
BR
KS
T
WW-LIN-45 PARKS IDE DR
UWW-LIN-04 " U
WW-LIN-41
HWY 7 & 35
U
WW-LIN-25
U
U
Settlement Boundary Lindsay 2031 Developments
WW-LIN-42 SPS & FM Upgrade
U
Road
PIGEON LAKE RD
U
"
WW-LIN-35 SPS & FM Upgrade
WW-LIN-23
Conduits
Lindsay 2051 Developments
U
WELDON RD
WW-LIN-24
2031 Sewer Upgrade
Lindsay 2041 Developments
WW-LIN-26
U
ST
LO GI E
U
U U UU
WW-LIN-42 SPS & FM Upgrade
U
U
WW-LIN-43 SPS & FM Upgrade
U
U
WW-LIN-39
U
WHEATFIELD RD
U
TY Lin Project #: 10599
WW-LIN-21
WW-LIN-22 U UU U U U U U
Kawartha Lakes W-WW Master Plan Figure 11-1: Proposed Wastewater System Lindsay Wastewater System Upgrades Upgrades - Lindsay
GOLDENMILE RD
DRAWN BY: JA
ER R D
H
3 Kilometers
U
2041 Sewer Upgrade
HALT
2.25
U
WW-LIN-03
WW-LIN-37 SPS & FM Upgrade
1.5
WW-LIN-05
" U
FIE LDS IDE RD
O CO
U
COUNTY RD 36
WW-LIN-02
LAURENT BLVD
DUKE ST
U
ANG ELINE S T S
HWY 7 & 35
U
WW-LIN-38
KAWARTHA DR
U U U UU " U U WW-LIN-08 U U U U U " U U WW-LIN-07 U U U U MARY ST W
WW-LIN-17
WW-LIN-01
U U
RIVERVIEW RD
WOLFE ST
WW-LIN-06
DURHAM ST W
LINDSAY ST S
U
WW-LIN-44
U U
HURON ST
WW-LIN-09
"
2051 Sewer Upgrade
U
WW-LIN-27
WW-LIN-46 MILL ST
U U
KING ST
RIDOUT ST
RUSSELL ST W
ALBERT ST S
U
MCLAUGHLIN RD
GREENFIELD RD
U
WW-LIN-10 KENT ST W
U
U U
UU U
GEORG IAN ST
WW-LIN-18
ADE LAID E ST S
MONA RCH RD
& 35
U WW-LIN-20 U
WELLINGTON ST
WALSH RD
WW-LIN-15 COLBORNE ST E WW-LIN-34 SPS Upgrade DOMINION DR
U WW-LIN-13
BOND ST
U U U WW-LIN-11 U U U
U Development Centroids " SPS Upgrade " WPCP Upgrade
U
POST RD
U
WW-LIN-28
Legend
VE RULAM RD N
WW-LIN-12
NEE DHAM ST
ST PAUL ST
REGENT ST
U WW-LIN-16 ST PATRICK ST
ELM CRT
POTTINGER ST
COLBORNE ST W
HWY 7B
SIMPSON RD
DANIE L CRT
WW-LIN-14
WILLIAM ST N
WW-LIN-19
U
U U U UU U U U U U U U U U
EGLINGTON ST
OA K ST
U
"
COUNTY RD 36
DR
ADELAID E ST N
WW-LIN-40
OWW-LIN-32 RCHA RD PA RK RD
U
ST DAVID S T
U
U U
ST PETER ST
U
BLVD
LINDSAY ST N
U DAV ID
P LA IN
U
U
U
U
0.375 0.75
LAGOON RD
WW-LIN-36 SPS Upgrade CHAM
0
"
WW-LIN-31
U
DEW DROP INN RD
WW-LIN-29
Sources: Esri, HERE, Garmin, Intermap, increment P Corp.,
DATE: January 2025
¯ Legend
U
U WW-BOB-01
U U WW-BOB-02
U U
U
WW-BOB-06
U
U
Bobcaygeon development centroids SPS Upgrades WPCP Upgrades 2031 Sewer Upgrade 2041 Sewer Upgrade
U
U
U " "
U
U
WW-BOB-05 WW-BOB-04
"
Conduits
Settlement Boundary
WW-BOB-08 WPCP Upgrade
"
Bobcaygeon 2031 developments Bobcaygeon 2041 developments
WW-BOB-11 SPS & FM Upgrade
U WW-BOB-07 U
2051 Sewer Upgrade
Bobcaygeon 2051 developments
" WW-BOB-09 SPS Upgrade
" WW-BOB-10 SPS Upgrade
WW-BOB-03
"
U
U
WW-BOB-12 SPS Upgrade
U Kawartha Lakes W-WW Master Plan
U
Bobcaygeon Figure 11-2: ProposedWastewater Wastewater System Upgrades Upgrades - System Bobcaygeon 0
500
1,000
1,500
2,000 Meters
SCALE:1:20,000
Sources: Esri, HERE, Garmin, Intermap, increment P Corp.,
TY Lin Project #: DATE: January 2025 10599
OA
A RB
ER
U SH
L IN
¯
SU G
D
LOUIS A ST
WW-FF-11
IN
CE
DD
S
ST RE ET
TR EE
CO
RT BE AL
PR
DO
S
UN
ST
TY
RE
RO
ET
AD
12
1
REET
GAB LE STR EET
U S
TW
Legend
U
ES T
SHO R
EE
TR
EE
T
ST NE OR
RE
ET
LB CO
U R IV YD
NN KE
EE
T
WA Y
TR
NS
JU
NI
PE
R
MU
RR
AY S
LIN
TR
DS
EE
T
AY S
RA TE VE
WW-FF-08
U
U U U
CE
NT
"
ET
WW-FF-12
WW-FF-09
ICE
C
U
RIV ER
R IA
D RIV
US T
E ET
IN D
ST R
WY
ES
RE
EL L
R DC WW-FF-02 OO HW
"
ST
WW-FF-04
AD
U
E
L PA RK DR
"
CO UNTY RO
IVE
AD 121
D
T
OA
EE
LI S
Fenelon Falls 2041 Developments
TR
J AN
E
RO
TR
R IV
O IN
TS
NP
LI O
Fenelon Falls 2031 Developments
EO
EL
D DA
ON SS I
N
D D8
T
NCE
R EE
Urban Settlement Boundary
WW-FF-10
CO
ET
EET
OA
N ST
IN
U
T
RG
T RE
EL G
EE S TR
STU
GS
STR
ER R OA
ST
IO L
NT Y
E HEL
WPCP Upgrades
Conduit
WW-FF-03
"
KIN
WE
OR
CO U
ED
T
SPS Upgrades
2051_Sewer_Upgrades
E
ST ON EE
2041 developments centroids
2041_Sewer_Upgrades
WW-FF-01
I FT
TR
WW-FF-14 SPS & FM Upgrade
U
D8
2031 developments centroids
2031_Sewer_Upgrades
WW-FF-05
CL
KS
OA
RE
ST HN JO
WW-FF-07 OA
R
ET
RE
ET
WW-FF-06
U U " "
TY
NS
UN
U
EET
CO
QU
T S TR
N F RA
S C IS
T RE
ET
E AS
T
WW-FF-16 SPS Upgrade
RA
WW-FF-15 SPS & FM Upgrade BY
ST
RE
WE
Kawartha Lakes W-WW Master Plan
ET
ST STR EET SO U TH
0
0.25
0.5
1
1.5
Kilometers 2
Fenelon Falls Wastewater Figure 11-3: Proposed Wastewater System Upgrades - System Fenelon Upgrades Falls SCALE:1:15,000
Sources: Esri, HERE, Garmin, Intermap, increment P Corp.,
TY Lin Project #: DATE: January 2025 10599
¯ WW-OME-01
Legend Sewer Upgrades
U Omemee development centroids Urban Settlement Boundary Omemee developments
U
U U U
U
U
U
TY Lin Project #: 10599
U Kawartha Lakes W-WW Master Plan Omemee Wastewater Figure 11-4: Proposed Wastewater System System Upgrade Upgrades - Omemee 0
125
250
500
750
1,000 Meters
SCALE:1:15,000
Sources: Esri, HERE, Garmin, Intermap, increment P Corp.,
DRAWN BY: JA
DATE: January 2025
Project File Report Kawartha Lakes Water Wastewater Servicing and Capacity Master Plan
12 Consultation Process and Activities 12.1 Stakeholder Contact List A stakeholder contact list was prepared during the initial stages of the Study and was updated during the study. Stakeholder groups included on the list: ► Utility Companies, ► Businesses, ► Indigenous Communities, ► Government Review Agencies, ► Emergency Services, ► School Board, ► Developers, and Consultants ► Residents. A copy of the up-to-date list is included in Appendix A1.
12.2 Notice of Study Commencement The Notice of Study Commencement was prepared to describe the Environmental Assessment process, the objective of the project and relevant project contact information. It was issued on June 8th, 2023. A copy of the Notice of Study Commencement can be seen in Appendix A2. The Notice of Commencement was distributed by the following means: ► Posted on City of Kawartha Lakes Jump In – City Wide Section: Major Projects - City of Kawartha Lakes (AODA Compliant) ► Emailed to stakeholder contact list. Each Stakeholder received a personalized cover letter and Notice of Commencement in PDF format. ► Direct mailing to stakeholders who did not provide an email address. The stakeholders on the mailing lists (direct mail and e-mail) were given the opportunity to leave comments regarding the Notice of Study Commencement. These comments and their responses are included in Appendix A2.
Project Number 10599 January 2025
Page | 97
Project File Report Kawartha Lakes Water Wastewater Servicing and Capacity Master Plan
12.3 Public Consultation Centre (PCC #1) The first Public Consultation Centre (PCC #1) undertaken for this Class EA was considered optional through the Class EA process.
12.3.1 Notice of Public Consultation Centre (PCC #1) The Notice of Public Consultation Centre #1 was prepared to describe the project, study area, details of the PCC #1 event, and relevant project contact information. It was issued on September 29th, 2023. A copy of the Notice of PCC #1 can be seen in Appendix A3. The Notice of PCC #1 was distributed by the following means: ► Posted on City of Kawartha Lakes Jump In – City Wide Section: Major Projects - City of Kawartha Lakes (AODA Compliant) ► Emailed to stakeholder contact list. Each Stakeholder received a personalized cover letter and Notice of Commencement in PDF format. ► Direct mailing to stakeholders who did not provide an email address. The Notice of PCC #1 was posted 4 weeks in advance of the event.
12.3.2 Public Consultation Centre (PCC #1) Event It took place on October 18th, 2023, in the Victoria Room of City of Kawartha Lakes Town Hall. The purpose of this PCC was to introduce the study and the project team, as well as gather other important information about the study area from participants. The PCC #1 event was open-house style from 6:00 pm – 8:00 pm with a formal presentation at 7:00pm. There were a total of 12 display boards providing information about the Class Environmental Assessment Study for City of Kawartha Lakes Water and Wastewater Master Plan. Members of the project team were available to address questions and comments from participants. The display boards were also posted to the project website. Approximately 12 individuals attended PCC #1. The region received 4 comments, and responses were sent to the commenters where applicable. Copies of the Notice, Display Boards, Attendance Sheets, comments received are included in Appendix A3.
12.4 Public Consultation Centre (PCC #2) 12.4.1 Notice of Public Consultation Centre (PCC #2) The Notice of Public Consultation Centre #2 was prepared to describe the project, study area, details of the PCC #2 event, and relevant project contact information. It was issued on May 23rd,
Project Number 10599 January 2025
Page | 98
Project File Report Kawartha Lakes Water Wastewater Servicing and Capacity Master Plan
2023. A copy of the Notice of PCC #2 can be seen in Appendix A4. The Notice of PCC #2 was distributed by the following means: ► Posted on City of Kawartha Lakes Jump In – City Wide Section: Major Projects - City of Kawartha Lakes (AODA Compliant) ► Emailed to stakeholder contact list. Each Stakeholder received a personalized cover letter and Notice of Commencement in PDF format. ► Direct mailing to stakeholders who did not provide an email address. The Notice of PCC #2 was posted 4 weeks in advance of the event.
12.4.2 Public Consultation Centre (PCC #2) Event The Public Consultation #2 event took place June 19th, 2023, and June 20th, 2023. The purpose of this PCC was to review the existing conditions and proposed alternative solutions for water and wastewater capacity in the City of Kawartha Lakes. During this PCC, methodology of identifying and analyzing the alternatives was presented, before presenting the final preferred solution and the reasoning behind it. The June 19th event was located at the Fenlon Falls Community Centre from 6:00pm to 8:00pm. It was open house style with a formal presentation at 7:00pm. The June 20th event was located at the Kawartha Lakes City Hall in Lindsay from 6:00pm to 8:00pm. It was also open house style with a formal presentation at 7:00pm. The Linday PCC #2 presentation was virtually accessible and was recorded/posted to the project website. There were approximately 30 display boards providing information about the Class Environmental Assessment Study for City of Kawartha Lakes Water and Wastewater Master Plan. Members of the project team were available to address questions and comments from participants. The display boards were also posted to the project website. Approximately 30 individuals attended PCC #2 in Fenlon Falls, and approximately 15 people attended the PCC #2 event in Lindsay. The region received 33 comments, and responses were sent to the commenters where applicable. Copies of the Notice, Display Boards, Attendance Sheets, comments received are included in Appendix A4. The Notice of Commencement was issued on June 8, 2023. A copy of the notice is included in Appendix A2. The PIC #1 materials are included in Appendix A3. The PIC #2 materials are included in Appendix A4.
Project Number 10599 January 2025
Page | 99
Project File Report Kawartha Lakes Water Wastewater Servicing and Capacity Master Plan
12.5 First Nations Consultation First Nation groups that potentially have an interest or stake specifically for this project were identified to provide them with an opportunity to provide their input and to address their comments/concerns. During the Municipal Class EA, the project team-initiated contact with First Nations and Métis groups and organizations, including the following: ► Alderville First Nation ► Beausoleil First Nation ► Curve Lake First Nation ► Chippewas of Georgina Island ► Hiawatha First Nation ► Huron-Wendat Nation ► Mississaugas of the Credit First Nation ► Metis Nation of Ontario ► Chippewas of Rama ► Mississaugas of Scugog Island First Nation ► Williams Treaties First Nation Of the above, only Alderville First Nation requested a specific meeting with the Project Team. A meeting with the representative from Alderville First Nation was held on February 29, 2024. The meeting consisted of a review of the presentation materials from the first PIC, and a discussion about the First Nations considerations with respect to the Master Plan. Generally, the Alderville representative was in agreement with the approach. The primary take-away was that Alderville would appreciate a more proactive approach to dealing with potential artifacts during construction processes. Rather than reacting to a potential discovery, Alderville recommended a more complete approach where the responsibilities and reporting procedures are clearly understood my all parties before construction activities are initiated.
12.6 Notice of Study Completion and Report Review The study of completion will be confirmed following the 30-day review period of the Master Plan Project File Report and will address any public comments.
Project Number 10599 January 2025
Page | 100
Project File Report Kawartha Lakes Water Wastewater Servicing and Capacity Master Plan
12.7 Summary of Class EA Milestone Dates The schedule of the Class EA Milestones is provided below. Table 12-1: Schedule of Class EA Milestones Milestone
Date
Notice of Commencement
June 8, 2023
Phase I Public Consultation Centre
October 18, 2023
Phase II Public Consultation Centres
June 19 and 20, 2024
Notice of Study Completion
To be updated upon completion
Project Number 10599 January 2025
Page | 101
Project File Report Kawartha Lakes Water Wastewater Servicing and Capacity Master Plan
13 Conclusions and Recommendations The City of Kawartha Lakes is experiencing significant growth, necessitating improvements and upgrades to its water and wastewater infrastructure to meet current and future demands up to 2051. A desktop capacity assessment was conducted for all water and wastewater facilities, identifying constraints across treatment plants, booster pumping stations, storage facilities, and sewage pumping stations. The sanitary collection systems and water distribution systems were also analyzed for the projected planned growth. As part of this exercise, the water and wastewater projects were identified to support planned growth and determining an appropriate planning horizon for these projects, to be implemented in the near term, as well as by 2031, 2041, and 2051. The project list serves as an implementation plan based on the planning review conducted. Any changes to the planning review or timing of developments coming online will impact the timing of the recommended projects. The capital investments required for the proposed water and wastewater system upgrades are provided below. Please refer to Section 10 and Section 11 for a detailed project list. Table 13-1: Water Infrastructure Costs - By Community Water System
Forecasted Growth [Res. Units]
Estimated Capital Costs
Cost/Unit
Lindsay
23,501
$477,160,000
$20,304
Oakwood
93
$5,980,000
$64,301
Bobcaygeon
2,261
$77,450,000
$34,255
Fenelon Falls
1,498
$33,280,000
$22,213
Woodville
148
$7,150,000
$48,311
TOTAL
27,501
$601,020,000
-
Table 13-2: Wastewater Infrastructure Costs – By Community Wastewater System
Forecasted Growth [Res. Units]
Estimated Capital Costs
Cost/Unit
Lindsay
23,501
$357,190,000
$15,199
Project Number 10599 January 2025
Page | 102
Project File Report Kawartha Lakes Water Wastewater Servicing and Capacity Master Plan
Wastewater System
Forecasted Growth [Res. Units]
Estimated Capital Costs
Cost/Unit
Bobcaygeon
2,261
$70,350,000
$31,110
Fenelon Falls
1,498
$55,250,000
$36,877
Omemee
427
$4,960,000
$11,616
TOTAL
27,687
$487,750,000
-
Project Number 10599 January 2025
Page | 103
Project File Report Kawartha Lakes Water-Wastewater Master Plan Capacity Assessment
APPENDIX A PUBLIC CONSULTATION
Project File Report Kawartha Lakes Water-Wastewater Master Plan Capacity Assessment
Appendix A1
Stakeholder Contact List
Organization Bell Canada
Type of Group Utility Company
Bell Canada
Utility Company
Suffix
First Name c/o Netricom Inc.
Last Name
c/o Netricom Inc.
Position Mark-Ups Coordinator Mark-Ups Coordinator Mark-Ups Coordinator Mark Ups Co ordinator Senior Network Mangement Engineer Manager Environmental Services & Approvals
Org2
Address 200 Town Centre Boulevard., Suite 300
CityProvPC Markham, ON L3R 8G5
Telephone Fax
200 Town Centre Boulevard., Suite 300 500 Consumers Road 4th Floor, Post B7
Markham, ON L3R 8G5
913 Crawford Drive
Peterborough, ON K9J 3X1
483 Bay Street, North Tower
Toronto, ON, M5G 2P5
4.163E+09
ierullo@hydroOne.com
484 Bay Street, North Tower
Toronto, ON, M5G 2P6
4.163E+09
Brian.Mccormick@HydroONE.COM
gray.panter@hydroone.com
(416) (416) 7587587934 1 888 871 4374 (705) 3514 x 743-
Enbridge
Utility Company
Hydro One
Utility Company
Hydro One
Utility Company
Tony
Lerullo
Hydro One
Utility Company
Brian
McCormick
Hydro One
Utility Company
Gary
Panter
Area Distribution Technician
7.057E+09
Cogeco
Utility Company
Dave
Kroes
Coordinator
7.057E+09
Bell Canada
Utility Company
Donna
Merryweather
Utility Company
Edwin
Makkings
Enbridge Gas Distribution Lindsay and District Chamber of Commerce
North York, ON M1K 1P8
Manager-AN Provisioning Manager of Environment
edwin.makkinga@enbridge.com ed@lindsaychamber.com
Carew Park Apt
2 Colborne St W
Lindsay, ON
(705) 3247186
Williams place retirement living
140 William St N,
Lindsay, ON
7.053E+09
Mariposa Dairy
163 St David St
Lindsay, ON
Caressant Care
264 Norwich Ave
Woodstock, ON
Caressant Care
264 Norwich Ave
Woodstock, ON
Caressant Care
264 Norwich Ave
Woodstock, ON
Extendicare
125 Colborne St E
Lindsay, ON
Victoria Manor
220 Angeline St S
Lindsay, ON
133 Adelaide St S
Lindsay, ON
10 Angeline St N
Lindsay, ON
2200 Yonge St
Toronto, ON
Lindsay Agricultural
354 Angeline St S
Lindsay, ON
Ministry of
2 Gibbs Rd
Etobicoke, ON
Lindsay Cleaner
211 Kent St W
Lindsay, ON
Aon Inc.
307 Aylmer St N
Peterborough, ON
1 Heritage Way
Lindsay, ON
9 Albert St S
Lindsay, ON
Kawartha Dairy
89 Prince Street
Bobcaygeon, ON
Kawartha Lakes Haliburton
40 Mary St W
Lindsay, ON
0760444 BC LTD
2020 Fisher Dr
Peterborough, ON
Victoria Condo #9 (Heritage Way) Walnut Grove Apartments
tpumarkup@hydroone.com
9.059E+09 705-3242393
705-3249306 705-3240300 705-3241913 705-3241913 708-8785392 705-3243558 705-3249112 705-3246111 705-3404000 705-3245551 705-328705-3242166 705-7429276 (Peterboro ugh) 705-3249647 705-3247728 705-7685115 705-3249411 ext 3108 705-3248333
3" 3" 3" 3" 3" 3" 4" 6" 8" 2"
2"
3" 3" jsullivan@kawarthadairy.com 3" 3"
P.O. Box 46, 11696 2nd Line Road
Alderville, ON K0K 2X0
afnreception@alderville.ca
Beausoleil First Nation
Joanne P.
Sandy
Chief
11 O'Gemaa Miikaan
Christian Island, ON L9M 0A9
danamonague@chimnissing.ca
Curve Lake First Nation
First Nation
Chief
4065 Hwy 6
Hagersville, ON, N0A 1H0
stacey.laforme@mncfn.ca
Knott
Chief
123 Paudash Street
Hiawatha, ON K9J 0E6
keithk@curvelake.ca
KaitlinH@curvelake.ca JulieK@curvelake.ca
Big Canoe
Chief
R.R. #2 Box N-13
Sutton West, ON L0E 1R0
jl.porte@georginaisland.com
Hiawatha First Nation First Nation
Laurie
Carr
Chief
123 Paudash Street
Hiawatha, ON K9J 0E6
chiefcarr@hiawathafn.ca
First Nation
Karry
SandyMcKenzie
8 Creswick Court
Barrie, ON L4M 1J7
k.a.sandy-mckenzie@rogers.com
First Nation
Kelly
LaRocca
Chief
22521 Island Road
Port Perry, ON L9L 1B6
klarocca@scugogfirstnation.com
First Nation
Ted
Williams
Chief
5884 Rama Road, Suite 200
Rama, ON L0K 1T0
consultation@ramafirstnation.ca
First Nation
1054 Monaghan Road, Unit 102
Peterborough, ON K9J 5L3
PWMC@metisnation.org
Oshawa & Durham First Nation Region Metis Council
74 Simcoe Street South, Unit 101
Oshawa, ON L1H 4G6
oshawadurhammetiscouncil@gmail.com
First Nation
255, Place Chef Michel Laveau
Wendake, QC G0A 4V0
administration@wendake.ca
First Nation
66 Slater Street, Suite 1100
Ottawa, ON K1P 5H1
consultations@metisnation.org
Department of Fisheries and Oceans Ministry of Indigenous Affairs
c/o Dana Monague
Sault
Donna
Huron-Wendat Nation Metis Nation of Ontario Kawartha Conservation Authority
consultation@alderville.ca
claires@mncfn.ca julia.johnson@mncfn.ca Council.Coordinator@mncfn.ca
Chippewas of Georgina Island First First Nation Nation
Williams Treaties First Nations Mississaugas of Scugog Island First Nation Chippewas of Rama First Nation Peterborough and District Wapiti Metis Council
Agencies
c/o Kaitlin Hill and Julie Kapryka
c/o JL Porte sdavison@hiawathafn.ca
c/o Sean Davison
consultation@scugogfirstnation.com
consultations@metisnation.org
consultations@wendake.ca
geninfo@kawarthaconservation.com
Federal/Provincial Government
520 Exmouth Street
Sarnia, ON N7T 8B1
(519) 3831813 or 1866-2903731
FisheriesProtection@dfo-mpo.gc.ca
519-5467612
jocelyn.beatty@ontario.ca
Contact the Ministry of the Environment, Conservation and Parks to determine if
Federal/Provincial Government
Ministry of Federal/Provincial Agriculture, Food and Government Rural Affairs
2"
Chief
Claire
SecondaryLandUse@HydroOne.com
1"
Mowat
First Nation
Jocelyn
Beatty
Rural Planner Land Use Policy & Stewardship
Elora Resource Centre, Unit 10 6484 Wellington Rd 7
Elora ON N0B 1S0
Source
Edit
Date Edited
Notice of Commence/PIC YES YES
williamplace@oxfordliving.ca
Dave
Mississaugas of the Credit First Nation
Special Notes
7054642726
Alderville First Nation First Nation First Nation
Website
mark-ups@enbridge.com
Donna.merryweather@bell.ca
Lindsay, ON
Secondary Email
Bell.moc@telecon.ca
7.059E+09
180 Kent Street West
City of Kawartha Lakes Ross Memorial Hospital Lindsay Retirement Home
Email bell.moc@netricom.com
omafra.eanotices@ontario.ca
TMIG
YES
TMIG
YES
Attended PIC 1
Ministry of Economic Development, Federal/Provincial Employment and Government Infrastructure
Mr.
Ministry of Municipal Federal/Provincial Affairs and Housing Government
Ministry of the Environment, Conservation and Parks, Eastern Region
Erin
Michael
Thompson
Elms
Manager Corporate Policy Coordination Unit Policy,
Manager Community Planning and Development Eastern Municipal Services Office
Toronto, ON M7A 2E1
(416) 3261766
erin.thompson@ontario.ca
8 Estate Lane, Rockwood House
Kingston ON K7M 9A8
613-5452132
michael.elms@ontario.ca
Federal/Provincial Government
eanotification.eregion@ontario.ca
Ministry of the Environment, Conservation and Parks, Environmental Assessment Branch Ministry of the Environment, Conservation and Parks - Notice of Completion
900 Bay Street
135 St. Clair Ave West, 1st Floor
Toronto, ON M4V 1P5
enviropermissions@ontario.ca
Federal/Provincial Government
MEA.Notices.EAAB@ontario.ca
Barboza
Culture Division | Programs & Heritage Planner 400 University Avenue, 4th Floor Services Branch | Heritage Programs
Toronto, ON M7A 2R9
416-6601027
karla.barboza@ontario.ca
Dan
Minkin
Culture Division | Programs & Heritage Planner 400 University Avenue, 4th Floor Services Branch | Heritage Programs
Toronto, ON M7A 2R9
416-7867553
dan.minkin@ontario.ca
Cheryl
Davis
Environmental Policy Office
Garden City Tower 2nd Flr., 301 St. Paul St.
St. Catharines ON L2R 7R4
416-5738548
cheryl.davis@ontario.ca
Clavering
Manager Environmental Assessment Section
4905 Dufferin St.
Downsview ON M3H 5T4
416-4589670
robert.clavering@ec.gc.ca
Haliburton, Kawartha, Federal/Provincial Pine Ridge District Government Health Unit
200 Rose Glen Road
Port Hope, ON L1A 3V6
8.669E+09
Haliburton, Kawartha, Federal/Provincial Pine Ridge District Government Health Unit
108 Angeline Street South
Lindsay On K9V2L6
7.053E+09
Ministry of Citizenship and Multiculturalism
Federal/Provincial Government
Ministry of Citizenship and Multiculturalism
Federal/Provincial Government
Ministry of Transportation
Federal/Provincial Government
Environment and Climate Change Canada
Federal/Provincial Government
Ms.
Ms.
Karla
Rob
Ministry of Infrastructure
Federal/Provincial Government
Joanna
Craig
Planner
1 Dundas St. W., Suite 2000
Toronto ON M5G 1Z3
6.48E+09
noticereview@infrastructureontario.ca
Ministry of Infrastructure
Federal/Provincial Government
Katherine
Hotrum
Director
1 Dundas St. W., Suite 2000
Toronto ON M5G 1Z4
6.473E+09
katherine.hotrum@infrastructureontario.ca
Ministry of Mines
Federal/Provincial Government
Burton
Manager of Strategic Support Unit
Willet Green Miller Centre, 2nd Flr 933 Ramsey Lake Rd
Sudbury ON P3E 6B5
7.059E+09
tracey.burton@ontario.ca
Ministry of Natural Resources and Forestry
Federal/Provincial Government
McCloskey
Regional Land Use Planning Supervisor
5520 Hwy #101 East, Postal Bag 3020
South Porcupine ON P0N 1H0
7.053E+09
SR.Planning@ontario.ca
George Drew Bldg 13th Flr, 25 Grosvenor St
Toronto ON M7A 1Y6
4.169E+09
fuad.abdi@ontario.ca
447 McKeown Avenue, Suite 203
North Bay ON P1B 9S9
7.055E+09
james.antler@ontario.ca
55 York Street, Suite 600
Toronto ON M5J 1R7
4.17E+09
anjala.puvananathan@iaac-aeic.gc.ca
Ministry of the Solicitor General
Ministry of Tourism, Culture and Sport
Federal/Provincial Government
Federal/Provincial Government
Tracey
Amanda
Fuad
James (Jim)
Abdi
Antler
Tourism Policy Unit Tourism Policy and Research Branch
Regional Director Puvananatha Ontario Regional n Office
Impact Assessment Agency of Canada
Federal/Provincial Government
CN Rail
Federal/Provincial Government
CP Rail
Federal/Provincial Government
Tom
Twigge
City of Kawartha Lakes
Federal/Provincial Government
Jean
Harrison
Anjala
Director(A) Facilities and Capital Planning Branch
Ontario Provincial Police Kawartha Lakes Police Services
9.058E+09
Trillium Lakelands District School Board
tom_twigge@cpr.ca
liam_roney@cpr.ca
jharrison@kawarthalakes.ca
jharris89@hotmail.com
Building Services Manager hc.ia-on-ie-on.sc@canada.ca
Beth Emergency Services
iaac.ontarioregion-regiondontario.aeic@iaacaeic.gc.ca
Proximity@cn.ca
Health Canada Trent Severn Waterway Authority
melanie.johnson@ontario.ca
McEachern
7.058E+09 21 Lindsay Street South
Lindsay, ON K9V3L5
7.053E+09
6 Victoria Avenue N
Lindsay, ON K9V5B7
7.053E+09 8.885E+09
beth.mceachern@pc.gc.ca
opp.city.of.kawartha.lakes@opp.ca info@klps.ca eden.paulson@tsdsb.on.ca
andreas_gra mmenz@cpr. ca
PeterboroughVictoria, Northumberland & Clarington Catholic District School Board
7.057E+09
Conseil Scolaire Viamonde
4.166E+09
Conseil Scolaire catholique MonAvenir
416-3976564 or 1800-2743764
Batavia Homes Bromont Group Fernbrook Homes Craft Group Feeley Group Tribute Homes IPS Consulting Moldenh Hauer Flato Group Counter Point Engineering Valdor Engineering D.G. Biddle & Associates SKA Engineering GHD Kawartha Conservation Kawartha Conservation Kawartha Dairy Kawartha Dairy DM Wills Mallot Creek Mallot Creek Kawartha Conservation
Greg Saverio Mike Juan Spencer Jeff Darren Peter Shakir Karl Peter Robbie Krista Darren Matthew Harmanpreet Brian Mike Diana Luke Allison Mark
Bromont Group DM Wills
Cindy Abu Nitin Akin A Deborah
DG Biddle
Michael
MV Wilson Engineering
Mark
Tatham Engineering
Jeremy
Tatham Engineering
David
Phoenix Engineering
Steve
Marshall Homes
Craig
Marshall Homes
Dugald
Marshall Homes
Samantha
MDM Developments
Thomas
MDM Developments
Luke
MDM Developments
Doug
Engage Engineering
Brad
Engage Engineering
Jason
Elm Developments
Joe
Elm Developments
Jason
Lakeview Engineering
Roy
Dunster Investments
Cynthia
Defraties Monemarano Riccardi Bernal Feeley Solly Vella Natyshak Rehmatullah Repka Zourntos Larocque Boyce Marks Mantle Kaur Kerr Crowe Keay Salter Teves Majchrowski Li Ziauddin Malhotra Architect
greg@bataviahomes.ca saverio@bromontgroup.ca m.riccardi@fernbrookhomes.com jbernal@craftgrp.com spencer@feeleygroup.com jeff.s@mytribute.ca dvella@ipsconsultinginc.com pnatyshak@moldenhauer.ca shakir@flatogroup.com krepka@counterpointeng.com PZourntos@Valdor-Engineering.com robbie.larocque@dgbiddle.com kboyce@skaengineering.com Darren.Marks@ghd.com mmantle@kawarthaconservation.com hkaur@kawarthaconservation.com bkerr@kawarthadairy.com mcrowe@kawarthadairy.com DiKeay@dmwills.com LSalter@MallotCreek.com ateves@mallotcreek.com mmajchrowski@kawarthaconservation.com
Keay
cl@narchitecture.com az@nengineering.com nm@narchitecture.com akin@bromontgroup.ca dkeay@dmwills.com
Fry
michael.fry@dgbiddle.com
Wilson
mark.w@mvwconstruction.com
Ash
jash@tathameng.com
Fendler
dfendler@tathameng.com
Clark Marshall
craig@marshallhomes.ca
Wells
Dugald@marshallhomes.ca
Bageman
samantha@marshallhomes.ca
Binczyk
tbinczyk@mdmdevelopments.com
Wilson
lwilson@mdmdevelopments.com
Gray
dgray@mdmdevelopments.com
Parsons
brad@engageeng.ca
Armstrong
jason@engageeng.ca
Morano
jmorano@elmdevelopments.com
D’Ella
j.delia@elmdevelopments.com
Hylkema
roy@lakeviewpeng.com
Devor
cynthia.devor@on.aibn.com
Greck
egreck@greck.ca
Dunster Investments Apex Greck & Associates
Eric Pat Murphy
3 Lakes Subdivision Walter Fedy
saad@3lakes.ca Erika Alan Alex Allister Amy Molica Angela Angelo Anthony April Beverly Bill Bob Brandon Brian Bruce Bryce Byron Cameron Carol Catherine Christine
Valecillos Webster Gordon Andrews Lazzaro Mariani Orsi Radovic Cleaves Saunders Robinson
evalecillos@walterfedy.com awebster@remingtongroupinc.com alex.gordon@choicereit.ca aandrews@digram.ca amy@nbcservices.org angela@nlgc.com aorsi@orsigroup.com acleaves@pearsoneng.com bsaunders@ecovueconsulting.com
Longmuir Yazdani Jackett Robb
brandon@northlandpaving.com office@wgjackett.com
Jordan Lee Sellers Wiebe
Bryce.Jordan@ghd.com blee@mgp.ca csellers@ipsconsultinginc.com cwiebe@mhbcplan.com
Gravely Halis
CHalis@klmplanning.com
Dale Darryl David David David David Debbie Devin Diana Donald Doug Aaron Eldon Elyse Emma Eric Floyd Frances Frances Grant Gus Heather Hunain Idette Bhatt James R. James Jeff Jenika Jessica John Kent Larry Lianne Liz Allen Lorna Lou Lucas Mark Mark Marshall Matthew Melanie Melinda Michael Michael Michael Michael Michael Michael Mike Mohammad Morteza Nathan Nolan Norm Paul Peter Reza
dale.woodcock@sympatico.ca dtighe@dmwills.com DavidH@maeng.ca
Woodcock Tighe Hoover Johnston Mancini McKay
dave@mancinihomes.ca dmckay@mhbcplan.com debbiep@fieldgatecommercial.com Devin_Hannan@golder.com DiKeay@dmwills.com
Pacchiarotti Hannan Keay Kerr Carroll Kernohan Theodore Holwell Drake Caravaggio
etheodore@mhbcplan.com eholwell@mgp.ca edrake@dmwills.com eric@caravaggiorealestate.ca
Walden Ferguson Wilbur
fran-jim@nexicom.net fwilbur@ecovueconsulting.com
Garratt Sarantopoulos
gus.igp@outlook.com HSadler@ecovueconsulting.com hunain@emrahomes.ca idette@hiarchitects.ca neal.bhatt@post.mcdonalds.ca
Sadler Siddiqui Zwaantina de Boer Neal Webster William
jameswilliam@idealgroup.ca jleung@loyalto.ca jshepherd@antecappraisals.com jreid@ecovueconsulting.com jfarlinger@kawarthadairy.com KRandall@ecovueconsulting.com
Leung Shepherd Rae Reid Farlinger Randall Bowen Bowen Van der Wal Fru Pompilli Leone
liz@movingyouintherightdirection.com luciano@bromontgroup.ca mark@nblc.com mfm@larkinplus.com MSmith@klmplanning.com mcory@mgp.ca mnguyen@cfcrozier.ca mholland@thebiglierigroup.com mbissett@bousfields.ca mtl@larkinplus.com mm@moldenhauer.ca mplatt@carmacorp.com michael@msplanning.ca mtestaguzza@thebiglierigroup.com
Conway Fishman Smith Cory Nguyen Holland Bissett Larkin Moldenhauer Platt Smith Testaguzza
mdejean@pearsoneng.com
Dejean Feroz Alabaf Normoyle Drumm Cheesman
mohammad@sabrinahomes.ca morteza@ajgldevelopment.com Nathann@arsresponds.com ndrumm@peterborough.ca ncheesman@ossga.com
Cane Motedayen
plowes@sglplanning.ca peter.cane@dgbiddle.com rmotedayen@loyalto.ca richard@richardtaylorlaw.ca rhunter@planscape.ca robert.m@zpplan.com rhumphries@humphriesplanning.com rwindle@digram.ca saad@3lakes.ca sanderson@skeltonbrumwell.ca sszczerbak@planscape.ca stephaniev@fieldgatecommercial.com steve.c@mvwconstruction.com
Richard Rick Rob Rosemarie Ryan Saad Sam Stefan Stephanie Stephen
Taylor Hunter MacFarlane Humphries
Steve Susan Susan Teri
Legg Bowen Rosales Guthrie
slegg@rogers.com susan.bowen@csagroup.org srosales@moldenhauer.ca teri.guthrie@tldsb.on.ca
Tony
Masongsong
TonyM@maeng.ca
Wes Whitney
n Moore
wcrown@mhbcplan.com wmoore@dillon.ca
MGP KLM Planning EcoVue J. Stollar Construction LTD
Yaman Dalton Billy Kent Martyn
Nimer Young Tung Randall Stollar
yaman@emrahomes.ca dyoung@mgp.ca btung@klmplanning.com krandall@ecovueconsulting.com
R.J. Burnside KPEC GHD
Ian Daryl Ian
Drever Keleher Summerscales
ian.drever@rjburnside.com daryl@kpec.ca ian.summerscales@ghd.com
Pearson Engineering
Rebecca
Eady
rebeccaeady@pearsoneng.com
Windle Tabani Anderson Szczerbak Volpentesta
Pearson Engineering
gpearson@pearsoneng.com
Pearson Engineering
mdejean@pearsoneng.com
Pearson Engineering
krichardson@pearsoneng.com npersaud@rvanderson.com lswift@rvanderson.com matcorpdevelopments@yahoo.ca dmilliner@flatogroup.com rdr@ronrobcon.com robbie.larocque@dgbiddle.com
R.V. Anderson R.V. Anderson Matcorp Developments Flato Group Robcon D.G. Biddle & Associates LTD
Nikash Leah Joe Dave Ron Robbie
Persaud Swift Matys Milliner Robinson Larocque
GRIT Development Odan Detech
Manoj Mark Angela George
Chourey Harris Mariani Whittington
mark@odantech.com angela@nlgc.com gw@nlgc.com
Biglieri Group Antec Appraisal Group Antec Appraisal Group
Frederico Chris Shanna
Palacios Rennie James
fpalacios@thebiglierigroup.com crennie@antecappraisals.com sjames@antecppraisals.com
Resident Resident
519-375-0122 705-738-1731
Resident Resident Resident Resident Resident Resident Resident Resident Resident Resident Resident Resident Resident Resident Resident Resident Resident Resident Resident Resident Resident Resident Resident
said no to mailing list said no to mailing list
said no to mailing list, illegible said no to mailing list, illegible
Project File Report Kawartha Lakes Water-Wastewater Master Plan Capacity Assessment
Appendix A2
Notice of Commencement
January 21, 2025
Name Title Company Name City, Province Postal Code
Dear <insert name>: Re: CITY OF KAWARTHA LAKES WATER AND WASTEWATER MASTER PLAN UPDATE MUNICIPAL CLASS ENVIRONMENTAL ASSESSMENT – SCHEDULE B NOTICE OF COMMENCEMENT TY LIN PROJECT NO. 10599
T.Y. Lin International Canada Inc. has been retained by the City of Kawartha Lakes to assist in undertaking a Municipal Class Environmental Assessment (EA) with respect to update the city-wide Water and Wastewater Servicing and Capacity Master Plan. The City of Kawartha Lakes recognizes the importance of planning for growth and supporting the sustainability of its water and wastewater infrastructure in the long term. The City has experienced a significant increase in growth over the recent years, which is driving demands for improvements and upgrades to its water and wastewater infrastructure. Accordingly, the City is proceeding with the planning of this EA Study as a Schedule B undertaking in accordance with the requirements of the Environmental Assessment Act. Public consultation is a key component of any Class EA, and we are inviting you to participate in this process. There are further details in the attached Notice of Commencement, which has also been published in the June 8, 2023, edition of Kawartha Lakes This Week. An update to the Water and Wastewater Master Plan will provide a long-term water and wastewater servicing strategy that supports existing communities and growth to 2051 and beyond (ultimate buildout).
8800 Dufferin Street, Suite 200 | Vaughan, Ontario L4K 0C5 Canada | T 905.738.5700 | www.tylin.com An Affirmative Action / Equal Opportunity Employer M/F/D/V Page 1 of 2
By sending you this letter, we are confirming that you are on our Stakeholder Registry. We will be sending you regular updates as the process evolves, unless you communicate with us that you have no interest in this Study. We look forward to your participation in this process. Sincerely, T.Y. Lin International Canada Inc.
Kevin Brown, P.Eng Project Manager | Senior Municipal Engineer Email: Kevin.Brown@TYLin.com
Encl. cc: Nafiur Rahman, City of Kawartha Lakes
PROJECT NUMBER
10599
Page 2 of 2
January 21, 2025
Water and Wastewater Servicing and Capacity Master Plan
NOTICE OF STUDY COMMENCEMENT Issued May 29, 2023 The City of Kawartha Lakes (City) is beginning an Environmental Assessment (EA) for the City’s Water and Wastewater Servicing and Capacity Master Plan Update under the Environmental Assessment Act. Background The City of Kawartha Lakes has experienced a significant increase in growth over the recent years. As per the Provincial Growth Plan – A Place to Grow for the Greater Golden Horseshoe (Ontario, 2020), the City is expected to grow to 117,000 people and 39,000 jobs by 2051. The Study The Water and Wastewater Servicing and Capacity Master Plan was initiated to identify the existing servicing constraints and provide a long-term water and wastewater servicing strategy that supports existing communities and growth to 2051 and beyond (ultimate buildout). The Process This study is being conducted in accordance with the requirements of Phases 1 and 2 of the Municipal Class Environmental Assessment, which is an approved process under the Environmental Assessment Act. In Phase 1, past master planning works, and existing support documentations will be reviewed. The existing and future servicing constraints will be identified. In Phase 2, various long-term servicing alternatives will be developed to address any existing or potential long-term servicing constraints identified in Phase 1. A preferred alternative to be able to best support planned growth will be determined. We Want to Hear from You Public consultation is a key component of any Class Environmental Assessment. We will be sharing information with the Public and interested Stakeholders through the City’s website: jumpinkawarthalakes.com. We invite you to consult this website to review the information as it is made available. The Website will include the Project Managers’ contact information. The public will be invited to email the Project Managers with any questions or comments they have regarding the
project. The public will also be able to ask the Project Managers to put them on the project’s mailing list, so that they can receive any project updates right to their inbox or mailbox. As the project evolves to Phase 2, we will coordinate a formal Public Consultation Centre (PCC) event to present the recommended servicing solutions to the stakeholders in person, and to answer any questions. Your feedback is important to us: To provide comments, request additional information, or receive future correspondence related to the project, please contact a member of the project team below: Kevin Brown, P.Eng. Project Manager T.Y.Lin International Canada Inc. (416) 843-4689 Kevin.Brown@TYLin.com
Nafiur Rahman, P.Eng., PMP Supervisor Environmental Capital Project Management Infrastructure Design and Construction Engineering and Corporate Assets City of Kawartha Lakes 705-324-9411 ext. 1193 nrahman@kawarthalakes.ca
Under the Freedom of Information and Protection of Privacy Act and the Environmental Assessment Act, unless otherwise stated in the submission, any personal information such as name, address, telephone number and property location included in a submission will become part of the public record files for this matter and may be released, if requested, to any person.
From: Sent: To: Subject:
Beatty, Jocelyn (OMAFRA) <Jocelyn.Beatty@ontario.ca> Friday, September 1, 2023 10:59 AM Sydney Mcivor Automatic reply: NOTICE - CITY OF KAWARTHA LAKES WATER AND WASTEWATER MASTER PLAN UPDATE
Thank you for your e-mail. I am currently on maternity leave and this inbox is not being monitored. Please contact the Agricultural Information Contact Centre for assistance: 1-877-424-1300 or 519-826-4047 ag.info.omafra@ontario.ca Best, Jocelyn Beatty, Rural Planner
From: Sent: To: Cc: Subject: A achments:
Follow Up Flag: Flag Status:
EA No ces to ERegion (MECP) <eano fica on.eregion@ontario.ca> Friday, September 1, 2023 3:16 PM Sydney Mcivor; EA No ces to ERegion (MECP) Kevin Brown; nrahman RE: NOTICE - CITY OF KAWARTHA LAKES WATER AND WASTEWATER MASTER PLAN UPDATE Copy of streamlined_ea_project_informa on_form.xlsx; Instruc ons for Providing Class EA No ces to the Ministry of the Environment Conserva on and Parks.pdf Follow up Flagged
You don't often get email from eanotification.eregion@ontario.ca. Learn why this is important
Thanks for this no ce Sydney, Upon my review of the No ce I note a few deficiencies. The date of issue was back in June. MECP should have been no fied of the project at the me of issue so that we could issue a response leAer including an updated list of indigenous communi es with which to consult with. In addi on example sample no ces from the MCEA parent document also usually have a key map (Key Plan) of the study area so that the general public understand the parameters and geography of the project. Lastly MECP also has required a Project Informa on Form (EXCEL and a ached) to be submiAed at the me of filing the No ce of Commencement. Thanks again for the no fica on and we will be in touch with respect to the out standing response which will involve an updated list of Indigenous Communi es. Regards, Jon
Jon K. Orpana hear name Regional Environmental Planner Environmental Assessment Branch Ministry of the Environment, Conservation and Parks Kingston Regional Office PO Box 22032, 1259 Gardiners Road Kingston, Ontario K7M 8S5 Phone: (613) 548-6918 Fax: (613) 548-6908
Email:
jon.orpana@ontario.ca
From: Sydney Mcivor <sydney.mcivor@tylin.com> Sent: September 1, 2023 11:02 AM To: EA Notices to ERegion (MECP) <eanotification.eregion@ontario.ca> Subject: NOTICE - CITY OF KAWARTHA LAKES WATER AND WASTEWATER MASTER PLAN UPDATE CAUTION -- EXTERNAL E-MAIL - Do not click links or open a achments unless you recognize the sender. Dear Stakeholder, T.Y. Lin Interna onal Canada Inc. has been retained by the City of Kawartha Lakes to assist in undertaking a Municipal Class Environmental Assessment (EA) with respect to upda ng the Water and Wastewater Master Plan. Please review the aAached file containing details of the Water and Wastewater master plan for the City of Kawartha Lakes. If you have any ques ons, please feel free to contact Project Manager Kevin Brown, as noted in the leAer. Thank you, Sydney
Sydney McIvor CIVIL E.I.T. – WATER LINEAR T +1 905.738.5700 sydney.mcivor@tylin.com
TYLin
209 Dundas Street East Suite 301 Whitby, ON L1N 7H8, Canada TYLin.com
From: Sent: To: Cc: Subject:
EA No ces to ERegion (MECP) <eano fica on.eregion@ontario.ca> Friday, September 1, 2023 3:58 PM Kevin Brown; EA No ces to ERegion (MECP); Sydney Mcivor nrahman RE: NOTICE - CITY OF KAWARTHA LAKES WATER AND WASTEWATER MASTER PLAN UPDATE
Follow Up Flag: Flag Status:
Follow up Flagged
Some people who received this message don't often get email from eanotification.eregion@ontario.ca. Learn why this is important
Thanks for this Kevin, I have forwarded this plus the no ce to the staff that compile the list of Indigenous Communi es to consult with at a minimum to verify. I recognise the list below is very comprehensive and will let you know if there are any outstanding communi es, which I doubt. Regards, Jon
Jon K. Orpana hear name Regional Environmental Planner Environmental Assessment Branch Ministry of the Environment, Conservation and Parks Kingston Regional Office PO Box 22032, 1259 Gardiners Road Kingston, Ontario K7M 8S5 Phone: (613) 548-6918 Fax: (613) 548-6908 Email: jon.orpana@ontario.ca
From: Kevin Brown <Kevin.brown@tYLin.com> Sent: September 1, 2023 3:44 PM To: EA Notices to ERegion (MECP) <eanotification.eregion@ontario.ca>; Sydney Mcivor <sydney.mcivor@tylin.com> Cc: nrahman <nrahman@kawarthalakes.ca> Subject: RE: NOTICE - CITY OF KAWARTHA LAKES WATER AND WASTEWATER MASTER PLAN UPDATE
CAUTION -- EXTERNAL E-MAIL - Do not click links or open a%achments unless you recognize the sender. Jon: Please accept our apologies for the delay in this circula on. We will provide the PIF, as requested. We have also iden fied a fairly substan al list of First Na ons, with whom the City will be communica ng directly: Alderville First Nation Curve Lake First Nation Curve Lake First Nation Hiawatha First Nation Hiawatha First Nation Metis Nation of Ontario Scugog First Nation
Mississaugas of the Credit
Mississaugas of the Credit Kawartha Nishnawbe First Nation Peterborough and District Wapiti Metis Council Oshawa & Durham Region Metis Council Beausoleil First Nation Georgina Island First Nation Huron-Wendat Nation Rama First Nation Williams Treaties First Nations
Thank you for your communica on. Regards, -Kevin
Kevin Brown, P.Eng. (he, him) SENIOR MUNICIPAL ENGINEER PROJECT MANAGER M +1 416.843.4689
TYLin
From: EA Notices to ERegion (MECP) <eanotification.eregion@ontario.ca> Sent: Friday, September 1, 2023 3:16 PM To: Sydney Mcivor <sydney.mcivor@tylin.com>; EA Notices to ERegion (MECP) <eanotification.eregion@ontario.ca> Cc: Kevin Brown <Kevin.brown@tYLin.com>; nrahman <nrahman@kawarthalakes.ca> Subject: RE: NOTICE - CITY OF KAWARTHA LAKES WATER AND WASTEWATER MASTER PLAN UPDATE You don't often get email from eanotification.eregion@ontario.ca. Learn why this is important
Thanks for this no ce Sydney, Upon my review of the No ce I note a few deficiencies. The date of issue was back in June. MECP should have been no-fied of the project at the -me of issue so that we could issue a response leCer including an updated list of indigenous communi es with which to consult with. In addi on example sample no ces from the MCEA parent document also usually have a key map (Key Plan) of the study area so that the general public understand the parameters and geography of the project. Lastly MECP also has required a Project Informa-on Form (EXCEL and a%ached) to be submiCed at the me of filing the No ce of Commencement. Thanks again for the no fica on and we will be in touch with respect to the out standing response which will involve an updated list of Indigenous Communi es. Regards, Jon
Jon K. Orpana hear name Regional Environmental Planner Environmental Assessment Branch Ministry of the Environment, Conservation and Parks Kingston Regional Office PO Box 22032, 1259 Gardiners Road Kingston, Ontario K7M 8S5 Phone: (613) 548-6918 Fax: (613) 548-6908 Email: jon.orpana@ontario.ca
From: Sydney Mcivor <sydney.mcivor@tylin.com> Sent: September 1, 2023 11:02 AM To: EA Notices to ERegion (MECP) <eanotification.eregion@ontario.ca> Subject: NOTICE - CITY OF KAWARTHA LAKES WATER AND WASTEWATER MASTER PLAN UPDATE CAUTION -- EXTERNAL E-MAIL - Do not click links or open a%achments unless you recognize the sender. Dear Stakeholder, T.Y. Lin Interna onal Canada Inc. has been retained by the City of Kawartha Lakes to assist in undertaking a Municipal Class Environmental Assessment (EA) with respect to upda ng the Water and Wastewater Master Plan. Please review the aCached file containing details of the Water and Wastewater master plan for the City of Kawartha Lakes. If you have any ques ons, please feel free to contact Project Manager Kevin Brown, as noted in the leCer. Thank you, Sydney
Sydney McIvor CIVIL E.I.T. – WATER LINEAR T +1 905.738.5700 sydney.mcivor@tylin.com
TYLin
209 Dundas Street East Suite 301 Whitby, ON L1N 7H8, Canada TYLin.com
From: Sent: To: Cc: Subject: A achments:
Sydney Mcivor Thursday, September 7, 2023 11:51 AM EA No!ces to ERegion (MECP) Kevin Brown; nrahman RE: NOTICE - CITY OF KAWARTHA LAKES WATER AND WASTEWATER MASTER PLAN UPDATE Kawartha Lakes EA streamlined_ea_project_informa!on_form.xlsx
Hello Jon, A>ached is the Project Informa!on Form, as per your request. Thank you, Sydney
Sydney McIvor CIVIL E.I.T. – WATER LINEAR
From: EA Notices to ERegion (MECP) <eanotification.eregion@ontario.ca> Sent: Friday, September 1, 2023 3:16 PM To: Sydney Mcivor <sydney.mcivor@tylin.com>; EA Notices to ERegion (MECP) <eanotification.eregion@ontario.ca> Cc: Kevin Brown <Kevin.brown@tYLin.com>; nrahman <nrahman@kawarthalakes.ca> Subject: RE: NOTICE - CITY OF KAWARTHA LAKES WATER AND WASTEWATER MASTER PLAN UPDATE You don't often get email from eanotification.eregion@ontario.ca. Learn why this is important
Thanks for this no!ce Sydney, Upon my review of the No!ce I note a few deficiencies. The date of issue was back in June. MECP should have been no fied of the project at the me of issue so that we could issue a response le>er including an updated list of indigenous communi!es with which to consult with. In addi!on example sample no!ces from the MCEA parent document also usually have a key map (Key Plan) of the study area so that the general public understand the parameters and geography of the project. Lastly MECP also has required a Project Informa on Form (EXCEL and a ached) to be submi>ed at the !me of filing the No!ce of Commencement. Thanks again for the no!fica!on and we will be in touch with respect to the out standing response which will involve an updated list of Indigenous Communi!es.
Regards, Jon
Jon K. Orpana hear name Regional Environmental Planner Environmental Assessment Branch Ministry of the Environment, Conservation and Parks Kingston Regional Office PO Box 22032, 1259 Gardiners Road Kingston, Ontario K7M 8S5 Phone: (613) 548-6918 Fax: (613) 548-6908 Email: jon.orpana@ontario.ca
From: Sydney Mcivor <sydney.mcivor@tylin.com> Sent: September 1, 2023 11:02 AM To: EA Notices to ERegion (MECP) <eanotification.eregion@ontario.ca> Subject: NOTICE - CITY OF KAWARTHA LAKES WATER AND WASTEWATER MASTER PLAN UPDATE CAUTION -- EXTERNAL E-MAIL - Do not click links or open a achments unless you recognize the sender. Dear Stakeholder, T.Y. Lin Interna!onal Canada Inc. has been retained by the City of Kawartha Lakes to assist in undertaking a Municipal Class Environmental Assessment (EA) with respect to upda!ng the Water and Wastewater Master Plan. Please review the a>ached file containing details of the Water and Wastewater master plan for the City of Kawartha Lakes. If you have any ques!ons, please feel free to contact Project Manager Kevin Brown, as noted in the le>er. Thank you, Sydney
Sydney McIvor CIVIL E.I.T. – WATER LINEAR T +1 905.738.5700 sydney.mcivor@tylin.com
TYLin
209 Dundas Street East Suite 301 Whitby, ON L1N 7H8, Canada TYLin.com
From: Sent: To: Cc: Subject:
Kevin Brown Friday, September 1, 2023 3:44 PM EA No ces to ERegion (MECP); Sydney Mcivor nrahman RE: NOTICE - CITY OF KAWARTHA LAKES WATER AND WASTEWATER MASTER PLAN UPDATE
Follow Up Flag: Flag Status:
Follow up Flagged
Jon: Please accept our apologies for the delay in this circula on. We will provide the PIF, as requested. We have also iden fied a fairly substan al list of First Na ons, with whom the City will be communica ng directly: Alderville First Nation Curve Lake First Nation Curve Lake First Nation Hiawatha First Nation Hiawatha First Nation Metis Nation of Ontario Scugog First Nation
Mississaugas of the Credit
Mississaugas of the Credit Kawartha Nishnawbe First Nation Peterborough and District Wapiti Metis Council Oshawa & Durham Region Metis Council Beausoleil First Nation Georgina Island First Nation Huron-Wendat Nation Rama First Nation Williams Treaties First Nations
Thank you for your communica on. Regards,
-Kevin
Kevin Brown, P.Eng. (he, him) SENIOR MUNICIPAL ENGINEER PROJECT MANAGER M +1 416.843.4689
From: EA Notices to ERegion (MECP) <eanotification.eregion@ontario.ca> Sent: Friday, September 1, 2023 3:16 PM To: Sydney Mcivor <sydney.mcivor@tylin.com>; EA Notices to ERegion (MECP) <eanotification.eregion@ontario.ca> Cc: Kevin Brown <Kevin.brown@tYLin.com>; nrahman <nrahman@kawarthalakes.ca> Subject: RE: NOTICE - CITY OF KAWARTHA LAKES WATER AND WASTEWATER MASTER PLAN UPDATE You don't often get email from eanotification.eregion@ontario.ca. Learn why this is important
Thanks for this no ce Sydney, Upon my review of the No ce I note a few deficiencies. The date of issue was back in June. MECP should have been no fied of the project at the me of issue so that we could issue a response le@er including an updated list of indigenous communi es with which to consult with. In addi on example sample no ces from the MCEA parent document also usually have a key map (Key Plan) of the study area so that the general public understand the parameters and geography of the project. Lastly MECP also has required a Project Informa on Form (EXCEL and a*ached) to be submi@ed at the me of filing the No ce of Commencement. Thanks again for the no fica on and we will be in touch with respect to the out standing response which will involve an updated list of Indigenous Communi es. Regards, Jon
Jon K. Orpana hear name Regional Environmental Planner Environmental Assessment Branch Ministry of the Environment, Conservation and Parks Kingston Regional Office PO Box 22032, 1259 Gardiners Road Kingston, Ontario
K7M 8S5 Phone: (613) 548-6918 Fax: (613) 548-6908 Email: jon.orpana@ontario.ca
From: Sydney Mcivor <sydney.mcivor@tylin.com> Sent: September 1, 2023 11:02 AM To: EA Notices to ERegion (MECP) <eanotification.eregion@ontario.ca> Subject: NOTICE - CITY OF KAWARTHA LAKES WATER AND WASTEWATER MASTER PLAN UPDATE CAUTION -- EXTERNAL E-MAIL - Do not click links or open a*achments unless you recognize the sender. Dear Stakeholder, T.Y. Lin Interna onal Canada Inc. has been retained by the City of Kawartha Lakes to assist in undertaking a Municipal Class Environmental Assessment (EA) with respect to upda ng the Water and Wastewater Master Plan. Please review the a@ached file containing details of the Water and Wastewater master plan for the City of Kawartha Lakes. If you have any ques ons, please feel free to contact Project Manager Kevin Brown, as noted in the le@er. Thank you, Sydney
Sydney McIvor CIVIL E.I.T. – WATER LINEAR T +1 905.738.5700 sydney.mcivor@tylin.com
TYLin
209 Dundas Street East Suite 301 Whitby, ON L1N 7H8, Canada TYLin.com
From: Sent: To: Subject:
Nafiur Rahman <nrahman@kawarthalakes.ca> Friday, September 8, 2023 8:45 AM Jean Harrison; Kevin Brown; Sydney Mcivor RE: Water and Wastewater Study
Follow Up Flag: Flag Status:
Follow up Flagged
Good Morning Jean, Thank you for your interest for this study. I have forwarded your email to our consultant to include to the communication list. Nafiur From: Jean Harrison <jharrison@kawarthalakes.ca> Sent: Friday, September 8, 2023 7:10 AM To: Nafiur Rahman <nrahman@kawarthalakes.ca> Subject: Water and Wastewater Study Good morning Naflur Could you please add my work and personal email to the communications list for the current water and waste water study that has commenced in the COKL? Personal email: jharris89@hotmail.com Work email as listed above Thank you Jean
Jean Harrison Building Services Manager Victoria Manor, City of Kawartha Lakes 705-324-3558 ext, 1416 www.kawarthalakes.ca 220 Angeline Street South Lindsay, ON K9V 0J8
Managed by Sienna Senior Living Cultivating happiness in daily life
This message, including any attachments, is privileged and intended only for the addressee(s) named above. If you are not the intended recipient, you must not read, use or disseminate the information contained in this e-mail. If you have received this e-mail in error, please notify the sender immediately by telephone, fax, or e-mail and shred this confidential e-mail, including any attachments, without making a copy. Access to this e-mail by anyone else is unauthorized. This message, including any attachments, is privileged and intended only for the addressee(s) named above. If you are not the intended recipient, you must not read, use or disseminate the information contained in this e-mail. If you have received this e-mail in error, please notify the sender immediately by telephone, fax, or e-mail and shred this confidential e-mail, including any attachments, without making a copy. Access to this e-mail by anyone else is unauthorized.
From: Sent: To: Subject:
Sydney Mcivor Friday, September 8, 2023 8:59 AM Nafiur Rahman; Jean Harrison; Kevin Brown RE: Water and Wastewater Study
Good morning, Jean has been added to the communications list and will receive future project communications. Thank you, Sydney
Sydney McIvor CIVIL E.I.T. – WATER LINEAR
From: Nafiur Rahman <nrahman@kawarthalakes.ca> Sent: Friday, September 8, 2023 8:45 AM To: Jean Harrison <jharrison@kawarthalakes.ca>; Kevin Brown <kevin.brown@tylin.com>; Sydney Mcivor <sydney.mcivor@tylin.com> Subject: RE: Water and Wastewater Study
Good Morning Jean, Thank you for your interest for this study. I have forwarded your email to our consultant to include to the communication list. Nafiur From: Jean Harrison <jharrison@kawarthalakes.ca> Sent: Friday, September 8, 2023 7:10 AM To: Nafiur Rahman <nrahman@kawarthalakes.ca> Subject: Water and Wastewater Study Good morning Naflur Could you please add my work and personal email to the communications list for the current water and waste water study that has commenced in the COKL? Personal email: jharris89@hotmail.com Work email as listed above Thank you Jean
Jean Harrison Building Services Manager Victoria Manor, City of Kawartha Lakes 705-324-3558 ext, 1416 www.kawarthalakes.ca 220 Angeline Street South Lindsay, ON K9V 0J8
Managed by Sienna Senior Living Cultivating happiness in daily life This message, including any attachments, is privileged and intended only for the addressee(s) named above. If you are not the intended recipient, you must not read, use or disseminate the information contained in this e-mail. If you have received this e-mail in error, please notify the sender immediately by telephone, fax, or e-mail and shred this confidential e-mail, including any attachments, without making a copy. Access to this e-mail by anyone else is unauthorized. This message, including any attachments, is privileged and intended only for the addressee(s) named above. If you are not the intended recipient, you must not read, use or disseminate the information contained in this e-mail. If you have received this e-mail in error, please notify the sender immediately by telephone, fax, or e-mail and shred this confidential e-mail, including any attachments, without making a copy. Access to this e-mail by anyone else is unauthorized.
A achments:
Ontario Region / Region d'Ontario (IAAC/AEIC) <ontarioregionregiondontario@iaac-aeic.gc.ca> Wednesday, October 11, 2023 5:08 PM Sydney McIvor Ontario Region / Region d'Ontario (IAAC/AEIC) RE: NOTICE - CITY OF KAWARTHA LAKES WATER AND WASTEWATER MASTER PLAN UPDATE Le4er from IAAC to TYLin - City of Kawartha Lakes.pdf
Follow Up Flag: Flag Status:
Follow up Flagged
From: Sent: To: Cc: Subject:
You don't often get email from ontarioregion-regiondontario@iaac-aeic.gc.ca. Learn why this is important
UNCLASSIFIED - NON CLASSIFIÉ
Good a?ernoon, Please see a4ached response to your September 1, 2023 le4er regarding the Water and Wastewater Master Plan Study. Kind regards, Kim Browning Administrative Clerk, Ontario Region Impact Assessment Agency of Canada / Government of Canada Kimberley.Browning@iaac-aeic.gc.ca Commis administratif, Bureau régional de l’Ontario Agence d'évaluation d'impact du Canada / Gouvernement du Canada Kimberley.Browning@iaac-aeic.gc.ca
From: Sydney Mcivor <sydney.mcivor@tylin.com> Sent: Friday, September 1, 2023 11:15 AM To: iaac.ontarioregion-regiondontario.aeic@iaac-aeic.gc.ca; Puvananathan,Anjala (IAAC/AEIC) <anjala.puvananathan@iaac-aeic.gc.ca> Subject: NOTICE - CITY OF KAWARTHA LAKES WATER AND WASTEWATER MASTER PLAN UPDATE Dear Stakeholder, T.Y. Lin InternaBonal Canada Inc. has been retained by the City of Kawartha Lakes to assist in undertaking a Municipal Class Environmental Assessment (EA) with respect to updaBng the Water and Wastewater Master Plan.
Please review the a4ached file containing details of the Water and Wastewater master plan for the City of Kawartha Lakes. If you have any quesBons, please feel free to contact Project Manager Kevin Brown, as noted in the le4er. Thank you, Sydney
Sydney McIvor CIVIL E.I.T. – WATER LINEAR T +1 905.738.5700 sydney.mcivor@tylin.com
TYLin
209 Dundas Street East Suite 301 Whitby, ON L1N 7H8, Canada TYLin. om
Ontario Region 600-55 York Street Toronto ON M5J 1R7
Région de l'Ontario 600-55, rue York Toronto (Ontario) M5J 1R7
October 11, 2023
Sent by email
Kevin Brown Project Manager TYLin 8800 Dufferin Street, Suite 200 Vaughan ON L4K 0C5 kevin.brown@TYLin.com
Dear Kevin Brown: Subject: Applicability of the Impact Assessment Act to the Water and Wastewater Master Plan Study proposed by City of Kawartha Lakes
Thank you for your correspondence, dated September 1, 2023, regarding the proposed Water and Wastewater Master Plan Study proposed by the City of Kawartha Lakes. The Impact Assessment Act (the IAA) sets out the federal process for assessing the impacts of certain major projects, including the assessment of positive and negative environmental, economic, health and social effects that are within the legislative authority of the Parliament of Canada. The Physical Activities Regulations (the Regulations) under the IAA identify the physical activities that constitute the “designated projects” that are subject to the IAA and may require an impact assessment. Proponents of designated projects are required to submit an Initial Project Description to the Impact Assessment Agency of Canada (the Agency) to inform a determination of whether an impact assessment is required. Based on the information you provided, it is the Agency’s view that the Project is not a designated project. As a result, an Initial Project Description is not required. Should details or design aspects of the Project change such that the Project may include physical activities that are described in the Regulations, contact the Agency to discuss these changes and the implications on the applicability of the IAA.
Please note that for physical activities not described in the Regulations, subsection 9(1) of the IAA provides that the Minister of Environment and Climate Change (the Minister) may designate a physical activity. The Minister may designate on request or on his or her own initiative. A physical activity may be designated if the Minister is of the opinion that the carrying out of that activity may cause adverse effects within federal jurisdiction or adverse direct or incidental effects (resulting from federal decisions), or if public concerns related to those effects warrant the designation. Should the Minister designate the physical activity it would be considered a designated project and an Initial Project Description would be required. Should the Project be carried out in whole or in part on federal lands, section 82 of the IAA would apply if any federal authority is required to exercise a power, duty or function under an Act other than IAA in order for the Project to proceed, or is providing financial assistance for the purpose of enabling the Project to be carried out. In that case, that federal authority must ensure that any Project assessment requirements under those provisions are satisfied. In addition, other federal regulatory permits, authorizations and/or licences may still be required. Further information on the IAA and associated regulations can be found at https://www.canada.ca/en/impact-assessment-agency.html. If you have any questions, please feel free to contact us at ontarioregion-regiondontario@iaac-aeic.gc.ca. Sincerely,
Anjala Puvananathan Director, Ontario Region
Enclosure: Useful Legislation, Regulation, and Guidance Documents
c.c.: Nafiur Rahman, City of Kawartha Lakes Sydney McIvor, TYLin
Enclosure: Useful Legislation, Regulation, and Guidance Documents For more information on the Impact Assessment Act, please refer to the following links: Legislation and Regulations: https://www.canada.ca/en/impact-assessment-agency/corporate/actsregulations/legislation-regulations.html Impact Assessment Process Overview: https://www.canada.ca/en/impact-assessment-agency/services/policy-guidance/impactassessment-process-overview.html Practitioner’s Guide to Federal Impact Assessments under the Impact Assessment Act: https://www.canada.ca/en/impact-assessment-agency/services/policyguidance/practitioners-guide-impact-assessment-act.html Compendium of Policies and Guidance Documents: https://www.canada.ca/en/impact-assessment-agency/services/policy-guidance.html
Project File Report Kawartha Lakes Water-Wastewater Master Plan Capacity Assessment
Appendix A3
PCC1
September 12th, 2023
First Name Last Name Position Organization Address Postal Code Dear Stakeholder, Re: CITY OF KAWARTHA LAKES WATER-WASTEWATER MASTER PLAN UPDATE MUNICIPAL CLASS ENVIRONMENTAL ASSESSMENT – NOTICE OF PUBLIC INFORMATION CENTRE (PIC) T.Y. Lin International Canada Inc. has been retained by the City of Kawartha Lakes to assist in undertaking a Municipal Class Environmental Assessment (EA) with respect to updating the Water and Wastewater Master Plan. The City of Kawartha Lakes recognizes the importance of planning for growth and supporting the sustainability of its water and wastewater infrastructure in the long term. The City has experienced a significant increase in growth over the recent years, which is driving demands for improvements and upgrades to its water and wastewater infrastructure. Accordingly, the City is proceeding with the planning of this EA Study as a Schedule B undertaking in accordance with the requirements of the Environmental Assessment Act. Public consultation is a key component of every Class EA. By sending you this letter, we are informing you of the opportunity to participate in the class EA process. For further information on the upcoming Public Information Centre, please review the attached Notice of Public Information Centre. We look forward to your participation in the public consultation process. T.Y. Lin International Canada Inc.
Kevin Brown, P.Eng. Project Manager | Senior Municipal Engineer Email: Kevin.Brown@TYLin.com cc: Nafiur Rahman, City of Kawartha Lakes
Water and Wastewater Servicing and Capacity Master Plan
NOTICE OF PUBLIC INFORMATION CENTRE #1 Introduction The City of Kawartha Lakes has experienced a significant increase in growth over the recent years. The Water and Wastewater Servicing and Capacity Master Plan was initiated to identify the existing servicing constraints and provide a long-term water and wastewater servicing strategy that supports existing communities and growth to 2051 and beyond (ultimate buildout).
Master Plan Class Environmental Assessment This study is being conducted in accordance with the requirements of Phases 1 and 2 of the Municipal Class Environmental Assessment, which is an approved process under the Environmental Assessment Act. The Master Plan Class Environmental Assessment (MPCEA) process includes public and review agency consultation, an assessment of the problem and opportunities, an evaluation of alternative solutions, an assessment of potential effects on the environment, and identification of reasonable measures to mitigate the adverse effects. The preferred solution(s) will be determined based on engineering requirements, environmental considerations (natural, social, economic), public input and information gathered during the studies.
About the Public Information Centre Public consultation is a key component of the MPCEA process. We would like to invite you, your friends, and your neighbours to participate in the Public Information Centres (PICs) to inform these studies. The PIC will be an Open House style session with a 15-minute summary presentation at 7 pm followed by review of display boards by the participants. At the PICs, you will be able to learn about our approach and our findings, ask us questions, and share your thoughts and opinions. Your participation in PICs is important to us. If you are unable to attend the PIC in person, the display boards will be available online, and a live stream of the presentation will be available on Zoom. Live-stream participants will also have the opportunity to ask questions after the presentation on Zoom. For more information go to: www.kawarthalakes.ca/majorprojects (Scroll to the “City-Wide” section).
To Join by Zoom: https://kawarthalakes.zoom.us/s/88460843887 Join Zoom by Telephone For higher quality, dial a number based on your current location. Canada: +1 647 558 0588 or +1 647 374 4685 Meeting ID: 884 6084 3887 Passcode: 910005
Public Information Centre #1 Details: Date: Wednesday, October 18, 2023 Time: 6 pm to 8 pm Presentation: 7 pm (15 minutes) Location: City Hall, Victoria Room, 26 Francis St., Lindsay, ON
Kevin Brown, P.Eng. Project Manager T.Y.Lin International Canada Inc. (416) 843-4689 Kevin.Brown@TYLin.com
Nafiur Rahman, P.Eng., PMP Supervisor, Environmental Capital Project Management Engineering and Corporate Assets City of Kawartha Lakes 705-324-9411 ext. 1193 nrahman@kawarthalakes.ca
Under the Freedom of Information and Protection of Privacy Act and the Environmental Assessment Act, unless otherwise stated in the submission, any personal information such as name, address, telephone number and property location included in a submission will become part of the public record files for this matter and may be released, if requested, to any person.
PUBLIC INFORMATION CENTRE #1
Water and Wastewater Servicing and Capacity Master Plan Update WEDNESDAY OCTOBER 18, 2023 Victoria Room, City of Kawar tha Lakes Town Hall 6:00 pm TO 8:00 PM Presentation at 7:00 PM (Simulcast through Zoom)
Photo: Lindsay Water Treatment Plant
Land Acknowledgement “The City of Kawartha Lakes respectfully acknowledges that we are situated on Mississauga lands and the traditional territory covered by the Williams Treaties. We are grateful for the opportunity to work here and we thank all the generations of people who have taken care of this land - for thousands of years. We recognize and deeply appreciate their historic connection to this place. We also recognize the contributions of Métis, Inuit, and other Indigenous peoples, both in shaping and strengthening this community and country as a whole. This recognition is connected to our collective commitment to make the promise and the challenge of Truth and Reconciliation real in our community.”
Welcome and Introductions ‒ Introductions ‒ PIC Format and Housekeeping Notes ‒ Have questions? ‒ In-person: Raise your hand ‒ Remote: Use the chat feature at the bottom to ask your question ‒ Emergency Exits and Restrooms
‒ Open-Door versus Closed-Doors: ‒ You may have questions or concerns which cannot be addressed by this process. We will try to direct you to the appropriate Contact-Person if we cannot address them.
‒ Provision for Technical Issues: ‒ Project Website: www.kawarthalakes.ca/majorprojects Today’s session is being recorded and will be posted online afterwards along with this presentation
Study Background The City has experienced a significant increase in growth over the recent years, which is driving demands for improvements and upgrades to its water and wastewater infrastructure. ‒ The City is expected to grow to 117,000 people and 39,000 jobs by 2051. This is identified in the Provincial Growth Plan (A Place to Grow, 2020), and is reflected in the City’s Growth Management Strategy planning process. ‒ Council adopted the Province’s housing target for Kawartha Lakes of 6,500 newly constructed housing units by the end of 2031. The Objective of this Master Plan is to ensure that approved growth can be accommodated without affecting the level-of-service to existing residents and businesses.
Planning Forecast (Preliminary) ‒ Not yet Final, pending completion of the Growth Management Strategy process ‒ These are being updated, but are based on the Approved 2011 GMS (which allocated units to 2031), and Ministerial Zoning Orders (MZOs) ‒ These are INPUTS to this Master Plan
Level of Service Objectives ‒ Development leads to increased water demands and wastewater flows, which may result in low pressure or fire flow in certain areas, or exceed the existing treatment plant capacities. ‒ The objective of this Master Plan Update will be to study the impact of the planned growth, and identify required solutions to maintain the level of service.
Water Systems
Wastewater Systems
Water Treatment: Ensure that water supply needs can be provided, with planning for upgrades when plant flows reach 80% of Capacity System Pressures Operating pressures between 350 and 550 kPa (50 and 80 psi) Fire Flow Under fire flow conditions, the pressure should not drop below 140 kPa (20 psi) at any point in the water system
Wastewater Treatment: Ensure that wastewater treatment needs can be provided, with planning for upgrades when plant flows reach 80% of Capacity Design Flows The sanitary sewers should not surcharge under Design Flow Conditions System Surcharge (Policy Under Development) Under Severe Storm Events, water levels in sanitary sewers shall be below basement levels
Environmental Assessment Process Scope of the Master Plan
We are here
Water Supply and Storage Needs Facility/System
Birch Point Bobcaygeon Canadiana Shores Fenelon Falls Janetville Kings Bay Kinmount Lindsay (includes Oakwood) Manilla Manorview (Bethany) Mariposa Norland Omemee Pinewood (Pontypool) Pleasant Point Sonya Southview Estates Victoria Place Western Trent/Palmina (Bolsover) Woodfield (Bethany) Woodville
Water Treatment Plant Utilization (% of Maximum Day Production Capacity) Existing (1)
2051 Projection (2)
44% 69% 34% 41% 2% 8% 47%
44% 184% 34% 90% 90% 8% 134%
Approximate Units to 100% (3) 80 780 230 1,040 80 70 70
8%
2 9%
,260
3% 22% 93% 71% 20% 46% 30% 4 % 30% 90%
139% 22% 93% 74% 33% 102% 30% 4 % 30% 90%
30 90 0 30 130 120 130 40 120 20
70%
77%
40
21% 9%
13 % 108%
90 90
Water Storage Utilization (% of Capacity) Existing
2051 Projection
1%
12 %
122%
171%
82%
241%
Upgrades to some Water Treatment Plants and Storage Facilities will need to be considered in order to support the planned growth to 2051. Notes: 1. Based on Historical Use 2. Based on Design Criteria for Future Growth 3. Approximate, based on an assumed total residential and employment growth
30%
4%
Wastewater Treatment Needs Facility/System
Bobcaygeon Coboconk Fenelon Falls Kings Bay Lindsay Omemee
Wastewater Treatment Plant Utilization (% of Capacity) Existing
2051 Projection
Approximate Units to 100% (1)
76% 6% 72% 29% % 8%
18 % 8% 127% 29% 171% 111%
710 180 490 120 10,690 170
Historical Wet-Weather Flow Bypasses (past 5 years)? No No YES No No No
Upgrades to some Wastewater Treatment Plants will need to be considered in order to support the planned growth to 2051. Notes: 1. Approximate, based on an assumed total residential and employment growth
System Upgrades Assessment ‒ Master Plan Update will also assess required upgrades to Sewage Pumping Stations and Pipe Networks (water and wastewater) ‒ These upgrades will be more dependent on the actual locations of planned development (greenfield and intensification of currently-serviced properties) ‒ These upgrades will ensure that the systems can convey any increased water/wastewater flows ‒ Ensuring that existing infrastructure is upgraded will mitigate any potential impacts to existing users (drop in water pressures, sewer backups, etc) The complete list of recommended system upgrades will require the completed GMS, and will be presented at the 2nd Public Information Centre.
Next Steps Infrastructure Planning Scenarios
PIC #2 (Spring/Summer)
• Baseline (Existing) Condition Scenario
• The Next Steps will be detailed and presented in a similar format at the 2nd Public Information Centre
• Future Growth Scenarios
Impact Assessment • Identify the areas where the level of service is not met by the existing infrastructure
Identify Alternative Solutions • Identifying alternative solutions to mitigate the impacts of the growth • Evaluate Relative Impacts of Alternative Solutions
• Any recommended projects will be identified, and the Public will be invited to review the Recommendations and provide further comment • Following PIC #2, the Master Plan Report will be prepared, summarizing the entire Process, and formalizing the recommendations.
Thank You For Attending! If You Have Any Questions
Project Contacts
• Speak to a Member of the Project Team Tonight • Send an E-Mail
• City of Kawartha Lakes: Nafiur Rahman, P.Eng., PMP Supervisor, Environmental Capital Project Management Engineering and Corporate Assets NRahman@KawarthaLakes.ca Tel: (705) 324-9411 x1193
Comment Forms • These are available to be completed and Submitted • Please Submit by October 28th
Future Updates • Website: KawarthaLakes.ca/MajorProjects • Scroll Down to “City-Wide” • Please add your name to the Contact List
• Consultant (TYLin): Kevin Brown, P.Eng. TYLin International Canada Senior Municipal Project Manager Kevin.Brown@TYLin.com Tel: (289) 349-1902
SIGN-IN SHEET City of Kawartha Lakes Water and Wastewater Servicing and Capacity Master Plan Update Public Information Centre #1 | 6:00 PM – 8:00 PM Wednesday, October 18th, 2023 Name
y
s
Yes
Under the Municipal Freedom of Information and Protection of Privacy Act, unless otherwise stated in the submission, any personal information included in a submission will become part of the public record
SIGN-IN SHEET City of Kawartha Lakes Water and Wastewater Servicing and Capacity Master Plan Update Public Information Centre #1 | 6:00 PM – 8:00 PM Wednesday, October 18th, 2023 Name
Address
Phone
Add to Mailing List (Y/N)
Joe Sullivan
89 Prince Street Bobcaygeon, ON
705-768-5115
jsullivan@kawarthadairy.com
Yes
Under the Municipal Freedom of Information and Protection of Privacy Act, unless otherwise stated in the submission, any personal information included in a submission will become part of the public record
COMMENT SHEET Water and Wastewater Servicing and Capacity Master Plan Update Environmental Assessment Study Public Information Centre #1: WEDNESDAY, OCTOBER 18th, 2023| 6:00-8:00 PM City Hall – Victoria Room, 26 Francis St., Lindsay, ON Your opinion is important to us. Please take a moment to complete this comment sheet. You can deposit it in the comment box or complete it later and submit it by mail or e-mail. Please provide your contact information below (PLEASE PRINT): Name: Address: Telephone No.: Email Address: Do you want to be added to the project mailing list?
[ ] Yes [ ] No
Comments:
______
______ ______
______ PLEASE PUT THIS COMMENT SHEET IN THE COMMENT BOX PROVIDED, OR MAIL/E-MAIL TO:
Kevin Brown, P.Eng. Project Manager T.Y.Lin International Canada Inc. (289) 349-1902 Kevin.Brown@TYLin.com
Nafiur Rahman, P.Eng., PMP Supervisor, Environmental Capital Project Management Engineering and Corporate Assets City of Kawartha Lakes 705-324-9411 ext. 1193 nrahman@kawarthalakes.ca
Please note that information will be collected in accordance with the Municipal Freedom of Information and Privacy Protection Act. With the exception of personal information, all comments will become part of the public record.
Log #
Date Received
To TYLin
To Kawartha
Organization
Last Name
robbie.larocque@dgbiddle.com
Phone
Property Address
Additional Comment
Stakeholder Response
Good afternoon, Kevin and Nafiur, I attended the PIC on Wednesday evening. I participated virtually. Thank you for the opportunity to have that method of participation available. It was much appreciated so that not everyone had to travel to Lindsay that evening. I have a Client with whom I was looking to share the slide deck with. I went on-line and did not find the slide deck populated yet. I was also looking to find a Comment Sheet. I believe that you invited participants to contact Nafiur to get on the mailing list for future notifications of subsequent Public Information Centres. It would be very much appreciated if you could include me on this email list for future PIC’s. Thank you in advance firstly for the present and secondly for including me on the contact list for future meetings. I will continue to patrol the City’s website for the Slide Deck. If you could let me know when that occurs that would be much appreciated.
Responded to?
Response Date?
TYLin Response
Yes
10/20/2023
Thank you for your participation at the PIC and interest on the project. We are in the process of uploading the presentation slides and fillable comment form at the website. Our Communication team is working on it. Please see attached a copy of presentation slides and comment form.
10/20/2023
x
x
D.G. Biddle & Associates LTD
2
10/24/2023
x
x
GRIT (From PIC #1 Zoom)
My Q is, how are strategically addressing the settlements like Oakwood, Hamlet where MOE already identified water contamination, and currently running on emergency water supply? We have a project where is is being forced to use grounds water in coming future through development proposal.
No
2.1
10/24/2023
x
x
Allister (from PIC #1 Zoom)
Hello, my question is what are the next steps for Fenelon Falls because they have had a historical wet weather flow bypass within the last year?
No
3
11/28/2023
x
department.secondarylanduse@hydroone.com
No comment yet as not enough information provided. Request to be consulted further as the project advances.
Preliminary - need to review possible conflicts with transmission lines.
11/28/2023
Thank you. E-Mail address has been added to the contact list. We will send further information when availible.
developmentgrit@gmail.com
We are the owners of land in the Hamlet of Oakwood and are looking at opportunities to service the subject property for development purposes. We understand that a public information meeting was held in October as part of the Class EA process for water and wastewater services. Would you be kind enough to send us any presentations and display board images from the public information meeting as unfortunately we were unable to attend. Please send to this email address.
Yes
12/11/2023
Thank you for reaching out. (provided project website link). Please Advise if you have any further questions. We will add you to the stakeholder contact list.
4
12/11/2023
X
x
GRIT Development
Secondary Land Use
Chourey
Laroque
1
Hydro One Networks
Robbie
First Name
Asset Optimization
Manoj
905-576-8500
From: Sent: To: Cc: Subject: Attachments:
Follow Up Flag: Flag Status:
Nafiur Rahman <nrahman@kawarthalakes.ca> Friday, October 20, 2023 2:53 PM 'Robbie Larocque' Kevin Brown; Sydney McIvor RE: NOTICE OF PUBLIC INFORMATION CENTRE #1 - CITY OF KAWARTHA LAKES WATER AND WASTEWATER MASTER PLAN UPDATE 2023 10 17 - 10599 - PRES - Kawartha PIC #1 - DOWNLOADABLE.pdf; CKL PIC #1 Comment Sheet (blank).docx Follow up Flagged
Hi Robbie, Thank you for your participation at the PIC and interest on the project. We are in the process of uploading the presentation slides and fillable comment form at the website. Our Communication team is working on it. Please see attached a copy of presentation slides and comment form. Thanks Nafiur Rahman, P.Eng., PMP Supervisor, Environmental Capital Project Management Infrastructure Design and Construction, Engineering and Corporate Assets City of Kawartha Lakes 705-324-9411 ext. 1193 www.kawarthalakes.ca
From: Robbie Larocque <robbie.larocque@dgbiddle.com> Sent: Friday, October 20, 2023 2:30 PM To: kevin.brown@TYLin.com; Nafiur Rahman <nrahman@kawarthalakes.ca> Subject: NOTICE OF PUBLIC INFORMATION CENTRE #1 - CITY OF KAWARTHA LAKES WATER AND WASTEWATER MASTER PLAN UPDATE Good afternoon, Kevin and Nafiur, I attended the PIC on Wednesday evening. I participated virtually.
Thank you for the opportunity to have that method of participation available. It was much appreciated so that not everyone had to travel to Lindsay that evening. I have a Client with whom I was looking to share the slide deck with. I went on-line and did not find the slide deck populated yet. I was also looking to find a Comment Sheet. I believe that you invited participants to contact Nafiur to get on the mailing list for future notifications of subsequent Public Information Centres. It would be very much appreciated if you could include me on this email list for future PIC’s. Thank you in advance firstly for the present and secondly for including me on the contact list for future meetings. I will continue to patrol the City’s website for the Slide Deck. If you could let me know when that occurs that would be much appreciated.
Robbie Larocque, P. Eng. Water Resource Manager, Vice President
_____________________________ D.G. Biddle & Associates Limited 96 King St. E • Oshawa, ON • L1H 1B6 (905) 576-8500 • www.dgbiddle.com Please note, staff at DG Biddle & Associates Ltd will respond to messages during their regular working hours as per the Employment Standards Act. PRIVILEGE AND CONFIDENTIALITY NOTICE: As regulated by the Personal Information Protection and Electronic Documents Act, S.C.2000 C5, this electronic transmission, including all attachments, is directed in confidence to the person(s) to which it is addressed, or an authorized recipient, and may not otherwise be distributed, copied, printed, or disclosed. If you have received this electronic transmission in error, please notify the sender immediately by return transmission and then immediately delete this transmission, including all attachments, without copying, printing, distributing, or disclosing same. This message, including any attachments, is privileged and intended only for the addressee(s) named above. If you are not the intended recipient, you must not read, use or disseminate the information contained in this e-mail. If you have received this e-mail in error, please notify the sender immediately by telephone, fax, or e-mail and shred this confidential e-mail, including any attachments, without making a copy. Access to this e-mail by anyone else is unauthorized.
From: Sent: To: Cc: Subject:
Robbie Larocque <robbie.larocque@dgbiddle.com> Friday, October 20, 2023 2:54 PM nrahman Kevin Brown; Sydney McIvor RE: NOTICE OF PUBLIC INFORMATION CENTRE #1 - CITY OF KAWARTHA LAKES WATER AND WASTEWATER MASTER PLAN UPDATE
Follow Up Flag: Flag Status:
Follow up Flagged
Thank you so very much Nafiur!
Robbie Larocque, P. Eng. Water Resource Manager, Vice President
_____________________________ D.G. Biddle & Associates Limited 96 King St. E • Oshawa, ON • L1H 1B6 (905) 576-8500 • www.dgbiddle.com Please note, staff at DG Biddle & Associates Ltd will respond to messages during their regular working hours as per the Employment Standards Act. PRIVILEGE AND CONFIDENTIALITY NOTICE: As regulated by the Personal Information Protection and Electronic Documents Act, S.C.2000 C5, this electronic transmission, including all attachments, is directed in confidence to the person(s) to which it is addressed, or an authorized recipient, and may not otherwise be distributed, copied, printed, or disclosed. If you have received this electronic transmission in error, please notify the sender immediately by return transmission and then immediately delete this transmission, including all attachments, without copying, printing, distributing, or disclosing same.
From: Nafiur Rahman <nrahman@kawarthalakes.ca> Sent: Friday, October 20, 2023 2:53 PM To: Robbie Larocque <robbie.larocque@dgbiddle.com> Cc: kevin.brown@TYLin.com; 'Sydney McIvor' <sydney.mcivor@tylin.com> Subject: RE: NOTICE OF PUBLIC INFORMATION CENTRE #1 - CITY OF KAWARTHA LAKES WATER AND WASTEWATER MASTER PLAN UPDATE
Hi Robbie, Thank you for your participation at the PIC and interest on the project. We are in the process of uploading the presentation slides and fillable comment form at the website. Our Communication team is working on it. Please see attached a copy of presentation slides and comment form. Thanks Nafiur Rahman, P.Eng., PMP Supervisor, Environmental Capital Project Management
Infrastructure Design and Construction, Engineering and Corporate Assets City of Kawartha Lakes 705-324-9411 ext. 1193 www.kawarthalakes.ca
From: Robbie Larocque <robbie.larocque@dgbiddle.com> Sent: Friday, October 20, 2023 2:30 PM To: kevin.brown@TYLin.com; Nafiur Rahman <nrahman@kawarthalakes.ca> Subject: NOTICE OF PUBLIC INFORMATION CENTRE #1 - CITY OF KAWARTHA LAKES WATER AND WASTEWATER MASTER PLAN UPDATE Good afternoon, Kevin and Nafiur, I attended the PIC on Wednesday evening. I participated virtually. Thank you for the opportunity to have that method of participation available. It was much appreciated so that not everyone had to travel to Lindsay that evening. I have a Client with whom I was looking to share the slide deck with. I went on-line and did not find the slide deck populated yet. I was also looking to find a Comment Sheet. I believe that you invited participants to contact Nafiur to get on the mailing list for future notifications of subsequent Public Information Centres. It would be very much appreciated if you could include me on this email list for future PIC’s. Thank you in advance firstly for the present and secondly for including me on the contact list for future meetings. I will continue to patrol the City’s website for the Slide Deck. If you could let me know when that occurs that would be much appreciated.
Robbie Larocque, P. Eng. Water Resource Manager, Vice President
_____________________________ D.G. Biddle & Associates Limited 96 King St. E • Oshawa, ON • L1H 1B6 (905) 576-8500 • www.dgbiddle.com
Please note, staff at DG Biddle & Associates Ltd will respond to messages during their regular working hours as per the Employment Standards Act. PRIVILEGE AND CONFIDENTIALITY NOTICE: As regulated by the Personal Information Protection and Electronic Documents Act, S.C.2000 C5, this electronic transmission, including all attachments, is directed in confidence to the person(s) to which it is addressed, or an authorized recipient, and may not otherwise be distributed, copied, printed, or disclosed. If you have received this electronic transmission in error, please notify the sender immediately by return transmission and then immediately delete this transmission, including all attachments, without copying, printing, distributing, or disclosing same. This message, including any attachments, is privileged and intended only for the addressee(s) named above. If you are not the intended recipient, you must not read, use or disseminate the information contained in this e-mail. If you have received this e-mail in error, please notify the sender immediately by telephone, fax, or e-mail and shred this confidential e-mail, including any attachments, without making a copy. Access to this e-mail by anyone else is unauthorized.
From: Sent: To: Cc: Subject:
Nafiur Rahman <nrahman@kawarthalakes.ca> Tuesday, October 24, 2023 10:50 AM Kevin Brown; Vardhini Parvatham; Sydney McIvor Abe Khademi; cpurdy PIC#1 Questions through Zoom
Follow Up Flag: Flag Status:
Follow up Flagged
Hi Kevin, These are two questions received at PIC#1 through Zoom: From GRIT My Q is, how are strategically addressing the settlements like Oakwood, Hamlet where MOE already identified water contamination, and currently running on emergency water supply? We have a project where is is being forced to use grounds water in coming future through development proposal. From Allister Hello, my question is what are the next steps for Fenelon Falls because they have had a historical wet weather flow bypass within the last year? Thanks Nafiur This message, including any attachments, is privileged and intended only for the addressee(s) named above. If you are not the intended recipient, you must not read, use or disseminate the information contained in this e-mail. If you have received this e-mail in error, please notify the sender immediately by telephone, fax, or e-mail and shred this confidential e-mail, including any attachments, without making a copy. Access to this e-mail by anyone else is unauthorized.
Kevin Brown From: Sent: To: Cc: Subject: Attachments:
SUN Hongxia <Susan.SUN@HydroOne.com> on behalf of SECONDARY LAND USE Department <Department.SecondaryLandUse@hydroone.com> November 28, 2023 9:24 AM Kevin Brown SECONDARY LAND USE Department Hydro One Response: 20231128-NoticeOfPIC1-Water and Wastewater Servicing and Capacity Master Plan 20231128-NoticeOfPIC1-Water and Wastewater Servicing and Capacity Master Plan.pdf; 19699.pdf
[You don't o en get email from department.secondarylanduse@hydroone.com. Learn why this is important at h ps://aka.ms/LearnAboutSenderIden$fica$on ] Please see the a ached for Hydro One's Response.
Hydro One Networks Inc SecondaryLandUse@HydroOne.com
1
Kevin Brown From: Sent: To: Cc: Subject:
Kevin Brown November 28, 2023 10:11 AM SECONDARY LAND USE Department Nafiur Rahman RE: Hydro One Response: 20231128-NoticeOfPIC1-Water and Wastewater Servicing and Capacity Master Plan
Thank you for your communica on. At this me, we are not in a posi on to confirm whether we will be recommending infrastructure improvements which might conflict with Hydro One's infrastructure. As such we will keep you updated as the study progresses further. We have added this e-mail address to our Stakeholder List. As for possible Hydro One sta on expansions, that is outside of the scope of our Study. We are determining water and wastewater servicing requirements based on the Official Planning forecasts for the serviced communi es within the City of Kawartha Lakes. Any assessment of electrical servicing requirements would have to be done by others. Regards, -Kevin Brown Kevin Brown, P.Eng. (he, him) SENIOR MUNICIPAL ENGINEER PROJECT MANAGER M +1 416.843.4689 TYLin
-----Original Message----From: SUN Hongxia <Susan.SUN@HydroOne.com> On Behalf Of SECONDARY LAND USE Department Sent: Tuesday, November 28, 2023 9:24 AM To: Kevin Brown <Kevin.Brown@TYLin.com> Cc: SECONDARY LAND USE Department <Department.SecondaryLandUse@hydroone.com> Subject: Hydro One Response: 20231128-No ceOfPIC1-Water and Wastewater Servicing and Capacity Master Plan [You don't oIen get email from department.secondarylanduse@hydroone.com. Learn why this is important at hJps://aka.ms/LearnAboutSenderIden fica on ] Please see the aJached for Hydro One's Response.
Hydro One Networks Inc SecondaryLandUse@HydroOne.com
1
From: Sent: To: Cc: Subject:
Kevin Brown Monday, December 11, 2023 12:07 PM Grit Development; nrahman Sydney McIvor RE: PIC Information on Class EA Water and Wastewater
Follow Up Flag: Flag Status:
Follow up Flagged
Thank you for reaching out. All of the information is available on the Project Website: • • •
Navigate to https://www.kawarthalakes.ca/en/municipal-services/major-projects.aspx Scroll down to “City-wide” Select “Water and Wastewater Servicing and Capacity Master Plan to expand the list of information available. o The Presentation Slides are downloadable o The video from the presentation is available through a YouTube link (held in-person but also broadcast simultaneously)
Please advise if you have any further questions. We will add you to our Stakeholder Communication List moving forward. Please provide your full contact details (including a contact name) for our records. Thank you, -Kevin
Kevin Brown, P.Eng. (he, him) SENIOR MUNICIPAL ENGINEER PROJECT MANAGER M +1 416.843.4689
From: Grit Development Sent: Monday, December 11, 2023 11:43 AM To: nrahman <nrahman@kawarthalakes.ca> Cc: Kevin Brown <kevin.brown@tylin.com> Subject: PIC Information on Class EA Water and Wastewater You don't often get email from
Good morning Nafiur,
Learn why this is important
We are the owners of land in the Hamlet of Oakwood and are looking at opportunities to service the subject property for development purposes. We understand that a public information meeting was held in October as part of the Class EA process for water and wastewater services. Would you be kind enough to send us any presentations and display board images from the public information meeting as unfortunately we were unable to attend. Please send to this email address. Many thanks, GRIT Developments
From: Sent: To: Cc: Subject:
Kevin Brown Thursday, December 14, 2023 6:42 AM Grit Development nrahman; Sydney McIvor RE: PIC Information on Class EA Water and Wastewater
Follow Up Flag: Flag Status:
Follow up Flagged
Good morning, Manoj: As the City’s Project Manager is currently on vacation until the New Year, it is difficult to schedule a meeting at this time. I will make a note to follow-up with Nafiur in the New Year, and we will schedule something at that time. In the meantime, perhaps you and I could have a quick phone call sometime next week, as I might be able to answer some of your questions quite quickly. I’m out of the office today and tomorrow, but I’m free most of next week. Please call me cell phone at your convenience. Regards, -Kevin
Kevin Brown, P.Eng. (he, him) SENIOR MUNICIPAL ENGINEER TEAM LEAD - HYDRAULICS AND INFRASTRUCTURE PLANNING M +1 416.843.4689
From: Grit Development Sent: Wednesday, December 13, 2023 9:59 PM To: Kevin Brown <kevin.brown@tylin.com> Cc: nrahman <nrahman@kawarthalakes.ca>; Sydney McIvor <sydney.mcivor@tylin.com> Subject: Re: PIC Information on Class EA Water and Wastewater You don't often get email from
Learn why this is important
Good evening Kevin, Thank you for your quick response - I really appreciate such a high level of customer service. We found the presentation quickly and it clearly explained the process. As the time for input to the EA process is now, we would like to request a meeting on our project to specifically discuss servicing options and the EA process. We can meet in person at your offices or over lunch, whichever is most convenient for you. Please provide some dates and times in January that work for you and your team.
Please add our firm to your stakeholder communications list: Manoj Chourey Grit Developments 1 Concorde gate, Suite 702, Toronto, ON M3C 3N6 Please note our preferred method of communication is via email. Many thanks and we look forward to your response with some dates and times. On Mon, Dec 11, 2023 at 12:06 PM Kevin Brown <kevin.brown@tylin.com> wrote: Thank you for reaching out.
All of the information is available on the Project Website:
• Navigate to https://www.kawarthalakes.ca/en/municipal-services/major-projects.aspx • Scroll down to “City-wide” • Select “Water and Wastewater Servicing and Capacity Master Plan to expand the list of
information available. o The Presentation Slides are downloadable o The video from the presentation is available through a YouTube link (held in-person but also broadcast simultaneously)
Please advise if you have any further questions.
We will add you to our Stakeholder Communication List moving forward. Please provide your full contact details (including a contact name) for our records.
Thank you,
-Kevin
Kevin Brown, P.Eng. (he, him) SENIOR MUNICIPAL ENGINEER PROJECT MANAGER M +1 416.843.4689
TYLin
From: Grit Development Sent: Monday, December 11, 2023 11:43 AM To: nrahman <nrahman@kawarthalakes.ca> Cc: Kevin Brown <kevin.brown@tylin.com> Subject: PIC Information on Class EA Water and Wastewater
You don't often get email from
Learn why this is important
Good morning Nafiur,
We are the owners of land in the Hamlet of Oakwood and are looking at opportunities to service the subject property for development purposes. We understand that a public information meeting was held in October as part of the Class EA process for water and wastewater services. Would you be kind enough to send us any presentations and display board images from the public information meeting as unfortunately we were unable to attend. Please send to this email address.
Many thanks, GRIT Developments
Project File Report Kawartha Lakes Water-Wastewater Master Plan Capacity Assessment
Appendix A4
PCC2
May 21, 2024 «First_Name» «Last_Name» «Position_» «Organization_» «Address» «CityProvPC»
Dear Stakeholder, Re: CITY OF KAWARTHA LAKES WATER-WASTEWATER MASTER PLAN UPDATE MUNICIPAL CLASS ENVIRONMENTAL ASSESSMENT – NOTICE OF PUBLIC INFORMATION CENTRE (PIC) T.Y. Lin International Canada Inc. has been retained by the City of Kawartha Lakes to assist in undertaking a Municipal Class Environmental Assessment (EA) with respect to updating the Water and Wastewater Master Plan. The City of Kawartha Lakes recognizes the importance of planning for growth and supporting the sustainability of its water and wastewater infrastructure in the long term. The City has experienced a significant increase in growth over the recent years, which is driving demands for improvements and upgrades to its water and wastewater infrastructure. Accordingly, the City is proceeding with the planning of this EA Study as a Schedule B undertaking in accordance with the requirements of the Environmental Assessment Act. Public consultation is a key component of every Class EA. By sending you this letter, we are informing you of the opportunity to participate in the class EA process. For further information on the upcoming Public Information Centre, please review the attached Notice of Public Information Centre. We look forward to your participation in the public consultation process. T.Y. Lin International Canada Inc.
Kevin Brown, P.Eng. Project Manager | Senior Municipal Engineer Email: Kevin.Brown@TYLin.com cc: Nafiur Rahman, City of Kawartha Lakes
Water and Wastewater Servicing and Capacity Master Plan
Notice Of Public Information Centre #2 Introduction The City of Kawartha Lakes has experienced a significant increase in growth over the recent years. The Water and Wastewater Servicing and Capacity Master Plan was initiated to identify the existing servicing constraints and provide a long-term water and wastewater servicing strategy that supports existing communities and growth to 2051 and beyond (ultimate buildout).
Master Plan Class Environmental Assessment This study is being conducted in accordance with the requirements of Phases 1 and 2 of the Municipal Class Environmental Assessment, which is an approved process under the Environmental Assessment Act. The Master Plan Class Environmental Assessment (MPCEA) process includes public and review agency consultation, an assessment of the problem and opportunities, an evaluation of alternative solutions, an assessment of potential effects on the environment, and identification of reasonable measures to mitigate the adverse effects. The preferred solution(s) will be determined based on engineering requirements, environmental considerations (natural, social, economic), public input, and information gathered during the studies.
About the Public Information Centre Public consultation is a key component of the MPCEA process. We would like to invite you, your friends, and your neighbours to participate in the Public Information Centres (PICs) to inform these studies. The first PIC was held on October 18th, 2023, and discussed the project objectives and processes. The upcoming PIC will present the study findings and recommended upgrades for the City of Kawartha Lakes water and wastewater infrastructure. To centralize the Public Information Centre, both Fenlon Falls and Lindsay will host PIC events on separate evenings. Both locations will present the same information, addressing the entirety of the City of Kawartha Lakes. The events will be conducted as in-person Open House style sessions, with a formal presentation at 7:00pm. At the PICs, you will be able to learn about our approach and our findings, ask us questions, and share your thoughts and opinions. Your participation in PICs is important to us. If you are unable to attend the PIC in person, the display boards and presentation will be available online. A live stream of the Lindsay presentation will be available on Zoom. Live-stream participants will also have the opportunity to ask questions after the presentation on Zoom. Please note that the live stream will contain the same information as the Fenlon Falls PIC presentation. For more information go to: https://www.kawarthalakes.ca/en/municipal-services/major-projects.aspx (Scroll to the “City-Wide” section and click “Water and Wastewater Servicing and Capacity Master Plan”). A Zoom link will be made available on the city website at the same location and will be sent to everyone on the contact list prior to the event.
Kevin Brown, P.Eng. Project Manager TYLin International Canada Inc. (289) 349 1902 Kevin.Brown@TYLin.com
Nafiur Rahman, P.Eng., PMP Supervisor, Environmental Capital Project Management Engineering and Corporate Assets City of Kawartha Lakes 705-324-9411 ext. 1193 nrahman@kawarthalakes.ca Under the Freedom of Information and Protection of Privacy Act and the Environmental Assessment Act, unless otherwise stated in the submission, any personal information such as name, address, telephone number and property location included in a submission will become part of the public record files for this matter and may be released, if requested, to any person.
PUBLIC INFORMATION CENTRE #2
Water and Wastewater Servicing and Capacity Master Plan Update
Photo: Lindsay Water Treatment Plant
Land Acknowledgement “The City of Kawartha Lakes respectfully acknowledges that we are situated on Mississauga lands and the traditional territory covered by the Williams Treaties. We are grateful for the opportunity to work here and we thank all the generations of people who have taken care of this land - for thousands of years. We recognize and deeply appreciate their historic connection to this place. We also recognize the contributions of Métis, Inuit, and other Indigenous peoples, both in shaping and strengthening this community and country as a whole. This recognition is connected to our collective commitment to make the promise and the challenge of Truth and Reconciliation real in our community.”
Welcome and Introductions ‒ Introductions ‒ PIC Format and Housekeeping Notes ‒ Have questions? ‒ In-person: Raise your hand ‒ Emergency Exits and Restrooms
‒ Open-Door versus Closed-Doors: ‒ You may have questions or concerns which cannot be addressed by this process. We will try to direct you to the appropriate Contact-Person if we cannot address them.
‒ Provision for Technical Issues: ‒ Project Website: www.kawarthalakes.ca/majorprojects
PIC #1 Recap – Study Background The City has experienced a significant increase in growth over the recent years, which is driving demands for improvements and upgrades to its water and wastewater infrastructure. ‒ The City is forecasted to grow to 130,000 people and 46,600 jobs by 2051. This is identified in the Provincial Growth Plan (A Place to Grow, 2020), and is reflected in the City’s Growth Management Strategy planning process. ‒ Council adopted the Province’s housing target for Kawartha Lakes of 6,500 newly constructed housing units by the end of 2031. The Objective of this Master Plan is to ensure that approved growth can be accommodated without affecting the level-of-service to existing residents and businesses.
Notes About Growth and Infrastructure Plans ‒ The GMS process is a parallel study to this Water/Wastewater Master Plan Update ‒ The Forecasts presented on the next slide are preliminary, and subject to change. ‒ The Forecasts presented on the next slide are an appropriate basis for the Water/Wastewater Master Plan Update ‒ These plans are updated regularly, so that adjustments can be made as required. ‒ Infrastructure plans tend to be slightly conservative, so that recommended infrastructure can accommodate a degree of evolution in the various plans.
Growth Management Strategy Forecasts Kawartha Lakes Communities with Municipal Servicing
Current Population
Forecasted Growth (GMS and Applications)
2051 Population Forecast
Bethany Birch Point Bobcaygeon Canadiana Shores Coboconk Fenelon Falls Janetville Kings Bay Kinmount Lindsay Manilla Mariposa Norland Oakwood Omemee Pinewood (Pontypool) Pleasant Point Sonya Southview Estates Victoria Place Western Trent/Palmina (Bolsover) Woodville
391 323 3,576 475 304 2,490 300 265 100 24,276 102 122 265 694 1,035 447 365 127 360 540 403 718
375 5,433 16 2,376 186 106 329 51,946 150 12 214 1,651 366 366 23 317
766 323 9,008 475 320 4,866 486 371 429 74,313 252 122 177 908 2,686 813 731 127 360 540 426 1,035
Level of Service Objectives ‒ Development leads to increased water demands and wastewater flows, which may result in low pressure or fire flow in certain areas, or exceed the existing treatment plant capacities. ‒ The objective of this Master Plan Update will be to study the impact of the planned growth, and identify required solutions to maintain the level of service.
Water Systems
Wastewater Systems
Water Treatment: Ensure that water supply needs can be provided, with planning for upgrades when plant flows reach 80% of Capacity System Pressures Operating pressures between 350 and 550 kPa (50 and 80 psi) Fire Flow Under fire flow conditions, the pressure should not drop below 140 kPa (20 psi) at any point in the water system
Wastewater Treatment: Ensure that wastewater treatment needs can be provided, with planning for upgrades when plant flows reach 80% of Capacity Design Flows The sanitary sewers should not surcharge under Design Flow Conditions System Surcharge (Policy Under Development) Under Severe Storm Events, water levels in sanitary sewers shall be below basement levels
Environmental Assessment Process Scope of the Master Plan
We are here
Master Plan Objectives ‒ The objective of this Master Plan Update will be to study the impact of the planned growth, and identify the following: 1. Facility and system upgrades which need to be implemented to support the forecasted growth 2. Capital Planning investments to assist the City in financing these upgrades 3. Maintain the Level-of-Service to existing residents and businesses
Evaluation of Alternatives ‒ The possible alternatives are as follows: 1. Do Nothing: ‒ Allow the growth to occur, but do not implement upgrades ‒ The systems will not have sufficient capacity.
2. Limit Community Growth: ‒ Establish the ultimate population can be supported by infrastructure, and do not allow the communities to grow beyond that population ‒ This does not fulfill the growth objectives established through Places to Grow and the Growth Management Strategy
3. Water Conservation and Inflow Reduction ‒ If we can reduce water demands and wastewater flows, the existing pipes can accommodate some increases in serviced population. ‒ This is always an objective, but rarely a complete solution
4. Expand the Facilities and Services ‒ Identify improvements required to Treatment, Pumping and Storage, Pipes ‒ Continue to investigate options to reduce servicing requirements
Servicing Assumptions 1. Treatment Upgrades: ‒ The Preferred Alternatives (upgrade existing treatment plant; build a second treatment plant, replace existing plant with a new larger facility) will not be confirmed through this process ‒ This Study will inform a subsequent “Schedule C” Class Environmental Assessment
2. Storage and Pumping Stations: ‒ The need for these facility upgrades has been confirmed, and we will proceed to an assessment of Site Availability through the summer
3. Internal Development Servicing: ‒ We have identified connection points based on the following: ‒ Availability of existing servicing adjacent to the development ‒ Preliminary Servicing Plans (where available) ‒ Topography and existing streets (where Servicing Plans are not Available)
‒ These assumptions are to be confirmed.
Servicing Calculations 1. Design Flow/Demand Basis ‒ Existing Serviced Areas are based on Historical Data (Plant Flow Records and/or Sewer Flow Monitoring Data) ‒ The hydraulic models have been calibrated ‒ Future Development is considered at the City Design Standard (450 Lpcd) ‒ This is typically a little conservative, so facility upgrades will be triggered a little ‘earlier’ than they might actually be required. ‒ Future Development assumes Design Infiltration Allowance (0.26 L/s/ha) ‒ There tends to be high historical Rainfall-Derived Inflows in the existing networks
2. Identification of Constraints ‒ Water constraints are based on resulting system pressures and available fire flows ‒ Wastewater: ‒ Pipes are identified for upgrading if future flows exceed 100% of pipe capacity ‒ Pipes are flagged for “future investigation” when the future flows exceed 80%
Lindsay - Water Water Storage [Current: 12,000 m3]
Treatment [Current: 22,730m3/d] Planning Horizon
Description
Existing
Additional Residential MDD [m3/day]
Additional I/C/I MDD [m3/day]
Total Additional MDD [m3/day]
Cumulative MDD [m3/day]
% Plant Capacity
-
-
-
13,213
58%
P1
Committed – Existing (Agreement + Buildout started prior to 2024)
2,845
P2A
North-West Trunk, South-East Development Charges By-Law
13,332
P2B
Other 2011 Growth Management Strategy
5,237
131
5,368
35,374
156%
P3
Continued MZO Buildout
20,663
230
20,893
56,267
248%
P4
Final MZO Buildout
-
4,931
4,931
61,198
269%
194
422
3,039
13,754
16,252
30,006
71%
132%
Planning Horizon
Required Cumulative MDD Equalization [m3/day] Storage [m3]
Required Fire Storage [m3]
Required Total Storage % of Existing Emergency Needed [m3] Storage Storage [m3]
Existing
13,213
3,303
4,500
1,951
9,754
82%
P1
16,252
4,063
4,500
2,141
10,704
90%
P2A
30,006
7,501
8,165
3,917
19,583
165%
P2B
35,374
8,843
8,165
4,252
21,260
179%
P3
56,267
14,067
8,165
5,558
27,789
234%
P4
61,198
15,300
8,165
5,866
29,330
247%
Recommendations • Upgrade Water Treatment Capacity (Schedule C Class EA) • Construct Additional Water Storage • Targeted System Upgrades and Extensions (incl. East Lindsay Trunk Watermain)
Lindsay - Water Constraints [Peak Hour]
Locate New Storage to Stabilize Pressures
System Extensions
East Lindsay Watermain
Lindsay - Water Constraints [Max Day+Fire]
Excess FF
Locate New Storage to Improve Fire Flows
System Extensions
East Lindsay Watermain
Lindsay - Wastewater Treatment [Current: 24,500m3/d] Planning Horizon
Description
Existing
Residential I/C/I ADF ADF [m3/day] [m3/day]
Pumping Stations
Total Additional ADF [m3/day]
Cumulative ADF [m3/day]
% Plant Capacity
Station
Capacity [L/s]
Buildout DWF
Buildout WWF
Recommendation
Fairgrounds
18
1
2
Maintain
Jennings Creek
400
215
351
Maintain
Lindsay St N.
470
79
302
Maintain
Logie
69
125
170
UPGRADE
Mary St E.
28
57
65
UPGRADE
-
-
-
13,436
55%
P1
Committed – Existing (Agreement + Buildout started prior to 2024)
1580
194
1,774
15,210
62%
P2A
North-West Trunk, South-East Development Charges By-Law
7406
394
7,800
23,010
94%
Ridout
375
373 [EL]
636 [EL]
UPGRADE
P2B
Other 2011 Growth Management Strategy
2909
131
3,041
26,051
106%
Rivera Park
637-701*
250
669
REVIEW
P3
Continued MZO Buildout
11479
219
11,698
37,750
154%
Riverview
8-30
18
25
REVIEW
P4
Final MZO Buildout
0
4,931
4,931
42,681
* = Capacity to be Confirmed [EL] = Includes flows from East Lindsay
174%
Recommendations • Upgrade Wastewater Treatment Capacity (Schedule C Class EA) • 2 Pumping Station Upgrades • Targeted System Upgrades and Extensions • New East Lindsay Trunk Sewer and SPS
Lindsay - Wastewater Constraints [DWF]
Dry Weather Flow
Rivera Park SPS
Riverview SPS
Potential Upgrades East Lindsay Trunk Sewer
Future System Connections
Ridout. SPS Logie St. SPS Mary St. SPS
Lindsay - Wastewater Constraints [WWF]
Wet Weather Flow
Rivera Park SPS
Riverview SPS
Potential Upgrades East Lindsay Trunk Sewer
Future System Connections
Ridout. SPS Logie St. SPS Mary St. SPS
Bobcaygeon - Water Water Storage [Current: 4,400 m3]
Treatment [Current: 5,184m3/d] Planning Horizon
Description
Existing
Total I/C/I Cumulative Residential Additional MDD MDD MDD MDD [m3/day] [m3/day] [m3/day] [m3/day]
% Plant Capacity
-
-
3,575
69%
313
3,888
75%
P1
Committed – Existing
313
P2
Committed Future
495
79
574
4,462
86%
P3
Other 2011 Growth Management Strategy
4,082
622
4,704
9,166
177%
Planning Horizon
Required Cumulative MDD Equalization [m3/day] Storage [m3]
Required Fire Storage [m3]
Required Total Storage % of Existing Emergency Needed [m3] Storage Storage [m3]
Existing
3,575
894
900
448
2,242
51%
P1
3,888
972
900
468
2,340
53%
P2
4,462
1,115
1,037
538
2,690
61%
P3
9,166
2,291
2,041
1,083
5,416
123%
Recommendations • Upgrade Water Treatment Capacity (Schedule C Class EA) • Construct Additional Water Storage • Targeted System Upgrades and Extensions
Bobcaygeon - Water Constraints [Peak Hour]
Bobcaygeon - Water Constraints [Max Day+Fire]
Bobcaygeon - Wastewater Treatment [Current: 3,055m3/d] Planning Horizon
Description
Existing
Residential ADF [m3/day] -
P1
Committed – Existing
156
P2
Committed – Future
247
P3
Other 2011 Growth Management Strategy
2,041
Pumping Stations
I/C/I ADF [m3/day]
Total Additional ADF [m3/day]
Cumulative ADF [m3/day]
% Plant Capacity
-
-
2,327
76%
156
2,483
81%
327
2,810
92%
79
622
2,663
5,473
179%
Station
Capacity [L/s]
Buildout DWF
Buildout WWF
Recommendation
Anne St.
81
87
135
UPGRADE
Bolton St.
7
0.5
1
Maintain
Front St.
14
42
67
UPGRADE
Lance St.
14
2
5
Maintain
Little Bob Dr.
15
26
41
UPGRADE
Main St.
6
7
8
REVIEW
Mill St.
19
1.7
8
Maintain
8 Navigators Tr
42
18
33
Maintain
54 Navigators Tr
19
5
9
Maintain
Need St.
32
31
47
UPGRADE
Riverside Dr
14
2
7
Maintain
Recommendations • Upgrade Wastewater Treatment Capacity (Schedule C Class EA) • 4 Pumping Station Upgrades • Targeted System Upgrades and Extensions
Bobcaygeon - Wastewater Constraints [DWF] Dry Weather Flow
Future System Connections
Bobcaygeon - Wastewater Constraints [WWF]
Wet Weather Flow
Future System Connections
Fenelon Falls - Water Water Storage [Current: 1,245 m3]
Treatment [Current: 4,100 m3/d] Planning Horizon
Description
Existing
Residential I/C/I MDD MDD [m3/day] [m3/day] -
P1
Committed – Existing
489
P2
2011 GMS
1,635
0
0
Total Additional MDD [m3/day]
Cumulative MDD [m3/day]
% Plant Capacity
Planning Horizon
Cumulative MDD [m3/day]
Required Equalization Storage [m3]
Required Required Fire Total Storage % of Existing Emergency Needed [m3] Storage Storage Storage [m3] [m3]
0
1,693
41%
Existing
1,693
423
792
304
1,519
122%
489
2,182
53%
P1
2,182
545
792
334
1,672
134%
1,635
3,817
93%
P2
3,817
954
792
437
2,183
175%
Recommendations • Construct Additional Water Storage • Targeted System Upgrades and Extensions
Fenelon Falls – Water [Fenelon Trails TOR Appl’n] Water Storage [Current: 1,245 m3]
Treatment [Current: 4,100 m3/d] Planning Horizon
Description
Existing
I/C/I Residential MDD MDD [m3/day] [m3/day] -
P1
Committed – Existing
489
P2
2011 GMS
2,730
0
0
Total Additional MDD [m3/day]
Cumulative MDD [m3/day]
% Plant Capacity
0
1,693
41%
489
2,182
53%
2,730
4,912
120%
Planning Horizon
Cumulative MDD [m3/day]
Required Equalization Storage [m3]
Required Fire Storage [m3]
Existing
1,693
423
792
304
1,519
122%
P1
2,182
545
792
334
1,672
134%
P2
3,817
954
792
437
2,183
175%
Required Total Storage % of Existing Emergency Needed [m3] Storage Storage [m3]
Recommendations • Construct Additional Water Storage • Targeted System Upgrades and Extensions • Upgrade Water Treatment Capacity (Schedule C Class EA)
Fenelon Falls - Water Constraints [Peak Hour]
System Extensions
Fenelon Falls - Water Constraints [Max Day+Fire]
System Extensions
Fenelon Falls - Wastewater Treatment [Current: 1,800 m3/d]
Pumping Stations
Residential ADF [m3/day]
I/C/I ADF [m3/day]
Total Additional ADF [m3/day]
Cumulative ADF [m3/day]
% Plant Capacity
-
-
-
1,297
72%
P1
Committed – Existing
244
0
244
1,541
86%
P2
2011 GMS
818
0
818
2,359
131%
Planning Horizon
Description
Existing
Station
Capacity [L/s]
Buildout DWF
Buildout WWF
Recommendation
Colborne St.
50
42
110
UPGRADE
Ellice St.
80
110
146
UPGRADE
Francis St.
6
3
11
UPGRADE
Recommendations • Upgrade Wastewater Treatment Capacity (Schedule C Class EA) • 3 Pumping Station Upgrades • Targeted System Upgrades and Extensions
Fenelon Falls – Wastewater [Fenelon Trails TOR Appl’n] Treatment [Current: 1,800 m3/d] Planning Horizon
Description
Existing
Residential I/C/I ADF ADF [m3/day] [m3/day]
Pumping Stations
Total Additional ADF [m3/day]
Cumulative ADF [m3/day]
% Plant Capacity
-
-
-
1,297
72%
P1
Committed – Existing
244
0
244
1,541
86%
P2
2011 GMS
1365
0
1365
2,906
161%
Station
Capacity [L/s]
Buildout DWF
Buildout WWF
Recommendation
Colborne St.
50
78
146
UPGRADE
Ellice St.
80
146
182
UPGRADE
Francis St.
6
3
11
UPGRADE
Recommendations • Upgrade Wastewater Treatment Capacity (Schedule C Class EA) • 3 Pumping Station Upgrades • Targeted System Upgrades and Extensions
Fenelon Falls - Wastewater Constraints [DWF] Dry Weather Flow
Future System Connections
Fenelon Falls - Wastewater Constraints [WWF] Wet Weather Flow
Future System Connections
Omemee - Wastewater Treatment [Current: 958 m3/d] Planning Horizon
Description
Existing
Residential I/C/I ADF ADF [m3/day] [m3/day]
Total Additional ADF [m3/day]
Pumping Stations
Cumulative ADF [m3/day]
% Plant Capacity
590
62%
-
0
P1
Committed – Existing
31
0
31
621
65%
P2
2011 GMS
712
0
712
1,333
139%
Plan for Plant Upgrade
Station
Capacity [L/s]
Buildout DWF
Buildout WWF
Recommendation
Church St.
64
54
216
UPGRADE
Sturgeon Rd
122
39
81
Maintain
Recommendations • Upgrade Wastewater Treatment Capacity (Currently Underway) • Upgrade Church Street SPS • Targeted System Upgrades
Omemee - Wastewater Constraints [DWF] Dry Weather Flow
Future System Connections
Omemee - Wastewater Constraints [WWF] Wet Weather Flow
Future System Connections
Woodville - Water Water Storage [Current: 550 m3]
Treatment [Current: 588 m3/d] Planning Horizon
Residential MDD [m3/day]
Existing
-
-
-
349
59%
Buildout
286
0
286
635
108%
I/C/I MDD Total Additional Cumulative [m3/day] MDD [m3/day] MDD [m3/day]
% Plant Capacity
Planning Horizon
Required Cumulative MDD Equalizatio [m3/day] n Storage [m3]
Required Fire Storage [m3]
Required Total Storage % of Existing Emergency Needed [m3] Storage Storage [m3]
Existing
349
164
0
0
164
30%
Buildout
635
292
0
0
292
54%
Recommendations • Consider WTP Upgrade • Targeted System Upgrades
Woodville- Water Constraints [Peak Hour]
System Extensions
Next Steps 1. Review Comments from Public/Stakeholders ‒ Please Submit by July 31st
2. Refine models as required ‒ Updates to GMS ‒ Refine potential system extensions ‒ Conduct Sewage Pumping Station testing to confirm capacities
3. Review Phasing of Upgrades ‒ Review existing reserve capacity in existing infrastructure ‒ Confirm the “triggers” for the infrastructure projects ‒ Assist City in developing the Capital Plan update
4. Finalise the Water/Wastewater Master Plan ‒ Updates to the Servicing Plans by planning horizon (2031, 2036, 2041, 2046, 2051) ‒ Prepare and issue Final Report ‒ Make report available to Public for 30-Day Statutory Review (Fall 2024)
Thank You For Attending! If You Have Any Questions • Speak to a Member of the Project Team Tonight • Send an E-Mail
Comment Forms • These are available to be completed and Submitted • Please Submit by July 31st
Future Updates • Website: KawarthaLakes.ca/MajorProjects • Scroll Down to “City-Wide” • Please add your name to the Contact List
Project Contacts • City of Kawartha Lakes: Nafiur Rahman, P.Eng., PMP Supervisor, Environmental Capital Project Management Engineering and Corporate Assets NRahman@KawarthaLakes.ca Tel: (705) 324-9411 x1193 • Consultant (TYLin): Kevin Brown, P.Eng. TYLin International Canada Senior Municipal Project Manager Kevin.Brown@TYLin.com Tel: (289) 349-1902
SIGN-IN SHEET City of Kawartha Lakes Water and Wastewater Servicing and Capacity Master Plan Update Public Information Centre #2 | 6:00 PM – 8:00 PM Wednesday, June 19th, 2024 Name
Address
Phone
Add to Mailing List (Y/N) Y
Y
Y
Y
Y
Y
Y
Y
Y
Y
Y
Under the Municipal Freedom of Information and Protection of Privacy Act, unless otherwise stated in the submission, any personal information included in a submission will become part of the public record
SIGN-IN SHEET City of Kawartha Lakes Water and Wastewater Servicing and Capacity Master Plan Update Public Information Centre #2 | 6:00 PM – 8:00 PM Wednesday, June 19th, 2024 Name
Address
Phone
Add to Mailing List (Y/N) Y
Y
Y
Y
Y
N
Under the Municipal Freedom of Information and Protection of Privacy Act, unless otherwise stated in the submission, any personal information included in a submission will become part of the public record
SIGN-IN SHEET City of Kawartha Lakes Water and Wastewater Servicing and Capacity Master Plan Update Public Information Centre #2 | 6:00 PM – 8:00 PM Wednesday, June 19th, 2024 Name
Address
Phone
Add to Mailing List (Y/N) Y
Y
Y
Robbie Larocque
96 King St E, Oshawa, ON L1H 1B6
905-576-8500
robbie.larocque@dgbiddle.com
Y
Y
Y
Under the Municipal Freedom of Information and Protection of Privacy Act, unless otherwise stated in the submission, any personal information included in a submission will become part of the public record
SIGN-IN SHEET City of Kawartha Lakes Water and Wastewater Servicing and Capacity Master Plan Update Public Information Centre #2 | 6:00 PM – 8:00 PM Thursday, June 20th, 2024 Name
Address
Phone
Add to Mailing List (Y/N) Y
Mark Wilson
245 Kent St W, Lindsay, ON K9V 2Z3
Saverio Montemarano
Dave Milliner
Markham, ON
705-340-1801
mark.w@mvwconstruction.com
Y
416-400-1500
saverio@bromont.homes.com
Y
519-375-0122
dmilliner@flatogroup.com
Y
Y
Y
Laura Lebel-Pantazopoulos
2472 Kingston Rd, Toronto, ON M1N 1V3
llebelpantazopoulos@thebiglierigroup.com
Karl Repka
Lindsay, K9V 5H4
krepka@counterpointeng.com
Spencer Feeley
Ryan Windle
spencer@feeleygroup.com
327 Renfrew Dr, Suite 201, Markham, ON
rwindle@digtam.ca
Under the Municipal Freedom of Information and Protection of Privacy Act, unless otherwise stated in the submission, any personal information included in a submission will become part of the public record
SIGN-IN SHEET City of Kawartha Lakes Water and Wastewater Servicing and Capacity Master Plan Update Public Information Centre #2 | 6:00 PM – 8:00 PM Thursday, June 20th, 2024 Name
Address
Phone
Susan Rosales
srosales@moldenhauer.ca
Allister Andrews
aandrews@digram.ca
Trevor Schwab
Lindsay, K9V 6J6
Tschwab@kawarthalakes.ca
Under the Municipal Freedom of Information and Protection of Privacy Act, unless otherwise stated in the submission, any personal information included in a submission will become part of the public record
Add to Mailing List (Y/N)
COMMENT SHEET Water and Wastewater Servicing and Capacity Master Plan Update Environmental Assessment Study Public Information Centre #2: WEDNESDAY, JUNE 19TH, 2024| 6:00-8:00 PM 27 Veterans Way, Fenelon Falls, ON Your opinion is important to us. Please take a moment to complete this comment sheet. You can deposit it in the comment box or complete it later and submit it by mail or e-mail. Please provide your contact information below (PLEASE PRINT): Name: Address: Telephone No.: Email Address: Do you want to be added to the project mailing list?
[ ] Yes [ ] No
Comments:
______
______ ______
______ PLEASE PUT THIS COMMENT SHEET IN THE COMMENT BOX PROVIDED, OR MAIL/E-MAIL TO:
Kevin Brown, P.Eng. Project Manager T.Y.Lin International Canada Inc. (289) 349-1902 Kevin.Brown@TYLin.com
Nafiur Rahman, P.Eng., PMP Supervisor, Environmental Capital Project Management Engineering and Corporate Assets City of Kawartha Lakes 705-324-9411 ext. 1193 nrahman@kawarthalakes.ca
Please note that information will be collected in accordance with the Municipal Freedom of Information and Privacy Protection Act. With the exception of personal information, all comments will become part of the public record.
COMMENT SHEET Water and Wastewater Servicing and Capacity Master Plan Update Environmental Assessment Study Public Information Centre #2: THURSDAY, JUNE 20TH, 2024| 6:00-8:00 PM City Hall – Victoria Room, 26 Francis St., Lindsay, ON Your opinion is important to us. Please take a moment to complete this comment sheet. You can deposit it in the comment box or complete it later and submit it by mail or e-mail. Please provide your contact information below (PLEASE PRINT): Name: Address: Telephone No.: Email Address: Do you want to be added to the project mailing list?
[ ] Yes [ ] No
Comments:
______
______ ______
______ PLEASE PUT THIS COMMENT SHEET IN THE COMMENT BOX PROVIDED, OR MAIL/E-MAIL TO:
Kevin Brown, P.Eng. Project Manager T.Y.Lin International Canada Inc. (289) 349-1902 Kevin.Brown@TYLin.com
Nafiur Rahman, P.Eng., PMP Supervisor, Environmental Capital Project Management Engineering and Corporate Assets City of Kawartha Lakes 705-324-9411 ext. 1193 nrahman@kawarthalakes.ca
Please note that information will be collected in accordance with the Municipal Freedom of Information and Privacy Protection Act. With the exception of personal information, all comments will become part of the public record.
Log #
Date Received
To TYLin
To Kawartha
Organization
Last Name
First Name
Phone
Property Address
Additional Comment
Stakeholder Response
Responded to?
Response Date?
I had been in contact with the team responsible for the water and wastewater servicing study last October to ask about the project schedule. At the time, I was told that PIC #2 would be scheduled for spring or summer 2024. I haven’t seen any communication confirming the date for PIC #2 yet, could you please provide an update on the timeline? 1
4/22/2024
x
x
GHD
Summerscales
Ian
ian.summerscales@ghd.com
2
4/22/2024
x
Hancock
Wayne
whancock@cavanmonaghan.net
3
5/24/2024
x
Goulet
Sandra
mail@skeltonbrumwell.ca
4
5/24/2024
x
x
Harris
Mark
289 453 2022
140 Allstate Parkway, Markham
We have a client who has developed a draft plan for 36 lots in the Janetville hamlet settlement area, which would help to meet some of the projected growth in Janetville. Please let us know if the information regarding the proposed Janetville Estates development was passed on to the team responsible for the servicing study, and if you would like to discuss further.
In response to conversation in Log 1
mark@odandetech.com
We are working towards confirming the schedule for PCC #2 in the next week. We are hopeful of getting it set for late-June at this time.
yes
4/22/2024
As for the Janetville Site Plan, we are working with Planning on proposed/potential development. Our information comes directly from them, as it needs to be part of the Official GMS to have status in the Master Plans. Without knowing specifically which parcel you are referring to, we cannot confirm whether it is in the numbers provided to TYLin or not.
The site in Janetville is a draft plan of subdivision and is in the present official plan. The original draft plan was filed in 2012. In order to finalize draft plan approval, we are needing to confirm water capacity for the site. It has also been approved with 36 lots and sep&c approval was given. We originally discussed this with Richard Holy before his retirement and more recently with Leah Barrie, who is the new Director. Juan Rojas has also been copied. We are asking for final approval of a draft plan. This has been a long time in the works and we would like to conclude it. Please co-ordinate this with Leah as she is aware.
no
Sam Anderson is no longer with Skelton Brumwell & Associates. Please remove her email from your notification list.
yes
Pls. add me to the City of Kawartha Lakes WaterWastewater Servicing Master Plan Update Municipal Class EA distribution list.
TYLin Response
5/24/2024
Sam has been removed from the contact list.
You have been added to the City of Kawartha Lakes Water and Wastewater Servicing Master Plan Update Municipal Class EA distribution list. yes
5/27/2024 Attached is the Notice of Public Information Centre #2.
Mark Harris – mark@odandetech.com
All future project communications will be sent to you as well.
I am writing you at the request of our Client Jim Webster. Mr Webster has land holdings at the North/west quadrant of the Village of Fenelon Falls. The property has frontage on Louisa Street, Queen Street, Princes Street, Robson Road and Albert Streets.
As you are aware that the city planning team is currently undertaking the Growth Management Strategy (GMS) study which is evaluating land needs assessment to accommodate future growth within the community. This GMS study is not completed yet.
In regards to client Jim Webster. 5
5/28/2024
x
x
D.G. Biddle & Associates
Larocque
Robbie
robbie.larocque@dgbiddle.com
905-576-8500
96 King St E, Oshawa
I am asked to remind the team who are preparing the City of Kawartha Lakes Water and Wastewater Master Stakeholder responded with requested Plan to have appropriate regard for this property information. See file 05r - Larocque in your work assignment. Responded to by CKL
yes
5/30/2024 Can you please provide a drawing/map showing the location and details of development (number of units/lots, area) related to the development application(s) submitted to the city for the properties mentioned in your email?
Yesterday I was reminded by our Client of a personal conversation and commitment from Mayor Doug Elsmlie that this property would be serviced with the Master Planning work.
In regards to client Dave Mancini.
6
5/28/2024
x
x
D.G. Biddle & Associates
Larocque
Robbie
robbie.larocque@dgbiddle.com
905-576-8500
96 King St E, Oshawa
I am writing you at the request of our Client Mr. Dave Mancini. Mr. Mancini has land holdings within three quadrants of the Village of Woodville. As you may be aware, Mr. Mancini is actively developing in the North/west quadrant of the Village of Woodville. Currently we are pursuing a third phase of his Maple Hills Subdivision. Further to the west of the Maple Hills Subdivision Mr. Mancini has holdings which he wishes that you have regard during your master water plan update.
Responded to by CKL. Mr. Mancini has other development parcels See information provided by within the village in the North/east quadrant stakeholder, additional comments having frontage on Argyle Street at Union Street between Kevin and Nafiur, and internal and CKL Road 46 (Nappadale Street) as well he CKL discussion in file 06r - Larocque. has another development parcel, 57M-735, located on within the South/west quadrant of the Village with frontage on CKL Road 9 (King Street).
yes
6/5/2024
For our better understanding please clarify and mark the development details in a map.
I am asked to remind the team who are preparing the City of Kawartha Lakes Water and Wastewater Master Plan to have appropriate regard for Mr. Mancini’s development parcels in Woodville during your work assignment.
7
5/27/2024
x
Ministry of Citizenship and Multiculturalism
We are still completing our assessment and have not – as of yet – confirmed the Schedule B projects which will be required.
Thanks for sending the Notice of PIC #2 for the above note project to the Ministry of Citizenship and Multiculturalism (MCM) – MCM File 0020031. Barboza
Karla
karla.barboza@ontario.ca
416-660-1027
yes Could you please advise the status of the technical cultural heritage studies for the Schedule B undertaking(s)? I attached our initial letter.
6/4/2024
We will be identifying these in the coming week, as we complete the technical analysis. Once we know where they will be located, we will initiate a more targeted Cultural Heritage assessment.
8
5/27/2024
9
5/31/2024
10
6/3/2024
x
x
x
MHBC
Brathwaite
Eric
ebrathwaite@mhbcplan.com
3 Lakes Development
Tabani
Saad
saad@3lakes.ca
Hydro One
TPUCC Drawings
Markups
tpumarkup@hydroone.com
905 761 5588
7050 Weston Road, Suite 230, Woodbridge
CC Saad Tabani of 3 Lakes Development (Log 9)
Following up from Eric Brathwaite's email in Log 8
289 724 0892
In response to initial mail out
Is there a registration process to be added to the Zoom Link for the June 20th meeting? yes
5/31/2024
Please let us know at your earliest convenience.
yes
5/31/2024
Hydro One does not have any comments. Thank you for circulating the PIC notice to the MTO. I am the Senior Project Manager who will be leading the review of Kawartha Lakes Water and Wastewater Master Plan. I am interested in attending the upcoming June 20th PIC via ZOOM. If you could kindly include me in the meeting invite or provide me with the link when it becomes available.
no
n/a
If so please advise so that we may register and attend the information session.
T.Y. Lin International Canada Inc. has been retained by the City of Kawartha Lakes to assist in undertaking a Municipal Class Environmental Assessment (EA) with respect to updating the Water and Wastewater Master Plan. In regards to the notice mailed on May 24th 2024, for the Water and Wastewater Master Plan Public Information Centre #2 (PIC) for the City of Kawartha Lakes, please see the attached zoom link to access the second PIC meeting on Thursday June 20 at 7pm.
We understand that your project is in its earlier stages, however, kindly note the following process updates for obtaining Ministry permits:
11
6/4/2024
x
x
MTO
Foreman
Shanna
shanna.foreman@ontario.ca
The Ministry has launched its new Land Development Module for the Highway Corridor Management System (HCMS) to streamline approval processes. Here are some of the available options at your disposal:
437-991-5387
yes
6/4/2024
-Submit a General Inquiry if you have questions or concerns related to your development and Ministry permits (ie. Permit control area, Encroachment, Building & Land-Use, Signs, Entrance permits). -A Pre-Consultation request is mandatory for developments before obtaining Ministry permits.
6/4/2024
13
6/5/2024
x
Hydro One
TPUCC Drawings
NLG Living
Mariani
TPUCCDrawings@hydroone.com
In response to zoom link email notice
Responded to by CKL x
Angela
angela@nlgc.com
905-683-1261
372 Taunton Road E. Unit L4B Whitby
Stakeholder responded with requested information. See file 14r - Mariani
To Join by Zoom: https://kawarthalakes.zoom.us/j/87902516 924?pwd=ZJBRNDfDUcO1saMaLdavhaUI xYI1xd.1 Meeting ID: 879 0251 6924 Passcode: 685464 Join Zoom by Telephone: +1 647 374 4685 Canada +1 647 558 0588 Canada
Here is the link to the site: www.hcms.mto.gov.on.ca/
12
No prior registration is required. The zoom meeting link is available at the website. For your reference, here is the meeting link details. *zoom link and details* No prior registration is required. The zoom meeting link is available at the website. For your reference, here is the meeting link details. *zoom link and details* n/a
If you have any questions, please feel free to contact Project Manager Kevin Brown, as noted in the previous letter.
If you have any questions or concerns, please do not hesitate to contact me Hydro One has no comments
no
n/a
I just wanted to confirm that we are included in the waste water master plan as we are requesting to rezone the site to residential
yes
6/5/2024
Thank you for providing the information
n/a Please provide the following details to understand the development that you mentioned here. • CKL Planning File Number(s), • Site Address, • Site Roll Number, • Development description – proposed development type (sub div, condo, apartment, etc) # res units, commercial ha? • Owner’s Name • Applicant’sCanada Name Inc. has T.Y. Lin International been retained by the City of Kawartha Lakes to assist in undertaking a Municipal Class Environmental Assessment (EA) with respect to updating the Water and Wastewater Master Plan. Please find attached correspondence related to the Water and Wastewater Master Plan Public Information Centre #2 (PIC) for the City of Kawartha Lakes, and please see the attached zoom link to access the second PIC meeting on Thursday June 20 at 7pm.
Miigwech for your email. Please note, that I have now retired as Gimaa of the Mississaugas of the Credit First Nation and this email will no longer be monitored.
14
6/10/2024
x
Mississaugas of the Credit First Nation
Laforme
Stacey
Stacey.Laforme@mncfn.ca
Please reach out to Ogimaa-Kwe Claire Sault, at Response sent to recommended emails claires@mncfn.ca or via her cell, 905-869-5767. (Claire Sault and Julia Johnson)
yes
6/10/2024
Alternatively, you can connect with our Council Coordinator, Julia Johnson at julia.johnson@mncfn.ca and she will be able to direct your email to the appropriate person.
To Join by Zoom: https://kawarthalakes.zoom.us/j/87902516 924?pwd=ZJBRNDfDUcO1saMaLdavhaUI xYI1xd.1 Meeting ID: 879 0251 6924 Passcode: 685464 Join Zoom by Telephone: +1 647 374 4685 Canada +1 647 558 0588 Canada If you have any questions, please feel free to contact Project Manager Kevin Brown, in the attached T.Y.as Linnoted International Canadaletter Inc. has been retained by the City of Kawartha Lakes to assist in undertaking a Municipal Class Environmental Assessment (EA) with respect to updating the Water and Wastewater Master Plan. Please find attached correspondence related to the Water and Wastewater Master Plan Public Information Centre #2 (PIC) for the City of Kawartha Lakes, and please see the attached zoom link to access the second PIC meeting on Thursday June 20 at 7pm.
15
6/10/2024
x
Mississaugas of the Credit First Nation
Johnson
Julia
Julia.Johnson@mncfn.ca
Responded to recommended email (Council.Coordinator@mncfn.ca)
I am on leave from MCFN. Please reach out to Council.Coordinator@mncfn.ca
yes
6/10/2024
To Join by Zoom: https://kawarthalakes.zoom.us/j/87902516 924?pwd=ZJBRNDfDUcO1saMaLdavhaUI xYI1xd.1 Meeting ID: 879 0251 6924 Passcode: 685464 Join Zoom by Telephone: +1 647 374 4685 Canada +1 647 558 0588 Canada If you have any questions, please feel free to contact Project Manager Kevin Brown, as noted in the attached letter
This is an automatically generated response from consultations@metisnation.org. Please do no reply to this e-mail address.
16
6/10/2024
x
Metis Nation of Ontario
Consultations
The MNO is adjusting standard work practices due to the Covid-19 outbreak and to better enable staff to work remotely. Please note that the MNO’s Lands, Resources and Consultations (LRC) Branch will no longer review hard copy consultation notices mailed to MNO offices. The LRC Branch will review all electronic notices and process them in accordance with our standard operating procedures. All consultation notices must be sent electronically to consultations@metisnation.org.
consultations@metisnation.org
no
n/a
n/a
The Métis Nation of Ontario’s LRC Branch acknowledges your information notice. The MNO reserves the right to request additional information, meetings and consultations in respect of the project should the MNO deem it to be necessary. For additional information pertaining to consulting with Ontario Métis please visit the MNO web site at: https://www.metisnation.org/programs-andservices/lands-resources-consultations/duty-toconsult/
17
6/10/2024
x
Huron Wendat Nation
Administration
Administration@wendake.ca
Responded to recommended email (consultation@wendake.ca)
Le Conseil de la Nation huronne-wendat (CNHW) souhaite vous informer d’une nouvelle façon de procéder pour l’envoi des consultations. Nous vous demandons dorénavant de transmettre toute nouvelle demande à l’adresse courriel suivante : consultations@wendake.ca. Puisque cette adresse devient le point d’entrée unique pour les consultations, nous vous prions également de retirer toute autre adresse courriel du CNHW de vos envois. À la réception d’une nouvelle consultation, celle-ci sera attribuée à un membre de notre équipe qui assurera le suivi du dossier. Vous serez ensuite invités à communiquer directement avec la personne responsable pour le suivi d’un dossier en cours. Nous vous remercions d’avance de votre collaboration. Kwe, Thank you for your email. Please note that we have updated our way of processing consultations. Any new consultation or project notice must be sent to the following email address: consultations@wendake.ca. We also kindly ask that you remove any other email adress from our organization from your mailing lists.
T.Y. Lin International Canada Inc. has been retained by the City of Kawartha Lakes to assist in undertaking a Municipal Class Environmental Assessment (EA) with respect to updating the Water and Wastewater Master Plan. Please find attached correspondence related to the Water and Wastewater Master Plan Public Information Centre #2 (PIC) for the City of Kawartha Lakes, and please see the attached zoom link to access the second PIC meeting on Thursday June 20 at 7pm. yes
6/10/2024
Meeting ID: 879 0251 6924 Passcode: 685464 Join Zoom by Telephone: +1 647 374 4685 Canada +1 647 558 0588 Canada If you have any questions, please feel free to contact Project Manager Kevin Brown, as noted in the attached letter.
Thank you for sending us the Notice of Commencement for the City of Kawartha Lakes Water-Wastewater Master Plan Update. Based on our initial scan, it appears that provincial government property may be located on Study Area #10 (Lindsay) on the outline you provided, identified by the Pins references in the photos attached. It is ultimately the proponent’s responsibility to verify if provincial government property is within the study area. Title documents may identify owners of provincial government property as any of the following:
18
6/11/2024
x
x
Infrastructure Ontario
Tse
Kaitlyn
• His Majesty the King • Her Majesty the Queen • Hydro One • Hydro One Networks Inc. • Management Board Secretariat (MBS) • Minister of Economic Development, Employment and Infrastructure (MEDEI) • Minister of Energy and Infrastructure (MEI) • Minister of Government and Consumer Services (MGCS) • Minister of Infrastructure (MOI) • Minister of Natural Resources and Forestry (MNRF) • Minister of Public Infrastructure Renewal (PIR) • Minister of Public Works • Minister of Transportation (MTO) • Ontario Lands Corporation (OLC) • Ontario Realty Corporation (ORC)
Kaitylin.Tse@infrastructureontario.ca
To Join by Zoom: https://kawarthalakes.zoom.us/j/87902516 924?pwd=ZJBRNDfDUcO1saMaLdavhaUI xYI1xd.1
no
n/a
n/a
If provincial government property in the study area is not required for the project, please continue to consult us as a directly affected stakeholder. However, if government property is required for the project, the proponent should contact us for a more in-depth review of the land
19
6/20/2024
x
Responded to by Nafiur & Roberta (CKL) Further conversation in Log 19r PDF
20
6/20/2024
x
Wayne Hancock here. We spoke last night. 1. Could you forward me the slides from the presentation last night. 2. Could provide the information for Janetville. The number on the chart notes only 136 capacity. 3. Could you advise me on the local improvement process to have sanitary sewer extended to 558 County Rd.8 Fenelon. 4. Can you advise who the planning contact for Fenelon Trails Subdivision is.
Can you please advise me whether the 2 new Condo developments in Fenelon Falls are included in the forecasted Management Stategy? One is called the Moorings on Cameron and the other is called Fenelon Lakes Club.
The presentation slides and video recording are in process for publishing to the city website. I will keep you updated once uploaded.
yes
7/8/2024
There is no update on smaller systems since the PIC#1. The capacity of smaller systems will be evaluated further considering other plant process limitations and GMS update. For municipal service connection please reach out to Roberta Perdue, Email: rperdue@kawarthalakes.ca
yes
6/21/2024
John Connolly, Email: jconnolly@kawarthalakes.ca; Leah Barrie, The servicing study is evaluating the infrastructure needs due to the developments already approved and forecasted for future. These two developments are included in our study. However, the approval or allocation of servicing is done through the separate development application process
21
6/21/2024
x
Digram Developments
Andrews
Allister
aandrews@digram.ca
905-513-7999 x202
327 Renfrew Dr, Suite 201, Markham ON L3R 9S8
Responded to by CKL
We are wondering if you could kindly provide us with a copy of yesterday's meeting in PowerPoint slides? If you have a copy in video format would be great as well.
yes
6/21/2024
We are processing the video and PP slides for uploading to the website. I will let you know once those are uploaded.
22
6/21/2024
x
Pearson Engineering
Wilson
Morgen
mwilson@pearsoneng.com
705-719-4785 ext. 262
48 Alliance Blvd, Suite B7 Barrie, ON L4M 5K3
Responded to by CKL
I am writing to request the display boards and presentation from PIC #2 for the Water and Wastewater Servicing and Capacity Master Plan.
yes
6/21/2024
We are processing the video and PP slides for uploading to the website. I will let you know once those are uploaded.
yes
6/21/2024
yes
7/8/2024
" On a side note … we do want to submit some comment on the material. Can we simply submit and email to you and Kevin to serve as formal comment? What is the deadline again? Thank again Nafiur. I haven’t brought this up to the owner yet, but would you and Kevin be open Comment submitted via email. See file to meeting with us "23 & 23r - Windle" for further separately? We can offer some info and get conversation and comment. some clarity on the initial findings. Responded to by CKL
23
24
25
6/21/2024
x
6/25/2024
6/24/2024
26
6/20/2024
27
6/28/2024
x
x
x
x
Digram Developments
Biglieri Group
MVW Construction and Engineering
Windle
Palacios
Wilson
Ryan
Frederico
Mark
rwindle@digram.ca
FPalacios@thebiglierigroup.com
mark.w@MVWconstruction.com
In response to converstaion with Allister Andrews in Log 21
905-513-7999 ext. 251
327 Renfrew Dr., Suite 201 Markham ON L3R 9S8
647-673-4978
2472 Kingston Rd, Toronto, ON M1N 1V3
Added to stakeholder contact list
245 Kent Street West, Lindsay ON, K9V 2Z3
See attachment in file 25 - Wilson
As per email below can you please confirm if there is any associated development application? GMS
yes
6/20/2024
Please review. We need to understand if there is servicing capacity for the Davidson site. See if you can pick up some relevant information.
yes
7/9/2024
705-324-7281
I am writing to inquire if the current process has identified any infrastructure investments for the community of Omemee based on capacity and use.
x
Webster Property
Webster
Property
lbarrie@kawarthalakes.ca> rperdue@kawarthalakes.ca
n/a
n/a
Internal discussion re. 05r - Laroque communications.
x
Michael Smith Planning Consultants
Smith
Michael
michael@msplanning.ca
905-535-5500
279 The Queensway South, Keswick, ON, L4P 2B4
May have been sent on accident
Additionally, I am wondering if you can provide a quick timeline of next steps, including when you expect a draft and final master plan to be available for consultation. Please find attached correspondence related to the Water and Wastewater Servicing and Capacity Master Plan.
We will post the comment form on the website. However, you can send comments to me and Kevin by email as well. The deadline to submit the comment is July 31st.
Sorry to reply you late. I acknowledge the receipt of your email. Our consultant team is further reviewing the study findings. The question deadline is July 31st. Following the deadline a summary of questions and answers will be published to the City website.
no Our recommendation is that you wait until the boundary expansion analysis is done. A portion of the Webster property has some rural development permissions under OP designation DP-9. I don’t see confirmation of a ‘draft approved’ plan of subdivision, and the proponent will be asked to provide this Thank you for your interest in the Kawartha Lakes Water and Wastewater Master Plan. Its not clear whether this was a question for the Study Team, or whether it was intended to be internal. Please advise whether you have a question for the team.
Hello Mr Brown, I have just returned from your presentation in Fenelon Falls and I thought I would email you, since that meeting was going over the expected time and you were facing a lot of opinions from members of the public. As background - I was an Urban Planning consultant for my 40+ yr career (20 years as a partner in SGL Planning), so I was sympathetic to your position in responding to the public. I thought you gave a very clear presentation, on a technical subject.
28
27-2
6/19/2024
7/10/2024
x
x
n/a
x
MS Planning
n/a
Smith
Michael
michael@msplanning.ca
905-535-5500
n/a
279 The Queensway South, Keswick, ON, L4P 2B4
My issues: 1. I live on Sturgeon Lake within Bobcaygeon on Perfectus Point (which is adjacent to Beach Park). I see that you have our local water distribution shown as RED dots on the streets on this point - ie. less than 0 l/s. I believe that this indicates a concern for firefighting capacity. I wonder if this is from actual tests or merely from mathematical modelling? I ask because I have extraordinarily strong water pressure at the end of Manor Road. There is a hydrant next to my address (it is not shown on your maps) and the pressure seems quite powerful when it is flushed each year. The water pressure within my house or at my garden tap is extremely strong. My plumber has suggested that I consider a valve to control it, for fear of pipe joints breaking under this pressure but I enjoy the fierce pressure in the bathroom showers. Every guest comments about it, so I question the RED designation. 2. My second concern is about the water quality of Sturgeon Lake and surrounding wa
My email was meant for one of my planners to follow up with you regarding servicing capacity in Lindsay. We work in other municipalities where servicing capacity is not available (Keswick, Sutton, Uxbridge, Cannington, Beaverton, Holland Landing) where servicing capacity is limited or non-existent at this time. Are you able to confirm if there is existing water and sewage plant capacity for development in Lindsay?
no
There are restrictions in both the Water and Wastewater Plants in Lindsay, and upgrades to the overall treatment capacities will be required to support full buildout of all of the lands currently identified for development.
yes
7/11/2024
The PIC Boards indicated that the Water Plant (at 100% capacity) can service a community population of approximately 35,000 residents (plus associated employment uses). Plans for plant upgrades should be in place by the time the plant reaches 80% of its capacity (we estimate a community population of approximately 29,000). The Wastewater Plant can accommodate more growth. It can support a population of approximately 47,000, and plans for upgrading should be in place at about 37,000 residents. The slides and a recording of the presentation are available on the Project Website. Go to https://www.kawarthalakes.ca/en/municipa l-services/major-projects.aspx, scrolldown to City-wide and expand the Water and Wastewater Servicing and Capacity
T.Y. Lin acknowledges the receipt of your comment regarding the City of Kawartha Lakes Water-Wastewater Master Plan Update Municipal Class Environmental Assessment. You have been added to the mailing list for this project. All future communications will be mailed to the address provided on your comment sheet.
29
7/12/2024
x
Houghton
603-111 William St N, Lindsay, ON, K9V 4Z8
Brian
Comment received by mail
Would like to be kept updated on keeping water and wastewater services for all in city…How many people in few years.
yes
7/25/2024
In response to your question: In response to your question: The current population of Lindsay is 24,276 people. It is estimated that this will grow to 74,313 people by the year 2051. This is a growth of approximately 50,000 people over the next 25 years, which amounts to an average increase of 2,000 people per year. We appreciate your participation in the public consultation process. Please let us know if you have any further questions.
I submit a Comment Sheet with respect to the recent PIC # 2.
30
7/30/2024
x
DG Biddle
Larocque
Robbie
robbie.larocque@dgbiddle.com
905-576-8500
96 King Street E, Oshawa, See attached comment sheet ON L1H 1B6 in file 30 - Larocque
I am trying to understand how your work will integrate the findings of the Growth Management Strategy, GMS, which is not intended to be complete for some time based I my review of the Documentation available on-line.
no
During the PIC it was suggested during the question and answer period that your work would gain direction for population from the GMS. Can you advise when your Update gain feedback from the GMS which remains a work in progress.
31
7/31/2024
x
32
8/1/2024
X
Ontario Heritage Operations
X
Minkin
Dan
Dan.Minkin@ontario.ca
416-786-7553
Attached email chain is conversation with Karla Barboza in Log 7. See file 7 Barboza or 31 - Minkin.
Thank you for the opportunity to review these PIC materials. Since it was not addressed directly in the presentation, I was wondering what was determined vis a vis the scope/timelines of cultural heritage report(s) and archaeological assessment(s) for Schedule B components. See attached email thread following from the Notice of PIC in May.
no
Principato
Karen
kpbenefits@sympatico.ca
416-419-9552
See questions and responses in file 32 & 32r - Principato
Various questions about the facility on Boyd Street (Bobcaygeon)
yes
In response to the technical memos/reports issued and associated materials presented at Public Information Centre #2, we offer the following comments on the Water and Wastewater Servicing and Capacity Master Plan update as it relates specifically to Fenelon Falls:
33
7/24/2024
x
x
Digram Developments
Windle
Ryan
rwindle@diagram.ca
289-552-2234
327 Renfrew Drive, Markham, ON, L3R 9S8
Response to PIC 2 Comment Sheet Online.
• TOR Construction Inc. (TOR) owns approximately 200ha of land in the southeast section of the Town of Fenelon Falls. •[...] Thank you in advance for your consideration of the above comments.
no
8/1/2024
Responses to the Questions
Sydney McIvor From: Sent: To: Cc: Subject:
Ian Summerscales <Ian.Summerscales@ghd.com> Monday, April 22, 2024 9:17 AM Kevin Brown nrahman; Wayne Hancock (InTouch); Sydney McIvor Water servicing and capacity master plan updates
Follow Up Flag: Flag Status:
Follow up Flagged
Some people who received this message don't often get email from ian.summerscales@ghd.com. Learn why this is important
Kevin, Nafiur: Good morning. I had been in contact with the team responsible for the water and wastewater servicing study last October to ask about the project schedule. At the time, I was told that PIC #2 would be scheduled for spring or summer 2024. I haven’t seen any communication confirming the date for PIC #2 yet, could you please provide an update on the timeline? We have a client who has developed a draft plan for 36 lots in the Janetville hamlet settlement area, which would help to meet some of the projected growth in Janetville. Please let us know if the information regarding the proposed Janetville Estates development was passed on to the team responsible for the servicing study, and if you would like to discuss further. Regards,
Ian Summerscales (he/him) P.Eng. Water engineer
GHD Proudly employee-owned | ghd.com 140 Allstate Parkway, Markham, Ontario, L3R 5Y8, Canada D +1 289 453 2022 | M +1 647 629 0153 | E ian.summerscales@ghd.com
The Power of Commitment Connect
Please consider the environment before printing this email
CONFIDENTIALITY NOTICE: This email, including any attachments, is confidential and may be privileged. If you are not the intended recipient please notify the sender immediately, and please delete it; you should not copy it or use it for any purpose or disclose its contents to any other person. GHD and its affiliates reserve the right to monitor and modify all email communications through their networks.
1
Sydney McIvor From: Sent: To: Cc: Subject:
Kevin Brown Monday, April 22, 2024 11:44 AM Ian Summerscales nrahman; Wayne Hancock (InTouch); Sydney McIvor RE: Water servicing and capacity master plan updates
Follow Up Flag: Flag Status:
Follow up Flagged
Ian: We are working towards confirming the schedule for PCC #2 in the next week. We are hopeful of getting it set for lateJune at this time. As for the Janetville Site Plan, we are working with Planning on proposed/poten al development. Our informa on comes directly from them, as it needs to be part of the Official GMS to have status in the Master Plans. Without knowing specifically which parcel you are referring to, we cannot confirm whether it is in the numbers provided to TYLin or not. -Kevin
Kevin Brown, P.Eng. (he, him) SENIORMUNICIPALENGINEER TEAM LEAD - HYDRAULICSAND INFRASTRUCTUREPLANNING M +1 416.843.4689
From: Ian Summerscales <Ian.Summerscales@ghd.com> Sent: Monday, April 22, 2024 9:17 AM To: Kevin Brown <Kevin.Brown@TYLin.com> Cc: nrahman <nrahman@kawarthalakes.ca>; Wayne Hancock (InTouch) <whancock@cavanmonaghan.net>; Sydney McIvor <sydney.mcivor@tylin.com> Subject: Water servicing and capacity master plan updates Some people who received this message don't often get email from ian.summerscales@ghd.com. Learn why this is important
Kevin, Nafiur: Good morning. I had been in contact with the team responsible for the water and wastewater servicing study last October to ask about the project schedule. At the time, I was told that PIC #2 would be scheduled for spring or summer 2024. I haven’t seen any communication confirming the date for PIC #2 yet, could you please provide an update on the timeline? We have a client who has developed a draft plan for 36 lots in the Janetville hamlet settlement area, which would help to meet some of the projected growth in Janetville. Please let us know if the information regarding the proposed Janetville Estates development was passed on to the team responsible for the servicing study, and if you would like to discuss further. 1
Regards,
Ian Summerscales (he/him) P.Eng. Water engineer
GHD Proudly employee-owned | ghd.com 140 Allstate Parkway, Markham, Ontario, L3R 5Y8, Canada D +1 289 453 2022 | M +1 647 629 0153 | E ian.summerscales@ghd.com
The Power of Commitment Connect
Please consider the environment before printing this email
CONFIDENTIALITY NOTICE: This email, including any attachments, is confidential and may be privileged. If you are not the intended recipient please notify the sender immediately, and please delete it; you should not copy it or use it for any purpose or disclose its contents to any other person. GHD and its affiliates reserve the right to monitor and modify all email communications through their networks.
2
Sydney McIvor From: Sent: To: Cc: Subject:
Wayne Hancock Monday, April 22, 2024 12:03 PM Kevin Brown; Ian Summerscales nrahman; Sydney McIvor RE: Water servicing and capacity master plan updates
Follow Up Flag: Flag Status:
Follow up Flagged
Kevin, The site in Janetville is a draft plan of subdivision and is in the present official plan. The original draft plan was filed in 2012. In order to finalize draft plan approval, we are needing to confirm water capacity for the site. It was also approved with 36 lots and septic approval was given. We originally discussed this with Richard Holy before his retirement and more recently with Leah Barrie, who is the new Director. Juan Rojas has also been copied. We are asking for final approval of a draft plan. This has been a long time in the works and we would like to conclude it. Please co-ordinate this with Leah as she is aware. Wayne From: Kevin Brown <Kevin.Brown@TYLin.com> Sent: April 22, 2024 11:44 AM To: Ian Summerscales <Ian.Summerscales@ghd.com> Cc: nrahman <nrahman@kawarthalakes.ca>; Wayne Hancock <sydney.mcivor@tylin.com> Subject: RE: Water servicing and capacity master plan updates
; Sydney McIvor
You don't often get email from kevin.brown@tylin.com. Learn why this is important
Ian: We are working towards confirming the schedule for PCC #2 in the next week. We are hopeful of getting it set for lateJune at this time. As for the Janetville Site Plan, we are working with Planning on proposed/potential development. Our information comes directly from them, as it needs to be part of the Official GMS to have status in the Master Plans. Without knowing specifically which parcel you are referring to, we cannot confirm whether it is in the numbers provided to TYLin or not. -Kevin
Kevin Brown, P.Eng. (he, him) SENIORMUNICIPALENGINEER TEAM LEAD - HYDRAULICSAND INFRASTRUCTUREPLANNING M +1 416.843.4689
TYLin
1
From: Ian Summerscales <Ian.Summerscales@ghd.com> Sent: Monday, April 22, 2024 9:17 AM To: Kevin Brown <Kevin.Brown@TYLin.com> Cc: nrahman <nrahman@kawarthalakes.ca>; Wayne Hancock (InTouch) McIvor <sydney.mcivor@tylin.com> Subject: Water servicing and capacity master plan updates
Sydney
Some people who received this message don't often get email from ian.summerscales@ghd.com. Learn why this is important
Kevin, Nafiur: Good morning. I had been in contact with the team responsible for the water and wastewater servicing study last October to ask about the project schedule. At the time, I was told that PIC #2 would be scheduled for spring or summer 2024. I haven’t seen any communication confirming the date for PIC #2 yet, could you please provide an update on the timeline? We have a client who has developed a draft plan for 36 lots in the Janetville hamlet settlement area, which would help to meet some of the projected growth in Janetville. Please let us know if the information regarding the proposed Janetville Estates development was passed on to the team responsible for the servicing study, and if you would like to discuss further. Regards,
Ian Summerscales (he/him) P.Eng. Water engineer
GHD Proudly employee-owned | ghd.com 140 Allstate Parkway, Markham, Ontario, L3R 5Y8, Canada D +1 289 453 2022 | M +1 647 629 0153 | E ian.summerscales@ghd.com
The Power of Commitment Connect
Please consider the environment before printing this email
CONFIDENTIALITY NOTICE: This email, including any attachments, is confidential and may be privileged. If you are not the intended recipient please notify the sender immediately, and please delete it; you should not copy it or use it for any purpose or disclose its contents to any other person. GHD and its affiliates reserve the right to monitor and modify all email communications through their networks.
2
Sydney McIvor From: Sent: To: Cc: Subject:
Sandra Goulet <mail@skeltonbrumwell.ca> Friday, May 24, 2024 2:02 PM Sydney McIvor Michael Wynia RE: NOTICE OF PUBLIC INFORMATION CENTRE #2 - CITY OF KAWARTHA LAKES WATER AND WASTEWATER MASTER PLAN UPDATE
Follow Up Flag: Flag Status:
Follow up Flagged
You don't often get email from mail@skeltonbrumwell.ca. Learn why this is important
Good Afternoon Sydney, Sam Anderson is no longer with Skelton Brumwell & Associates. Please remove her email from your notification list. Thank you Sandra Goulet
We have moved! New office location below, Sandra Goulet, B.Tech. | Office Coordinator Skelton, Brumwell & Associates Inc. Engineering Planning Environmental Consultants 125 Bell Farm Rd, Suite 203, Barrie, ON L4M 6L2 Tel: 705-726-1141 mail@skeltonbrumwell.ca | www.skeltonbrumwell.ca
“innovation with integrity”
From: Sydney McIvor <sydney.mcivor@tylin.com> Sent: Friday, May 24, 2024 1:50 PM To: Sam Anderson Former Staff <sanderson@skeltonbrumwell.ca> Subject: NOTICE OF PUBLIC INFORMATION CENTRE #2 - CITY OF KAWARTHA LAKES WATER AND WASTEWATER MASTER PLAN UPDATE Dear Stakeholder, T.Y. Lin International Canada Inc. has been retained by the City of Kawartha Lakes to assist in undertaking a Municipal Class Environmental Assessment (EA) with respect to updating the Water and Wastewater Master Plan. 1
Please review the attached file containing details of the Water and Wastewater Master Plan Public Information Centre #2 (PIC) for the City of Kawartha Lakes. If you have any questions, please feel free to contact Project Manager Kevin Brown, as noted in the letter. Thank you,
Sydney McIvor CIVIL E.I.T. – WATER LINEAR T +1 905.738.5700
TYLin
209 Dundas Street East Suite 301 Whitby, ON L1N 7H8, Canada TYLin.com
2
Sydney McIvor From: Sent: To: Subject:
Sydney McIvor Friday, May 24, 2024 2:53 PM Sandra Goulet RE: NOTICE OF PUBLIC INFORMATION CENTRE #2 - CITY OF KAWARTHA LAKES WATER AND WASTEWATER MASTER PLAN UPDATE
Good afternoon, Sam has been removed from the contact list. Thank you, Sydney
Sydney McIvor CIVIL E.I.T. – WATER LINEAR
From: Sandra Goulet <mail@skeltonbrumwell.ca> Sent: Friday, May 24, 2024 2:02 PM To: Sydney McIvor <sydney.mcivor@tylin.com> Cc: Michael Wynia <mwynia@skeltonbrumwell.ca> Subject: RE: NOTICE OF PUBLIC INFORMATION CENTRE #2 - CITY OF KAWARTHA LAKES WATER AND WASTEWATER MASTER PLAN UPDATE You don't often get email from mail@skeltonbrumwell.ca. Learn why this is important
Good Afternoon Sydney, Sam Anderson is no longer with Skelton Brumwell & Associates. Please remove her email from your notification list. Thank you Sandra Goulet
We have moved! New office location below, Sandra Goulet, B.Tech. | Office Coordinator Skelton, Brumwell & Associates Inc. Engineering Planning Environmental Consultants 125 Bell Farm Rd, Suite 203, Barrie, ON L4M 6L2 Tel: 705-726-1141 mail@skeltonbrumwell.ca | www.skeltonbrumwell.ca
“innovation with integrity”
1
From: Sydney McIvor <sydney.mcivor@tylin.com> Sent: Friday, May 24, 2024 1:50 PM To: Sam Anderson Former Staff <sanderson@skeltonbrumwell.ca> Subject: NOTICE OF PUBLIC INFORMATION CENTRE #2 - CITY OF KAWARTHA LAKES WATER AND WASTEWATER MASTER PLAN UPDATE Dear Stakeholder, T.Y. Lin International Canada Inc. has been retained by the City of Kawartha Lakes to assist in undertaking a Municipal Class Environmental Assessment (EA) with respect to updating the Water and Wastewater Master Plan. Please review the attached file containing details of the Water and Wastewater Master Plan Public Information Centre #2 (PIC) for the City of Kawartha Lakes. If you have any questions, please feel free to contact Project Manager Kevin Brown, as noted in the letter. Thank you,
Sydney McIvor CIVIL E.I.T. – WATER LINEAR T +1 905.738.5700
TYLin
209 Dundas Street East Suite 301 Whitby, ON L1N 7H8, Canada TYLin.com
2
Sydney McIvor From: Sent: To: Cc: Subject:
Kevin Brown Monday, May 27, 2024 8:35 AM Sydney McIvor nrahman FW: Water-Wastewater Servicing Master Plan Update Municipal Class EA
Importance:
High
Syd: Please see below. -Kevin
Kevin Brown, P.Eng. (he, him) SENIOR MUNICIPAL ENGINEER TEAM LEAD - HYDRAULICS AND INFRASTRUCTURE PLANNING M +1 416.843.4689
From: Mark Harris - Odan Detech Group <mark@odandetech.com> Sent: Friday, May 24, 2024 3:36 PM To: Kevin Brown <Kevin.Brown@TYLin.com>; nrahman <nrahman@kawarthalakes.ca> Cc: Angela Mariani <angela@nlgc.com>; George Whittington (gw@nlgc.com) <gw@nlgc.com> Subject: Water-Wastewater Servicing Master Plan Update Municipal Class EA Importance: High You don't often get email from mark@odandetech.com. Learn why this is important
Kevin/Nafiur, Pls. add me to the City of Kawartha Lakes Water-Wastewater Servicing Master Plan Update Municipal Class EA distribution list. Mark Harris – mark@odandetech.com Thank you,
Mark Harris, Dipl. Tech. | Senior Project Manager The Odan/Detech Group Inc. 1
P : (905) 632-3811 ext.122 | F : (905) 632-3363 | C : (289) 439-7281 5230, SOUTH SERVICE ROAD, UNIT 107 | BURLINGTON, ONTARIO | L7L 5K2 www.odandetech.com | mark@odandetech.com NOTICE OF CONFIDENTIALITY: This message and all files transmitted with it may contain information that is considered confidential and which may be prohibited from disclosure under applicable law or contractual agreement. It is intended solely for the use of the individual or entity to whom it is addressed. If you are not the named recipient, disclosing, copying, distributing or making use of the information contained in or attached to this message is strictly prohibited. If you have received this email transmission in error, please notify the sender immediately by replying to this email and then delete it from your system. The attached file(s) are for reference purposes only. It is the responsibility of the parties receiving this information to verify its accuracy. The Odan/Detech Group Inc. is not responsible for modified or reproduced versions of the data being transferred. These files are to be treated as unstamped and unsealed. To receive officially stamped and/or sealed files, contact The Odan/Detech Group Inc. to arrange for the receipt of hard copies.
2
Sydney McIvor Sydney McIvor Monday, May 27, 2024 8:53 AM mark@odandetech.com Kevin Brown RE: Water-Wastewater Servicing Master Plan Update Municipal Class EA 2024 05 27 - 3 - LTR Notice of PIC 2.pdf
From: Sent: To: Cc: Subject: Attachments:
Hello Mark, You have been added to the City of Kawartha Lakes Water and Wastewater Servicing Master Plan Update Municipal Class EA distribution list. Attached is the Notice of Public Information Centre #2. All future project communications will be sent to you as well. Thank you, Sydney
Sydney McIvor CIVIL E.I.T. – WATER LINEAR
From: Kevin Brown <Kevin.Brown@TYLin.com> Sent: Monday, May 27, 2024 8:35 AM To: Sydney McIvor <sydney.mcivor@tylin.com> Cc: nrahman <nrahman@kawarthalakes.ca> Subject: FW: Water-Wastewater Servicing Master Plan Update Municipal Class EA Importance: High Syd: Please see below. -Kevin
Kevin Brown, P.Eng. (he, him) SENIOR MUNICIPAL ENGINEER TEAM LEAD - HYDRAULICS AND INFRASTRUCTURE PLANNING M +1 416.843.4689
TYLin
From: Mark Harris - Odan Detech Group <mark@odandetech.com> Sent: Friday, May 24, 2024 3:36 PM 1
To: Kevin Brown <Kevin.Brown@TYLin.com>; nrahman <nrahman@kawarthalakes.ca> Cc: Angela Mariani <angela@nlgc.com>; George Whittington (gw@nlgc.com) <gw@nlgc.com> Subject: Water-Wastewater Servicing Master Plan Update Municipal Class EA Importance: High You don't often get email from mark@odandetech.com. Learn why this is important
Kevin/Nafiur, Pls. add me to the City of Kawartha Lakes Water-Wastewater Servicing Master Plan Update Municipal Class EA distribution list. Mark Harris – mark@odandetech.com Thank you,
Mark Harris, Dipl. Tech. | Senior Project Manager The Odan/Detech Group Inc. P : (905) 632-3811 ext.122 | F : (905) 632-3363 | C : (289) 439-7281 5230, SOUTH SERVICE ROAD, UNIT 107 | BURLINGTON, ONTARIO | L7L 5K2 www.odandetech.com | mark@odandetech.com NOTICE OF CONFIDENTIALITY: This message and all files transmitted with it may contain information that is considered confidential and which may be prohibited from disclosure under applicable law or contractual agreement. It is intended solely for the use of the individual or entity to whom it is addressed. If you are not the named recipient, disclosing, copying, distributing or making use of the information contained in or attached to this message is strictly prohibited. If you have received this email transmission in error, please notify the sender immediately by replying to this email and then delete it from your system. The attached file(s) are for reference purposes only. It is the responsibility of the parties receiving this information to verify its accuracy. The Odan/Detech Group Inc. is not responsible for modified or reproduced versions of the data being transferred. These files are to be treated as unstamped and unsealed. To receive officially stamped and/or sealed files, contact The Odan/Detech Group Inc. to arrange for the receipt of hard copies.
2
Charlotte Black From: Sent: To: Subject:
Sydney McIvor Thursday, May 30, 2024 8:43 AM Charlotte Black FW: NOTICE OF PUBLIC INFORMATION CENTRE #2 - CITY OF KAWARTHA LAKES WATER AND WASTEWATER MASTER PLAN UPDATE - Fenelon Falls Webster Property
Sydney McIvor CIVIL E.I.T. – WATER LINEAR
From: Robbie Larocque <robbie.larocque@dgbiddle.com> Sent: Tuesday, May 28, 2024 3:21 PM To: Sydney McIvor <sydney.mcivor@tylin.com>; Kevin Brown <kevin.brown@TYLin.com>; nrahman <nrahman@kawarthalakes.ca> Cc: Jim Webster Subject: RE: NOTICE OF PUBLIC INFORMATION CENTRE #2 - CITY OF KAWARTHA LAKES WATER AND WASTEWATER MASTER PLAN UPDATE - Fenelon Falls Webster Property Good afternoon, I am writing you at the request of our Client Jim Webster. Mr Webster has land holdings at the North/west quadrant of the Village of Fenelon Falls. The property has frontage on Louisa Street, Queen Street, Princes Street, Robson Road and Albert Streets. I am asked to remind the team who are preparing the City of Kawartha Lakes Water and Wastewater Master Plan to have appropriate regard for this property in your work assignment. Yesterday I was reminded by our Client of a personal conversation and commitment from Mayor Doug Elsmlie that this property would be serviced with the Master Planning work. Thank you in advance for your attention to this property. We look forward to your presentation on June 19, 2024 in Fenelon Falls. Thanks,
ROBBIE LAROCQUE, P. Eng. Senior Consulting Engineer, Partner Civil Group 96 King Street East, Oshawa, ON L1H 1B6 905-576-8500 dgbiddle.com
CIVIL | STRUCTURAL | MECHANICAL | ELECTRICAL | PLANNING Please note, staff at D.G. Biddle & Associates Ltd. will respond to messages during their regular working hours as per the Employment Standards Act. 1
PRIVILEGE AND CONFIDENTIALITY NOTICE: As regulated by the Personal Information Protection and Electronic Documents Act, S.C.2000 C5, this electronic transmission, including all attachments, is directed in confidence to the person(s) to which it is addressed, or an authorized recipient, and may not otherwise be distributed, copied, printed, or disclosed. If you have received this electronic transmission in error, please notify the sender immediately by return transmission and then immediately delete this transmission, including all attachments, without copying, printing, distributing, or disclosing same.
From: Sydney McIvor <sydney.mcivor@tylin.com> Sent: Friday, May 24, 2024 10:52 AM To: Robbie Larocque <robbie.larocque@dgbiddle.com> Subject: NOTICE OF PUBLIC INFORMATION CENTRE #2 - CITY OF KAWARTHA LAKES WATER AND WASTEWATER MASTER PLAN UPDATE Dear Stakeholder, T.Y. Lin International Canada Inc. has been retained by the City of Kawartha Lakes to assist in undertaking a Municipal Class Environmental Assessment (EA) with respect to updating the Water and Wastewater Master Plan. Please review the attached file containing details of the Water and Wastewater Master Plan Public Information Centre #2 (PIC) for the City of Kawartha Lakes. If you have any questions, please feel free to contact Project Manager Kevin Brown, as noted in the letter. Thank you,
Sydney McIvor CIVIL E.I.T. – WATER LINEAR T +1 905.738.5700
TYLin
209 Dundas Street East Suite 301 Whitby, ON L1N 7H8, Canada TYLin.com
2
Charlotte Black From: Sent: To: Subject: Attachments:
Sydney McIvor Wednesday, June 5, 2024 2:35 PM Charlotte Black FW: NOTICE OF PUBLIC INFORMATION CENTRE #2 - CITY OF KAWARTHA LAKES WATER AND WASTEWATER MASTER PLAN UPDATE - Fenelon Falls Webster Property 104008 DP-4 Draft Plan Of Subdivision.pdf
Sydney McIvor CIVIL E.I.T. – WATER LINEAR
From: Nafiur Rahman <nrahman@kawarthalakes.ca> Sent: Wednesday, June 5, 2024 2:33 PM To: 'Robbie Larocque' <robbie.larocque@dgbiddle.com>; Sydney McIvor <sydney.mcivor@tylin.com>; Kevin Brown <kevin.brown@TYLin.com> >; cpurdy <cpurdy@kawarthalakes.ca>; Roberta Perdue Cc: Jim Webster < <rperdue@kawarthalakes.ca>; Christina Sisson <csisson@kawarthalakes.ca>; jrojas <jrojas@kawarthalakes.ca>; Leah Barrie <lbarrie@kawarthalakes.ca> Subject: RE: NOTICE OF PUBLIC INFORMATION CENTRE #2 - CITY OF KAWARTHA LAKES WATER AND WASTEWATER MASTER PLAN UPDATE - Fenelon Falls Webster Property
Hi Robbie, Thank you for the information. I understand you are also in contact with city Planning department to consider this development as part of the GMS study. Nafiur From: Robbie Larocque <robbie.larocque@dgbiddle.com> Sent: Monday, June 3, 2024 12:25 PM To: Nafiur Rahman <nrahman@kawarthalakes.ca>; Sydney McIvor <sydney.mcivor@tylin.com>; kevin.brown@TYLin.com Cc: Jim Webster < >; Corby Purdy <cpurdy@kawarthalakes.ca> Subject: RE: NOTICE OF PUBLIC INFORMATION CENTRE #2 - CITY OF KAWARTHA LAKES WATER AND WASTEWATER MASTER PLAN UPDATE - Fenelon Falls Webster Property Good afternoon Nafiur, Thank you for your email. As requested, we have attached a copy of a Draft Plan of Subdivision for the holdings which our Client Mr. Jim Webster owns in the north west corner of Fenelon Falls.
1
The plan attached display the entire holdings, which is represented by the 19.90ha subdivision which contained 92 single family residences along with another 72 residential units in the form of 6 12-units development blocks. The plan has frontage on Queen Street, Louisa Street and Princes Street in the south. The attached plan displays a possible lot fabric on a further 18.28ha which our Client owns with frontage on Albert Street. Development of these 18.28ha lands would connect the roadways from and to the draft plan of subdivision lands. The extension of Princes Street into the plan is a viable opportunity to assist with vehicular access and servicing needs. We do hope that the attached plan shows the extents of our Client’s holdings and the road connections currently available. We would anticipate that servicing corridors for water and sanitary would follow extensions of the terminal points of the existing systems along Louisa Street, Queen Street, Albert Street and Princes Street near Jordan Street and Jordan Street. As will appreciate many years have passed since the creation of the attached Draft Plan. One might expect some evolution of the plan, lot sizing, unit mix, road pattern etc. however, the order of magnitude remains the same. The holdings amount to just shy of 40ha. which are positioned immediately adjacent to the existing built up Village residential. Thank you again for your email. If you should have any questions or concerns, please contact me at your earliest convenience.
ROBBIE LAROCQUE, P. Eng. Senior Consulting Engineer, Partner Civil Group 96 King Street East, Oshawa, ON L1H 1B6 905-576-8500 dgbiddle.com
CIVIL | STRUCTURAL | MECHANICAL | ELECTRICAL | PLANNING Please note, staff at D.G. Biddle & Associates Ltd. will respond to messages during their regular working hours as per the Employment Standards Act. PRIVILEGE AND CONFIDENTIALITY NOTICE: As regulated by the Personal Information Protection and Electronic Documents Act, S.C.2000 C5, this electronic transmission, including all attachments, is directed in confidence to the person(s) to which it is addressed, or an authorized recipient, and may not otherwise be distributed, copied, printed, or disclosed. If you have received this electronic transmission in error, please notify the sender immediately by return transmission and then immediately delete this transmission, including all attachments, without copying, printing, distributing, or disclosing same.
From: Nafiur Rahman <nrahman@kawarthalakes.ca> Sent: Thursday, May 30, 2024 10:12 AM To: Robbie Larocque <robbie.larocque@dgbiddle.com>; Sydney McIvor <sydney.mcivor@tylin.com>; kevin.brown@TYLin.com Cc: Jim Webster < >; Corby Purdy <cpurdy@kawarthalakes.ca> Subject: RE: NOTICE OF PUBLIC INFORMATION CENTRE #2 - CITY OF KAWARTHA LAKES WATER AND WASTEWATER MASTER PLAN UPDATE - Fenelon Falls Webster Property
Good morning Robbie, As you are aware that the city planning team is currently undertaking the Growth Management Strategy (GMS) study which is evaluating land needs assessment to accommodate future growth within the community. This GMS study is not completed yet.
2
Can you please provide a drawing/map showing the location and details of development (number of units/lots, area) related to the development application(s) submitted to the city for the properties mentioned in your email? Thanks Nafiur Rahman, P.Eng., PMP Supervisor, Environmental Capital Project Management Infrastructure Design and Construction, Engineering and Corporate Assets City of Kawartha Lakes 705-324-9411 ext. 1193 www.kawarthalakes.ca
From: Robbie Larocque <robbie.larocque@dgbiddle.com> Sent: Tuesday, May 28, 2024 3:21 PM To: Sydney McIvor <sydney.mcivor@tylin.com>; kevin.brown@TYLin.com; Nafiur Rahman <nrahman@kawarthalakes.ca> > Cc: Jim Webster < Subject: RE: NOTICE OF PUBLIC INFORMATION CENTRE #2 - CITY OF KAWARTHA LAKES WATER AND WASTEWATER MASTER PLAN UPDATE - Fenelon Falls Webster Property Good afternoon, I am writing you at the request of our Client Jim Webster. Mr Webster has land holdings at the North/west quadrant of the Village of Fenelon Falls. The property has frontage on Louisa Street, Queen Street, Princes Street, Robson Road and Albert Streets. I am asked to remind the team who are preparing the City of Kawartha Lakes Water and Wastewater Master Plan to have appropriate regard for this property in your work assignment. Yesterday I was reminded by our Client of a personal conversation and commitment from Mayor Doug Elsmlie that this property would be serviced with the Master Planning work. Thank you in advance for your attention to this property. We look forward to your presentation on June 19, 2024 in Fenelon Falls. Thanks,
ROBBIE LAROCQUE, P. Eng. Senior Consulting Engineer, Partner Civil Group 96 King Street East, Oshawa, ON L1H 1B6 905-576-8500 dgbiddle.com
3
CIVIL | STRUCTURAL | MECHANICAL | ELECTRICAL | PLANNING Please note, staff at D.G. Biddle & Associates Ltd. will respond to messages during their regular working hours as per the Employment Standards Act. PRIVILEGE AND CONFIDENTIALITY NOTICE: As regulated by the Personal Information Protection and Electronic Documents Act, S.C.2000 C5, this electronic transmission, including all attachments, is directed in confidence to the person(s) to which it is addressed, or an authorized recipient, and may not otherwise be distributed, copied, printed, or disclosed. If you have received this electronic transmission in error, please notify the sender immediately by return transmission and then immediately delete this transmission, including all attachments, without copying, printing, distributing, or disclosing same.
From: Sydney McIvor <sydney.mcivor@tylin.com> Sent: Friday, May 24, 2024 10:52 AM To: Robbie Larocque <robbie.larocque@dgbiddle.com> Subject: NOTICE OF PUBLIC INFORMATION CENTRE #2 - CITY OF KAWARTHA LAKES WATER AND WASTEWATER MASTER PLAN UPDATE Dear Stakeholder, T.Y. Lin International Canada Inc. has been retained by the City of Kawartha Lakes to assist in undertaking a Municipal Class Environmental Assessment (EA) with respect to updating the Water and Wastewater Master Plan. Please review the attached file containing details of the Water and Wastewater Master Plan Public Information Centre #2 (PIC) for the City of Kawartha Lakes. If you have any questions, please feel free to contact Project Manager Kevin Brown, as noted in the letter. Thank you,
Sydney McIvor CIVIL E.I.T. – WATER LINEAR T +1 905.738.5700
TYLin
209 Dundas Street East Suite 301 Whitby, ON L1N 7H8, Canada TYLin.com
This message, including any attachments, is privileged and intended only for the addressee(s) named above. If you are not the intended recipient, you must not read, use or disseminate the information contained in this e-mail. If you have received this e-mail in error, please notify the sender immediately by telephone, fax, or e-mail and shred this confidential e-mail, including any attachments, without making a copy. Access to this e-mail by anyone else is unauthorized. This message, including any attachments, is privileged and intended only for the addressee(s) named above. If you are not the intended recipient, you must not read, use or disseminate the information contained in this e-mail. If you have received this e-mail in error, please notify the sender immediately by telephone, fax, or e-mail and shred this confidential e-mail, including any attachments, without making a copy. Access to this e-mail by anyone else is unauthorized.
4
Charlotte Black From: Sent: To: Subject:
Sydney McIvor Thursday, May 30, 2024 8:44 AM Charlotte Black FW: NOTICE OF PUBLIC INFORMATION CENTRE #2 - CITY OF KAWARTHA LAKES WATER AND WASTEWATER MASTER PLAN UPDATE - Woodville Mancini Holdings
Sydney McIvor CIVIL E.I.T. – WATER LINEAR
From: Robbie Larocque <robbie.larocque@dgbiddle.com> Sent: Tuesday, May 28, 2024 3:38 PM To: Sydney McIvor <sydney.mcivor@tylin.com>; Kevin Brown <kevin.brown@TYLin.com>; nrahman <nrahman@kawarthalakes.ca> Cc: Subject: RE: NOTICE OF PUBLIC INFORMATION CENTRE #2 - CITY OF KAWARTHA LAKES WATER AND WASTEWATER MASTER PLAN UPDATE - Woodville Mancini Holdings
Good afternoon, I am writing you at the request of our Client Mr. Dave Mancini. Mr. Mancini has land holdings within three quadrants of the Village of Woodville. As you may be aware, Mr. Mancini is actively developing in the North/west quadrant of the Village of Woodville. Currently we are pursuing a third phase of his Maple Hills Subdivision. Further to the west of the Maple Hills Subdivision Mr. Mancini has holdings which he wishes that you have regard during your master water plan update. Mr. Mancini has other development parcels within the village in the North/east quadrant having frontage on Argyle Street at Union Street and CKL Road 46 (Nappadale Street) as well he has another development parcel, 57M-735, located on within the South/west quadrant of the Village with frontage on CKL Road 9 (King Street). I am asked to remind the team who are preparing the City of Kawartha Lakes Water and Wastewater Master Plan to have appropriate regard for Mr. Mancini’s development parcels in Woodville during your work assignment. Thank you in advance for your inclusion and attention to these development parcels. We look forward to your presentation on June 19, 2024 in Fenelon Falls. Thanks,
ROBBIE LAROCQUE, P. Eng. Senior Consulting Engineer, Partner Civil Group
1
96 King Street East, Oshawa, ON L1H 1B6 905-576-8500 dgbiddle.com
CIVIL | STRUCTURAL | MECHANICAL | ELECTRICAL | PLANNING Please note, staff at D.G. Biddle & Associates Ltd. will respond to messages during their regular working hours as per the Employment Standards Act. PRIVILEGE AND CONFIDENTIALITY NOTICE: As regulated by the Personal Information Protection and Electronic Documents Act, S.C.2000 C5, this electronic transmission, including all attachments, is directed in confidence to the person(s) to which it is addressed, or an authorized recipient, and may not otherwise be distributed, copied, printed, or disclosed. If you have received this electronic transmission in error, please notify the sender immediately by return transmission and then immediately delete this transmission, including all attachments, without copying, printing, distributing, or disclosing same.
From: Sydney McIvor <sydney.mcivor@tylin.com> Sent: Friday, May 24, 2024 10:52 AM To: Robbie Larocque <robbie.larocque@dgbiddle.com> Subject: NOTICE OF PUBLIC INFORMATION CENTRE #2 - CITY OF KAWARTHA LAKES WATER AND WASTEWATER MASTER PLAN UPDATE Dear Stakeholder, T.Y. Lin International Canada Inc. has been retained by the City of Kawartha Lakes to assist in undertaking a Municipal Class Environmental Assessment (EA) with respect to updating the Water and Wastewater Master Plan. Please review the attached file containing details of the Water and Wastewater Master Plan Public Information Centre #2 (PIC) for the City of Kawartha Lakes. If you have any questions, please feel free to contact Project Manager Kevin Brown, as noted in the letter. Thank you,
Sydney McIvor CIVIL E.I.T. – WATER LINEAR T +1 905.738.5700
TYLin
209 Dundas Street East Suite 301 Whitby, ON L1N 7H8, Canada TYLin.com
2
From: Sent: To: Subject:
Attachments:
Sydney McIvor Thursday, June 6, 2024 11:35 AM Charlotte Black FW: NOTICE OF PUBLIC INFORMATION CENTRE #2 - CITY OF KAWARTHA LAKES WATER AND WASTEWATER MASTER PLAN UPDATE - Woodville Mancini Holdings Mancini Phase 2, Woodville - ; 78098-20230516-PRELIMINARY DRAFT PLAN-PHASE 3.pdf
Sydney McIvor CIVIL E.I.T. – WATER LINEAR
From: Nafiur Rahman <nrahman@kawarthalakes.ca> Sent: Thursday, June 6, 2024 11:33 AM To: Kevin Brown <kevin.brown@TYLin.com> Cc: cpurdy <cpurdy@kawarthalakes.ca>; Sydney McIvor <sydney.mcivor@tylin.com>; Walid Abi Akar <walid.abiakar@tylin.com>; Vardhini Parvatham <vardhini.parvatham@tylin.com>; Yuliana Zambrano <Yzambrano@civi.ca> Subject: RE: NOTICE OF PUBLIC INFORMATION CENTRE #2 - CITY OF KAWARTHA LAKES WATER AND WASTEWATER MASTER PLAN UPDATE - Woodville Mancini Holdings
Hi Kevin, Please see attached Mancini Phase-2 (33 units already built but not assumed) and Phase-3 (40 units proposed). All these info are received from our Development Engineering group. Both phases are shown in 2011 GMS map but with higher number of units in total than 2011 GMS (63 units). Thanks Nafiur From: Kevin Brown <kevin.brown@TYLin.com> Sent: Thursday, June 6, 2024 8:25 AM To: Nafiur Rahman <nrahman@kawarthalakes.ca> Cc: Corby Purdy <cpurdy@kawarthalakes.ca>; Sydney McIvor <sydney.mcivor@tylin.com>; Walid Abi Akar <walid.abiakar@tylin.com>; Vardhini Parvatham <vardhini.parvatham@tylin.com>; Yuliana Zambrano <Yzambrano@civi.ca> Subject: RE: NOTICE OF PUBLIC INFORMATION CENTRE #2 - CITY OF KAWARTHA LAKES WATER AND WASTEWATER MASTER PLAN UPDATE - Woodville Mancini Holdings Nafiur:
We can’t process requests by landowners which were not included in the information provided by Planning. We are focussing on the analysis required to support the PIC. If there are additional requests like these, we will have to address them after the PIC, if Planning confirms that they are consistent with the Official Plan and GMS. -Kevin
Kevin Brown, P.Eng. (he, him) SENIOR MUNICIPAL ENGINEER TEAM LEAD - HYDRAULICS AND INFRASTRUCTURE PLANNING M +1 416.843.4689
TYLin
From: Robbie Larocque <robbie.larocque@dgbiddle.com> Sent: Wednesday, June 5, 2024 5:19 PM To: nrahman <nrahman@kawarthalakes.ca>; Sydney McIvor <sydney.mcivor@tylin.com>; Kevin Brown <kevin.brown@TYLin.com> Cc: dave@mancinihomes.ca; cpurdy <cpurdy@kawarthalakes.ca> Subject: RE: NOTICE OF PUBLIC INFORMATION CENTRE #2 - CITY OF KAWARTHA LAKES WATER AND WASTEWATER MASTER PLAN UPDATE - Woodville Mancini Holdings Good afternoon Nafiur, Further to you email I have marked up a copy of the Village of Woodville Zoning Map. Our Client has holdings in three quadrants of the Village as previously informed. The zone noted in GREEN on the plan represents phases 2 and 3 of the Maple Hills Subdivision. Phase 2 is effectively fully built out and we are working with City Planning for Phase 3 at this time. Noted in Red are lands which Mancini Homes Owns to the west of the Village proper. Within the other two quadrants in the Village we have shown Mancini Homes holdings in BLUE. Hoping this is helpful as you work through the servicing options and opportunities for the Village of Woodville. Thanks,
ROBBIE LAROCQUE, P. Eng. Senior Consulting Engineer, Partner Civil Group 96 King Street East, Oshawa, ON L1H 1B6 905-576-8500 dgbiddle.com
CIVIL | STRUCTURAL | MECHANICAL | ELECTRICAL | PLANNING
Charlotte Black From: Sent: To: Subject:
Sydney McIvor Friday, June 7, 2024 8:32 AM Charlotte Black FW: NOTICE OF PUBLIC INFORMATION CENTRE #2 - CITY OF KAWARTHA LAKES WATER AND WASTEWATER MASTER PLAN UPDATE - Woodville Mancini Holdings
Sydney McIvor CIVIL E.I.T. – WATER LINEAR
From: Nafiur Rahman <nrahman@kawarthalakes.ca> Sent: Thursday, June 6, 2024 4:34 PM To: 'Robbie Larocque' <robbie.larocque@dgbiddle.com>; Sydney McIvor <sydney.mcivor@tylin.com>; Kevin Brown <kevin.brown@TYLin.com> Cc: cpurdy <cpurdy@kawarthalakes.ca> Subject: RE: NOTICE OF PUBLIC INFORMATION CENTRE #2 - CITY OF KAWARTHA LAKES WATER AND WASTEWATER MASTER PLAN UPDATE - Woodville Mancini Holdings
There was a presentation on GMS update at May 21 council meeting. You can watch the recording from CKL You Tube channel. Here is the screenshot of the timeline I found from the presentation. However, I suggest to reach out to Planning department for the details of GMS completion timeline.
1
From: Robbie Larocque <robbie.larocque@dgbiddle.com> Sent: Thursday, June 6, 2024 4:24 PM To: Nafiur Rahman <nrahman@kawarthalakes.ca>; Sydney McIvor <sydney.mcivor@tylin.com>; kevin.brown@TYLin.com Cc: Corby Purdy <cpurdy@kawarthalakes.ca> Subject: RE: NOTICE OF PUBLIC INFORMATION CENTRE #2 - CITY OF KAWARTHA LAKES WATER AND WASTEWATER MASTER PLAN UPDATE - Woodville Mancini Holdings Thank you Nafiur, Do you have an understanding when the GMS is scheduled for completion? Thanks,
2
ROBBIE LAROCQUE, P. Eng. Senior Consulting Engineer, Partner Civil Group 96 King Street East, Oshawa, ON L1H 1B6 905-576-8500 dgbiddle.com
CIVIL | STRUCTURAL | MECHANICAL | ELECTRICAL | PLANNING Please note, staff at D.G. Biddle & Associates Ltd. will respond to messages during their regular working hours as per the Employment Standards Act. PRIVILEGE AND CONFIDENTIALITY NOTICE: As regulated by the Personal Information Protection and Electronic Documents Act, S.C.2000 C5, this electronic transmission, including all attachments, is directed in confidence to the person(s) to which it is addressed, or an authorized recipient, and may not otherwise be distributed, copied, printed, or disclosed. If you have received this electronic transmission in error, please notify the sender immediately by return transmission and then immediately delete this transmission, including all attachments, without copying, printing, distributing, or disclosing same.
From: Nafiur Rahman <nrahman@kawarthalakes.ca> Sent: Thursday, June 6, 2024 4:11 PM To: Robbie Larocque <robbie.larocque@dgbiddle.com>; Sydney McIvor <sydney.mcivor@tylin.com>; kevin.brown@TYLin.com Cc: Corby Purdy <cpurdy@kawarthalakes.ca> Subject: RE: NOTICE OF PUBLIC INFORMATION CENTRE #2 - CITY OF KAWARTHA LAKES WATER AND WASTEWATER MASTER PLAN UPDATE - Woodville Mancini Holdings
Hi Robbie, Thank you for the information. As mentioned earlier the new GMS study is currently ongoing. Until the new GMS study is completed the servicing study analysis is primarily based on 2011 GMS. However, I do notice that the Phase-2 and 3 areas were identified in 2011 GMS growth map (see attached). Thanks, Nafiur From: Robbie Larocque <robbie.larocque@dgbiddle.com> Sent: Wednesday, June 5, 2024 5:19 PM To: Nafiur Rahman <nrahman@kawarthalakes.ca>; Sydney McIvor <sydney.mcivor@tylin.com>; kevin.brown@TYLin.com Cc: Corby Purdy <cpurdy@kawarthalakes.ca> Subject: RE: NOTICE OF PUBLIC INFORMATION CENTRE #2 - CITY OF KAWARTHA LAKES WATER AND WASTEWATER MASTER PLAN UPDATE - Woodville Mancini Holdings Good afternoon Nafiur, Further to you email I have marked up a copy of the Village of Woodville Zoning Map. Our Client has holdings in three quadrants of the Village as previously informed. The zone noted in GREEN on the plan represents phases 2 and 3 of the Maple Hills Subdivision. Phase 2 is effectively fully built out and we are working with City Planning for Phase 3 at this time. Noted in Red are lands which Mancini Homes Owns to the west of the Village proper. Within the other two quadrants in the Village we have shown Mancini Homes holdings in BLUE. 3
Hoping this is helpful as you work through the servicing options and opportunities for the Village of Woodville. Thanks,
ROBBIE LAROCQUE, P. Eng. Senior Consulting Engineer, Partner Civil Group 96 King Street East, Oshawa, ON L1H 1B6 905-576-8500 dgbiddle.com
CIVIL | STRUCTURAL | MECHANICAL | ELECTRICAL | PLANNING Please note, staff at D.G. Biddle & Associates Ltd. will respond to messages during their regular working hours as per the Employment Standards Act. PRIVILEGE AND CONFIDENTIALITY NOTICE: As regulated by the Personal Information Protection and Electronic Documents Act, S.C.2000 C5, this electronic transmission, including all attachments, is directed in confidence to the person(s) to which it is addressed, or an authorized recipient, and may not otherwise be distributed, copied, printed, or disclosed. If you have received this electronic transmission in error, please notify the sender immediately by return transmission and then immediately delete this transmission, including all attachments, without copying, printing, distributing, or disclosing same.
From: Nafiur Rahman <nrahman@kawarthalakes.ca> Sent: Wednesday, June 5, 2024 4:21 PM To: Robbie Larocque <robbie.larocque@dgbiddle.com>; Sydney McIvor <sydney.mcivor@tylin.com>; kevin.brown@TYLin.com Cc: Corby Purdy <cpurdy@kawarthalakes.ca> Subject: RE: NOTICE OF PUBLIC INFORMATION CENTRE #2 - CITY OF KAWARTHA LAKES WATER AND WASTEWATER MASTER PLAN UPDATE - Woodville Mancini Holdings
Hi Robbie, For our better understanding please clarify and mark the development details in a map. Thank you. Nafiur Rahman, P.Eng., PMP Supervisor, Environmental Capital Project Management Infrastructure Design and Construction, Engineering and Corporate Assets City of Kawartha Lakes 705-324-9411 ext. 1193 www.kawarthalakes.ca
From: Robbie Larocque <robbie.larocque@dgbiddle.com> Sent: Tuesday, May 28, 2024 3:38 PM To: Sydney McIvor <sydney.mcivor@tylin.com>; kevin.brown@TYLin.com; Nafiur Rahman 4
<nrahman@kawarthalakes.ca> Cc: dave@mancinihomes.ca Subject: RE: NOTICE OF PUBLIC INFORMATION CENTRE #2 - CITY OF KAWARTHA LAKES WATER AND WASTEWATER MASTER PLAN UPDATE - Woodville Mancini Holdings
Good afternoon, I am writing you at the request of our Client Mr. Dave Mancini. Mr. Mancini has land holdings within three quadrants of the Village of Woodville. As you may be aware, Mr. Mancini is actively developing in the North/west quadrant of the Village of Woodville. Currently we are pursuing a third phase of his Maple Hills Subdivision. Further to the west of the Maple Hills Subdivision Mr. Mancini has holdings which he wishes that you have regard during your master water plan update. Mr. Mancini has other development parcels within the village in the North/east quadrant having frontage on Argyle Street at Union Street and CKL Road 46 (Nappadale Street) as well he has another development parcel, 57M-735, located on within the South/west quadrant of the Village with frontage on CKL Road 9 (King Street). I am asked to remind the team who are preparing the City of Kawartha Lakes Water and Wastewater Master Plan to have appropriate regard for Mr. Mancini’s development parcels in Woodville during your work assignment. Thank you in advance for your inclusion and attention to these development parcels. We look forward to your presentation on June 19, 2024 in Fenelon Falls. Thanks,
ROBBIE LAROCQUE, P. Eng. Senior Consulting Engineer, Partner Civil Group 96 King Street East, Oshawa, ON L1H 1B6 905-576-8500 dgbiddle.com
CIVIL | STRUCTURAL | MECHANICAL | ELECTRICAL | PLANNING Please note, staff at D.G. Biddle & Associates Ltd. will respond to messages during their regular working hours as per the Employment Standards Act. PRIVILEGE AND CONFIDENTIALITY NOTICE: As regulated by the Personal Information Protection and Electronic Documents Act, S.C.2000 C5, this electronic transmission, including all attachments, is directed in confidence to the person(s) to which it is addressed, or an authorized recipient, and may not otherwise be distributed, copied, printed, or disclosed. If you have received this electronic transmission in error, please notify the sender immediately by return transmission and then immediately delete this transmission, including all attachments, without copying, printing, distributing, or disclosing same.
From: Sydney McIvor <sydney.mcivor@tylin.com> Sent: Friday, May 24, 2024 10:52 AM To: Robbie Larocque <robbie.larocque@dgbiddle.com> Subject: NOTICE OF PUBLIC INFORMATION CENTRE #2 - CITY OF KAWARTHA LAKES WATER AND WASTEWATER MASTER PLAN UPDATE Dear Stakeholder, T.Y. Lin International Canada Inc. has been retained by the City of Kawartha Lakes to assist in undertaking a Municipal Class Environmental Assessment (EA) with respect to updating the Water and Wastewater Master Plan. 5
Please review the attached file containing details of the Water and Wastewater Master Plan Public Information Centre #2 (PIC) for the City of Kawartha Lakes. If you have any questions, please feel free to contact Project Manager Kevin Brown, as noted in the letter. Thank you,
Sydney McIvor CIVIL E.I.T. – WATER LINEAR T +1 905.738.5700
TYLin
209 Dundas Street East Suite 301 Whitby, ON L1N 7H8, Canada TYLin.com
This message, including any attachments, is privileged and intended only for the addressee(s) named above. If you are not the intended recipient, you must not read, use or disseminate the information contained in this e-mail. If you have received this e-mail in error, please notify the sender immediately by telephone, fax, or e-mail and shred this confidential e-mail, including any attachments, without making a copy. Access to this e-mail by anyone else is unauthorized. This message, including any attachments, is privileged and intended only for the addressee(s) named above. If you are not the intended recipient, you must not read, use or disseminate the information contained in this e-mail. If you have received this e-mail in error, please notify the sender immediately by telephone, fax, or e-mail and shred this confidential e-mail, including any attachments, without making a copy. Access to this e-mail by anyone else is unauthorized. This message, including any attachments, is privileged and intended only for the addressee(s) named above. If you are not the intended recipient, you must not read, use or disseminate the information contained in this e-mail. If you have received this e-mail in error, please notify the sender immediately by telephone, fax, or e-mail and shred this confidential e-mail, including any attachments, without making a copy. Access to this e-mail by anyone else is unauthorized.
6
Charlotte Black From: Sent: To: Subject: Attachments:
Sydney McIvor Thursday, May 30, 2024 12:07 PM Charlotte Black FW: Woodville Mancini Holdings 78098-20230516-PRELIMINARY DRAFT PLAN-PHASE 3.pdf
Sydney McIvor CIVIL E.I.T. – WATER LINEAR
From: Nafiur Rahman <nrahman@kawarthalakes.ca> Sent: Thursday, May 30, 2024 11:56 AM To: Kevin Brown <kevin.brown@tylin.com>; Sydney McIvor <sydney.mcivor@tylin.com> Subject: FW: Woodville Mancini Holdings
FYI – see email chain below (internal discussion) From: Roberta Perdue <rperdue@kawarthalakes.ca> Sent: Wednesday, May 29, 2024 9:31 AM To: Nafiur Rahman <nrahman@kawarthalakes.ca>; Leah Barrie <lbarrie@kawarthalakes.ca> Cc: Corby Purdy <cpurdy@kawarthalakes.ca>; Christina Sisson <csisson@kawarthalakes.ca>; Juan Rojas <jrojas@kawarthalakes.ca>; John Connolly <jconnolly@kawarthalakes.ca> Subject: RE: Woodville Mancini Holdings
It was a quick sketch, as noted in my comments, Mancini Phase 3 was proposed by DGB to be generally the area within the settlement boundary and adjacent to Phase 2. From: Nafiur Rahman <nrahman@kawarthalakes.ca> Sent: Wednesday, May 29, 2024 9:28 AM To: Roberta Perdue <rperdue@kawarthalakes.ca>; Leah Barrie <lbarrie@kawarthalakes.ca> 1
Cc: Corby Purdy <cpurdy@kawarthalakes.ca>; Christina Sisson <csisson@kawarthalakes.ca>; Juan Rojas <jrojas@kawarthalakes.ca>; John Connolly <jconnolly@kawarthalakes.ca> Subject: Woodville Mancini Holdings
Hi Roberta, Thanks for the information. It seems that the entire area you marked in red for Mancini Phase 3 is not within the settlement area. See below.
Leah – In regard to the email below from Robbie (DGB) please clarify the details of Mancini’s developments in Woodville. We would like to get the information from Planning rather than external sources. Thanks Nafiur From: Roberta Perdue <rperdue@kawarthalakes.ca> Sent: Tuesday, May 28, 2024 5:01 PM To: Nafiur Rahman <nrahman@kawarthalakes.ca> Cc: Christina Sisson <csisson@kawarthalakes.ca>; Corby Purdy <cpurdy@kawarthalakes.ca>; Juan Rojas <jrojas@kawarthalakes.ca> 2
Subject: RE: NOTICE OF PUBLIC INFORMATION CENTRE #2 - CITY OF KAWARTHA LAKES WATER AND WASTEWATER MASTER PLAN UPDATE - Woodville Mancini Holdings
Hi NafiurFrom looking a ownership on the viewer, this is what I can provide. I can’t confirm the status of Draft Plan Approvals, but I know Mancini Phase 3 was proposed by DGB to be generally the area within the settlement boundary and adjacent to Phase 2. I would ask DGB to provide you with a figure/map to confirm their understanding of locations and residential unit numbers.
From: Nafiur Rahman <nrahman@kawarthalakes.ca> Sent: Tuesday, May 28, 2024 4:27 PM 3
To: Roberta Perdue <rperdue@kawarthalakes.ca> Cc: Christina Sisson <csisson@kawarthalakes.ca>; Corby Purdy <cpurdy@kawarthalakes.ca>; Juan Rojas <jrojas@kawarthalakes.ca> Subject: FW: NOTICE OF PUBLIC INFORMATION CENTRE #2 - CITY OF KAWARTHA LAKES WATER AND WASTEWATER MASTER PLAN UPDATE - Woodville Mancini Holdings
Hi Roberta, As per email below can you please mark the following developments that Robbie mentioned if included in the 2011 GMS map for Woodville? We don’t have any new information based on the current GMS study. So our servicing study analysis is based on 2011 GMS info. Thanks Nafiur From: Robbie Larocque <robbie.larocque@dgbiddle.com> Sent: Tuesday, May 28, 2024 3:38 PM To: Sydney McIvor <sydney.mcivor@tylin.com>; kevin.brown@TYLin.com; Nafiur Rahman <nrahman@kawarthalakes.ca> Cc: Subject: RE: NOTICE OF PUBLIC INFORMATION CENTRE #2 - CITY OF KAWARTHA LAKES WATER AND WASTEWATER MASTER PLAN UPDATE - Woodville Mancini Holdings
Good afternoon, I am writing you at the request of our Client Mr. Dave Mancini. Mr. Mancini has land holdings within three quadrants of the Village of Woodville. As you may be aware, Mr. Mancini is actively developing in the North/west quadrant of the Village of Woodville. Currently we are pursuing a third phase of his Maple Hills Subdivision. Further to the west of the Maple Hills Subdivision Mr. Mancini has holdings which he wishes that you have regard during your master water plan update. Mr. Mancini has other development parcels within the village in the North/east quadrant having frontage on Argyle Street at Union Street and CKL Road 46 (Nappadale Street) as well he has another development parcel, 57M-735, located on within the South/west quadrant of the Village with frontage on CKL Road 9 (King Street). I am asked to remind the team who are preparing the City of Kawartha Lakes Water and Wastewater Master Plan to have appropriate regard for Mr. Mancini’s development parcels in Woodville during your work assignment. Thank you in advance for your inclusion and attention to these development parcels. We look forward to your presentation on June 19, 2024 in Fenelon Falls. 4
Thanks,
ROBBIE LAROCQUE, P. Eng. Senior Consulting Engineer, Partner Civil Group 96 King Street East, Oshawa, ON L1H 1B6 905-576-8500 dgbiddle.com
CIVIL | STRUCTURAL | MECHANICAL | ELECTRICAL | PLANNING Please note, staff at D.G. Biddle & Associates Ltd. will respond to messages during their regular working hours as per the Employment Standards Act. PRIVILEGE AND CONFIDENTIALITY NOTICE: As regulated by the Personal Information Protection and Electronic Documents Act, S.C.2000 C5, this electronic transmission, including all attachments, is directed in confidence to the person(s) to which it is addressed, or an authorized recipient, and may not otherwise be distributed, copied, printed, or disclosed. If you have received this electronic transmission in error, please notify the sender immediately by return transmission and then immediately delete this transmission, including all attachments, without copying, printing, distributing, or disclosing same.
From: Sydney McIvor <sydney.mcivor@tylin.com> Sent: Friday, May 24, 2024 10:52 AM To: Robbie Larocque <robbie.larocque@dgbiddle.com> Subject: NOTICE OF PUBLIC INFORMATION CENTRE #2 - CITY OF KAWARTHA LAKES WATER AND WASTEWATER MASTER PLAN UPDATE Dear Stakeholder, T.Y. Lin International Canada Inc. has been retained by the City of Kawartha Lakes to assist in undertaking a Municipal Class Environmental Assessment (EA) with respect to updating the Water and Wastewater Master Plan. Please review the attached file containing details of the Water and Wastewater Master Plan Public Information Centre #2 (PIC) for the City of Kawartha Lakes. If you have any questions, please feel free to contact Project Manager Kevin Brown, as noted in the letter. Thank you,
Sydney McIvor CIVIL E.I.T. – WATER LINEAR T +1 905.738.5700
TYLin
209 Dundas Street East Suite 301 Whitby, ON L1N 7H8, Canada 5
TYLin.com
This message, including any attachments, is privileged and intended only for the addressee(s) named above. If you are not the intended recipient, you must not read, use or disseminate the information contained in this e-mail. If you have received this e-mail in error, please notify the sender immediately by telephone, fax, or e-mail and shred this confidential e-mail, including any attachments, without making a copy. Access to this e-mail by anyone else is unauthorized.
6
Charlotte Black From: Sent: To: Subject: Attachments:
Sydney McIvor Thursday, May 30, 2024 8:43 AM Charlotte Black FW: MCM Follow-Up: NOTICE OF PUBLIC INFORMATION CENTRE #2 - CITY OF KAWARTHA LAKES WATER AND WASTEWATER MASTER PLAN UPDATE 2024 05 24 - 10 - LTR Notice of PIC 2.pdf; MCM Comments: NOTICE OF PUBLIC INFORMATION CENTRE #1 - CITY OF KAWARTHA LAKES WATER AND WASTEWATER MASTER PLAN UPDATE
Sydney McIvor CIVIL E.I.T. – WATER LINEAR
From: Barboza, Karla (She/Her) (MCM) <Karla.Barboza@ontario.ca> Sent: Monday, May 27, 2024 10:54 AM To: Sydney McIvor <sydney.mcivor@tylin.com> Cc: Minkin, Dan (MCM) <Dan.Minkin@ontario.ca>; Kevin Brown <kevin.brown@tylin.com>; nrahman <nrahman@kawarthalakes.ca>; EA Notices to ERegion (MECP) <eanotification.eregion@ontario.ca> Subject: MCM Follow-Up: NOTICE OF PUBLIC INFORMATION CENTRE #2 - CITY OF KAWARTHA LAKES WATER AND WASTEWATER MASTER PLAN UPDATE
Hi Sydney, Thanks for sending the Notice of PIC #2 for the above note project to the Ministry of Citizenship and Multiculturalism (MCM) – MCM File 0020031. Could you please advise the status of the technical cultural heritage studies for the Schedule B undertaking(s)? I attached our initial letter. Looking forward to hearing from you. Thank in advance, Karla Karla Barboza, MCIP, RPP, CAHP (she/her) Team Lead, Heritage | Heritage Branch | Citizenship, Inclusion and Heritage Division Ministry of Citizenship and Multiculturalism | Ontario Public Service 416-660-1027 | karla.barboza@ontario.ca
Taking pride in strengthening Ontario, its places and its people
1
From: Sydney McIvor <sydney.mcivor@tylin.com> Sent: Friday, May 24, 2024 10:01 AM To: Barboza, Karla (She/Her) (MCM) <Karla.Barboza@ontario.ca> Subject: NOTICE OF PUBLIC INFORMATION CENTRE #2 - CITY OF KAWARTHA LAKES WATER AND WASTEWATER MASTER PLAN UPDATE CAUTION -- EXTERNAL E-MAIL - Do not click links or open attachments unless you recognize the sender. Dear Stakeholder, T.Y. Lin International Canada Inc. has been retained by the City of Kawartha Lakes to assist in undertaking a Municipal Class Environmental Assessment (EA) with respect to updating the Water and Wastewater Master Plan. Please review the attached file containing details of the Water and Wastewater Master Plan Public Information Centre #2 (PIC) for the City of Kawartha Lakes. If you have any questions, please feel free to contact Project Manager Kevin Brown, as noted in the letter. Thank you,
Sydney McIvor CIVIL E.I.T. – WATER LINEAR T +1 905.738.5700
TYLin
209 Dundas Street East Suite 301 Whitby, ON L1N 7H8, Canada TYLin.com
2
Charlotte Black From: Sent: To: Subject:
Sydney McIvor Tuesday, June 4, 2024 8:48 AM Charlotte Black FW: MCM Follow-Up: NOTICE OF PUBLIC INFORMATION CENTRE #2 - CITY OF KAWARTHA LAKES WATER AND WASTEWATER MASTER PLAN UPDATE
Response to Barboza communications.
Sydney McIvor CIVIL E.I.T. – WATER LINEAR
From: Kevin Brown <kevin.brown@tylin.com> Sent: Tuesday, June 4, 2024 8:41 AM To: Barboza, Karla (She/Her) (MCM) <Karla.Barboza@ontario.ca> Cc: Minkin, Dan (MCM) <Dan.Minkin@ontario.ca>; nrahman <nrahman@kawarthalakes.ca>; EA Notices to ERegion (MECP) <eanotification.eregion@ontario.ca>; Sydney McIvor <sydney.mcivor@tylin.com> Subject: RE: MCM Follow-Up: NOTICE OF PUBLIC INFORMATION CENTRE #2 - CITY OF KAWARTHA LAKES WATER AND WASTEWATER MASTER PLAN UPDATE Good morning, Karla. We are still completing our assessment and have not – as of yet – confirmed the Schedule B projects which will be required. We will be identifying these in the coming week, as we complete the technical analysis. Once we know where they will be located, we will initiate a more targeted Cultural Heritage assessment. Regards, -Kevin
Kevin Brown, P.Eng. (he, him) SENIOR MUNICIPAL ENGINEER TEAM LEAD - HYDRAULICS AND INFRASTRUCTURE PLANNING M +1 416.843.4689
TYLin
From: Barboza, Karla (She/Her) (MCM) <Karla.Barboza@ontario.ca> Sent: Monday, May 27, 2024 10:54 AM To: Sydney McIvor <sydney.mcivor@tylin.com> Cc: Minkin, Dan (MCM) <Dan.Minkin@ontario.ca>; Kevin Brown <kevin.brown@tylin.com>; nrahman <nrahman@kawarthalakes.ca>; EA Notices to ERegion (MECP) <eanotification.eregion@ontario.ca> Subject: MCM Follow-Up: NOTICE OF PUBLIC INFORMATION CENTRE #2 - CITY OF KAWARTHA LAKES WATER AND WASTEWATER MASTER PLAN UPDATE 1
Hi Sydney, Thanks for sending the Notice of PIC #2 for the above note project to the Ministry of Citizenship and Multiculturalism (MCM) – MCM File 0020031. Could you please advise the status of the technical cultural heritage studies for the Schedule B undertaking(s)? I attached our initial letter. Looking forward to hearing from you. Thank in advance, Karla Karla Barboza, MCIP, RPP, CAHP (she/her) Team Lead, Heritage | Heritage Branch | Citizenship, Inclusion and Heritage Division Ministry of Citizenship and Multiculturalism | Ontario Public Service 416-660-1027 | karla.barboza@ontario.ca
Taking pride in strengthening Ontario, its places and its people
From: Sydney McIvor <sydney.mcivor@tylin.com> Sent: Friday, May 24, 2024 10:01 AM To: Barboza, Karla (She/Her) (MCM) <Karla.Barboza@ontario.ca> Subject: NOTICE OF PUBLIC INFORMATION CENTRE #2 - CITY OF KAWARTHA LAKES WATER AND WASTEWATER MASTER PLAN UPDATE CAUTION -- EXTERNAL E-MAIL - Do not click links or open attachments unless you recognize the sender. Dear Stakeholder, T.Y. Lin International Canada Inc. has been retained by the City of Kawartha Lakes to assist in undertaking a Municipal Class Environmental Assessment (EA) with respect to updating the Water and Wastewater Master Plan. Please review the attached file containing details of the Water and Wastewater Master Plan Public Information Centre #2 (PIC) for the City of Kawartha Lakes. If you have any questions, please feel free to contact Project Manager Kevin Brown, as noted in the letter. Thank you,
Sydney McIvor CIVIL E.I.T. – WATER LINEAR T +1 905.738.5700
TYLin
209 Dundas Street East Suite 301 Whitby, ON L1N 7H8, Canada TYLin.com
2
3
Charlotte Black From: Sent: To: Subject:
Sydney McIvor Friday, May 31, 2024 10:24 AM Charlotte Black FW: NOTICE OF PUBLIC INFORMATION CENTRE #2 - CITY OF KAWARTHA LAKES WATER AND WASTEWATER MASTER PLAN UPDATE
Sydney McIvor CIVIL E.I.T. – WATER LINEAR
From: Nafiur Rahman <nrahman@kawarthalakes.ca> Sent: Friday, May 31, 2024 10:23 AM To: >; 'Eric Brathwaite' <ebrathwaite@mhbcplan.com> Cc: Kevin Brown <Kevin.Brown@TYLin.com>; 'Eldon Theodore' <etheodore@mhbcplan.com>; Sydney McIvor <sydney.mcivor@tylin.com> Subject: RE: NOTICE OF PUBLIC INFORMATION CENTRE #2 - CITY OF KAWARTHA LAKES WATER AND WASTEWATER MASTER PLAN UPDATE
Good morning Saad, No prior registration is required. The zoom meeting link is available at the website. For your reference, here is the meeting link details. To Join by Zoom: https://kawarthalakes.zoom.us/j/87902516924?pwd=ZJBRNDfDUcO1saMaLdavhaUIxYI1xd.1 Meeting ID: 879 0251 6924 Passcode: 685464 Join Zoom by Telephone: +1 647 374 4685 Canada +1 647 558 0588 Canada
Thanks Nafiur From: > Sent: Friday, May 31, 2024 10:11 AM To: 'Eric Brathwaite' <ebrathwaite@mhbcplan.com>; Nafiur Rahman <nrahman@kawarthalakes.ca> Cc: Kevin.Brown@TYLin.com; 'Eldon Theodore' <etheodore@mhbcplan.com> Subject: RE: NOTICE OF PUBLIC INFORMATION CENTRE #2 - CITY OF KAWARTHA LAKES WATER AND WASTEWATER MASTER PLAN UPDATE Good Afternoon, 1
Please let us know at your earliest convenience.
Saad Tabani Three Lakes Development Inc. 289-724-0892 From: Eric Brathwaite <ebrathwaite@mhbcplan.com> Sent: Monday, May 27, 2024 5:05 PM To: nrahman@kawarthalakes.ca Cc: Kevin.Brown@TYLin.com; Eldon Theodore <etheodore@mhbcplan.com>; Subject: NOTICE OF PUBLIC INFORMATION CENTRE #2 - CITY OF KAWARTHA LAKES WATER AND WASTEWATER MASTER PLAN UPDATE Hello Nafiur, Is there a registration process to be added to the Zoom Link for the June 20th meeting? If so please advise so that we may register and attend the information session.
Thanks, ERIC BRATHWAITE, BA, CPT | Senior Planner
MHBC Planning, Urban Design & Landscape Architecture 7050 Weston Road, Suite 230 | Woodbridge | ON | L4L 8G7 | T 905 761 5588 | C 416 807 2324 | F 905 761 5589 | ebrathwaite@mhbcplan.com
Follow us: Webpage | Linkedin | Facebook | X | Vimeo | Instagram
This communication is intended solely for the named addressee(s) and may contain information that is privileged, confidential, protected or otherwise exempt from disclosure. No waiver of confidence, privilege, protection or otherwise is made. If you are not the intended recipient of this communication, please advise us immediately and delete this email without reading, copying or forwarding it to anyone. This message, including any attachments, is privileged and intended only for the addressee(s) named above. If you are not the intended recipient, you must not read, use or disseminate the information contained in this e-mail. If you have received this e-mail in error, please notify the sender immediately by telephone, fax, or e-mail and shred this confidential e-mail, including any attachments, without making a copy. Access to this e-mail by anyone else is unauthorized.
2
Charlotte Black From: Sent: To: Subject:
Sydney McIvor Friday, May 31, 2024 10:24 AM Charlotte Black FW: NOTICE OF PUBLIC INFORMATION CENTRE #2 - CITY OF KAWARTHA LAKES WATER AND WASTEWATER MASTER PLAN UPDATE
Sydney McIvor CIVIL E.I.T. – WATER LINEAR
From: Nafiur Rahman <nrahman@kawarthalakes.ca> Sent: Friday, May 31, 2024 10:23 AM To: >; 'Eric Brathwaite' <ebrathwaite@mhbcplan.com> Cc: Kevin Brown <Kevin.Brown@TYLin.com>; 'Eldon Theodore' <etheodore@mhbcplan.com>; Sydney McIvor <sydney.mcivor@tylin.com> Subject: RE: NOTICE OF PUBLIC INFORMATION CENTRE #2 - CITY OF KAWARTHA LAKES WATER AND WASTEWATER MASTER PLAN UPDATE
Good morning Saad, No prior registration is required. The zoom meeting link is available at the website. For your reference, here is the meeting link details. To Join by Zoom: https://kawarthalakes.zoom.us/j/87902516924?pwd=ZJBRNDfDUcO1saMaLdavhaUIxYI1xd.1 Meeting ID: 879 0251 6924 Passcode: 685464 Join Zoom by Telephone: +1 647 374 4685 Canada +1 647 558 0588 Canada
Thanks Nafiur From: saad@3lakes.ca <saad@3lakes.ca> Sent: Friday, May 31, 2024 10:11 AM To: 'Eric Brathwaite' <ebrathwaite@mhbcplan.com>; Nafiur Rahman <nrahman@kawarthalakes.ca> Cc: Kevin.Brown@TYLin.com; 'Eldon Theodore' <etheodore@mhbcplan.com> Subject: RE: NOTICE OF PUBLIC INFORMATION CENTRE #2 - CITY OF KAWARTHA LAKES WATER AND WASTEWATER MASTER PLAN UPDATE Good Afternoon, 1
Please let us know at your earliest convenience.
Saad Tabani Three Lakes Development Inc. 289-724-0892 From: Eric Brathwaite <ebrathwaite@mhbcplan.com> Sent: Monday, May 27, 2024 5:05 PM To: nrahman@kawarthalakes.ca Cc: Kevin.Brown@TYLin.com; Eldon Theodore <etheodore@mhbcplan.com>; Subject: NOTICE OF PUBLIC INFORMATION CENTRE #2 - CITY OF KAWARTHA LAKES WATER AND WASTEWATER MASTER PLAN UPDATE Hello Nafiur, Is there a registration process to be added to the Zoom Link for the June 20th meeting? If so please advise so that we may register and attend the information session.
Thanks, ERIC BRATHWAITE, BA, CPT | Senior Planner
MHBC Planning, Urban Design & Landscape Architecture 7050 Weston Road, Suite 230 | Woodbridge | ON | L4L 8G7 | T 905 761 5588 | C 416 807 2324 | F 905 761 5589 | ebrathwaite@mhbcplan.com
Follow us: Webpage | Linkedin | Facebook | X | Vimeo | Instagram
This communication is intended solely for the named addressee(s) and may contain information that is privileged, confidential, protected or otherwise exempt from disclosure. No waiver of confidence, privilege, protection or otherwise is made. If you are not the intended recipient of this communication, please advise us immediately and delete this email without reading, copying or forwarding it to anyone. This message, including any attachments, is privileged and intended only for the addressee(s) named above. If you are not the intended recipient, you must not read, use or disseminate the information contained in this e-mail. If you have received this e-mail in error, please notify the sender immediately by telephone, fax, or e-mail and shred this confidential e-mail, including any attachments, without making a copy. Access to this e-mail by anyone else is unauthorized.
2
Charlotte Black From: Sent: To: Subject:
Sydney McIvor Monday, June 3, 2024 2:56 PM Charlotte Black FW: NOTICE OF PUBLIC INFORMATION CENTRE #2 - CITY OF KAWARTHA LAKES WATER AND WASTEWATER MASTER PLAN UPDATE
Sydney McIvor CIVIL E.I.T. – WATER LINEAR
From: TPUCC DRAWINGS <TPUCCDrawings@hydroone.com> Sent: Monday, June 3, 2024 2:02 PM To: Sydney McIvor <sydney.mcivor@tylin.com> Cc: TPUCC DRAWINGS <TPUCCDrawings@hydroone.com> Subject: RE: NOTICE OF PUBLIC INFORMATION CENTRE #2 - CITY OF KAWARTHA LAKES WATER AND WASTEWATER MASTER PLAN UPDATE Hello, Hydro One does not have any comments. Thank you,
Best Regards, PUCC Markup - Hydro One Networks Inc. tpumarkup@hydroone.com
https://www.on1call.com/
1
From: Sydney McIvor <sydney.mcivor@tylin.com> Sent: Friday, May 24, 2024 9:08 AM To: TPUCC DRAWINGS <TPUCCDrawings@hydroone.com>; SECONDARY LAND USE Department <Department.SecondaryLandUse@hydroone.com> Subject: NOTICE OF PUBLIC INFORMATION CENTRE #2 - CITY OF KAWARTHA LAKES WATER AND WASTEWATER MASTER PLAN UPDATE
*** Exercise caution. This is an EXTERNAL email. DO NOT open attachments or click links from unknown senders or unexpected email. *** Dear Stakeholder, T.Y. Lin International Canada Inc. has been retained by the City of Kawartha Lakes to assist in undertaking a Municipal Class Environmental Assessment (EA) with respect to updating the Water and Wastewater Master Plan. Please review the attached file containing details of the Water and Wastewater Master Plan Public Information Centre #2 (PIC) for the City of Kawartha Lakes. If you have any questions, please feel free to contact Project Manager Kevin Brown, as noted in the letter. Thank you,
Sydney McIvor CIVIL E.I.T. – WATER LINEAR T +1 905.738.5700
TYLin
209 Dundas Street East Suite 301 Whitby, ON L1N 7H8, Canada TYLin.com
2
Charlotte Black From: Sent: To: Subject: Attachments:
Sydney McIvor Tuesday, June 4, 2024 9:28 AM Charlotte Black FW: Kawartha Lakes - PIC 2 - Water and Wastewater Servicing MP 2024 05 30 - Notice of PIC 2.pdf
Follow Up Flag: Flag Status:
Follow up Flagged
Sydney McIvor CIVIL E.I.T. – WATER LINEAR
From: Kevin Brown <Kevin.Brown@TYLin.com> Sent: Tuesday, June 4, 2024 9:08 AM To: Sydney McIvor <sydney.mcivor@tylin.com> Cc: nrahman <nrahman@kawarthalakes.ca> Subject: FW: Kawartha Lakes - PIC 2 - Water and Wastewater Servicing MP Syd: Please add Shanna to the Contact List, and send her the updated details regarding the Zoom meeting. -Kevin
Kevin Brown, P.Eng. (he, him) SENIOR MUNICIPAL ENGINEER TEAM LEAD - HYDRAULICS AND INFRASTRUCTURE PLANNING M +1 416.843.4689
TYLin
From: Foreman, Shanna (MTO) <Shanna.Foreman@ontario.ca> Sent: Tuesday, June 4, 2024 8:01 AM To: Kevin Brown <Kevin.Brown@TYLin.com>; nrahman <nrahman@kawarthalakes.ca> Subject: Kawartha Lakes - PIC 2 - Water and Wastewater Servicing MP You don't often get email from shanna.foreman@ontario.ca. Learn why this is important
Morning, Thank you for circulating the PIC notice to the MTO. I am the Senior Project Manager who will be leading the review of Kawartha Lakes Water and Wastewater Master Plan. I am interested in attending the upcoming June 20th PIC via ZOOM. If you could kindly include me in the meeting invite or provide me with the link when it becomes available. 1
We understand that your project is in its earlier stages, however, kindly note the following process updates for obtaining Ministry permits: The Ministry has launched its new Land Development Module for the Highway Corridor Management System (HCMS) to streamline approval processes. Here are some of the available options at your disposal: -
-
Submit a General Inquiry if you have questions or concerns related to your development and Ministry permits (ie. Permit control area, Encroachment, Building & Land-Use, Signs, Entrance permits). A Pre-Consultation request is mandatory for developments before obtaining Ministry permits.
Here is the link to the site: www.hcms.mto.gov.on.ca/ If you have any questions or concerns, please do not hesitate to contact me. Kindest-regards, Shanna Foreman (pronounce here) Senior Project Manager Corridor Management | Operations East Ministry of Transportation | Ontario Public Service 437-991-5387 | shanna.foreman@ontario.ca
Taking pride in strengthening Ontario, its places and its people
2
Charlotte Black From: Sent: To: Subject: Attachments:
Sydney McIvor Tuesday, June 4, 2024 2:02 PM Charlotte Black FW: PUBLIC INFORMATION CENTRE #2 ZOOM LINK - CITY OF KAWARTHA LAKES WATER AND WASTEWATER MASTER PLAN UPDATE 2024 06 04 - 4 - LTR Notice of PIC 2.pdf
Sydney McIvor CIVIL E.I.T. – WATER LINEAR
From: Sydney McIvor Sent: Tuesday, June 4, 2024 2:02 PM To: shanna.foreman@ontario.ca Subject: PUBLIC INFORMATION CENTRE #2 ZOOM LINK - CITY OF KAWARTHA LAKES WATER AND WASTEWATER MASTER PLAN UPDATE Dear Stakeholder, T.Y. Lin International Canada Inc. has been retained by the City of Kawartha Lakes to assist in undertaking a Municipal Class Environmental Assessment (EA) with respect to updating the Water and Wastewater Master Plan. In regards to the notice mailed on May 24th 2024, for the Water and Wastewater Master Plan Public Information Centre #2 (PIC) for the City of Kawartha Lakes, please see the attached zoom link to access the second PIC meeting on Thursday June 20 at 7pm. To Join by Zoom: https://kawarthalakes.zoom.us/j/87902516924?pwd=ZJBRNDfDUcO1saMaLdavhaUIxYI1xd.1 Meeting ID: 879 0251 6924 Passcode: 685464 Join Zoom by Telephone: +1 647 374 4685 Canada +1 647 558 0588 Canada If you have any questions, please feel free to contact Project Manager Kevin Brown, as noted in the previous letter. Thank you,
Sydney McIvor CIVIL E.I.T. – WATER LINEAR T +1 905.738.5700 1
TYLin
209 Dundas Street East Suite 301 Whitby, ON L1N 7H8, Canada TYLin.com
2
Charlotte Black From: Sent: To: Subject:
Sydney McIvor Tuesday, June 4, 2024 2:02 PM Charlotte Black FW: PUBLIC INFORMATION CENTRE #2 ZOOM LINK - CITY OF KAWARTHA LAKES WATER AND WASTEWATER MASTER PLAN UPDATE
Sydney McIvor CIVIL E.I.T. – WATER LINEAR
From: TPUCC DRAWINGS <TPUCCDrawings@hydroone.com> Sent: Tuesday, June 4, 2024 1:43 PM To: Sydney McIvor <sydney.mcivor@tylin.com> Cc: TPUCC DRAWINGS <TPUCCDrawings@hydroone.com> Subject: RE: PUBLIC INFORMATION CENTRE #2 ZOOM LINK - CITY OF KAWARTHA LAKES WATER AND WASTEWATER MASTER PLAN UPDATE Hydro One has no comments From: Sydney McIvor <sydney.mcivor@tylin.com> Sent: Thursday, May 30, 2024 10:45 AM Subject: PUBLIC INFORMATION CENTRE #2 ZOOM LINK - CITY OF KAWARTHA LAKES WATER AND WASTEWATER MASTER PLAN UPDATE
*** Exercise caution. This is an EXTERNAL email. DO NOT open attachments or click links from unknown senders or unexpected email. *** Dear Stakeholder, T.Y. Lin International Canada Inc. has been retained by the City of Kawartha Lakes to assist in undertaking a Municipal Class Environmental Assessment (EA) with respect to updating the Water and Wastewater Master Plan. Regarding the notice mailed on May 24th, 2024, for the Water and Wastewater Master Plan Public Information Centre #2 (PIC) for the City of Kawartha Lakes, please see the attached zoom link to access the second PIC meeting on Thursday June 20 at 7pm. To Join by Zoom: https://kawarthalakes.zoom.us/j/87902516924?pwd=ZJBRNDfDUcO1saMaLdavhaUIxYI1xd.1 Meeting ID: 879 0251 6924 Passcode: 685464 Join Zoom by Telephone: +1 647 374 4685 Canada 1
+1 647 558 0588 Canada If you have any questions, please feel free to contact Project Manager Kevin Brown, as noted in the previous letter. Thank you,
Sydney McIvor CIVIL E.I.T. – WATER LINEAR T +1 905.738.5700
TYLin
209 Dundas Street East Suite 301 Whitby, ON L1N 7H8, Canada TYLin.com
2
Sydney McIvor From: Sent: To: Cc: Subject:
Nafiur Rahman <nrahman@kawarthalakes.ca> Wednesday, June 5, 2024 12:40 PM 'Angela Mariani' Kevin Brown; Sydney McIvor RE: Wellings of Lindsay
Follow Up Flag: Flag Status:
Follow up Flagged
Hi Angela, Please provide the following details to understand the development that you mentioned here. • • • • • •
CKL Planning File Number(s), Site Address, Site Roll Number, Development description – proposed development type (sub div, condo, apartment, etc) # res units, commercial ha? Owner’s Name Applicant’s Name
Thanks. Nafiur Rahman, P.Eng., PMP Supervisor, Environmental Capital Project Management Infrastructure Design and Construction, Engineering and Corporate Assets City of Kawartha Lakes 705-324-9411 ext. 1193 www.kawarthalakes.ca
From: Sent: Monday, June 3, 2024 4:45 PM To: Nafiur Rahman <nrahman@kawarthalakes.ca> Subject: Wellings of Lindsay
Hi Nafiur I just wanted to confirm that we are included in the waste water master plan as we are requesting to rezone the site to residential Thank you for providing the information
1
Angela Angela Mariani, BA,MCIP,RPP Development Planner Image [Satellite Office] 372 Taunton Road E. Unit #L4B Whitby, ON L1R 0H4 (905) 683-1261 Fax: (905) 426-2139 Cell: (416)898-5270 www.nlgliving.com Privileged/Confidential information may be contained in this message. If you are not the addressee indicated in this message (or responsible for delivery of the message to such person), you may not copy or deliver this message to anyone. In such case, you should destroy this message and kindly notify the sender by reply email. This message, including any attachments, is privileged and intended only for the addressee(s) named above. If you are not the intended recipient, you must not read, use or disseminate the information contained in this e-mail. If you have received this e-mail in error, please notify the sender immediately by telephone, fax, or e-mail and shred this confidential e-mail, including any attachments, without making a copy. Access to this e-mail by anyone else is unauthorized.
2
Charlotte Black From: Sent: To: Subject:
Sydney McIvor Wednesday, June 5, 2024 2:28 PM Charlotte Black FW: Wellings of Lindsay
Sydney McIvor CIVIL E.I.T. – WATER LINEAR
From: Nafiur Rahman <nrahman@kawarthalakes.ca> Sent: Wednesday, June 5, 2024 2:24 PM To: 'Angela Mariani' <angela@nlgc.com> Cc: Kevin Brown <kevin.brown@tylin.com>; Sydney McIvor <sydney.mcivor@tylin.com>; George Whittington <gw@nlgc.com> Subject: RE: Wellings of Lindsay
Hi Angela, Thank you for the information. Nafiur From: Angela Mariani <angela@nlgc.com> Sent: Wednesday, June 5, 2024 1:28 PM To: Nafiur Rahman <nrahman@kawarthalakes.ca> Cc: 'Kevin Brown' <kevin.brown@tylin.com>; 'Sydney McIvor' <sydney.mcivor@tylin.com>; George Whittington <gw@nlgc.com> Subject: RE: Wellings of Lindsay Hi Nafiur Attached is the letter from planning for ZBA OPA application • CKL Planning File Number(s), attached • Site Address, 500 Kent st • Site Roll Number, n/a • Development description – proposed development type (sub div, condo, apartment, etc) # res units, commercial ha? Seniors residential development with 76 unit 4 storey building and 51 townhouse units • Owner’s Name the landowner is Choice Applicant’s Name Wellings of Lindsay is the applicant. We have a long term lease with Choice for the development of this site. It is the vacant land next to the grocery store If you require anything further please let me know. Thanks,
1
Angela Angela Mariani, BA,MCIP, RPP Development Planner
[Satellite Office] 372 Taunton Road E. Unit #L4B Whitby, ON L1R 0H4 [Mailing Address] 2962 Carp Road, Carp, ON K0A 1L0 (905) 683-1261 Fax: (613)831-0275 Cell: (416)898-5270 www.nlgc.com Privileged/Confidential information may be contained in this message. If you are not the addressee indicated in this message (or responsible for delivery of the message to such person), you may not copy or deliver this message to anyone. In such case, you should destroy this message and kindly notify the sender by reply email.
From: Nafiur Rahman <nrahman@kawarthalakes.ca> Sent: Wednesday, June 5, 2024 12:40 PM To: Angela Mariani <angela@nlgc.com> Cc: 'Kevin Brown' <kevin.brown@tylin.com>; 'Sydney McIvor' <sydney.mcivor@tylin.com> Subject: RE: Wellings of Lindsay
Hi Angela, Please provide the following details to understand the development that you mentioned here. • • • • • •
CKL Planning File Number(s), Site Address, Site Roll Number, Development description – proposed development type (sub div, condo, apartment, etc) # res units, commercial ha? Owner’s Name Applicant’s Name
Thanks. Nafiur Rahman, P.Eng., PMP Supervisor, Environmental Capital Project Management Infrastructure Design and Construction, Engineering and Corporate Assets City of Kawartha Lakes 705-324-9411 ext. 1193 www.kawarthalakes.ca
From: Angela Mariani <angela@nlgc.com> Sent: Monday, June 3, 2024 4:45 PM 2
To: Nafiur Rahman <nrahman@kawarthalakes.ca> Subject: Wellings of Lindsay
Hi Nafiur I just wanted to confirm that we are included in the waste water master plan as we are requesting to rezone the site to residential Thank you for providing the information
Angela Angela Mariani, BA,MCIP,RPP Development Planner Image [Satellite Office] 372 Taunton Road E. Unit #L4B Whitby, ON L1R 0H4 (905) 683-1261 Fax: (905) 426-2139 Cell: (416)898-5270 www.nlgliving.com Privileged/Confidential information may be contained in this message. If you are not the addressee indicated in this message (or responsible for delivery of the message to such person), you may not copy or deliver this message to anyone. In such case, you should destroy this message and kindly notify the sender by reply email. This message, including any attachments, is privileged and intended only for the addressee(s) named above. If you are not the intended recipient, you must not read, use or disseminate the information contained in this e-mail. If you have received this e-mail in error, please notify the sender immediately by telephone, fax, or e-mail and shred this confidential e-mail, including any attachments, without making a copy. Access to this e-mail by anyone else is unauthorized. This message, including any attachments, is privileged and intended only for the addressee(s) named above. If you are not the intended recipient, you must not read, use or disseminate the information contained in this e-mail. If you have received this e-mail in error, please notify the sender immediately by telephone, fax, or e-mail and shred this confidential e-mail, including any attachments, without making a copy. Access to this e-mail by anyone else is unauthorized.
3
Charlotte Black From: Sent: To: Subject:
Sydney McIvor Monday, June 10, 2024 3:16 PM Charlotte Black FW: PUBLIC INFORMATION CENTRE #2 - CITY OF KAWARTHA LAKES WATER AND WASTEWATER MASTER PLAN UPDATE
Follow Up Flag: Flag Status:
Follow up Flagged
Laforme 1 (Mississauga’s of the Credit First Nation)
Sydney McIvor CIVIL E.I.T. – WATER LINEAR
From: R Stacey Laforme <Stacey.Laforme@mncfn.ca> Sent: Monday, June 10, 2024 1:32 PM To: Sydney McIvor <sydney.mcivor@tylin.com> Subject: Automatic reply: PUBLIC INFORMATION CENTRE #2 - CITY OF KAWARTHA LAKES WATER AND WASTEWATER MASTER PLAN UPDATE Miigwech for your email. Please note, that I have now retired as Gimaa of the Mississaugas of the Credit First Nation and this email will no longer be monitored. Please reach out to Ogimaa-Kwe Claire Sault, at claires@mncfn.ca or via her cell, 905-869-5767. Alternatively, you can connect with our Council Coordinator, Julia Johnson at julia.johnson@mncfn.ca and she will be able to direct your email to the appropriate person. Miigwech, Gimaa R. Stacey Laforme
1
Charlotte Black
Attachments:
Sydney McIvor Monday, June 10, 2024 3:17 PM Charlotte Black FW: PUBLIC INFORMATION CENTRE #2 - CITY OF KAWARTHA LAKES WATER AND WASTEWATER MASTER PLAN UPDATE 2024 06 10 - LTR Notice of PIC 2 - Mississaugas of the Credit First Nation.pdf
Follow Up Flag: Flag Status:
Follow up Flagged
From: Sent: To: Subject:
Laforme Response (Mississauga’s of The Credit First Nation)
Sydney McIvor CIVIL E.I.T. – WATER LINEAR
From: Sydney McIvor Sent: Monday, June 10, 2024 2:57 PM To: claires@mncfn.ca; julia.johnson@mncfn.ca Cc: Emily Turner <eturner@kawarthalakes.ca>; nrahman <nrahman@kawarthalakes.ca>; Kevin Brown <kevin.brown@tylin.com> Subject: PUBLIC INFORMATION CENTRE #2 - CITY OF KAWARTHA LAKES WATER AND WASTEWATER MASTER PLAN UPDATE Good afternoon, T.Y. Lin International Canada Inc. has been retained by the City of Kawartha Lakes to assist in undertaking a Municipal Class Environmental Assessment (EA) with respect to updating the Water and Wastewater Master Plan. Please find attached correspondence related to the Water and Wastewater Master Plan Public Information Centre #2 (PIC) for the City of Kawartha Lakes, and please see the attached zoom link to access the second PIC meeting on Thursday June 20 at 7pm. To Join by Zoom: https://kawarthalakes.zoom.us/j/87902516924?pwd=ZJBRNDfDUcO1saMaLdavhaUIxYI1xd.1 Meeting ID: 879 0251 6924 Passcode: 685464 Join Zoom by Telephone: +1 647 374 4685 Canada +1 647 558 0588 Canada If you have any questions, please feel free to contact Project Manager Kevin Brown, as noted in the attached letter. Thank you, 1
Sydney McIvor CIVIL E.I.T. – WATER LINEAR T +1 905.738.5700
TYLin
209 Dundas Street East Suite 301 Whitby, ON L1N 7H8, Canada TYLin.com
2
Charlotte Black From: Sent: To: Subject:
Sydney McIvor Monday, June 10, 2024 3:18 PM Charlotte Black FW: PUBLIC INFORMATION CENTRE #2 - CITY OF KAWARTHA LAKES WATER AND WASTEWATER MASTER PLAN UPDATE
Follow Up Flag: Flag Status:
Follow up Flagged
Johnson 1 (Mississauga’s of The Credit First Nation)
Sydney McIvor CIVIL E.I.T. – WATER LINEAR
From: Julia Johnson <Julia.Johnson@mncfn.ca> Sent: Monday, June 10, 2024 2:58 PM To: Sydney McIvor <sydney.mcivor@tylin.com> Subject: Automatic reply: PUBLIC INFORMATION CENTRE #2 - CITY OF KAWARTHA LAKES WATER AND WASTEWATER MASTER PLAN UPDATE Aanii, I am on leave from MCFN. Please reach out to Council.Coordinator@mncfn.ca
1
Charlotte Black
Attachments:
Sydney McIvor Monday, June 10, 2024 3:19 PM Charlotte Black FW: PUBLIC INFORMATION CENTRE #2 - CITY OF KAWARTHA LAKES WATER AND WASTEWATER MASTER PLAN UPDATE 2024 06 10 - LTR Notice of PIC 2 - Mississaugas of the Credit First Nation.pdf
Follow Up Flag: Flag Status:
Follow up Flagged
From: Sent: To: Subject:
Johnson Response (Mississauga’s of The Credit First Nation)
Sydney McIvor CIVIL E.I.T. – WATER LINEAR
From: Sydney McIvor Sent: Monday, June 10, 2024 3:02 PM To: Council.Coordinator@mncfn.ca Cc: Emily Turner <eturner@kawarthalakes.ca>; nrahman <nrahman@kawarthalakes.ca>; Kevin Brown <kevin.brown@tylin.com> Subject: PUBLIC INFORMATION CENTRE #2 - CITY OF KAWARTHA LAKES WATER AND WASTEWATER MASTER PLAN UPDATE Good afternoon, T.Y. Lin International Canada Inc. has been retained by the City of Kawartha Lakes to assist in undertaking a Municipal Class Environmental Assessment (EA) with respect to updating the Water and Wastewater Master Plan. Please find attached correspondence related to the Water and Wastewater Master Plan Public Information Centre #2 (PIC) for the City of Kawartha Lakes, and please see the attached zoom link to access the second PIC meeting on Thursday June 20 at 7pm. To Join by Zoom: https://kawarthalakes.zoom.us/j/87902516924?pwd=ZJBRNDfDUcO1saMaLdavhaUIxYI1xd.1 Meeting ID: 879 0251 6924 Passcode: 685464 Join Zoom by Telephone: +1 647 374 4685 Canada +1 647 558 0588 Canada If you have any questions, please feel free to contact Project Manager Kevin Brown, as noted in the attached letter. Thank you, 1
Sydney McIvor CIVIL E.I.T. – WATER LINEAR T +1 905.738.5700
TYLin
209 Dundas Street East Suite 301 Whitby, ON L1N 7H8, Canada TYLin.com
2
Charlotte Black From: Sent: To: Subject:
Sydney McIvor Monday, June 10, 2024 3:20 PM Charlotte Black FW: PUBLIC INFORMATION CENTRE #2 - CITY OF KAWARTHA LAKES WATER AND WASTEWATER MASTER PLAN UPDATE
Follow Up Flag: Flag Status:
Follow up Flagged
FYI from Metis First Nation Ontario (no response required, log communication)
Sydney McIvor CIVIL E.I.T. – WATER LINEAR
From: Consultations <Consultations@metisnation.org> Sent: Monday, June 10, 2024 1:46 PM To: Sydney McIvor <sydney.mcivor@tylin.com> Subject: Automatic reply: PUBLIC INFORMATION CENTRE #2 - CITY OF KAWARTHA LAKES WATER AND WASTEWATER MASTER PLAN UPDATE
This is an automatically generated response from consultations@metisnation.org. Please do no reply to this e-mail address.
The MNO is adjusting standard work practices due to the Covid-19 outbreak and to better enable staff to work remotely. Please note that the MNO’s Lands, Resources and Consultations (LRC) Branch will no longer review hard copy consultation notices mailed to MNO offices. The LRC Branch will review all electronic notices and process them in accordance with our standard operating procedures. All consultation notices must be sent electronically to consultations@metisnation.org.
The Métis Nation of Ontario’s LRC Branch acknowledges your information notice. The MNO reserves the right to request additional information, meetings and consultations in respect of the project should the MNO deem it to be necessary. For additional information pertaining to consulting with Ontario Métis please visit the MNO web site at: https://www.metisnation.org/programs-and-services/lands-resources-
consultations/duty-to-consult/
1
Charlotte Black From: Sent: To: Subject:
Sydney McIvor Monday, June 10, 2024 3:20 PM Charlotte Black FW: PUBLIC INFORMATION CENTRE #2 - CITY OF KAWARTHA LAKES WATER AND WASTEWATER MASTER PLAN UPDATE
Follow Up Flag: Flag Status:
Follow up Flagged
Huron-Wendat 1
Sydney McIvor CIVIL E.I.T. – WATER LINEAR
From: Administration <Administration@wendake.ca> Sent: Monday, June 10, 2024 1:51 PM To: Sydney McIvor <sydney.mcivor@tylin.com> Subject: RE: PUBLIC INFORMATION CENTRE #2 - CITY OF KAWARTHA LAKES WATER AND WASTEWATER MASTER PLAN UPDATE
Le Conseil de la Nation huronne-wendat (CNHW) souhaite vous informer d’une nouvelle façon de procéder pour l’envoi des consultations. Nous vous demandons dorénavant de transmettre toute nouvelle demande à l’adresse courriel suivante : consultations@wendake.ca. Puisque cette adresse devient le point d’entrée unique pour les consultations, nous vous prions également de retirer toute autre adresse courriel du CNHW de vos envois. À la réception d’une nouvelle consultation, celle-ci sera attribuée à un membre de notre équipe qui assurera le suivi du dossier. Vous serez ensuite invités à communiquer directement avec la personne responsable pour le suivi d’un dossier en cours. Nous vous remercions d’avance de votre collaboration.
Kwe, Thank you for your email. Please note that we have updated our way of processing consultations. Any new consultation or project notice must be sent to the following email address: consultations@wendake.ca. We also kindly ask that you remove any other email adress from our organization from your mailing lists.
Tiawenhk, En io’ (merci et bonne journée) 1
NATION HURONNE-WENDAT COMMUNICATIONS Administra on 255, place Chef Michel Laveau Wendake (QC) G0A 4V0 T : 418 843-3767 F :418-843-5390 @ : administra on@wendake.ca
WENDAKE.CA
De : Sydney McIvor <sydney.mcivor@tylin.com> Envoyé : 10 juin 2024 13:49 À : Administration <Administration@wendake.ca> Cc : Emily Turner <eturner@kawarthalakes.ca>; nrahman <nrahman@kawarthalakes.ca>; Kevin Brown <kevin.brown@tylin.com> Objet : PUBLIC INFORMATION CENTRE #2 - CITY OF KAWARTHA LAKES WATER AND WASTEWATER MASTER PLAN UPDATE Good afternoon, T.Y. Lin International Canada Inc. has been retained by the City of Kawartha Lakes to assist in undertaking a Municipal Class Environmental Assessment (EA) with respect to updating the Water and Wastewater Master Plan. Please find attached correspondence related to the Water and Wastewater Master Plan Public Information Centre #2 (PIC) for the City of Kawartha Lakes, and please see the attached zoom link to access the second PIC meeting on Thursday June 20 at 7pm. To Join by Zoom: https://kawarthalakes.zoom.us/j/87902516924?pwd=ZJBRNDfDUcO1saMaLdavhaUIxYI1xd.1 Meeting ID: 879 0251 6924 Passcode: 685464 Join Zoom by Telephone: +1 647 374 4685 Canada +1 647 558 0588 Canada If you have any questions, please feel free to contact Project Manager Kevin Brown, as noted in the attached letter. Thank you, 2
Sydney McIvor CIVIL E.I.T. – WATER LINEAR T +1 905.738.5700
TYLin
209 Dundas Street East Suite 301 Whitby, ON L1N 7H8, Canada TYLin.com
3
Charlotte Black
Attachments:
Sydney McIvor Monday, June 10, 2024 3:21 PM Charlotte Black FW: PUBLIC INFORMATION CENTRE #2 - CITY OF KAWARTHA LAKES WATER AND WASTEWATER MASTER PLAN UPDATE 2024 06 10 - LTR Notice of PIC 2 - Huron-Wendat.pdf
Follow Up Flag: Flag Status:
Follow up Flagged
From: Sent: To: Subject:
Huron Wendat Response
Sydney McIvor CIVIL E.I.T. – WATER LINEAR
From: Sydney McIvor Sent: Monday, June 10, 2024 2:54 PM To: consultations@wendake.ca Cc: Emily Turner <eturner@kawarthalakes.ca>; nrahman <nrahman@kawarthalakes.ca>; Kevin Brown <kevin.brown@tylin.com> Subject: PUBLIC INFORMATION CENTRE #2 - CITY OF KAWARTHA LAKES WATER AND WASTEWATER MASTER PLAN UPDATE Good afternoon, T.Y. Lin International Canada Inc. has been retained by the City of Kawartha Lakes to assist in undertaking a Municipal Class Environmental Assessment (EA) with respect to updating the Water and Wastewater Master Plan. Please find attached correspondence related to the Water and Wastewater Master Plan Public Information Centre #2 (PIC) for the City of Kawartha Lakes, and please see the attached zoom link to access the second PIC meeting on Thursday June 20 at 7pm. To Join by Zoom: https://kawarthalakes.zoom.us/j/87902516924?pwd=ZJBRNDfDUcO1saMaLdavhaUIxYI1xd.1 Meeting ID: 879 0251 6924 Passcode: 685464 Join Zoom by Telephone: +1 647 374 4685 Canada +1 647 558 0588 Canada If you have any questions, please feel free to contact Project Manager Kevin Brown, as noted in the attached letter. Thank you, 1
Sydney McIvor CIVIL E.I.T. – WATER LINEAR T +1 905.738.5700
TYLin
209 Dundas Street East Suite 301 Whitby, ON L1N 7H8, Canada TYLin.com
2
Charlotte Black Sydney McIvor Tuesday, June 11, 2024 11:31 AM Charlotte Black FW: City of Kawartha Lakes Water-Wastewater Master Plan Update: EA Notice Response Screenshot 2024-06-11 111457.png; Screenshot 2024-06-11 111313.png
From: Sent: To: Subject: Attachments:
Sydney McIvor CIVIL E.I.T. – WATER LINEAR
From: Kevin Brown <kevin.brown@TYLin.com> Sent: Tuesday, June 11, 2024 11:29 AM To: Sydney McIvor <sydney.mcivor@tylin.com> Cc: nrahman <nrahman@kawarthalakes.ca> Subject: FW: City of Kawartha Lakes Water-Wastewater Master Plan Update: EA Notice Response Syd: Please file this response. We will have to review the property impacts, and follow-up. -Kevin
Kevin Brown, P.Eng. (he, him) SENIOR MUNICIPAL ENGINEER TEAM LEAD - HYDRAULICS AND INFRASTRUCTURE PLANNING M +1 416.843.4689
TYLin
From: Tse, Kaitlyn (IO) <Kaitlyn.Tse@infrastructureontario.ca> Sent: Tuesday, June 11, 2024 11:21 AM To: Kevin Brown <kevin.brown@TYLin.com>; nrahman <nrahman@kawarthalakes.ca> Cc: Notice Review <NoticeReview@infrastructureontario.ca> Subject: City of Kawartha Lakes Water-Wastewater Master Plan Update: EA Notice Response You don't often get email from kaitlyn.tse@infrastructureontario.ca. Learn why this is important
Good morning, Thank you for sending us the No ce of Commencement for the City of Kawartha Lakes Water-Wastewater Master Plan Update. Based on our ini al scan, it appears that provincial government property may be located on Study Area #10 (Lindsay) on the outline you provided, iden fied by the Pins references in the photos a ached. 1
It is ul mately the proponent’s responsibility to verify if provincial government property is within the study area. Title documents may iden fy owners of provincial government property as any of the following: • • • • • • • • • • • • • • •
His Majesty the King Her Majesty the Queen Hydro One Hydro One Networks Inc. Management Board Secretariat (MBS) Minister of Economic Development, Employment and Infrastructure (MEDEI) Minister of Energy and Infrastructure (MEI) Minister of Government and Consumer Services (MGCS) Minister of Infrastructure (MOI) Minister of Natural Resources and Forestry (MNRF) Minister of Public Infrastructure Renewal (PIR) Minister of Public Works Minister of Transporta on (MTO) Ontario Lands Corpora on (OLC) Ontario Realty Corpora on (ORC)
If provincial government property in the study area is not required for the project, please con nue to consult us as a directly affected stakeholder. However, if government property is required for the project, the proponent should contact us for a more in-depth review of the land requirement, poten al impacts to the government property, and the process for a possible transfer of ownership if deemed appropriate. Addi onally, please remember to send no ces to our dedicated no ce email address: no cereview@infrastructureontario.ca Kind regards, Kaitlyn
Kaitlyn Tse (she, her) Infrastructure Ontario Co-op, Environmental Management kaitlyn.tse@infrastructureontario.ca Phone: +1 365-297-4527 www.infrastructureontario.ca Follow IO at:
This email, including any attachments, is intended for the personal and confidential use of the recipient(s) named above. If you are not the intended recipient of the email, you are hereby notified that any dissemination or copying of this email and/or any attachment files is strictly prohibited. If you have received this e-mail in error, please immediately notify the sender and arrange for the return of any and 2
all copies and the permanent deletion of this message including any attachments, without reading it or making a copy. Thank you.
3
Charlotte Black From: Sent: To: Subject:
Sydney Mcivor Monday, June 24, 2024 8:43 AM Charlotte Black FW: Master Serving Plan
Sydney McIvor CIVIL E.I.T. – WATER LINEAR TYLin -----Original Message----From: Nafiur Rahman <nrahman@kawarthalakes.ca> Sent: Thursday, June 20, 2024 9:11 AM To: Kevin Brown <kevin.brown@tylin.com>; Vardhini Parvatham <vardhini.parvatham@tylin.com>; Sydney Mcivor <sydney.mcivor@tylin.com> Subject: FW: Master Serving Plan FYI - PIC related ques on No. 1 & 2. -----Original Message----From: Wayne Hancock < Sent: Thursday, June 20, 2024 6:53 AM To: Nafiur Rahman <nrahman@kawarthalakes.ca> > Cc: Andy Nitsa Subject: Re: Master Serving Plan
>
Nafiur, Wayne Hancock here. We spoke last night. 1. Could you forward me the slides from the presenta on last night. 2. Could provide the informa on for Janetville. The number on the chart notes only 136 capacity. 3. Could you advise me on the local improvement process to have sanitary sewer extended to 558 County Rd.8 Fenelon. 4. Can you advise who the planning contact for Fenelon Trails Subdivision is. Thanks Wayne Hancock, P.Eng. Sent from my iPhone This message, including any a achments, is privileged and intended only for the addressee(s) named above. If you are not the intended recipient, you must not read, use or disseminate the informa on contained in this e-mail. If you have received this e-mail in error, please no fy the sender immediately by telephone, fax, or e-mail and shred this confiden al e-mail, including any a achments, without making a copy. Access to this e-mail by anyone else is unauthorized.
1
Charlotte Black From: Sent: To: Subject:
Sydney Mcivor Thursday, August 1, 2024 7:45 AM Charlotte Black FW: Master Serving Plan - servicing 558 CKL Rd 8, Fenelon
Follow Up Flag: Flag Status:
Follow up Flagged
Sydney McIvor CIVIL E.I.T. – WATER LINEAR
From: Nafiur Rahman <nrahman@kawarthalakes.ca> Sent: Wednesday, July 31, 2024 4:24 PM To: 'Wayne Hancock' <whancock@cavanmonaghan.net>; Leah Barrie <lbarrie@kawarthalakes.ca>; John Connolly <jconnolly@kawarthalakes.ca> Cc: jrojas <jrojas@kawarthalakes.ca>; Christina Sisson <csisson@kawarthalakes.ca>; Kirk Timms <ktimms@kawarthalakes.ca>; Roberta Perdue <rperdue@kawarthalakes.ca>; Kevin Brown <kevin.brown@tylin.com>; Sydney Mcivor <sydney.mcivor@tylin.com> Subject: RE: Master Serving Plan - servicing 558 CKL Rd 8, Fenelon
Hi Wayne, GMS study is considering Fenelon Falls settlement boundary expansion and rationalization to accommodate the deficit of lands as identified through the land needs assessment. I suggest to reach out to Planning department for further details. Thanks Nafiur From: Wayne Hancock < > Sent: Wednesday, July 31, 2024 11:30 AM To: Nafiur Rahman <nrahman@kawarthalakes.ca> Cc: Juan Rojas <jrojas@kawarthalakes.ca>; Christina Sisson <csisson@kawarthalakes.ca>; Kirk Timms <ktimms@kawarthalakes.ca>; Roberta Perdue <rperdue@kawarthalakes.ca>; 'Kevin Brown' <kevin.brown@tylin.com>; Sydney Mcivor <sydney.mcivor@tylin.com> Subject: RE: Master Serving Plan - servicing 558 CKL Rd 8, Fenelon
Nafiur & Roberta, The property at 558 County Rd. 8 is serviced by municipal water. With this being said, I would expect the Official Plan should take this into account and should plan for wastewater for the area accordingly. Could you advise me on why municipal water would be provided to an area outside of your official plan. Wayne 1
From: Nafiur Rahman <nrahman@kawarthalakes.ca> Sent: July 12, 2024 9:41 AM To: Wayne Hancock < > Cc: Juan Rojas <jrojas@kawarthalakes.ca>; Christina Sisson <csisson@kawarthalakes.ca>; Kirk Timms <ktimms@kawarthalakes.ca>; Roberta Perdue <rperdue@kawarthalakes.ca>; 'Kevin Brown' <kevin.brown@tylin.com>; Sydney Mcivor <sydney.mcivor@tylin.com> Subject: RE: Master Serving Plan - servicing 558 CKL Rd 8, Fenelon
Good morning Wayne, Further to Roberta’s email I would like to inform that as per CKL Official Plan settlement boundary map the property 558 CKL Rd 8 is outside of the Fenelon Falls settlement boundary. Please see attached the settlement boundary map. The servicing study is considering properties within the settlement boundary only plus approved MZOs. Please note that Planning department is currently undertaking Growth Management Strategy (GMS) study which is evaluating land needs assessment and potential boundary expansion analysis for future growth. Please reach out to Planning for further details. Please let me know if you have any questions. Thank you. Nafiur Rahman, P.Eng., PMP Supervisor, Environmental Capital Project Management Infrastructure Design and Construction, Engineering and Corporate Assets City of Kawartha Lakes 705-324-9411 ext. 1193 www.kawarthalakes.ca
From: Roberta Perdue <rperdue@kawarthalakes.ca> Sent: Monday, July 8, 2024 8:43 AM < > To: Cc: Nafiur Rahman <nrahman@kawarthalakes.ca>; Juan Rojas <jrojas@kawarthalakes.ca>; Christina Sisson <csisson@kawarthalakes.ca>; Kirk Timms <ktimms@kawarthalakes.ca> Subject: FW: Master Serving Plan - servicing 558 CKL Rd 8, Fenelon
Good morning Wayne, Thank you for your email. Municipal sanitary sewer main infrastructure is not located in close proximity to the property at 558 CKL Rd 8/121, Fenelon. The City must complete the Master Servicing Study, Municipal EA process, to identify current servicing capacity, constraints and proposed long term water and wastewater servicing strategy for Fenelon Falls. An extension of 2
municipal main sewer on CKL Rd 121 to service and connect additional properties/ developments cannot be endorsed at this time.
Trusting Nafiur and his team can continue to keep you informed of the master servicing study process. Thank you, Roberta Our office is closed to the public. Please note all courier packages and mail must be directed to City Hall, 26 Francis Street, Box 9000, Lindsay, ON, K9V 5R8. Roberta Perdue, C.E.T. (She/Her) Supervisor, Development Engineering Engineering & Corporate Assets Department, City of Kawartha Lakes 322 Kent Street West, Box 9000, Lindsay, ON K9V 5R8 Tel: 705-324-9411 ext. 1154 | Toll Free: 1-888-822-2225 | www.kawarthalakes.ca
From: Wayne Hancock < Sent: Sunday, July 7, 2024 7:02 PM To: Roberta Perdue <rperdue@kawarthalakes.ca> Cc: Juan Rojas <jrojas@kawarthalakes.ca> Subject: FW: Master Serving Plan
>
3
Roberta, We are looking to extend the sanitary sewer to 558 County Road 8 in Fenelon. It was suggested that we might be able to do this through local improvement. Are you the right person to speak to on this or could you direct me to them. Thanks Wayne From: Nafiur Rahman <nrahman@kawarthalakes.ca> Sent: June 28, 2024 9:32 AM To: Wayne Hancock < > Cc: 'Andy Nitsa' < > Subject: RE: Master Serving Plan
Hi Wayne, PIC#2 presentation slides, video and comment forms are now available at the city website. Here is the link. Please scroll down to City-wide section. https://www.kawarthalakes.ca/en/municipal-services/major-projects.aspx Thanks Nafiur From: Nafiur Rahman Sent: Friday, June 21, 2024 3:59 PM To: 'Wayne Hancock' < Cc: Andy Nitsa < Subject: RE: Master Serving Plan
> >
Hi Wayne, Please see response below in red. Thanks Nafiur -----Original Message----From: Wayne Hancock < Sent: Thursday, June 20, 2024 6:53 AM To: Nafiur Rahman <nrahman@kawarthalakes.ca> Cc: Andy Nitsa < > Subject: Re: Master Serving Plan
>
Nafiur, Wayne Hancock here. We spoke last night. 1. Could you forward me the slides from the presentation last night. The presentation slides and video recording are in process for publishing to the city website. I will keep you updated once uploaded. 4
2. Could provide the information for Janetville. The number on the chart notes only 136 capacity. There is no update on smaller systems since the PIC#1. The capacity of smaller systems will be evaluated further considering other plant process limitations and GMS update. 3. Could you advise me on the local improvement process to have sanitary sewer extended to 558 County Rd.8 Fenelon. For municipal service connection please reach out to Roberta Perdue, Email: rperdue@kawarthalakes.ca 4. Can you advise who the planning contact for Fenelon Trails Subdivision is. John Connolly, Email: jconnolly@kawarthalakes.ca; Leah Barrie, Email: lbarrie@kawarthalakes.ca Thanks Wayne Hancock, P.Eng. Sent from my iPhone This message, including any attachments, is privileged and intended only for the addressee(s) named above. If you are not the intended recipient, you must not read, use or disseminate the information contained in this e-mail. If you have received this e-mail in error, please notify the sender immediately by telephone, fax, or e-mail and shred this confidential e-mail, including any attachments, without making a copy. Access to this e-mail by anyone else is unauthorized. This message, including any attachments, is privileged and intended only for the addressee(s) named above. If you are not the intended recipient, you must not read, use or disseminate the information contained in this e-mail. If you have received this e-mail in error, please notify the sender immediately by telephone, fax, or e-mail and shred this confidential e-mail, including any attachments, without making a copy. Access to this e-mail by anyone else is unauthorized. This message, including any attachments, is privileged and intended only for the addressee(s) named above. If you are not the intended recipient, you must not read, use or disseminate the information contained in this e-mail. If you have received this e-mail in error, please notify the sender immediately by telephone, fax, or e-mail and shred this confidential e-mail, including any attachments, without making a copy. Access to this e-mail by anyone else is unauthorized.
5
Charlotte Black From: Sent: To: Subject:
Sydney Mcivor Monday, June 24, 2024 8:43 AM Charlotte Black FW: Question regarding the waste water sewage presentation
Follow Up Flag: Flag Status:
Follow up Flagged
Sydney McIvor CIVIL E.I.T. – WATER LINEAR
From: Nafiur Rahman <nrahman@kawarthalakes.ca> Sent: Thursday, June 20, 2024 9:12 AM To: Kevin Brown <kevin.brown@tylin.com>; Vardhini Parvatham <vardhini.parvatham@tylin.com>; Sydney Mcivor <sydney.mcivor@tylin.com> Subject: FW: Question regarding the waste water sewage presentation
FYI From: .< > Sent: Thursday, June 20, 2024 8:26 AM To: Nafiur Rahman <nrahman@kawarthalakes.ca> Subject: Question regarding the waste water sewage presentation
Good morning Can you please advise me whether the 2 new Condo developments in Fenelon Falls are included in the forecasted Management Stategy? One is called the Moorings on Cameron and the other is called Fenelon Lakes Club. Thanks and have yourself a great day!
This message, including any attachments, is privileged and intended only for the addressee(s) named above. If you are not the intended recipient, you must not read, use or disseminate the information contained in this e-mail. If you have received this e-mail in error, please notify the sender immediately by telephone, fax, or e-mail and shred this confidential e-mail, including any attachments, without making a copy. Access to this e-mail by anyone else is unauthorized.
1
Charlotte Black From: Sent: To: Subject:
Sydney Mcivor Monday, June 24, 2024 8:45 AM Charlotte Black FW: CKWL Water and Wastewater Servicing and Capacity Master Plan- June 20, 2024
Follow Up Flag: Flag Status:
Follow up Flagged
Sydney McIvor CIVIL E.I.T. – WATER LINEAR
From: Nafiur Rahman <nrahman@kawarthalakes.ca> Sent: Friday, June 21, 2024 1:41 PM To: 'Allister Andrews' <aandrews@digram.ca> Cc: Ryan Windle <rwindle@digram.ca>; Kevin Brown <kevin.brown@tylin.com>; Sydney Mcivor <sydney.mcivor@tylin.com> Subject: RE: CKWL Water and Wastewater Servicing and Capacity Master Plan- June 20, 2024
Hi Allister, We are processing the video and PP slides for uploading to the website. I will let you know once those are uploaded. Thanks Nafiur From: Allister Andrews <aandrews@digram.ca> Sent: Friday, June 21, 2024 11:38 AM To: Nafiur Rahman <nrahman@kawarthalakes.ca> Cc: Ryan Windle <rwindle@digram.ca> Subject: CKWL Water and Wastewater Servicing and Capacity Master Plan- June 20, 2024
Good Morning Nafiur, We are wondering if you could kindly provide us with a copy of yesterday's meeting in PowerPoint slides? If you have a copy in video format would be great as well. Thank you. Kind Regards,
Allister Andrews | Land Development Planner 1
A. 327 Renfrew Dr., Suite 201 Markham ON L3R 9S8 E. aandrews@digram.ca P. 905.513.7999 x202
This email and any files transmitted with it are confidential and intended solely for the use of the individual or entity to which they are addressed. If you have received this email in error, please notify the sender. Please note that any views or opinions presented in this email are solely those of the author and do not necessarily represent those of the Company. The Company accepts no liability for any damages caused by any virus transmitted by this email.
Error! Filename not specified.Please do not print this email unless it is absolutely necessary. Every time you don't print an email, you are helping the environment. This message, including any attachments, is privileged and intended only for the addressee(s) named above. If you are not the intended recipient, you must not read, use or disseminate the information contained in this e-mail. If you have received this e-mail in error, please notify the sender immediately by telephone, fax, or e-mail and shred this confidential e-mail, including any attachments, without making a copy. Access to this e-mail by anyone else is unauthorized.
2
Charlotte Black From: Sent: To: Subject:
Sydney Mcivor Monday, June 24, 2024 8:46 AM Charlotte Black FW: Water and Wastewater Servicing and Capacity Master Plan - PIC #2
Follow Up Flag: Flag Status:
Follow up Flagged
Sydney McIvor CIVIL E.I.T. – WATER LINEAR
From: Nafiur Rahman <nrahman@kawarthalakes.ca> Sent: Friday, June 21, 2024 3:07 PM To: 'Morgen Wilson' <mwilson@pearsoneng.com>; Kevin Brown <Kevin.Brown@TYLin.com> Cc: Sydney Mcivor <sydney.mcivor@tylin.com>; Vardhini Parvatham <vardhini.parvatham@tylin.com> Subject: RE: Water and Wastewater Servicing and Capacity Master Plan - PIC #2
Hi Morgen, We are processing the video and PP slides for uploading to the website. I will let you know once those are uploaded. Thanks Nafiur From: Morgen Wilson <mwilson@pearsoneng.com> Sent: Friday, June 21, 2024 2:25 PM To: Nafiur Rahman <nrahman@kawarthalakes.ca>; Kevin.Brown@TYLin.com Subject: Water and Wastewater Servicing and Capacity Master Plan - PIC #2
Good afternoon, I am writing to request the display boards and presentation from PIC #2 for the Water and Wastewater Servicing and Capacity Master Plan. Thank you, Morgen Wilson Administrative Assistant
1
BARRIE HEAD OFFICE
48 Alliance Blvd, Suite B7 Barrie, ON L4M 5K3 P: 705-719-4785 ext. 262 mwilson@pearsoneng.com pearsoneng.com GTA 905-597-5572
OTTAWA 613-416-1232
OWEN SOUND 226-256-7957
This message, including any attachments, is privileged and intended only for the addressee(s) named above. If you are not the intended recipient, you must not read, use or disseminate the information contained in this e-mail. If you have received this e-mail in error, please notify the sender immediately by telephone, fax, or e-mail and shred this confidential e-mail, including any attachments, without making a copy. Access to this e-mail by anyone else is unauthorized.
2
Charlotte Black From: Sent: To: Subject:
Sydney Mcivor Thursday, July 25, 2024 8:46 AM Charlotte Black FW: CKWL Water and Wastewater Servicing and Capacity Master Plan- June 20, 2024
Sydney McIvor CIVIL E.I.T. – WATER LINEAR
From: Nafiur Rahman <nrahman@kawarthalakes.ca> Sent: Wednesday, July 24, 2024 3:42 PM To: 'rwindle@digram.ca' <rwindle@digram.ca>; 'Allister Andrews' <aandrews@digram.ca> Cc: Kevin Brown <kevin.brown@tylin.com>; Sydney Mcivor <sydney.mcivor@tylin.com> Subject: RE: CKWL Water and Wastewater Servicing and Capacity Master Plan- June 20, 2024
Hi Ryan, I acknowledge the receipt of your comment. We will review and consider accordingly. Thanks Nafiur From: rwindle@digram.ca <rwindle@digram.ca> Sent: Wednesday, July 24, 2024 3:33 PM To: Nafiur Rahman <nrahman@kawarthalakes.ca>; 'Allister Andrews' <aandrews@digram.ca> Cc: 'Kevin Brown' <kevin.brown@tylin.com>; 'Sydney Mcivor' <sydney.mcivor@tylin.com> Subject: RE: CKWL Water and Wastewater Servicing and Capacity Master Plan- June 20, 2024 Importance: High Nafiur: Please find attached our comment document … please confirm receipt. I will also insert the same comments in your online form, so we cover all bases. Thanks. Ryan
Ryan Windle MCIP RPP AICP | VP of Land Development A. 327 Renfrew Dr., Suite 201 Markham ON L3R 9S8 E. rwindle@digram.ca P. 905.513.7999 Ext 251
1
Charlotte Black From: Sent: To: Subject:
Sydney Mcivor Friday, June 28, 2024 10:52 AM Charlotte Black FW: CKWL Water and Wastewater Servicing and Capacity Master Plan- June 20, 2024
Sydney McIvor CIVIL E.I.T. – WATER LINEAR
From: rwindle@digram.ca <rwindle@digram.ca> Sent: Friday, June 28, 2024 10:01 AM To: nrahman <nrahman@kawarthalakes.ca>; 'Allister Andrews' <aandrews@digram.ca> Cc: Kevin Brown <kevin.brown@tylin.com>; Sydney Mcivor <sydney.mcivor@tylin.com> Subject: RE: CKWL Water and Wastewater Servicing and Capacity Master Plan- June 20, 2024 Thank you sir. Ryan
Ryan Windle MCIP RPP AICP | VP of Land Development A. 327 Renfrew Dr., Suite 201 Markham ON L3R 9S8 E. rwindle@digram.ca P. 905.513.7999 Ext 251
_______ We are currently experiencing an issue with our phone lines. Be advised that this will affect both incoming and outgoing calls. Our team is working hard to resolve this issue as efficiently as possible. During this time you can continue to reach me through email at rwindle@digram.ca We apologize for any inconvenience this may cause and appreciate your patience in this matter. ________ Thank you, This email and any files transmitted with it are confidential and intended solely for the use of the individual or entity to which they are addressed. If you have received this email in error, please notify the sender. Please note that any views or opinions presented in this email are solely those of the author and do not necessarily represent those of the Company. The Company accepts no liability for any damages caused by any virus transmitted by this email.
Please do not print this email unless it is absolutely necessary. Every time you don't print an email, you are helping the environment.
1
From: Nafiur Rahman <nrahman@kawarthalakes.ca> Sent: Friday, June 28, 2024 9:52 AM To: 'rwindle@digram.ca' <rwindle@digram.ca>; 'Allister Andrews' <aandrews@digram.ca> Cc: 'Kevin Brown' <kevin.brown@tylin.com>; 'Sydney Mcivor' <sydney.mcivor@tylin.com> Subject: RE: CKWL Water and Wastewater Servicing and Capacity Master Plan- June 20, 2024
Hi Ryan, PIC#2 presentation slides, video and comment forms are now available at the city website. Here is the link. Please scroll down to City-wide section. https://www.kawarthalakes.ca/en/municipal-services/major-projects.aspx Thanks Nafiur From: rwindle@digram.ca <rwindle@digram.ca> Sent: Friday, June 21, 2024 5:20 PM To: Nafiur Rahman <nrahman@kawarthalakes.ca>; 'Allister Andrews' <aandrews@digram.ca> Cc: 'Kevin Brown' <kevin.brown@tylin.com>; 'Sydney Mcivor' <sydney.mcivor@tylin.com> Subject: RE: CKWL Water and Wastewater Servicing and Capacity Master Plan- June 20, 2024 Thank again Nafiur. I haven’t brought this up to the owner yet, but would you and Kevin be open to meeting with us separately? We can offer some info and get some clarity on the initial findings. Let me know. Ryan
Ryan Windle MCIP RPP AICP | VP of Land Development A. 327 Renfrew Dr., Suite 201 Markham ON L3R 9S8 E. rwindle@digram.ca P. 905.513.7999 Ext 251
This email and any files transmitted with it are confidential and intended solely for the use of the individual or entity to which they are addressed. If you have received this email in error, please notify the sender. Please note that any views or opinions presented in this email are solely those of the author and do not necessarily represent those of the Company. The Company accepts no liability for any damages caused by any virus transmitted by this email.
Please do not print this email unless it is absolutely necessary. Every time you don't print an email, you are helping the environment.
From: Nafiur Rahman <nrahman@kawarthalakes.ca> Sent: Friday, June 21, 2024 3:13 PM To: 'rwindle@digram.ca' <rwindle@digram.ca>; 'Allister Andrews' <aandrews@digram.ca> Cc: 'Kevin Brown' <kevin.brown@tylin.com>; 'Sydney Mcivor' <sydney.mcivor@tylin.com> Subject: RE: CKWL Water and Wastewater Servicing and Capacity Master Plan- June 20, 2024 2
Hi Ryan, We will post the comment form on the website. However, you can send comments to me and Kevin by email as well. The deadline to submit the comment is July 31st. Thanks Nafiur From: rwindle@digram.ca <rwindle@digram.ca> Sent: Friday, June 21, 2024 2:16 PM To: Nafiur Rahman <nrahman@kawarthalakes.ca>; 'Allister Andrews' <aandrews@digram.ca> Cc: 'Kevin Brown' <kevin.brown@tylin.com>; 'Sydney Mcivor' <sydney.mcivor@tylin.com> Subject: RE: CKWL Water and Wastewater Servicing and Capacity Master Plan- June 20, 2024 Thank Nafiur: On a side note … we do want to submit some comment on the material. Can we simply submit and email to you and Kevin to serve as formal comment? What is the deadline again? Thanks. Ryan
Ryan Windle MCIP RPP AICP | VP of Land Development A. 327 Renfrew Dr., Suite 201 Markham ON L3R 9S8 E. rwindle@digram.ca P. 905.513.7999 Ext 251
This email and any files transmitted with it are confidential and intended solely for the use of the individual or entity to which they are addressed. If you have received this email in error, please notify the sender. Please note that any views or opinions presented in this email are solely those of the author and do not necessarily represent those of the Company. The Company accepts no liability for any damages caused by any virus transmitted by this email.
Please do not print this email unless it is absolutely necessary. Every time you don't print an email, you are helping the environment.
From: Nafiur Rahman <nrahman@kawarthalakes.ca> Sent: Friday, June 21, 2024 1:41 PM To: 'Allister Andrews' <aandrews@digram.ca> Cc: Ryan Windle <rwindle@digram.ca>; 'Kevin Brown' <kevin.brown@tylin.com>; Sydney Mcivor <sydney.mcivor@tylin.com> Subject: RE: CKWL Water and Wastewater Servicing and Capacity Master Plan- June 20, 2024
Hi Allister,
3
We are processing the video and PP slides for uploading to the website. I will let you know once those are uploaded. Thanks Nafiur From: Allister Andrews <aandrews@digram.ca> Sent: Friday, June 21, 2024 11:38 AM To: Nafiur Rahman <nrahman@kawarthalakes.ca> Cc: Ryan Windle <rwindle@digram.ca> Subject: CKWL Water and Wastewater Servicing and Capacity Master Plan- June 20, 2024
Good Morning Nafiur, We are wondering if you could kindly provide us with a copy of yesterday's meeting in PowerPoint slides? If you have a copy in video format would be great as well. Thank you. Kind Regards,
Allister Andrews | Land Development Planner A. 327 Renfrew Dr., Suite 201 Markham ON L3R 9S8 E. aandrews@digram.ca P. 905.513.7999 x202
This email and any files transmitted with it are confidential and intended solely for the use of the individual or entity to which they are addressed. If you have received this email in error, please notify the sender. Please note that any views or opinions presented in this email are solely those of the author and do not necessarily represent those of the Company. The Company accepts no liability for any damages caused by any virus transmitted by this email.
Error! Filename not specified.Please do not print this email unless it is absolutely necessary. Every time you don't print an email, you are helping the environment. This message, including any attachments, is privileged and intended only for the addressee(s) named above. If you are not the intended recipient, you must not read, use or disseminate the information contained in this e-mail. If you have received this e-mail in error, please notify the sender immediately by telephone, fax, or e-mail and shred this confidential e-mail, including any attachments, without making a copy. Access to this e-mail by anyone else is unauthorized. This message, including any attachments, is privileged and intended only for the addressee(s) named above. If you are not the intended recipient, you must not read, use or disseminate the information contained in this e-mail. If you have received this e-mail in error, please notify the sender immediately by telephone, fax, or e-mail and shred this confidential e-mail, including any attachments, without making a copy. Access to this e-mail by anyone else is unauthorized. This message, including any attachments, is privileged and intended only for the addressee(s) named above. If you are not the intended recipient, you must not read, use or disseminate the information contained in this e-mail. If you have received this e-mail in error, please notify the sender immediately by telephone, fax, or e-mail and shred this confidential e-mail, including any attachments, without making a copy. Access to this e-mail by anyone else is unauthorized.
4
July 24, 2024 Nafiur Rahman, P.Eng., PMP Supervisor, Environmental Capital Project Management City of Kawartha Lakes and Kevin Brown, P. Eng. Senior Municipal Project Manager TYLin International Canada RE: Comments - City of Kawartha Lakes Water and Wastewater Servicing and Capacity Master Plan Nafiur/Kevin: In response to the technical memos/reports issued and associated materials presented at Public Information Centre #2, we offer the following comments on the Water and Wastewater Servicing and Capacity Master Plan update as it relates specifically to Fenelon Falls: •
TOR Construction Inc. (TOR) owns approximately 200ha of land in the southeast section of the Town of Fenelon Falls.
•
The northern portion of the TOR lands are the subject of an application for Official Plan Amendment, Zoning By-law Amendment and Draft Plan of Subdivision approval which is currently under review by the City of Kawartha Lakes (CKWL). For reference, please see the attached Draft Plan. For clarity, we note that the TOR Lands are the “Fenelon Trails” lands however the reference to “Fenelon Trails” is a holdover project name from the previous owner. We have not yet assigned a project name to our development application lands. We respectfully request that any future reports, presentations etc. reference us as TOR Construction Limited and our lands be referenced as the “TOR Lands” or “TOR Applications”.
•
The application proposes a mixed-use and mixed density residential neighbourhood including approximately 900 residential units and supportive commercial space.
•
The northern most portion of the TOR lands (18ha +/-) that are the subject of the development applications are located within the existing Fenelon Falls Settlement Area. The balance of the TOR application lands are located within the approved Fenelon Falls Secondary Plan which designates the lands as Residential. Given that the TOR application lands are within an approved Secondary Plan, we inquire as to why was this area not included in the current capacity assessment?
•
The TOR application is supported by a Functional Servicing Report (FSR) completed by GHD Engineering dated September 2023. The findings and conclusions are generally consistent with the preliminary assessment summarized in PIC#2. however, the FSR has concluded that Fenelon Falls has enough water capacity to service TOR’s proposed development and the Fenelon Falls Wastewater Pollution Control Plan has enough capacity to service initial phases of development. Only minor upgrades to existing 327 Renfrew Drive, Suite 201, Markham, Ontario L3R 9S8 905.513.7999
infrastructure would be required to accommodate the proposed development. Has the project team reviewed our FSR as part of the capacity assessment? If not, will it be reviewed and considered in the formulation of the final assessment and ultimately the Master Plan? •
The development of our lands represents the most logical extension of servicing in Fenelon Falls. Will this be considered in the final Master Plan?
•
In Technical Memo 5 (TM5), in the Fenelon Falls section, the forecasted units of population do not appear to factor in our proposed development of approximately 900 units. However, our proposed development was mentioned as a factor being considered in the PIC #2 presentation. Will follow up memos and reports, including the Draft Master Plan be formally updated to factor in our proposed development application considering that the lands are within an approved Secondary Plan and the Draft CKWL Growth Management Strategy (GMS) initial findings have identified the area as a preferred location for rationalization/expansion of the Fenelon Falls Settlement Area and future development?
•
Understanding the time required to complete the assessment and Master Plan and associated plans (e.g. GMS), we trust that it will not delay the ongoing review and approval or our applications considering capacity can be addressed through appropriate Draft Plan conditions/Subdivision Agreement, phasing of development and/or zoning holding provisions as deemed necessary.
•
Figure 5-1 in TM-5 illustrates the Fenelon Falls Settlement Area (SA) Boundary however the boundaries do not match the existing Settlement Area boundary or the limit of the Fenelon Falls Secondary Plan. What is the source of the SA boundary? Does this presuppose expansion of the SA to the southern limits, as shown on our lands, for the purposes of the capacity assessment and final Master Plan? It is suggested that the assumption should be that the SA boundary would be expanded to the southern limit of the Secondary Plan area which matches our development application lands. See attached overlay of our application lands and approved Secondary Plan Schedule 3 – Land Use Plan. The SA boundary is also depicted in this fashion on the Fenelon Falls Wet Weather Flow Slide from PIC#2.
•
The Draft GMS information presented to the GMS Task Force on June 19, 2024, has indicated a deficit of 38ha of Settlement Area lands to accommodate future growth and that our application lands are the preferred location for the expansion of the settlement area. Will the capacity analysis and resulting Master Servicing Plan include the assumed development and corresponding population on the Settlement Area expansion lands?
327 Renfrew Drive, Suite 201, Markham, Ontario L3R 9S8 905.513.7999
•
The Servicing Assumptions slide presented at PIC#2 indicates that serving connection points and assumptions are to be confirmed based on development applications. Has the TOR application been reviewed and considered in this regard? Of note is consideration of our proposed connection points and infrastructure upgrades. It was also noted that the project team will consider input from landowners. To that end is TyLin amenable to participating in a call with TOR to discuss the project and specifically the implications of our development application? We would be glad to provide input at a time and in a format requested by the project team.
Thank you in advance for your consideration of the above comments. Sincerely,
Ryan Windle MCIP RPP AICP | VP of Land Development A. 327 Renfrew Dr., Suite 201 Markham ON L3R 9S8 E. rwindle@digram.ca P. 905.513.7999 Ext 251
327 Renfrew Drive, Suite 201, Markham, Ontario L3R 9S8 905.513.7999
56.1 35.0 40.8
35.0
307.6
50.0
FENELON FALLS
35.0
35.0
STREET 'H'
35.0 35.0
CITY OF KAWARTHA LAKES
20.0
SCHEDULE OF LAND USES: 35.0
LOW DENSITY RESIDENTIAL
STREET 'L'
20.0
20.0
STREET 'G'
R140.0
123.6
35.0
20.0
HP/LS
RS CEDA
CED CE AR DAR HE HED DGE GE
SW BS
TS
BU SH
20.0
.0
RB
132.5
TS
48.
37.5
38.0
36.6
R80.0
R57.0
BS
5
TS
BS
131.6
GR LAWASS N
GW
75.9
GW
147
DETACHED DWELLINGS - 18.2 +m
88
88
427
427 23.8 ha
BLOCKS UNITS
6.4 m STREET TOWNHOUSES
428 - 446 131
7.6 m STREET TOWNHOUSES
447 - 462 111 463 103 ±
MEDIUM DENSITY RESIDENTIAL @ @ 60 UNITS PER HECTARE [2.04 ha]
0 36.
35.0
CU
GRASS LAWN
147
@ @60 UNITS PER HECTARE [1.73ha] 35.1
20.0
NC
TS
DETACHED DWELLINGS - 15.2+m
MIXED USE
GR
ASS
EXISTING RURAL
2 R2
CO
GR LAWASS N
192
MEDIUM DENSITY RESIDENTIAL
73.0
20.0
192
TOTAL AREA LDR
' T 'K EE
163.2
UNITS
TOTAL LOTS/UNITS LDR
8.0
HP
BS
0.0
20.0
CO N CO 0.2 C CUNCRCURB CO NC 4W B RE DR TE IVEW 0 AY .34 W
HP
R ST
R14
35.0
35.0
35.0
TS
35.0
STREET 'J'
CO DR NCRE IVE TE WA Y
35.0
35.0
35.0
STREET 'I'
35.0
EXISTING RESIDENTIAL #112 CLIFTON STREET
23.0
LOTS
DETACHED DWELLINGS - 12.2+m
TOTAL UNITS MDR
467
TOTAL AREA MDR
10.37 ha
TOTAL UNITS RESIDENTIAL
894 34.17 ha BLOCKS AREA [ha]
TOTAL AREA RESIDENTIAL
GW GW HP HP
TS
467 - 472 0.74
FUTURE DEVELOPMENT SWM FACILITY
473 - 476 8.20
8.1
PARK
477
2.02
OPEN SPACE/ENVIRONMENTAL
478-479
4.67
ACCESS / DRIVEWAY
480
0.08
RETAINED BY OWNER
481
0.14
TS
BS
37.8
40.0
31.0
LAND USE BLOCKS
35.0
35.0
BS
464 - 466 122 ±
132.4
BS
157.1
STREET 'L'
20.0
20.0
STREET 'C'
35.0
35.0
35.0
35.0
34.6
34.1
34.0
34.0
34.2
34.8
WEST SIDE HEDGE 1.8 E
15.85 ha
TOTAL AREA LAND USE BLOCKS
HP
202.7
CEDAR CEDAR HEDGE HEDGE
330.7
HP
114.9
WEST SIDE HEDGE 0.7 E
2.0 R2
STREET 'O'
20.0
20.0
AREA [ha]
20.0 m ROW
6276
12.55
23.0 m ROW
1114
2.56
TOTAL ROADS
7390
15.11 ha
TOTAL AREA OF SUBMISSION
65.13 ha
STREET 'N'
35.0
STREET 'M' 20.0
23.0
20.0
STREET 'P'
20.0
STREET 'A'
INSTITUTIONS & COMMUNITY FACILITIES [CEMETERY]
POTENTIAL ROUNDABOUT LOCATION
LENGTH
ROADS
35.0 31.8
109.8
60.9
52.5
EXISTING RESIDENTIAL
31.8
31.6
110.4
20.0
STREET 'B'
174.0 29.9
15.2
15.2
276.3
31.5
94.1
90.8
20.0
35.0
20.0
32.1
STREET 'Q' 35.1
35.0
35.0
134.1
6.9 65.8
35.0
35.1
EXISTING RURAL/AGRICULTURAL
R22
.0
67.8
32.5
105.2
23.0
86.8
STREET 'Q'
20.0
20.0
35.2
.3
46
34.5
33.0
8.0
35.0
44.
3
14.4
20.0
R22 .0
STREET 'R'
20.0
35.5
EXISTING RURAL/AGRICULTURAL
STREET 'T'
7.7
7.7
43.2
35.0
35.0
18.5
33.6
11.6
41.7 35.3
20.0
39.9 20.0
35.0
35.0
7.7
20.0
20.0
265.9
STREET 'S'
7.7
35.0
STREET 'U'
7.7
35.0
EXISTING RURAL/AGRICULTURAL
35.0
N
35.0
7.7
7.7
35.0
7.7
35.0
STREET A
33.4
EXISTING RESIDENTIAL
0
20
40
60
80
100m
35.7
20.0
20.0
STREET 'R' 6.5
SCALE 1:2000 AT ORIGINAL SIZE
STREET 'U' 31.7
35.0
4
A
1st SUBMISSION P.R.
No. Issue 63.6
EXISTING WETLAND
ADDITIONAL INFORMATION UNDER THE PLANNING ACT
S.W.
Design Check
12587558
I HEREBY CERTIFY THAT THE BOUNDARIES OF THE LAND TO BE SUBDIVIDED AND THEIR RELATIONSHIP TO THE ADJACENT LANDS ARE ACCURATELY AND CORRECTLY SHOWN ON THIS PLAN .
.
OCT 2023 Date
Project Manager S.W.
WE , THE REGISTERED OWNERS OF THE SUBJECT LANDS, HEREBY AUTHORIZE GHD TO PREPARE AND SUBMIT A DRAFT PLAN OF SUBDIVISION FOR APPROVAL.
DATE
Oct 6/2023
Drafting Check
SURVEYOR'S CERTIFICATE
SIGNED
Path and Filename: G:\662\12587558\Tech\Planning\Draft Plan\Outgoing\12587558-DP1_FENELON_FALLS_2023_10_06 .dwg
Designer P.R.
OWNER'S CERTIFICATE
OCT 2023 Project No.
Project
TOR CONSTRUCTION LTD
Size
ARCH D
HOLDING JONES VANDERVEEN INC. ONTARIO LAND SURVEYORS
Plotted By: Prapti Chandreshbhai Rakhasia
P.R.
Date
TOR CONSTRUCTION LTD.
S.W. Approved
Author
H) Piped municipal water supply I) Sandy , Clay K) All municipal services required L) As shown
Under section 51(17) of The Planning Act information required by clauses A,B,C,D,E F,G, & J shown on Draft and Key plans.
Plot Date: 6 October 2023 - 12:09 PM
Checked
SIGNED
DATE
OCT 6, 2023
FENELON FALLS Status Code CITY OF KAWARTHA LAKES A
Area Subject to Applications [65ha]
Filename: G:\662\12587558\Tech\Planning\Figures\PJR Figures\12587558_PJR_FIG8_2023_08.dwg Plot Date: 11 August 2023
N
TOR CONSTRUCTION LTD
FENELON FALLS SECONDARY PLAN, 2015 LAND USE SCHEDULE F3
Project No. 12587558 Revision A Date AUG 2023
Figure
08
Charlotte Black From: Sent: To: Subject:
Sydney Mcivor Friday, June 28, 2024 12:27 PM Charlotte Black FW: Servicing and Capacity Master Plan
Sydney McIvor CIVIL E.I.T. – WATER LINEAR
From: Nafiur Rahman <nrahman@kawarthalakes.ca> Sent: Friday, June 28, 2024 12:26 PM To: Kevin Brown <Kevin.Brown@TYLin.com> Cc: Sydney Mcivor <sydney.mcivor@tylin.com> Subject: FW: Servicing and Capacity Master Plan
Kevin, Please review the following email and answer accordingly. Thanks Nafiur From: Federico Palacios <FPalacios@thebiglierigroup.com> Sent: Tuesday, June 25, 2024 4:55 PM To: Nafiur Rahman <nrahman@kawarthalakes.ca> Subject: Servicing and Capacity Master Plan Hello Nafiur, I hope this message finds you well! I am writing to inquire if the current process has identified any infrastructure investments for the community of Omemee based on capacity and use. Additionally, I am wondering if you can provide a quick timeline of next steps, including when you expect a draft and final master plan to be available for consultation. Thank you,
Federico Palacios, M.Pl. Junior Planner fpalacios@thebiglierigroup.com Fax: (416) 693-9133 Cell: (647) 673-4978 www.thebiglierigroup.com 1
TORONTO
HAMILTON
2472 Kingston Rd. Toronto, ON, M1N 1V3
21 King St W, Suite 1502 Hamilton, ON, L8P 4W7
This message, including any attachments, is privileged and intended only for the addressee(s) named above. If you are not the intended recipient, you must not read, use or disseminate the information contained in this e-mail. If you have received this e-mail in error, please notify the sender immediately by telephone, fax, or e-mail and shred this confidential e-mail, including any attachments, without making a copy. Access to this e-mail by anyone else is unauthorized.
2
Sydney Mcivor From: Sent: To: Cc: Subject:
Federico Palacios <FPalacios@thebiglierigroup.com> Monday, July 8, 2024 11:54 AM nrahman; Sydney Mcivor Kevin Brown RE: Servicing and Capacity Master Plan
Follow Up Flag: Flag Status:
Follow up Flagged
Some people who received this message don't often get email from fpalacios@thebiglierigroup.com. Learn why this is important
Thank you kindly for including me in this list. Regards,
Federico Palacios, M.Pl. Junior Planner fpalacios@thebiglierigroup.com Phone: (416) 693-9155 x 235 Fax: (416) 693-9133 www.thebiglierigroup.com
TORONTO
HAMILTON
2472 Kingston Rd. Toronto, ON, M1N 1V3
21 King St W, Suite 1502 Hamilton, ON, L8P 4W7
From: Nafiur Rahman <nrahman@kawarthalakes.ca> Sent: Monday, July 8, 2024 11:53 AM To: Federico Palacios <FPalacios@thebiglierigroup.com>; Sydney Mcivor <sydney.mcivor@tylin.com> Cc: 'Kevin Brown' <kevin.brown@tylin.com> Subject: RE: Servicing and Capacity Master Plan
Yes, a notification will be sent to everyone included in the project contact list. Sydney – please include Federico in the project contact list if not included already. From: Federico Palacios <FPalacios@thebiglierigroup.com> Sent: Monday, July 8, 2024 11:33 AM To: Nafiur Rahman <nrahman@kawarthalakes.ca> Cc: 'Kevin Brown' <kevin.brown@tylin.com>; Sydney Mcivor <sydney.mcivor@tylin.com> Subject: RE: Servicing and Capacity Master Plan Hi Nafiur, 1
Not a problem! Thank you kindly for your update, I will look forward to seeing the questions and answers. Would you be able to notify me when those are available? Thank you,
Federico Palacios, M.Pl. Junior Planner fpalacios@thebiglierigroup.com Phone: (416) 693-9155 x 235 Fax: (416) 693-9133 www.thebiglierigroup.com
TORONTO
HAMILTON
2472 Kingston Rd. Toronto, ON, M1N 1V3
21 King St W, Suite 1502 Hamilton, ON, L8P 4W7
From: Nafiur Rahman <nrahman@kawarthalakes.ca> Sent: Monday, July 8, 2024 11:04 AM To: Federico Palacios <FPalacios@thebiglierigroup.com> Cc: 'Kevin Brown' <kevin.brown@tylin.com>; Sydney Mcivor <sydney.mcivor@tylin.com> Subject: RE: Servicing and Capacity Master Plan You don't often get email from nrahman@kawarthalakes.ca. Learn why this is important
Hi Federico, Sorry to reply you late. I acknowledge the receipt of your email. Our consultant team is further reviewing the study findings. The question deadline is July 31st. Following the deadline a summary of questions and answers will be published to the City website. Thank you. Nafiur Rahman, P.Eng., PMP Supervisor, Environmental Capital Project Management Infrastructure Design and Construction, Engineering and Corporate Assets City of Kawartha Lakes 705-324-9411 ext. 1193 www.kawarthalakes.ca
From: Federico Palacios <FPalacios@thebiglierigroup.com> Sent: Tuesday, June 25, 2024 4:55 PM 2
To: Nafiur Rahman <nrahman@kawarthalakes.ca> Subject: Servicing and Capacity Master Plan Hello Nafiur, I hope this message finds you well! I am writing to inquire if the current process has identified any infrastructure investments for the community of Omemee based on capacity and use. Additionally, I am wondering if you can provide a quick timeline of next steps, including when you expect a draft and final master plan to be available for consultation. Thank you,
Federico Palacios, M.Pl. Junior Planner fpalacios@thebiglierigroup.com Fax: (416) 693-9133 Cell: (647) 673-4978 www.thebiglierigroup.com
TORONTO
HAMILTON
2472 Kingston Rd. Toronto, ON, M1N 1V3
21 King St W, Suite 1502 Hamilton, ON, L8P 4W7
This message, including any attachments, is privileged and intended only for the addressee(s) named above. If you are not the intended recipient, you must not read, use or disseminate the information contained in this e-mail. If you have received this e-mail in error, please notify the sender immediately by telephone, fax, or e-mail and shred this confidential e-mail, including any attachments, without making a copy. Access to this e-mail by anyone else is unauthorized. This message, including any attachments, is privileged and intended only for the addressee(s) named above. If you are not the intended recipient, you must not read, use or disseminate the information contained in this e-mail. If you have received this e-mail in error, please notify the sender immediately by telephone, fax, or e-mail and shred this confidential e-mail, including any attachments, without making a copy. Access to this e-mail by anyone else is unauthorized.
3
Sydney Mcivor From: Sent: To: Subject: Attachments:
Kevin Brown Tuesday, July 9, 2024 9:17 AM Sydney Mcivor FW: Follow Up-WWW Servicing and Capacity Master Plan 2024_06_22_Wilson Developments Comments WWW Master Plan.pdf; Arbour Village Zoning.pdf; Arbour Village Development Site Plan.pdf; 20 Green Arbour Way Servicing Plan.pdf
Follow Up Flag: Flag Status:
Follow up Flagged
Kevin Brown, P.Eng. (he, him) SENIOR MUNICIPAL ENGINEER TEAM LEAD - HYDRAULICS AND INFRASTRUCTURE PLANNING M +1 416.843.4689
From: Mark Wilson <mark.w@mvwconstruction.com> Sent: Monday, June 24, 2024 3:58 PM To: Kevin Brown <kevin.brown@tylin.com> Cc: nrahman <nrahman@kawarthalakes.ca>; Juan Rojas <jrojas@city.kawarthalakes.on.ca>; Christina Sisson <csisson@kawarthalakes.ca> Subject: Follow Up-WWW Servicing and Capacity Master Plan You don't often get email from mark.w@mvwconstruction.com. Learn why this is important
Good afternoon Kevin, Please find attached correspondence related to the Water and Wastewater Servicing and Capacity Master Plan. Best regards,
Mark V Wilson, P.Eng.
President MVW Construction & Engineering Inc. 245 Kent Street West Lindsay, ON, K9V 2Z3 Phone: 705-324-7281
1
2
M.V. Wilson Engineering Inc. 245 Kent St. W., Lindsay, ON K9V 2Z3
T: 705 324 7281 F: 705 328 1268 E: eng@mvwconstruction.com
June 22, 2024 Kevin Brown, P.Eng. T.Y. Lin International Canada Inc. (416)-843-4689 Kevin.Brown@tylin.com RE: Wilson Developments (Lindsay) Inc. Dear Mr. Brown: Thank you for the informative presentation at the recent public information center meeting held in Lindsay, on Thursday June 20, 2024. I had a brief introduction to you, prior to the presentation but I wanted to take the opportunity to provide some further background on our development projects in Lindsay. We are the developers of the Arbour Village development located between Adelaide Street and Angeline Street South and were responsible for construction of the sanitary sewer on Adelaide Street that services Arbour Village. Currently, have an active site plan application for our 20 Green Arbour Way condominium development (www.20greenarbourway.com). This 53 unit condominium building is at the pre-sales stage and it is our hope that we can still start construction this year. As part of the overall Arbour Village development master planned community, it was anticipated that there would be a further 132 units constructed on the lands to the north of the 20 Green Arbour Way development site. This site is currently zoned RH1-S8(H1) with the holding symbol being placed on the property for site plan approval, as well as confirmation of adequate supply of municipal water and sanitary services. We would like to request that confirmation is provided that adequate sewer and water is available for this final phase of the Arbour Village Development. We anticipate submitting a formal site plan application late summer or early fall. We have attached the zoning information, the 20 Green Arbour Way Site servicing drawing showing sewer and water services as well as the overall Arbour Village site plan. If you require anything further or would like to discuss anything, please feel free to contact me by email at mark.w@mvwconstruction.com or my cell phone number is 705-340-1801. Sincerely, M.V. Wilson Engineering Inc.
Mark V Wilson, P.Eng. cc: Nafiur Rahman, P.Eng., Christina Sisson, P.Eng., Juan Rojas, P.Eng.
HAM
ST.
W.
DUR
E ST
E ST LAID ADE
EL I N A NG
150mm PERFORATED
2
3
DT1
DT1
EXTENT OF U/G PARKING
EASEMENT
EX. 300mm Ø PVC STM. @ -3.45%
7.63m - 200mm Ø STM. @ 0.50%
DT1
DT1
SAN MH1 TOP ELEV: 266.72 E INV. 263.364 200mm W INV. 263.394 200mm
13.28m - 200mm Ø SAN. @ -1.00% INV=263.527
EX. 200mm Ø PVC SAN. @ -1.62%
INV=265.575
CB MH 2 TOP ELEV: 266.79 SE INV. 265.455 250mm N INV. 265.535 250mm 6.03m - 250mm Ø STM. @ 1.00%
CB 2 TOP ELEV: 267.90 NW INV. 266.010 250mm
2
7
DT1
DT1
9 DT1
SANITARY SEWER: 1. 2. 3. 4. 5.
SANITARY SEWER CONNECTIONS ARE TO BE PVC SDR 28. MANHOLE FRAMES AND COVERS MUST BE AS PER OPSD 401.010 (CLOSED FOR SAN MH'S) REFER TO OPSD 1006.020 FOR SANITARY SEWER CONNECTION DETAIL. SANITARY CONNECTIONS TO SEWER LINE ARE TO BE MANUFACTURED TEES. FROST STRAPS MUST BE PROVIDED ON ALL MANHOLES
2
DT1
DT1
F.F.E 268.50
EX MH 109 TOP ELEV: 266.22 SW INV. 263.290 200mm E INV. 263.250 200mm NW INV. 263.290 200mm
BACKFLOW PREVENTOR
EX./PR. CATCH BASIN MANHOLE EX./PR. CONTROL CATCH BASIN MANHOLE EX./PR. CATCH BASIN WATER VALVE
1
WATER SERVICE CROSSING
PROPOSED 100mm PVC DOMESTIC WATER SERVICE AND VALVE
7. 6. 5. 4.
ISSUED FOR SPA #3
14.06.24
SC
3.
ISSUED FOR REVIEW
24.05.24
SC
2.
ISSUED FOR SPA #2
01.30.24
MW
1.
ISSUED FOR SPA
07.27.22
MW
DATE
BY
NO.
DESCRIPTION ISSUES
NORTH ARROW
STAMP
N
W
EXISTING FIRE HYDRANT
E S M.V. Wilson Engineering Inc. 245 Kent St W, Lindsay, ON K9V 2Z3 www.mvwconstruction.com
200mm Ø PVC STM. @ 0.53%
PROJECT
200mm Ø PVC SAN. @ 0.57%
ARBOUR VILLAGE CONDO 200mm Ø PVC SAN. @ 0.49%
900mm Ø Reinforced Concrete STM. @ 0.33%
GREEN ARBOUR WAY ncrete STM.
900mm Ø Reinforced Co @ 0.49%
2024-06-14
ALL CATCH BASINS MUST HAVE A MINIMUM SUMP OF 600mm STORM SEWER CONNECTIONS ARE TO BE PVC SDR 28 MANHOLE FRAMES AND COVERS MUST BE AS PER OPSD 401.010 (OPEN FOR STORM MH'S) ALL STORM SEWERS AND CATCH BASIN LEADS MUST BE CLEANED AND FLUSHED PRIOR TO INSPECTION. FILTER CLOTHS MUST BE INSTALLED ACROSS THE PROPOSED CATCH BASIN/MANHOLE LIDS IMMEDIATELY AFTER INSTALLATION. REFER TO DT3 & ES1 FOR FILTER DETAIL AND LOCATIONS. FILTER CLOTHS ARE ONLY TO BE REMOVED ONCE THE ASPHALT HAS BEEN PLACED, ALL SITE WORKS ARE COMPLETE AND THE SITE IS CLEANED.
3
PROPOSED 4-STOREY CONDO BUILDING
STORM SEWER: 1. 2. 3. 4. 5.
11.45m - 250mm Ø STM. @ 1.00% CB MH 1 TOP ELEV: 266.42 NW INV. 265.395 250mm E INV. 265.315 250mm
SWALE
ALL WATERMAINS MUST HAVE A MINIMUM VERTICAL CLEARANCE OF 0.15m OVER AND 0.5m UNDER SEWERS AND ALL OTHER UTILITIES WHEN CROSSING. 2. WATERMAINS ARE TO HAVE A MINIMUM COVER OF 1.8m FROM THE GROUND SURFACE TO THE OBVERT OF PIPE. 3. A 2.5m HORIZONTAL SEPARATION MUST BE MAINTAINED FROM ANY SEWER OR SEWER MAINTENANCE HOLE. THE DISTANCE IS TO BE MEASURED FROM THE NEAREST EDGE. 4. ALL JOINTS TO BE MECHANICALLY RESTRAINED. ALL TEES, PLUGS, HORIZONTAL BENDS, AND VERTICAL BENDS MUST CONFORM TO OPSD 1103.010 AND OPSD 1103.020 5. CATHODIC PROTECTION TO BE PROVIDED: ONE 5.4kg ZINC ANODE FOR EVERY 100m OF TRACER WIRE ONE 5.4kg ZINC ANODE ON EVERY FITTING CONNECTED TO THE WATERMAIN ONE 5.4kg ZINC ANODE ON EVERY COPPER SERVICE CONNECTION 6. BEDDING AND BACKFILL FOR PVC WATERMAIN MUST COMPLY TO CITY OF KAWARTHA LAKES DESIGN CRITERIA FOR WATERMAINS (E11.01) FLUSHING, SWABBING, AND TESTING 7. ALL NEW WATERMAINS ARE TO BE SWABBED IN ACCORDANCE WITH THE CITY OF KAWARTHA LAKES DESIGN CRITERIA FOR WATERMAINS (E17.00, E17.01 AND E17.02 AND IN CONJUNCTION WITH ONTARIO PROVINCIAL SPECIFICATIONS (OPS), THE AMERICAN WATERWORKS ASSOCIATION (AWWA) STANDARDS, AND THE ONTARIO SAFE DRINKING WATER ACT (CAN/CSA B64.10)) 8. A REDUCED PRESSURE ZONE BACK FLOW PREVENTER (WATTS SERIES 909 OR APPROVED EQUIVALENT) IS REQUIRED ON THE TEMPORARY SUPPLY LINES USED FOR FILLING AND FLUSHING OR SWABBING OF WATERMAINS. 9. M.V. WILSON ENGINEERING MUST BE CONTACTED PRIOR TO ALL CLEANING, HYDROSTATIC TESTING, DISINFECTION, AND SAMPLING ACTIVITIES. THE PROJECT ENGINEER MUST BE ON SITE WITH THE SPECIALIST CARRYING OUT ANY OF THESE ACTIVITIES AND TOGETHER FILL OUT THE CITY OF KAWARTHA LAKES APPROVED WATERMAIN DISINFECTION, PRESSURE TESTING & ACCEPTANCE FORM. 10. ALL WORKS ASSOCIATED WITH LEAKAGE TESTING, SWABBING, CHLORINATION AND STERILIZATION OF THE WATERMAIN IS TO BE PERFORMED BY A COMPANY SPECIALIZED IN THE WORK OR A COMPANY APPROVED BY THE CITY ENGINEER. VALVES & VALVE BOXES 11. ALL VALVE BOXES TO BE SET TO PROPOSED GRADES 12. FOR MAINLINE VALVES, RESILIENT SEAT GATE VALVES CONFORMING TO AWWA C509 (LATEST REVISION) MUST BE USED.
DT1
EXTENT OF U/G PARKING
1.
9
3
.
200mm Ø PVC SAN. @ 0.98%
WATERMAIN:
EX./PR. SANITARY MANHOLE
ROAD RESTORATION: 450mm GRAN. B 150mm GRAN. A 50mm HL8 40mm HL3 CURB AS PER OPSD 600.040
2
BACKFLOW PREVENTORS
SWALE
m @ mØ -4 .2 PV 0% C ST M
900mm Ø Reinforced Concrete STM. @ 0.47%
3. 4. 5.
EX./PR. STORM MANHOLE
ROAD RESTORATION: 450mm GRAN. B 150mm GRAN. A 50mm HL8 40mm HL3 CURB AS PER OPSD 600.040
900mm Ø Reinforced Concrete STM. @ -0.46%
DT1
GREEN ARBOUR WAY
DT1
WV
200mm Ø PVC SAN. @ 0.49%
2
WV
EX. 150mm PVC. WATERMAIN
3 EX .2
GREEN ARBOUR WAY
2.
GAS LINE
EXISTING 150mm FIRE WATER SERVICE AND VALVE EXISTING STORM SERVICE TO BE CAPPED AT MAIN
1
PIPE CROSSING STM INV. = 265.565 SAN OBV. = 263.614 CLEARANCE = 1.951m
50
CONSTRUCTION OF WATER, STORM AND SANITARY SERVICES MUST BE IN ACCORDANCE WITH THE CITY OF KAWARTHA LAKES (CKL) STANDARDS & SPECIFICATIONS (LATEST REVISION) AND THE MINISTRY OF ENVIRONMENT (MOE) GUIDELINES (LATEST REVISION). ALL DIMENSION AND INVERTS MUST BE VERIFIED PRIOR TO CONSTRUCTION. ANY DISCREPANCY MUST BE COMMUNICATED TO M.V. WILSON ENGINEERING INC. (705) 324-7281 THE CONTRACTOR IS RESPONSIBLE FOR LOCATING AND THE PROTECTION OF ALL UTILITIES DURING CONSTRUCTION. TOPSOIL IN FILL AREA TO BE STRIPPED AND CLEAN FILL TO BE PLACED AND COMPACTED TO 95% PROCTOR DENSITY. BEDDING TRENCHES OF PIPES PASSING THROUGH UN-COMPACTED FILL AREAS SHALL BE EXCAVATED TO THE UNDISTURBED GROUND LEVEL AND BACK FILLED WITH GRANULAR 'A' COMPACTED TO 100% PROCTOR DENSITY.
HYDRO/UTILITY DUCT BANK
EX MH 108 TOP ELEV: 266.27 S INV. 263.380 200mm NE INV. 263.340 200mm W INV. 263.235 200mm
5.36m - 250mm Ø STM. @ -0.74%
1.
WATER LINE
INV=265.575
267.98
GENERAL:
GATE VALVE WITH SCREW TYPE VALVE BOX IN ENTRANCE AS PER CKL-101 DETAIL 2, DT3
EXISTING MAPLE TREE
300mm Ø PVC RWL. @ -0.50%
WATER SERVICE CLEARANCE CROSSING NO. WATER SERVICE SERVICE TYPE INV. CLEARANCE OBV. 1 264.19 265.55 1.36m PROP. STM 2 264.45 265.43 0.98m PROP. STM 3 264.58 265.27 1.24m PROP. STM
N. C SA Ø PV 00mm % EX. 2 @ 0.98
200mm Ø PVC SAN. @ 0.95%
1
WV
CB3 TOP ELEV: 266.38 W INV. 265.613 200mm
BASE OF STONE ELEVATION: 264.56
3
WV
INV=265.575
DT2
SAN MH2 TOP ELEV: 266.48 SE INV. 263.179 200mm NW INV. 263.179 200mm
E
T
DT1
VIC SER
ICE
INV=265.575
EX. PROPERTY BOUNDARY
R ATE
DT1
LEGEND:
RE W
EX. 250mm Ø PVC STM.
m FI
DT1
DT1
ALL DIMENSIONS ARE TO BE VERIFIED AND CONFIRMED ON SITE. ANY DISCREPANCIES ARE TO BE REPORTED TO THE ENGINEER. THE DRAWINGS ARE THE PROPERTY OF THE ENGINEER AND ARE NOT TO BE SCALED. ONLY THE LATEST APPROVED DRAWINGS ARE TO BE USED FOR CONSTRUCTION.
KIOSK
50m
7
ERV
2
BASE OF CHAMBER ELEVATION: 264.79
EX MH 6 TOP ELEV: 267.98 N INV. 266.400 300mm SE INV. 265.820 900mm W INV. 265.860 900mm 900mm Ø Reinforced Concrete STM. @ 0.43%
NG 1
9
ER S
EXISTING FIRE HYDRANT
9
15.60m - 200mm Ø STM. @ -0.93%
WAT
ADJUST EXISTING RIM TO ELEVATION SHOWN
DT1
STIC
EX. CB 1 TOP ELEV: 268.00 S INV. 267.039 300mm
EXISTING HYDRO
TI EXIS
9.62m 200mm Ø PVC STM. @ -0.50% FROM TRENCH DRAIN SUMP
E DOM
DT1
WAY
ARB
UNDERDRAIN
m 100m
DT1
OUR
S.
CRE
KEY PLAN N.T.S.
NEW
7
ETH
LIBS
EN GRE
CB MH 3 TOP ELEV: 266.46 S INV. 265.720 200mm W INV. 266.010 100mm SW INV. 265.855 200mm
9 2
.
ADJACENT PROPERTY OWNED BY APPLICANT
SWALE
.
EXISTING/PROPOSED ADDITIONAL WATER TO SERVICE RH1-S8 LANDS
900mm Ø Reinforced Concrete STM. @ 0.50%
LINDSAY, ON TITLE
SITE SERVICING PLAN SCALE DRAWN BY PLOT DATE PROJECT
DRAWING NO. 1:200 RM Dec. 20, 23 EP21045
SS1
ARBOUR LANE - 132 UNITS - REQUEST FOR REMOVAL OF HOLDING SYMBOL FOR SERVICING
Sydney Mcivor From: Sent: To: Cc: Subject:
Kevin Brown Thursday, June 20, 2024 1:13 PM nrahman Abe Khademi; cpurdy; jrojas RE: Fenelon Falls Webster Property
Nafiur: The GMS isn’t going to Council until October? Given that this study relies on those growth numbers, I would suggest that we should plan on finishing the Master Plan AFTER the GMS. Ideally, as soon after it as possible, but I don’t think that the optics of finalising a Master Plan before the GMS gets 100% endorsement are great. We are getting multiple questions about what’s in, versus not. And our mapping really needs to reflect the GMS planning, otherwise it could be subject to appeals. I think that we should keep advancing the Master Plan, since we understand that the GMS is “near-final”. Just procedurally, if the GMS is going to Council in October, then we should be aiming for November. -Kevin
Kevin Brown, P.Eng. (he, him) SENIOR MUNICIPAL ENGINEER TEAM LEAD - HYDRAULICS AND INFRASTRUCTURE PLANNING M +1 416.843.4689
From: Nafiur Rahman <nrahman@kawarthalakes.ca> Sent: Thursday, June 20, 2024 11:55 AM To: Kevin Brown <kevin.brown@tylin.com>; Vardhini Parvatham <vardhini.parvatham@tylin.com> Subject: FW: Fenelon Falls Webster Property
FYI From: John Connolly <jconnolly@kawarthalakes.ca> Sent: Thursday, June 20, 2024 11:47 AM To: Nafiur Rahman <nrahman@kawarthalakes.ca>; Leah Barrie <lbarrie@kawarthalakes.ca> Cc: Mark Jull <mjull@kawarthalakes.ca> Subject: RE: Fenelon Falls Webster Property Nafiur: Mr. Carol has in fact appealed the Rural Zoning By-law recently passed by Council to the Ontario Land Tribunal. Internally, staff recognize the situa on with Mr. Webster and are taking the necessary steps to respond to the ght meline for OLT appeals. 1
It is also ed to the GMS study that will go top Council in October. Suffice is to say, that it is complicated and we will should discuss at a mee ng with all of this ma ers in mind. Make sense? JFC From: Nafiur Rahman <nrahman@kawarthalakes.ca> Sent: Thursday, June 20, 2024 11:44 AM To: Leah Barrie <lbarrie@kawarthalakes.ca> Cc: John Connolly <jconnolly@kawarthalakes.ca>; Mark Jull <mjull@kawarthalakes.ca> Subject: Fenelon Falls Webster Property
Hi Leah, In last night’s PIC at Fenelon Falls, I met with Dough Carrol (former Manager of Planning with the city). He expressed his frustration as the Webster property (at the north just outside of boundary limit) is not shown and included in the servicing master plan study. He also mentioned that the draft plan of this area was already approved by the council. Based on our last email conversation, I understand the location option analysis to expand the urban settlement area is still underway through the GMS study. We got this information just few days before our PIC. However, we did consider the proposed entire TOR (Fenelon Trails) development for our study even a portion of area is outside of settlement boundary. After the PIC we will further revisit the planning information (development list). Please let me know if we need to consider this Webster development in our servicing study or should we wait until the boundary expansion analysis is done?
2
Thanks Nafiur From: Leah Barrie <lbarrie@kawarthalakes.ca> Sent: Thursday, May 30, 2024 12:12 AM To: Nafiur Rahman <nrahman@kawarthalakes.ca>; Roberta Perdue <rperdue@kawarthalakes.ca> Cc: Corby Purdy <cpurdy@kawarthalakes.ca>; Christina Sisson <csisson@kawarthalakes.ca>; Juan Rojas <jrojas@kawarthalakes.ca>; John Connolly <jconnolly@kawarthalakes.ca>; Mark Jull <mjull@kawarthalakes.ca> Subject: RE: NOTICE OF PUBLIC INFORMATION CENTRE #2 - CITY OF KAWARTHA LAKES WATER AND WASTEWATER MASTER PLAN UPDATE - Fenelon Falls Webster Property
Hi Nafiur, although I’m not aware that the group submitted a specific growth consideration request through the GMS, their land is within the current secondary plan area. However, as we’re aware from the latest GMS work, although there’s a deficit of land in FF indicating a need to expand the urban settlement area, the location options analysis is underway to guide where the recommended areas for expansion should be.
Leah From: Nafiur Rahman <nrahman@kawarthalakes.ca> Sent: Wednesday, May 29, 2024 9:40 AM To: Roberta Perdue <rperdue@kawarthalakes.ca>; Leah Barrie <lbarrie@kawarthalakes.ca> 3
Cc: Corby Purdy <cpurdy@kawarthalakes.ca>; Christina Sisson <csisson@kawarthalakes.ca>; Juan Rojas <jrojas@kawarthalakes.ca>; John Connolly <jconnolly@kawarthalakes.ca> Subject: FW: NOTICE OF PUBLIC INFORMATION CENTRE #2 - CITY OF KAWARTHA LAKES WATER AND WASTEWATER MASTER PLAN UPDATE - Fenelon Falls Webster Property
Thanks, Roberta. Leah – In regard to the email below from Robbie (DGB), does Planning have any information? He referred to Mayor Elmslie’s comment (see highlighted in yellow). Nafiur From: Roberta Perdue <rperdue@kawarthalakes.ca> Sent: Tuesday, May 28, 2024 5:15 PM To: Nafiur Rahman <nrahman@kawarthalakes.ca> Cc: Christina Sisson <csisson@kawarthalakes.ca>; Corby Purdy <cpurdy@kawarthalakes.ca>; Juan Rojas <jrojas@kawarthalakes.ca> Subject: RE: NOTICE OF PUBLIC INFORMATION CENTRE #2 - CITY OF KAWARTHA LAKES WATER AND WASTEWATER MASTER PLAN UPDATE - Fenelon Falls Webster Property
Hi Nafiur Dev Eng has not received an application. I think Robbie is referring to area DP-9 (from Sched. A, CKL Official Plan – I have no idea the status the OP doc or Development Plan (DP) areas).
4
5
From: Nafiur Rahman <nrahman@kawarthalakes.ca> Sent: Tuesday, May 28, 2024 4:15 PM To: Roberta Perdue <rperdue@kawarthalakes.ca> Cc: Christina Sisson <csisson@kawarthalakes.ca>; Corby Purdy <cpurdy@kawarthalakes.ca>; Juan Rojas <jrojas@kawarthalakes.ca> Subject: FW: NOTICE OF PUBLIC INFORMATION CENTRE #2 - CITY OF KAWARTHA LAKES WATER AND WASTEWATER MASTER PLAN UPDATE - Fenelon Falls Webster Property
Hi Roberta, As per email below can you please confirm if there is any associated development application? As per 2011 GMS and Development list the only information I have – 57 units condo at 99 Louisa St (The Moorings on Cameron) Thanks Nafiur From: Robbie Larocque <robbie.larocque@dgbiddle.com> Sent: Tuesday, May 28, 2024 3:21 PM To: Sydney McIvor <sydney.mcivor@tylin.com>; kevin.brown@TYLin.com; Nafiur Rahman <nrahman@kawarthalakes.ca> Cc: Jim Webster < > Subject: RE: NOTICE OF PUBLIC INFORMATION CENTRE #2 - CITY OF KAWARTHA LAKES WATER AND WASTEWATER MASTER PLAN UPDATE - Fenelon Falls Webster Property Good afternoon, I am writing you at the request of our Client Jim Webster. Mr Webster has land holdings at the North/west quadrant of the Village of Fenelon Falls. The property has frontage on Louisa Street, Queen Street, Princes Street, Robson Road and Albert Streets. I am asked to remind the team who are preparing the City of Kawartha Lakes Water and Wastewater Master Plan to have appropriate regard for this property in your work assignment. Yesterday I was reminded by our Client of a personal conversation and commitment from Mayor Doug Elsmlie that this property would be serviced with the Master Planning work. Thank you in advance for your attention to this property. We look forward to your presentation on June 19, 2024 in Fenelon Falls. Thanks,
ROBBIE LAROCQUE, P. Eng. Senior Consulting Engineer, Partner Civil Group 96 King Street East, Oshawa, ON L1H 1B6 905-576-8500 dgbiddle.com
6
CIVIL | STRUCTURAL | MECHANICAL | ELECTRICAL | PLANNING Please note, staff at D.G. Biddle & Associates Ltd. will respond to messages during their regular working hours as per the Employment Standards Act. PRIVILEGE AND CONFIDENTIALITY NOTICE: As regulated by the Personal Information Protection and Electronic Documents Act, S.C.2000 C5, this electronic transmission, including all attachments, is directed in confidence to the person(s) to which it is addressed, or an authorized recipient, and may not otherwise be distributed, copied, printed, or disclosed. If you have received this electronic transmission in error, please notify the sender immediately by return transmission and then immediately delete this transmission, including all attachments, without copying, printing, distributing, or disclosing same.
From: Sydney McIvor <sydney.mcivor@tylin.com> Sent: Friday, May 24, 2024 10:52 AM To: Robbie Larocque <robbie.larocque@dgbiddle.com> Subject: NOTICE OF PUBLIC INFORMATION CENTRE #2 - CITY OF KAWARTHA LAKES WATER AND WASTEWATER MASTER PLAN UPDATE Dear Stakeholder, T.Y. Lin International Canada Inc. has been retained by the City of Kawartha Lakes to assist in undertaking a Municipal Class Environmental Assessment (EA) with respect to updating the Water and Wastewater Master Plan. Please review the attached file containing details of the Water and Wastewater Master Plan Public Information Centre #2 (PIC) for the City of Kawartha Lakes. If you have any questions, please feel free to contact Project Manager Kevin Brown, as noted in the letter. Thank you,
Sydney McIvor CIVIL E.I.T. – WATER LINEAR T +1 905.738.5700
TYLin
209 Dundas Street East Suite 301 Whitby, ON L1N 7H8, Canada TYLin.com
This message, including any attachments, is privileged and intended only for the addressee(s) named above. If you are not the intended recipient, you must not read, use or disseminate the information contained in this e-mail. If you have received this e-mail in error, please notify the sender immediately by telephone, fax, or e-mail and shred this confidential e-mail, including any attachments, without making a copy. Access to this e-mail by anyone else is unauthorized.
7
Sydney Mcivor From: Sent: To: Subject:
nrahman Thursday, June 20, 2024 11:55 AM Kevin Brown; Vardhini Parvatham FW: Fenelon Falls Webster Property
FYI From: John Connolly <jconnolly@kawarthalakes.ca> Sent: Thursday, June 20, 2024 11:47 AM To: Nafiur Rahman <nrahman@kawarthalakes.ca>; Leah Barrie <lbarrie@kawarthalakes.ca> Cc: Mark Jull <mjull@kawarthalakes.ca> Subject: RE: Fenelon Falls Webster Property Nafiur: Mr. Carol has in fact appealed the Rural Zoning By-law recently passed by Council to the Ontario Land Tribunal. Internally, staff recognize the situa on with Mr. Webster and are taking the necessary steps to respond to the ght meline for OLT appeals. It is also ed to the GMS study that will go top Council in October. Suffice is to say, that it is complicated and we will should discuss at a mee ng with all of this ma ers in mind. Make sense? JFC From: Nafiur Rahman <nrahman@kawarthalakes.ca> Sent: Thursday, June 20, 2024 11:44 AM To: Leah Barrie <lbarrie@kawarthalakes.ca> Cc: John Connolly <jconnolly@kawarthalakes.ca>; Mark Jull <mjull@kawarthalakes.ca> Subject: Fenelon Falls Webster Property
Hi Leah, In last night’s PIC at Fenelon Falls, I met with Dough Carrol (former Manager of Planning with the city). He expressed his frustration as the Webster property (at the north just outside of boundary limit) is not shown and included in the servicing master plan study. He also mentioned that the draft plan of this area was already approved by the council. Based on our last email conversation, I understand the location option analysis to expand the urban settlement area is still underway through the GMS study. We got this information just few days before our PIC. However, we did consider the proposed entire TOR (Fenelon Trails) development for our study even a portion of area is outside of settlement boundary. After the PIC we will further revisit the planning information (development list). Please let me know if we need to consider this
1
Webster development in our servicing study or should we wait until the boundary expansion analysis is done?
Thanks Nafiur From: Leah Barrie <lbarrie@kawarthalakes.ca> Sent: Thursday, May 30, 2024 12:12 AM To: Nafiur Rahman <nrahman@kawarthalakes.ca>; Roberta Perdue <rperdue@kawarthalakes.ca> Cc: Corby Purdy <cpurdy@kawarthalakes.ca>; Christina Sisson <csisson@kawarthalakes.ca>; Juan Rojas <jrojas@kawarthalakes.ca>; John Connolly <jconnolly@kawarthalakes.ca>; Mark Jull <mjull@kawarthalakes.ca> Subject: RE: NOTICE OF PUBLIC INFORMATION CENTRE #2 - CITY OF KAWARTHA LAKES WATER AND WASTEWATER MASTER PLAN UPDATE - Fenelon Falls Webster Property
Hi Nafiur, although I’m not aware that the group submitted a specific growth consideration request through the GMS, their land is within the current secondary plan area. However, as we’re aware from the latest GMS work, although there’s a deficit of land in FF indicating a need to expand the urban settlement area, the location options analysis is underway to guide where the recommended areas for expansion should be.
Leah 2
From: Nafiur Rahman <nrahman@kawarthalakes.ca> Sent: Wednesday, May 29, 2024 9:40 AM To: Roberta Perdue <rperdue@kawarthalakes.ca>; Leah Barrie <lbarrie@kawarthalakes.ca> Cc: Corby Purdy <cpurdy@kawarthalakes.ca>; Christina Sisson <csisson@kawarthalakes.ca>; Juan Rojas <jrojas@kawarthalakes.ca>; John Connolly <jconnolly@kawarthalakes.ca> Subject: FW: NOTICE OF PUBLIC INFORMATION CENTRE #2 - CITY OF KAWARTHA LAKES WATER AND WASTEWATER MASTER PLAN UPDATE - Fenelon Falls Webster Property
Thanks, Roberta. Leah – In regard to the email below from Robbie (DGB), does Planning have any information? He referred to Mayor Elmslie’s comment (see highlighted in yellow). Nafiur From: Roberta Perdue <rperdue@kawarthalakes.ca> Sent: Tuesday, May 28, 2024 5:15 PM To: Nafiur Rahman <nrahman@kawarthalakes.ca> Cc: Christina Sisson <csisson@kawarthalakes.ca>; Corby Purdy <cpurdy@kawarthalakes.ca>; Juan Rojas <jrojas@kawarthalakes.ca> Subject: RE: NOTICE OF PUBLIC INFORMATION CENTRE #2 - CITY OF KAWARTHA LAKES WATER AND WASTEWATER MASTER PLAN UPDATE - Fenelon Falls Webster Property
Hi Nafiur Dev Eng has not received an application. I think Robbie is referring to area DP-9 (from Sched. A, CKL Official Plan – I have no idea the status the OP doc or Development Plan (DP) areas).
3
4
From: Nafiur Rahman <nrahman@kawarthalakes.ca> Sent: Tuesday, May 28, 2024 4:15 PM To: Roberta Perdue <rperdue@kawarthalakes.ca> Cc: Christina Sisson <csisson@kawarthalakes.ca>; Corby Purdy <cpurdy@kawarthalakes.ca>; Juan Rojas <jrojas@kawarthalakes.ca> Subject: FW: NOTICE OF PUBLIC INFORMATION CENTRE #2 - CITY OF KAWARTHA LAKES WATER AND WASTEWATER MASTER PLAN UPDATE - Fenelon Falls Webster Property
Hi Roberta, As per email below can you please confirm if there is any associated development application? As per 2011 GMS and Development list the only information I have – 57 units condo at 99 Louisa St (The Moorings on Cameron) Thanks Nafiur From: Robbie Larocque <robbie.larocque@dgbiddle.com> Sent: Tuesday, May 28, 2024 3:21 PM To: Sydney McIvor <sydney.mcivor@tylin.com>; kevin.brown@TYLin.com; Nafiur Rahman <nrahman@kawarthalakes.ca> Cc: Jim Webster <jwebster@i-zoom.net> Subject: RE: NOTICE OF PUBLIC INFORMATION CENTRE #2 - CITY OF KAWARTHA LAKES WATER AND WASTEWATER MASTER PLAN UPDATE - Fenelon Falls Webster Property Good afternoon, I am writing you at the request of our Client Jim Webster. Mr Webster has land holdings at the North/west quadrant of the Village of Fenelon Falls. The property has frontage on Louisa Street, Queen Street, Princes Street, Robson Road and Albert Streets. I am asked to remind the team who are preparing the City of Kawartha Lakes Water and Wastewater Master Plan to have appropriate regard for this property in your work assignment. Yesterday I was reminded by our Client of a personal conversation and commitment from Mayor Doug Elsmlie that this property would be serviced with the Master Planning work. Thank you in advance for your attention to this property. We look forward to your presentation on June 19, 2024 in Fenelon Falls. Thanks,
ROBBIE LAROCQUE, P. Eng. Senior Consulting Engineer, Partner Civil Group 96 King Street East, Oshawa, ON L1H 1B6 905-576-8500 dgbiddle.com
5
CIVIL | STRUCTURAL | MECHANICAL | ELECTRICAL | PLANNING Please note, staff at D.G. Biddle & Associates Ltd. will respond to messages during their regular working hours as per the Employment Standards Act. PRIVILEGE AND CONFIDENTIALITY NOTICE: As regulated by the Personal Information Protection and Electronic Documents Act, S.C.2000 C5, this electronic transmission, including all attachments, is directed in confidence to the person(s) to which it is addressed, or an authorized recipient, and may not otherwise be distributed, copied, printed, or disclosed. If you have received this electronic transmission in error, please notify the sender immediately by return transmission and then immediately delete this transmission, including all attachments, without copying, printing, distributing, or disclosing same.
From: Sydney McIvor <sydney.mcivor@tylin.com> Sent: Friday, May 24, 2024 10:52 AM To: Robbie Larocque <robbie.larocque@dgbiddle.com> Subject: NOTICE OF PUBLIC INFORMATION CENTRE #2 - CITY OF KAWARTHA LAKES WATER AND WASTEWATER MASTER PLAN UPDATE Dear Stakeholder, T.Y. Lin International Canada Inc. has been retained by the City of Kawartha Lakes to assist in undertaking a Municipal Class Environmental Assessment (EA) with respect to updating the Water and Wastewater Master Plan. Please review the attached file containing details of the Water and Wastewater Master Plan Public Information Centre #2 (PIC) for the City of Kawartha Lakes. If you have any questions, please feel free to contact Project Manager Kevin Brown, as noted in the letter. Thank you,
Sydney McIvor CIVIL E.I.T. – WATER LINEAR T +1 905.738.5700
TYLin
209 Dundas Street East Suite 301 Whitby, ON L1N 7H8, Canada TYLin.com
This message, including any attachments, is privileged and intended only for the addressee(s) named above. If you are not the intended recipient, you must not read, use or disseminate the information contained in this e-mail. If you have received this e-mail in error, please notify the sender immediately by telephone, fax, or e-mail and shred this confidential e-mail, including any attachments, without making a copy. Access to this e-mail by anyone else is unauthorized.
6
Sydney Mcivor From: Sent: To: Subject:
nrahman Thursday, June 20, 2024 11:55 AM Kevin Brown; Vardhini Parvatham FW: Fenelon Falls Webster Property
FYI From: Leah Barrie <lbarrie@kawarthalakes.ca> Sent: Thursday, June 20, 2024 11:48 AM To: Nafiur Rahman <nrahman@kawarthalakes.ca> Cc: John Connolly <jconnolly@kawarthalakes.ca>; Mark Jull <mjull@kawarthalakes.ca> Subject: RE: Fenelon Falls Webster Property
Thanks for the question, Nafiur. Our recommendation is that you wait until the boundary expansion analysis is done. A portion of the Webster property has some rural development permissions under OP designation DP-9. I don’t see confirmation of a ‘draft approved’ plan of subdivision, and the proponent will be asked to provide this.
Leah From: Nafiur Rahman <nrahman@kawarthalakes.ca> Sent: Thursday, June 20, 2024 11:44 AM To: Leah Barrie <lbarrie@kawarthalakes.ca> Cc: John Connolly <jconnolly@kawarthalakes.ca>; Mark Jull <mjull@kawarthalakes.ca> Subject: Fenelon Falls Webster Property
Hi Leah, In last night’s PIC at Fenelon Falls, I met with Dough Carrol (former Manager of Planning with the city). He expressed his frustration as the Webster property (at the north just outside of boundary limit) is not shown and included in the servicing master plan study. He also mentioned that the draft plan of this area was already approved by the council. Based on our last email conversation, I understand the location option analysis to expand the urban settlement area is still underway through the GMS study. We got this information just few days before our PIC. However, we did consider the proposed entire TOR (Fenelon Trails) development for our study even a portion of area is outside of settlement boundary. After the PIC we will further revisit the planning information (development list). Please let me know if we need to consider this Webster development in our servicing study or should we wait until the boundary expansion analysis is done?
1
Thanks Nafiur From: Leah Barrie <lbarrie@kawarthalakes.ca> Sent: Thursday, May 30, 2024 12:12 AM To: Nafiur Rahman <nrahman@kawarthalakes.ca>; Roberta Perdue <rperdue@kawarthalakes.ca> Cc: Corby Purdy <cpurdy@kawarthalakes.ca>; Christina Sisson <csisson@kawarthalakes.ca>; Juan Rojas <jrojas@kawarthalakes.ca>; John Connolly <jconnolly@kawarthalakes.ca>; Mark Jull <mjull@kawarthalakes.ca> Subject: RE: NOTICE OF PUBLIC INFORMATION CENTRE #2 - CITY OF KAWARTHA LAKES WATER AND WASTEWATER MASTER PLAN UPDATE - Fenelon Falls Webster Property
Hi Nafiur, although I’m not aware that the group submitted a specific growth consideration request through the GMS, their land is within the current secondary plan area. However, as we’re aware from the latest GMS work, although there’s a deficit of land in FF indicating a need to expand the urban settlement area, the location options analysis is underway to guide where the recommended areas for expansion should be.
Leah From: Nafiur Rahman <nrahman@kawarthalakes.ca> Sent: Wednesday, May 29, 2024 9:40 AM To: Roberta Perdue <rperdue@kawarthalakes.ca>; Leah Barrie <lbarrie@kawarthalakes.ca> 2
Cc: Corby Purdy <cpurdy@kawarthalakes.ca>; Christina Sisson <csisson@kawarthalakes.ca>; Juan Rojas <jrojas@kawarthalakes.ca>; John Connolly <jconnolly@kawarthalakes.ca> Subject: FW: NOTICE OF PUBLIC INFORMATION CENTRE #2 - CITY OF KAWARTHA LAKES WATER AND WASTEWATER MASTER PLAN UPDATE - Fenelon Falls Webster Property
Thanks, Roberta. Leah – In regard to the email below from Robbie (DGB), does Planning have any information? He referred to Mayor Elmslie’s comment (see highlighted in yellow). Nafiur From: Roberta Perdue <rperdue@kawarthalakes.ca> Sent: Tuesday, May 28, 2024 5:15 PM To: Nafiur Rahman <nrahman@kawarthalakes.ca> Cc: Christina Sisson <csisson@kawarthalakes.ca>; Corby Purdy <cpurdy@kawarthalakes.ca>; Juan Rojas <jrojas@kawarthalakes.ca> Subject: RE: NOTICE OF PUBLIC INFORMATION CENTRE #2 - CITY OF KAWARTHA LAKES WATER AND WASTEWATER MASTER PLAN UPDATE - Fenelon Falls Webster Property
Hi Nafiur Dev Eng has not received an application. I think Robbie is referring to area DP-9 (from Sched. A, CKL Official Plan – I have no idea the status the OP doc or Development Plan (DP) areas).
3
4
From: Nafiur Rahman <nrahman@kawarthalakes.ca> Sent: Tuesday, May 28, 2024 4:15 PM To: Roberta Perdue <rperdue@kawarthalakes.ca> Cc: Christina Sisson <csisson@kawarthalakes.ca>; Corby Purdy <cpurdy@kawarthalakes.ca>; Juan Rojas <jrojas@kawarthalakes.ca> Subject: FW: NOTICE OF PUBLIC INFORMATION CENTRE #2 - CITY OF KAWARTHA LAKES WATER AND WASTEWATER MASTER PLAN UPDATE - Fenelon Falls Webster Property
Hi Roberta, As per email below can you please confirm if there is any associated development application? As per 2011 GMS and Development list the only information I have – 57 units condo at 99 Louisa St (The Moorings on Cameron) Thanks Nafiur From: Robbie Larocque <robbie.larocque@dgbiddle.com> Sent: Tuesday, May 28, 2024 3:21 PM To: Sydney McIvor <sydney.mcivor@tylin.com>; kevin.brown@TYLin.com; Nafiur Rahman <nrahman@kawarthalakes.ca> Cc: Jim Webster < > Subject: RE: NOTICE OF PUBLIC INFORMATION CENTRE #2 - CITY OF KAWARTHA LAKES WATER AND WASTEWATER MASTER PLAN UPDATE - Fenelon Falls Webster Property Good afternoon, I am writing you at the request of our Client Jim Webster. Mr Webster has land holdings at the North/west quadrant of the Village of Fenelon Falls. The property has frontage on Louisa Street, Queen Street, Princes Street, Robson Road and Albert Streets. I am asked to remind the team who are preparing the City of Kawartha Lakes Water and Wastewater Master Plan to have appropriate regard for this property in your work assignment. Yesterday I was reminded by our Client of a personal conversation and commitment from Mayor Doug Elsmlie that this property would be serviced with the Master Planning work. Thank you in advance for your attention to this property. We look forward to your presentation on June 19, 2024 in Fenelon Falls. Thanks,
ROBBIE LAROCQUE, P. Eng. Senior Consulting Engineer, Partner Civil Group 96 King Street East, Oshawa, ON L1H 1B6 905-576-8500 dgbiddle.com
5
CIVIL | STRUCTURAL | MECHANICAL | ELECTRICAL | PLANNING Please note, staff at D.G. Biddle & Associates Ltd. will respond to messages during their regular working hours as per the Employment Standards Act. PRIVILEGE AND CONFIDENTIALITY NOTICE: As regulated by the Personal Information Protection and Electronic Documents Act, S.C.2000 C5, this electronic transmission, including all attachments, is directed in confidence to the person(s) to which it is addressed, or an authorized recipient, and may not otherwise be distributed, copied, printed, or disclosed. If you have received this electronic transmission in error, please notify the sender immediately by return transmission and then immediately delete this transmission, including all attachments, without copying, printing, distributing, or disclosing same.
From: Sydney McIvor <sydney.mcivor@tylin.com> Sent: Friday, May 24, 2024 10:52 AM To: Robbie Larocque <robbie.larocque@dgbiddle.com> Subject: NOTICE OF PUBLIC INFORMATION CENTRE #2 - CITY OF KAWARTHA LAKES WATER AND WASTEWATER MASTER PLAN UPDATE Dear Stakeholder, T.Y. Lin International Canada Inc. has been retained by the City of Kawartha Lakes to assist in undertaking a Municipal Class Environmental Assessment (EA) with respect to updating the Water and Wastewater Master Plan. Please review the attached file containing details of the Water and Wastewater Master Plan Public Information Centre #2 (PIC) for the City of Kawartha Lakes. If you have any questions, please feel free to contact Project Manager Kevin Brown, as noted in the letter. Thank you,
Sydney McIvor CIVIL E.I.T. – WATER LINEAR T +1 905.738.5700
TYLin
209 Dundas Street East Suite 301 Whitby, ON L1N 7H8, Canada TYLin.com
This message, including any attachments, is privileged and intended only for the addressee(s) named above. If you are not the intended recipient, you must not read, use or disseminate the information contained in this e-mail. If you have received this e-mail in error, please notify the sender immediately by telephone, fax, or e-mail and shred this confidential e-mail, including any attachments, without making a copy. Access to this e-mail by anyone else is unauthorized.
6
Sydney Mcivor From: Sent: To: Cc: Subject:
Michael Smith <michael@msplanning.ca> Wednesday, July 10, 2024 4:47 PM Kevin Brown; Sydney Mcivor nrahman PUBLIC INFORMATION CENTRE #2 PRESENTATION AND FEEDBACK – CITY OF KAWARTHA LAKES WATER AND WASTEWATER MASTER PLAN UPDATE
Follow Up Flag: Flag Status:
Follow up Flagged
Kevin My email was meant for one of my planners to follow up with you regarding servicing capacity in Lindsay. We work in other municipali es where servicing capacity is not available (Keswick, Su on, Uxbridge, Cannington, Beaverton, Holland Landing) where servicing capacity is limited or non-existent at this me. Are you able to confirm if there is exis ng water and sewage plant capacity for development in Lindsay? Thanks, Michael Michael Smith, RPP Michael Smith Planning Consultants; Development Coordinators Ltd. 279 The Queensway South, Keswick, ON, L4P 2B4 905-535-5500
From: Kevin Brown <kevin.brown@tylin.com> Sent: Tuesday, July 9, 2024 9:19 AM To: Michael Smith <michael@msplanning.ca>; Sydney Mcivor <sydney.mcivor@tylin.com> Cc: nrahman <nrahman@kawarthalakes.ca> Subject: RE: PUBLIC INFORMATION CENTRE #2 PRESENTATION AND FEEDBACK – CITY OF KAWARTHA LAKES WATER AND WASTEWATER MASTER PLAN UPDATE Michael: Thank you for your interest in the Kawartha Lakes Water and Wastewater Master Plan. It is not clear whether this was a question for the Study Team, or whether it was intended to be internal. Please advise whether you have a question for the Team. Regards, -Kevin
1
Kevin Brown, P.Eng. (he, him) SENIOR MUNICIPAL ENGINEER TEAM LEAD - HYDRAULICS AND INFRASTRUCTURE PLANNING M +1 416.843.4689
TYLin
From: Michael Smith <michael@msplanning.ca> Sent: Friday, June 28, 2024 2:44 PM To: Sydney Mcivor <sydney.mcivor@tylin.com> Cc: Kevin Brown <kevin.brown@tylin.com>; nrahman <nrahman@kawarthalakes.ca> Subject: RE: PUBLIC INFORMATION CENTRE #2 PRESENTATION AND FEEDBACK – CITY OF KAWARTHA LAKES WATER AND WASTEWATER MASTER PLAN UPDATE Andrea Please review. We need to understand if there is servicing capacity for the Davidson site. See if you can pick up some relevant informa on. Michael Michael Smith, RPP Michael Smith Planning Consultants; Development Coordinators Ltd. 279 The Queensway South, Keswick, ON, L4P 2B4 905-535-5500
From: Sydney Mcivor <sydney.mcivor@tylin.com> Sent: Friday, June 28, 2024 12:02 PM To: Sydney Mcivor <sydney.mcivor@tylin.com> Cc: Kevin Brown <kevin.brown@tylin.com>; nrahman <nrahman@kawarthalakes.ca> Subject: PUBLIC INFORMATION CENTRE #2 PRESENTATION AND FEEDBACK – CITY OF KAWARTHA LAKES WATER AND WASTEWATER MASTER PLAN UPDATE Dear Stakeholder, T.Y. Lin International Canada Inc. has been retained by the City of Kawartha Lakes to assist in undertaking a Municipal Class Environmental Assessment (EA) with respect to updating the Water and Wastewater Master Plan. The Water and Wastewater Master Plan Public Information Centre #2 (PIC) for the City of Kawartha Lakes took place last week. The presentation slides, video, and comment forms are now available on the City of Kawartha Lakes website. To Access the Presentation and Feedback: https://www.kawarthalakes.ca/en/municipal-services/major-projects.aspx Scroll down to the “City-wide” section, click on “Water and Wastewater Servicing and Capacity Master Plan”, then click on “Public Information Centre 2 Presentation and Feedback”. 2
Thank you,
Sydney McIvor CIVIL E.I.T. – WATER LINEAR T +1 905.738.5700
TYLin
209 Dundas Street East Suite 301 Whitby, ON L1N 7H8, Canada TYLin.com
3
Sydney Mcivor From: Sent: To: Cc: Subject:
Kevin Brown Tuesday, July 9, 2024 9:19 AM Michael Smith; Sydney Mcivor nrahman RE: PUBLIC INFORMATION CENTRE #2 PRESENTATION AND FEEDBACK – CITY OF KAWARTHA LAKES WATER AND WASTEWATER MASTER PLAN UPDATE
Follow Up Flag: Flag Status:
Follow up Flagged
Michael: Thank you for your interest in the Kawartha Lakes Water and Wastewater Master Plan. It is not clear whether this was a question for the Study Team, or whether it was intended to be internal. Please advise whether you have a question for the Team. Regards, -Kevin
Kevin Brown, P.Eng. (he, him) SENIOR MUNICIPAL ENGINEER TEAM LEAD - HYDRAULICS AND INFRASTRUCTURE PLANNING M +1 416.843.4689
From: Michael Smith <michael@msplanning.ca> Sent: Friday, June 28, 2024 2:44 PM To: Sydney Mcivor <sydney.mcivor@tylin.com> Cc: Kevin Brown <kevin.brown@tylin.com>; nrahman <nrahman@kawarthalakes.ca> Subject: RE: PUBLIC INFORMATION CENTRE #2 PRESENTATION AND FEEDBACK – CITY OF KAWARTHA LAKES WATER AND WASTEWATER MASTER PLAN UPDATE Andrea Please review. We need to understand if there is servicing capacity for the Davidson site. See if you can pick up some relevant informa on. Michael Michael Smith, RPP Michael Smith Planning Consultants; Development Coordinators Ltd. 279 The Queensway South, Keswick, ON, L4P 2B4 1
905-535-5500
From: Sydney Mcivor <sydney.mcivor@tylin.com> Sent: Friday, June 28, 2024 12:02 PM To: Sydney Mcivor <sydney.mcivor@tylin.com> Cc: Kevin Brown <kevin.brown@tylin.com>; nrahman <nrahman@kawarthalakes.ca> Subject: PUBLIC INFORMATION CENTRE #2 PRESENTATION AND FEEDBACK – CITY OF KAWARTHA LAKES WATER AND WASTEWATER MASTER PLAN UPDATE Dear Stakeholder, T.Y. Lin International Canada Inc. has been retained by the City of Kawartha Lakes to assist in undertaking a Municipal Class Environmental Assessment (EA) with respect to updating the Water and Wastewater Master Plan. The Water and Wastewater Master Plan Public Information Centre #2 (PIC) for the City of Kawartha Lakes took place last week. The presentation slides, video, and comment forms are now available on the City of Kawartha Lakes website. To Access the Presentation and Feedback: https://www.kawarthalakes.ca/en/municipal-services/major-projects.aspx Scroll down to the “City-wide” section, click on “Water and Wastewater Servicing and Capacity Master Plan”, then click on “Public Information Centre 2 Presentation and Feedback”. Thank you,
Sydney McIvor CIVIL E.I.T. – WATER LINEAR T +1 905.738.5700
TYLin
209 Dundas Street East Suite 301 Whitby, ON L1N 7H8, Canada TYLin.com
2
Sydney Mcivor From: Sent: To: Cc: Subject:
Michael Smith <michael@msplanning.ca> Thursday, July 11, 2024 9:24 AM Kevin Brown nrahman; Sydney Mcivor; Andrea Fernandes RE: PUBLIC INFORMATION CENTRE #2 PRESENTATION AND FEEDBACK – CITY OF KAWARTHA LAKES WATER AND WASTEWATER MASTER PLAN UPDATE
Follow Up Flag: Flag Status:
Follow up Flagged
Thanks Kevin I appreciate your prompt response. You have been very helpful. Michael Michael Smith, RPP Michael Smith Planning Consultants; Development Coordinators Ltd. 279 The Queensway South, Keswick, ON, L4P 2B4 905-535-5500
From: Kevin Brown <kevin.brown@tylin.com> Sent: Thursday, July 11, 2024 8:25 AM To: Michael Smith <michael@msplanning.ca> Cc: nrahman <nrahman@kawarthalakes.ca>; Sydney Mcivor <sydney.mcivor@tylin.com> Subject: RE: PUBLIC INFORMATION CENTRE #2 PRESENTATION AND FEEDBACK – CITY OF KAWARTHA LAKES WATER AND WASTEWATER MASTER PLAN UPDATE Michael: There are restrictions in both the Water and Wastewater Plants in Lindsay, and upgrades to the overall treatment capacities will be required to support full buildout of all of the lands currently identified for development. The PIC Boards indicated that the Water Plant (at 100% capacity) can service a community population of approximately 35,000 residents (plus associated employment uses). Plans for plant upgrades should be in place by the time the plant reaches 80% of its capacity (we estimate a community population of approximately 29,000). The Wastewater Plant can accommodate more growth. It can support a population of approximately 47,000, and plans for upgrading should be in place at about 37,000 residents. The slides and a recording of the presentation are available on the Project Website. Go to https://www.kawarthalakes.ca/en/municipal-services/major-projects.aspx, scroll-down to City-wide and expand the Water and Wastewater Servicing and Capacity Master Plan menu. Regards, 1
-Kevin
Kevin Brown, P.Eng. (he, him) SENIOR MUNICIPAL ENGINEER TEAM LEAD - HYDRAULICS AND INFRASTRUCTURE PLANNING M +1 416.843.4689
TYLin
From: Michael Smith <michael@msplanning.ca> Sent: Wednesday, July 10, 2024 4:47 PM To: Kevin Brown <kevin.brown@tylin.com>; Sydney Mcivor <sydney.mcivor@tylin.com> Cc: nrahman <nrahman@kawarthalakes.ca> Subject: PUBLIC INFORMATION CENTRE #2 PRESENTATION AND FEEDBACK – CITY OF KAWARTHA LAKES WATER AND WASTEWATER MASTER PLAN UPDATE You don't often get email from michael@msplanning.ca. Learn why this is important
Kevin My email was meant for one of my planners to follow up with you regarding servicing capacity in Lindsay. We work in other municipali es where servicing capacity is not available (Keswick, Su on, Uxbridge, Cannington, Beaverton, Holland Landing) where servicing capacity is limited or non-existent at this me. Are you able to confirm if there is exis ng water and sewage plant capacity for development in Lindsay? Thanks, Michael Michael Smith, RPP Michael Smith Planning Consultants; Development Coordinators Ltd. 279 The Queensway South, Keswick, ON, L4P 2B4 905-535-5500
From: Kevin Brown <kevin.brown@tylin.com> Sent: Tuesday, July 9, 2024 9:19 AM To: Michael Smith <michael@msplanning.ca>; Sydney Mcivor <sydney.mcivor@tylin.com> Cc: nrahman <nrahman@kawarthalakes.ca> Subject: RE: PUBLIC INFORMATION CENTRE #2 PRESENTATION AND FEEDBACK – CITY OF KAWARTHA LAKES WATER AND WASTEWATER MASTER PLAN UPDATE Michael: Thank you for your interest in the Kawartha Lakes Water and Wastewater Master Plan. It is not clear whether this was a question for the Study Team, or whether it was intended to be internal. 2
Please advise whether you have a question for the Team. Regards, -Kevin
Kevin Brown, P.Eng. (he, him) SENIOR MUNICIPAL ENGINEER TEAM LEAD - HYDRAULICS AND INFRASTRUCTURE PLANNING M +1 416.843.4689
TYLin
From: Michael Smith <michael@msplanning.ca> Sent: Friday, June 28, 2024 2:44 PM To: Sydney Mcivor <sydney.mcivor@tylin.com> Cc: Kevin Brown <kevin.brown@tylin.com>; nrahman <nrahman@kawarthalakes.ca> Subject: RE: PUBLIC INFORMATION CENTRE #2 PRESENTATION AND FEEDBACK – CITY OF KAWARTHA LAKES WATER AND WASTEWATER MASTER PLAN UPDATE Andrea Please review. We need to understand if there is servicing capacity for the Davidson site. See if you can pick up some relevant informa on. Michael Michael Smith, RPP Michael Smith Planning Consultants; Development Coordinators Ltd. 279 The Queensway South, Keswick, ON, L4P 2B4 905-535-5500
From: Sydney Mcivor <sydney.mcivor@tylin.com> Sent: Friday, June 28, 2024 12:02 PM To: Sydney Mcivor <sydney.mcivor@tylin.com> Cc: Kevin Brown <kevin.brown@tylin.com>; nrahman <nrahman@kawarthalakes.ca> Subject: PUBLIC INFORMATION CENTRE #2 PRESENTATION AND FEEDBACK – CITY OF KAWARTHA LAKES WATER AND WASTEWATER MASTER PLAN UPDATE Dear Stakeholder, T.Y. Lin International Canada Inc. has been retained by the City of Kawartha Lakes to assist in undertaking a Municipal Class Environmental Assessment (EA) with respect to updating the Water and Wastewater Master Plan. The Water and Wastewater Master Plan Public Information Centre #2 (PIC) for the City of Kawartha Lakes took place last week. The presentation slides, video, and comment forms are now available on the City of Kawartha Lakes website. To Access the Presentation and Feedback: 3
https://www.kawarthalakes.ca/en/municipal-services/major-projects.aspx Scroll down to the “City-wide” section, click on “Water and Wastewater Servicing and Capacity Master Plan”, then click on “Public Information Centre 2 Presentation and Feedback”. Thank you,
Sydney McIvor CIVIL E.I.T. – WATER LINEAR T +1 905.738.5700
TYLin
209 Dundas Street East Suite 301 Whitby, ON L1N 7H8, Canada TYLin.com
4
Sydney Mcivor From: Sent: To: Subject:
Kevin Brown Tuesday, July 9, 2024 9:26 AM Sydney Mcivor FW: Water & Wastewater Master Servicing Study
Follow Up Flag: Flag Status:
Follow up Flagged
Kevin Brown, P.Eng. (he, him) SENIOR MUNICIPAL ENGINEER TEAM LEAD - HYDRAULICS AND INFRASTRUCTURE PLANNING M +1 416.843.4689
From: < > Sent: Wednesday, June 19, 2024 10:03 PM To: Kevin Brown <Kevin.Brown@TYLin.com> Subject: Water & Wastewater Master Servicing Study You don't often get email from cmlgravely@yahoo.com. Learn why this is important
Hello Mr Brown, I have just returned from your presentation in Fenelon Falls and I thought I would email you, since that meeting was going over the expected time and you were facing a lot of opinions from members of the public. As background - I was an Urban Planning consultant for my 40+ yr career (20 years as a partner in SGL Planning), so I was sympathetic to your position in responding to the public. I thought you gave a very clear presentation, on a technical subject. My issues: 1. I live on Sturgeon Lake within Bobcaygeon - on Perfectus Point (which is adjacent to Beach Park). I see that you have our local water distribution shown as RED dots on the streets on this point - ie. less than 0 l/s. I believe that this indicates a concern for firefighting capacity. I wonder if this is from actual tests or merely from mathematical modelling? I ask because I have extraordinarily strong water pressure at the end of Manor Road. There is a hydrant next to my address (it is not shown on your maps) and the pressure seems quite powerful when it is flushed each year. The water pressure within my house or at my garden tap is extremely strong. My plumber has suggested that I consider a valve to control it, for fear of pipe joints breaking under this pressure but I enjoy the fierce pressure in the bathroom showers. Every guest comments about it, so I question the RED designation.
1
2. My second concern is about the water quality of Sturgeon Lake and surrounding water bodies in the Trent System. These lakes are artificially created from rivers and they are extremely shallow (average 12-18 ft deep), with earth bottoms (as opposed to much greater depth and a granite base, farther north). We are already seeing greater algae blooms on the lakes as global warming increases temperatures in these lakes in recent years. If more treated effluent is added, it will increase the phosphorus load of shallow, weedy lakes. I know that there are different treatment options but Lake Simcoe has had issues with the phosphorus load from Holland Marsh & I wonder if staff and Council here are knowledgeable about the risk to these lakes. When I was a child in the 1960s, my family owned a cottage on Pigeon Lake's east side opposite to Bobcaygeon (prior to a swage treatment plant & sewers being built & used in the village). By mid-July every summer there would be a thick blue-green scum, making it impossible to swim or even fish. It looked like thick pea soup. The stink spread a considerable distance away from the lake. This putrid situation continued until sometime in August. Finally, a major rainstorm would sink the thick scum and water could be seen again on the lake's surface. If the lakes are overloaded with treated effluent (which is fertilizer), due to the projected growth, I worry that the noxious situation could soon return. Both Lindsay and Fenelon Falls send their treated effluent to Sturgeon Lake. Will this large planned growth in Lindsay destroy the recreational resource provided by Sturgeon Lake and along the Trent-Severn system? Is anyone worried about that? Council seems oblivious - former Councillors supported the MZO's prior to any engineering study or any consideration of impact on the recreation resource (& economic sector) that the lakes provide. 3. My third issue is the boundary of Bobcaygeon. The Ontario Land Tribunal severely curbed City's boundary in Bobcaygeon that you are showing. It stops just south of Little Bob River; plus areas to the northeast and northwest of the community were also removed. (I participated in that Hearing.) You are showing the boundary prior to their decision (& it now forms the legal determination). The pink areas south of Little Bob River refer to a plan on the west that has lost its draft-approved status (& its capacity has been reallocated), and an area on the south east is one that the City approved but the OLT has not yet approved to be added. The Hearing on it's merits is scheduled for this fall I believe. Following my concern of boundaries, where are 9,000 people going to live in Bobcaygeon?? The land within the existing boundary is mostly developed with its population of 3500 and a few small planned developments. If you are undertaking this Master Plan, then the City should know where the additional growth is planned. Even the expanded boundary that you are showing has little space for residential growth (most of it is planned Commercial). I see no evidence that City staff have provided adequate boundaries to accommodate the new population and jobs that would triple the current size of the community. [In my forty+ years of experience within this community, staff rarely leave their Lindsay offices and seem to have little knowledge of Bobcaygeon.] Have you been here? If you can respond to these concerns, I would be grateful. 2
thank you,
3
Kawartha Jump ln COMMENT SHEET
water and wastewater servicing and capacity Master plan update Environmental Assessment Study Public lnformation Centre #2: THURSDAv, JUNE 2orH,2oz4l G:00-8:00 pM
City Hall - Victoria Room, 26 Francis St., Lindsay, ON Your opinion is important to us. Please take a moment to complete this comment sheet. You can deposit it in the comment box or complete it later and submit it by mail or e-mail. Please provide your contact information below
Name: Address:
+gwf]ullEtlre Ef,€if*rhhEtts: Do you want to be added to the project mailing list?
Comments:
€
S
H
r
[[Yes [ ] No
Wo vld like +6 bq ke p* u p DqlEd On
dw
Wai f
I c
s Fo
c
t
n
(
qI r
taa
ow MoAy Peopl? r^ Few Yeqrs
e
PTEASE PUT THIS COMMENT SHEET lN THE COMMENT BOX eROV|DED, OR MAtt/E-MAtL TO:
Kevin Brown, P.Eng. Project Manager T.Y.Lin lnternational Canada lnc (28e1349-L902 Kevin. Brown @TYLin.com
Nafiur Rahman, P.Eng., PMP Supervisor, Environ mental Capital Project Management Engineering and Corporate Assets City of Kawartha Lakes 705-324-94L1ext. 1193 nrahman@ka
alakes.ca
Please note that information will be collected in accordance with the Municipal Freedom of tnformotion and privocy protection Act. With the exception of personal information, all comments will become part of the public record.
July 25, 2024 Brian Houghton 603 – 111 William St N Lindsay, ON K9V 4Z8
Dear Stakeholder, Re: CITY OF KAWARTHA LAKES WATER-WASTEWATER MASTER PLAN UPDATE MUNICIPAL CLASS ENVIRONMENTAL ASSESSMENT – COMMENT SUBMISSION T.Y. Lin acknowledges the receipt of your comment regarding the City of Kawartha Lakes WaterWastewater Master Plan Update Municipal Class Environmental Assessment. You have been added to the mailing list for this project. All future communications will be mailed to the address provided on your comment sheet. In response to your question: The current population of Lindsay is 24,276 people. It is estimated that this will grow to 74,313 people by the year 2051. This is a growth of approximately 50,000 people over the next 25 years, which amounts to an average increase of 2,000 people per year. NOTE - This is a high-level estimate, we cannot guarantee the accuracy. The forecasted population values can be found on slide 6 of the Public Information Centre #2 presentation, which is posted on the City of Kawartha Lakes website under Municipal Services – Major Projects – City Wide. We appreciate your participation in the public consultation process. Please let us know if you have any further questions. T.Y. Lin International Canada Inc.
Kevin Brown, P.Eng. Project Manager | Senior Municipal Engineer Email: Kevin.Brown@TYLin.com cc: Nafiur Rahman, City of Kawartha Lakes
Charlotte Black From: Sent: To: Subject: Attachments:
Sydney Mcivor Wednesday, July 31, 2024 7:57 AM Charlotte Black FW: PUBLIC INFORMATION CENTRE #2 PRESENTATION AND FEEDBACK – CITY OF KAWARTHA LAKES WATER AND WASTEWATER MASTER PLAN UPDATE 104008 20240730 RML comments to PIC #2 WWSCMPU.pdf
Log this communication, please
Sydney McIvor CIVIL E.I.T. – WATER LINEAR
From: Robbie Larocque <robbie.larocque@dgbiddle.com> Sent: Tuesday, July 30, 2024 4:41 PM To: Sydney Mcivor <sydney.mcivor@tylin.com> Cc: Kevin Brown <kevin.brown@tylin.com>; nrahman <nrahman@kawarthalakes.ca> Subject: RE: PUBLIC INFORMATION CENTRE #2 PRESENTATION AND FEEDBACK – CITY OF KAWARTHA LAKES WATER AND WASTEWATER MASTER PLAN UPDATE
Good afternoon, I submit a Comment Sheet with respect to the recent PIC # 2. I am trying to understand how your work will integrate the findings of the Growth Management Strategy, GMS, which is not intended to be complete for some time based I my review of the Documentation available on-line. During the PIC it was suggested during the question and answer period that your work would gain direction for population from the GMS. Can you advise when your Update gain feedback from the GMS which remains a work in progress. Thanks,
ROBBIE LAROCQUE, P. Eng. Senior Consulting Engineer, Partner Civil Group 96 King Street East, Oshawa, ON L1H 1B6 905-576-8500 dgbiddle.com
CIVIL | STRUCTURAL | MECHANICAL | ELECTRICAL | PLANNING Please note, staff at D.G. Biddle & Associates Ltd. will respond to messages during their regular working hours as per the Employment Standards Act. PRIVILEGE AND CONFIDENTIALITY NOTICE: As regulated by the Personal Information Protection and Electronic Documents Act, S.C.2000 C5, this electronic transmission, including all attachments, is directed in confidence to the person(s) to which it is addressed, or an authorized recipient, and may not otherwise be distributed, copied, printed, or disclosed. If you have received this electronic transmission in error, please notify the sender immediately by return transmission and then immediately delete this transmission, including all attachments, without copying, printing, distributing, or disclosing same. 1
From: Sydney Mcivor <sydney.mcivor@tylin.com> Sent: Friday, June 28, 2024 12:02 PM To: Sydney Mcivor <sydney.mcivor@tylin.com> Cc: Kevin Brown <kevin.brown@tylin.com>; nrahman <nrahman@kawarthalakes.ca> Subject: PUBLIC INFORMATION CENTRE #2 PRESENTATION AND FEEDBACK – CITY OF KAWARTHA LAKES WATER AND WASTEWATER MASTER PLAN UPDATE Dear Stakeholder, T.Y. Lin International Canada Inc. has been retained by the City of Kawartha Lakes to assist in undertaking a Municipal Class Environmental Assessment (EA) with respect to updating the Water and Wastewater Master Plan. The Water and Wastewater Master Plan Public Information Centre #2 (PIC) for the City of Kawartha Lakes took place last week. The presentation slides, video, and comment forms are now available on the City of Kawartha Lakes website. To Access the Presentation and Feedback: https://www.kawarthalakes.ca/en/municipal-services/major-projects.aspx Scroll down to the “City-wide” section, click on “Water and Wastewater Servicing and Capacity Master Plan”, then click on “Public Information Centre 2 Presentation and Feedback”. Thank you,
Sydney McIvor CIVIL E.I.T. – WATER LINEAR T +1 905.738.5700
TYLin
209 Dundas Street East Suite 301 Whitby, ON L1N 7H8, Canada TYLin.com
2
Charlotte Black From: Sent: To: Subject: Attachments:
Sydney Mcivor Wednesday, July 31, 2024 3:09 PM Charlotte Black FW: PUBLIC INFORMATION CENTRE #2 PRESENTATION AND FEEDBACK – CITY OF KAWARTHA LAKES WATER AND WASTEWATER MASTER PLAN UPDATE [MCM File 0020031] 2024-06-04 RE_MCM Follow-Up_ KawarthaLakes_WaterWastewaterMasterPlan.msg
Sydney McIvor CIVIL E.I.T. – WATER LINEAR
From: Minkin, Dan (MCM) <Dan.Minkin@ontario.ca> Sent: Wednesday, July 31, 2024 2:52 PM To: Sydney Mcivor <sydney.mcivor@tylin.com> Cc: Kevin Brown <kevin.brown@tylin.com>; nrahman <nrahman@kawarthalakes.ca> Subject: RE: PUBLIC INFORMATION CENTRE #2 PRESENTATION AND FEEDBACK – CITY OF KAWARTHA LAKES WATER AND WASTEWATER MASTER PLAN UPDATE [MCM File 0020031] Good afternoon, Thank you for the opportunity to review these PIC materials. Since it was not addressed directly in the presentation, I was wondering what was determined vis a vis the scope / timelines of cultural heritage report(s) and archaeological assessment(s) for Schedule B components. See attached email thread following from the Notice of PIC in May. Thanks! Dan Minkin Heritage Planner | Heritage Operations Branch Ministry of Citizenship and Multiculturalism | Ontario Public Service 416-786-7553 | dan.minkin@ontario.ca
Taking pride in strengthening Ontario, its places and its people From: Sydney Mcivor <sydney.mcivor@tylin.com> Sent: Friday, June 28, 2024 12:02 PM To: Sydney Mcivor <sydney.mcivor@tylin.com> Cc: Kevin Brown <kevin.brown@tylin.com>; nrahman <nrahman@kawarthalakes.ca> Subject: PUBLIC INFORMATION CENTRE #2 PRESENTATION AND FEEDBACK – CITY OF KAWARTHA LAKES WATER AND WASTEWATER MASTER PLAN UPDATE CAUTION -- EXTERNAL E-MAIL - Do not click links or open attachments unless you recognize the sender. Dear Stakeholder, T.Y. Lin International Canada Inc. has been retained by the City of Kawartha Lakes to assist in undertaking a Municipal Class Environmental Assessment (EA) with respect to updating the Water and Wastewater Master Plan. 1
The Water and Wastewater Master Plan Public Information Centre #2 (PIC) for the City of Kawartha Lakes took place last week. The presentation slides, video, and comment forms are now available on the City of Kawartha Lakes website. To Access the Presentation and Feedback: https://www.kawarthalakes.ca/en/municipal-services/major-projects.aspx Scroll down to the “City-wide” section, click on “Water and Wastewater Servicing and Capacity Master Plan”, then click on “Public Information Centre 2 Presentation and Feedback”. Thank you,
Sydney McIvor CIVIL E.I.T. – WATER LINEAR T +1 905.738.5700
TYLin
209 Dundas Street East Suite 301 Whitby, ON L1N 7H8, Canada TYLin.com
2
Charlotte Black From: Sent: To: Cc: Subject:
Kevin Brown <kevin.brown@tylin.com> Tuesday, June 4, 2024 8:41 AM Barboza, Karla (She/Her) (MCM) Minkin, Dan (MCM); nrahman; EA Notices to ERegion (MECP); Sydney McIvor RE: MCM Follow-Up: NOTICE OF PUBLIC INFORMATION CENTRE #2 - CITY OF KAWARTHA LAKES WATER AND WASTEWATER MASTER PLAN UPDATE
CAUTION -- EXTERNAL E-MAIL - Do not click links or open attachments unless you recognize the sender. Good morning, Karla. We are still completing our assessment and have not – as of yet – confirmed the Schedule B projects which will be required. We will be identifying these in the coming week, as we complete the technical analysis. Once we know where they will be located, we will initiate a more targeted Cultural Heritage assessment. Regards, -Kevin
Kevin Brown, P.Eng. (he, him) SENIOR MUNICIPAL ENGINEER TEAM LEAD - HYDRAULICS AND INFRASTRUCTURE PLANNING M +1 416.843.4689
From: Barboza, Karla (She/Her) (MCM) <Karla.Barboza@ontario.ca> Sent: Monday, May 27, 2024 10:54 AM To: Sydney McIvor <sydney.mcivor@tylin.com> Cc: Minkin, Dan (MCM) <Dan.Minkin@ontario.ca>; Kevin Brown <kevin.brown@tylin.com>; nrahman <nrahman@kawarthalakes.ca>; EA Notices to ERegion (MECP) <eanotification.eregion@ontario.ca> Subject: MCM Follow-Up: NOTICE OF PUBLIC INFORMATION CENTRE #2 - CITY OF KAWARTHA LAKES WATER AND WASTEWATER MASTER PLAN UPDATE
Hi Sydney, Thanks for sending the Notice of PIC #2 for the above note project to the Ministry of Citizenship and Multiculturalism (MCM) – MCM File 0020031. Could you please advise the status of the technical cultural heritage studies for the Schedule B undertaking(s)? I attached our initial letter. Looking forward to hearing from you. Thank in advance, Karla 1
Karla Barboza, MCIP, RPP, CAHP (she/her) Team Lead, Heritage | Heritage Branch | Citizenship, Inclusion and Heritage Division Ministry of Citizenship and Multiculturalism | Ontario Public Service 416-660-1027 | karla.barboza@ontario.ca
Taking pride in strengthening Ontario, its places and its people
From: Sydney McIvor <sydney.mcivor@tylin.com> Sent: Friday, May 24, 2024 10:01 AM To: Barboza, Karla (She/Her) (MCM) <Karla.Barboza@ontario.ca> Subject: NOTICE OF PUBLIC INFORMATION CENTRE #2 - CITY OF KAWARTHA LAKES WATER AND WASTEWATER MASTER PLAN UPDATE CAUTION -- EXTERNAL E-MAIL - Do not click links or open attachments unless you recognize the sender. Dear Stakeholder, T.Y. Lin International Canada Inc. has been retained by the City of Kawartha Lakes to assist in undertaking a Municipal Class Environmental Assessment (EA) with respect to updating the Water and Wastewater Master Plan. Please review the attached file containing details of the Water and Wastewater Master Plan Public Information Centre #2 (PIC) for the City of Kawartha Lakes. If you have any questions, please feel free to contact Project Manager Kevin Brown, as noted in the letter. Thank you,
Sydney McIvor CIVIL E.I.T. – WATER LINEAR T +1 905.738.5700
TYLin
209 Dundas Street East Suite 301 Whitby, ON L1N 7H8, Canada TYLin.com
2
Charlotte Black From: Sent: To: Subject:
Sydney Mcivor Thursday, August 1, 2024 2:15 PM Charlotte Black FW: Inquiry about water pollution facility in Bobcaygeon - Boyd Road
Follow Up Flag: Flag Status:
Follow up Flagged
Sydney McIvor CIVIL E.I.T. – WATER LINEAR
From: Kevin Brown <Kevin.Brown@TYLin.com> Sent: Thursday, August 1, 2024 2:13 PM To: kpbenefits <kpbenefits@sympatico.ca> Cc: nrahman <nrahman@kawarthalakes.ca>; Sydney Mcivor <sydney.mcivor@tylin.com> Subject: RE: Inquiry about water pollution facility in Bobcaygeon - Boyd Road Thank you for your inquiry. I have answered your questions below. If you have further inquiries, please advise, or even give me a call to discuss. The following is a link to the City’s website, where you can access additional information about the Study: https://www.kawarthalakes.ca/en/municipal-services/major-projects.aspx (Scroll down to “City-Wide” and expand the menu for “Water and Wastewater Servicing and Capacity Master Plan”) Regards, -Kevin
Kevin Brown, P.Eng.
(he, him) SENIOR MUNICIPAL ENGINEER TEAM LEAD - HYDRAULICS AND INFRASTRUCTURE PLANNING T +1 289.349.1902 M +1 416.843.4689 kevin.brown@tylin.com
TYLin
Suite 200 380 Wellington Street West Toronto, ON L4K 0C5, Canada M5V 1E3 TYLin.com
1
From: < > Sent: Thursday, August 1, 2024 1:13 PM To: nrahman <NRahman@kawarthalakes.ca>; Kevin Brown <Kevin.Brown@TYLin.com> Subject: Inquiry about water pollution facility in Bobcaygeon - Boyd Road You don't often get email from
Learn why this is important
Hello, It has come to my attention that the city is undertaking a study of the future waste water management. I have a specific interest in the pollution control facility on Boyd Rd in Bobcaygeon. Can you please advise on the following: 1. What is the current purpose and activity at this location? • The Facility at the eastern end of Boyd Street is the Bobcaygeon Water Pollution Control Plant. It treats wastewater prior to releasing the treated effluent (per Ministry of the Environment, Conservation and Parks requirements) to the Bay/Lake. 2. Is it a drinking water facility or wastewater or other purpose? • Wastewater Treatment. 3. What is the potential future use based on the study? • There are no plans to change the future use of this facility. The present Study is assessing what modifications to the water and wastewater systems will be required to accommodate the forecasted growth within Bobcaygeon (and the other serviced communities in the City of Kawartha Lakes) 4. Are there any odor or sound or lake/ bay water quality impacts coming from this facility now or in future? • There can be offensive odours from treatment plants, which is why there are buffer distances from residential lands required surrounding these facilities. There are odour control measures installed at wastewater treatment plants (carbon scrubbers, typically), but there are open tanks that are part of any wastewater treatment process. When these are operating properly, though, any odours should be “reasonable”. 5. Is there any water discharge into the bay or the lake now or in future? • The WPCP currently discharges effluent to the Bay/Lake. The effluent water quality is regulated, and annual compliance reports are published (and publicly-available). 6. Is there a plan to expand this facility in size or in activity? • The present study will be identifying that additional wastewater (and water) treatment capacity will be required to support the forecasted growth in Fenelon Falls. Specifically HOW that capacity increase will be provided (a facility expansion, a new facility at a new location, a second facility at a new location, or perhaps some other solution) will be evaluated in a separate study. Master Plans (the current Study) are broad infrastructure planning studies, and a treatment increase requires a specific “Schedule C” Class Environmental Assessment (“Class EA”). This Study will establish the basis for the future Class EA. 2
7. Is there truck or construction traffic expected at this location? • There is some truck traffic presently, associated with the normal operation of the facility. If a plant expansion is identified as the recommended solution in the future Class Environmental Assessment, I expect that there would be construction vehicles. That Class EA will consider the impacts to the Socio-Cultural Environment (impacts to society) as part of the evaluation of alternative solutions. 8. What other impact can be foreseen for neighbours in close proximity to this site? • That is difficult to say at this time, relative to the WPCP specifically. Impacts will be assessed in that Class EA Study. The Present Study (Water and Wastewater Master Plan) has identified that pumping capacity upgrades at the Need Street Sewage Pumping Station (South of Canal/Boyd) could be required (to be confirmed this fall)
I look forward to your response. Thank you, Karen
3
Sydney Mcivor From: Sent: To: Cc: Subject: Attachments:
Nafiur Rahman <nrahman@kawarthalakes.ca> Monday, August 26, 2024 3:31 PM Kevin Brown Sydney Mcivor FW: New Response Completed for PIC Comment Sheet Water Wastewater 2024-07-24-026.pdf
Follow Up Flag: Flag Status:
Follow up Flagged
This hasn’t been replied yet. From: noreply@esolutionsgroup.ca <noreply@esolutionsgroup.ca> Sent: Wednesday, July 24, 2024 3:39 PM To: Nafiur Rahman <nrahman@kawarthalakes.ca>; kevin.brown@TYLin.com Subject: New Response Completed for PIC Comment Sheet Water Wastewater
Hello, Please note the following response to PIC Comment Sheet Water Wastewater has been submitted at Wednesday July 24th 2024 3:37 PM with reference number 2024-07-24026. •
Name Ryan Windle
•
Address 327 Renfrew Drive, Markham, ON, L3R 9S8
•
Telephone # 289-552-2234
•
Email address rwindle@digram.ca
•
Comments From: TOR Construction Limited Nafiur/Kevin: In response to the technical memos/reports issued and associated materials presented at Public Information Centre #2, we offer the following comments on the Water and Wastewater Servicing and Capacity Master Plan update as it relates specifically to Fenelon Falls: 1
• TOR Construction Inc. (TOR) owns approximately 200ha of land in the southeast section of the Town of Fenelon Falls. • The northern portion of the TOR lands are the subject of an application for Official Plan Amendment, Zoning By-law Amendment and Draft Plan of Subdivision approval which is currently under review by the City of Kawartha Lakes (CKWL). For reference, please see the attached Draft Plan. For clarity, we note that the TOR Lands are the “Fenelon Trails” lands however the reference to “Fenelon Trails” is a holdover project name from the previous owner. We have not yet assigned a project name to our development application lands. We respectfully request that any future reports, presentations etc. reference us as TOR Construction Limited and our lands be referenced as the “TOR Lands” or “TOR Applications”. • The application proposes a mixed-use and mixed density residential neighbourhood including approximately 900 residential units and supportive commercial space. • The northern most portion of the TOR lands (18ha +/-) that are the subject of the development applications are located within the existing Fenelon Falls Settlement Area. The balance of the TOR application lands are located within the approved Fenelon Falls Secondary Plan which designates the lands as Residential. Given that the TOR application lands are within an approved Secondary Plan, we inquire as to why was this area not included in the current capacity assessment? • The TOR application is supported by a Functional Servicing Report (FSR) completed by GHD Engineering dated September 2023. The findings and conclusions are generally consistent with the preliminary assessment summarized in PIC#2. however, the FSR has concluded that Fenelon Falls has enough water capacity to service TOR’s proposed development and the Fenelon Falls Wastewater Pollution Control Plan has enough capacity to service initial phases of development. Only minor upgrades to existing infrastructure would be required to accommodate the proposed development. Has the project team reviewed our FSR as part of the capacity assessment? If not, will it be reviewed and considered in the formulation of the final assessment and ultimately the Master Plan? • The development of our lands represents the most logical extension of servicing in Fenelon Falls. Will this be considered in the final Master Plan? • In Technical Memo 5 (TM5), in the Fenelon Falls section, the forecasted units of population do not appear to factor in our proposed development of approximately 900 units. However, our proposed development was mentioned as a factor being considered in the PIC #2 presentation. Will follow up memos and reports, including the Draft Master Plan be formally updated to factor in our proposed development application considering that the lands are within an approved Secondary Plan and the Draft CKWL Growth Management Strategy (GMS) initial findings have identified the area as a preferred location for rationalization/expansion of the Fenelon Falls Settlement Area and future development? 2
• Understanding the time required to complete the assessment and Master Plan and associated plans (e.g. GMS), we trust that it will not delay the ongoing review and approval or our applications considering capacity can be addressed through appropriate Draft Plan conditions/Subdivision Agreement, phasing of development and/or zoning holding provisions as deemed necessary. • Figure 5-1 in TM-5 illustrates the Fenelon Falls Settlement Area (SA) Boundary however the boundaries do not match the existing Settlement Area boundary or the limit of the Fenelon Falls Secondary Plan. What is the source of the SA boundary? Does this pre-suppose expansion of the SA to the southern limits, as shown on our lands, for the purposes of the capacity assessment and final Master Plan? It is suggested that the assumption should be that the SA boundary would be expanded to the southern limit of the Secondary Plan area which matches our development application lands. See attached overlay of our application lands and approved Secondary Plan Schedule 3 – Land Use Plan. The SA boundary is also depicted in this fashion on the Fenelon Falls Wet Weather Flow Slide from PIC#2. • The Draft GMS information presented to the GMS Task Force on June 19, 2024, has indicated a deficit of 38ha of Settlement Area lands to accommodate future growth and that our application lands are the preferred location for the expansion of the settlement area. Will the capacity analysis and resulting Master Servicing Plan include the assumed development and corresponding population on the Settlement Area expansion lands? • The Servicing Assumptions slide presented at PIC#2 indicates that serving connection points and assumptions are to be confirmed based on development applications. Has the TOR application been reviewed and considered in this regard? Of note is consideration of our proposed connection points and infrastructure upgrades. It was also noted that the project team will consider input from landowners. To that end is TyLin amenable to participating in a call with TOR to discuss the project and specifically the implications of our development application? We would be glad to provide input at a time and in a format requested by the project team. Thank you in advance for your consideration of the above comments. Sincerely, Ryan Windle MCIP RPP AICP | VP of Land Development A. 327 Renfrew Dr., Suite 201 Markham ON L3R 9S8 E. rwindle@digram.ca P. 905.513.7999 Ext 251
[This is an automated email notification -- please do not respond] This message, including any attachments, is privileged and intended only for the addressee(s) named above. If you are not the intended recipient, you must not read, use or disseminate the information contained in this e-mail. If you have received this e-mail in error, please notify the sender immediately by telephone, fax, or e-mail and shred this confidential e-mail, including any attachments, without making a copy. Access to this e-mail by anyone else is unauthorized.
3
Project File Report Kawartha Lakes Water Wastewater Servicing and Capacity Master Plan
Appendix A5
Notice of Completion
Water and Wastewater Servicing and Capacity Master Plan
NOTICE OF PROJECT COMPLETION Introduction The City of Kawartha Lakes has experienced a significant increase in growth over the recent years. The Water and Wastewater Servicing and Capacity Master Plan was initiated to identify the existing servicing constraints and provide a long-term water and wastewater servicing strategy that supports existing communities and growth to 2051 (ultimate buildout).
Master Plan Class Environmental Assessment This study has been conducted in accordance with the requirements of Phases 1 and 2 of the Municipal Class Environmental Assessment, which is an approved process under the Environmental Assessment Act. The Master Plan Class Environmental Assessment (MPCEA) process includes public and review agency consultation, an assessment of the problem and opportunities, an evaluation of alternative solutions, an assessment of potential effects on the environment, and identification of reasonable measures to mitigate the adverse effects. The preferred solution(s) were determined based on engineering requirements, environmental considerations (natural, social, economic), public input, and information gathered during the studies. This study followed the Approach#1 of the Master Plan Class EA process. This Master Plan would therefore become the basis for, and be used in support of, future detailed investigations for the specific Schedule B and C projects identified within it.
Public Consultation Public consultation is a key component of the MPCEA process. Two Public Information Centre (PIC) events were held to seek public input. PIC #1 was held in October 2023 and discussed the project objectives and processes. PIC #2 was held in June 2024 and discussed study findings and recommended upgrades for the City of Kawartha Lakes water and wastewater infrastructure.
Study Review and Completion The City of Kawartha Lakes Water and Wastewater Servicing Capacity Master Plan Report is now available for public review. The report can be accessed on the project website here (scroll to city-wide section): https://www.kawarthalakes.ca/en/municipal-services/major-projects.aspx. A hard copy report is also available at the City Clerk’s Office and Lindsay Library for public viewing. It is available for a thirty (30) day public review period commencing from the date of this notice. Please provide comments to the contacts below by March 21, 2025.
Sydney McIvor From: Sent: To: Cc: Subject:
Follow Up Flag: Flag Status:
Sunday, February 23, 2025 6:06 PM Sydney McIvor nrahman; Mateusz Lewandowski; Abe Khademi RE: NOTICE OF COMPLETION - CITY OF KAWARTHA LAKES WATER AND WASTEWATER MASTER PLAN UPDATE Follow up Flagged
Hi Sydney, Any idea when the report will be made available to the public? Thanks,
From: Sydney McIvor <sydney.mcivor@tylin.com> S nt: Thursday, February 20, 2025 4:07 PM Cc: nrahman <nrahman@kawarthalakes.ca>; Mateusz Lewandowski <mateusz.lewandowski@tylin.com>; Abe Khademi <abe.khademi@tylin.com> Subj ct: NOTICE OF COMPLETION - CITY OF KAWARTHA LAKES WATER AND WASTEWATER MASTER PLAN UPDATE Good afternoon, T.Y. Lin International Canada Inc. has been retained by the City of Kawartha Lakes to assist in undertaking a Municipal Class Environmental Assessment (EA) with respect to updating the Water and Wastewater Master Plan. Please find attached Notice of Project Completion. If you have any questions, please feel free to contact Project Manager Abe Khademi, as noted in the attached letter. Thank you,
Sydney McIvor CIVIL E.I.T. – WATER LINEAR T 1
TYLin
Suite 301 209 Dundas Street East Whitby, ON L1N 7H8, Canada TYLin.com
2
Sydney McIvor From: Sent: To: Cc: Subject:
Sydney McIvor Monday, February 24, 2025 9:55 AM nrahman; Mateusz Lewandowski; Abe Khademi RE: NOTICE OF COMPLETION - CITY OF KAWARTHA LAKES WATER AND WASTEWATER MASTER PLAN UPDATE
Hi The City of Kawartha Lakes Water and Wastewater Servicing Capacity Master Plan Report is now available for public review. The report can be accessed on the project website here (scroll to city-wide section): https://www.kawarthalakes.ca/en/municipal-services/major-projects.aspx A hard copy report is also available at the City Clerk’s O.ice and Lindsay Library for public viewing. Thank you, Sydney
Sydney McIvor CIVIL E.I.T. – WATER LINEAR
From: S nt: To: Sydney McIvor <sydney.mcivor@tylin.com> Cc: nrahman <nrahman@kawarthalakes.ca>; Mateusz Lewandowski <mateusz.lewandowski@tylin.com>; Abe Khademi <abe.khademi@tylin.com> Subj ct: RE: NOTICE OF COMPLETION - CITY OF KAWARTHA LAKES WATER AND WASTEWATER MASTER PLAN UPDATE Hi Sydney, Any idea when the report will be made available to the public? Thanks,
1
F
From: Sydney McIvor <sydney.mcivor@tylin.com> S nt: Thursday, February 20, 2025 4:07 PM Cc: nrahman <nrahman@kawarthalakes.ca>; Mateusz Lewandowski <mateusz.lewandowski@tylin.com>; Abe Khademi <abe.khademi@tylin.com> Subj ct: NOTICE OF COMPLETION - CITY OF KAWARTHA LAKES WATER AND WASTEWATER MASTER PLAN UPDATE Good afternoon, T.Y. Lin International Canada Inc. has been retained by the City of Kawartha Lakes to assist in undertaking a Municipal Class Environmental Assessment (EA) with respect to updating the Water and Wastewater Master Plan. Please find attached Notice of Project Completion. If you have any questions, please feel free to contact Project Manager Abe Khademi, as noted in the attached letter. Thank you,
Sydney McIvor CIVIL E.I.T. – WATER LINEAR T
TYLin
Suite 301 209 Dundas Street East Whitby, ON L1N 7H8, Canada TYLin.com
2
Sydney McIvor From: Sent: To: Cc: Subject: Follow Up Flag: Flag Status:
Monday, February 24, 2025 2:17 PM Sydney McIvor RE: Water-Wastewater Servicing Master Plan Update Municipal Class EA Follow up Completed
Sydney, I did not receive any updates as per the email below. Can you confirm that I am on the distribution list as I was recently informed that the study is complete. Thank you,
NOTICE OF CONFIDENTIALITY: This message and all files transmitted with it may contain information that is considered confidential and which may be prohibited from disclosure under applicable law or contractual agreement. It is intended solely for the use of the individual or entity to whom it is addressed. If you are not the named recipient, disclosing, copying, distributing or making use of the information contained in or attached to this message is strictly prohibited. If you have received this email transmission in error, please notify the sender immediately by replying to this email and then delete it from your system. The attached file(s) are for reference purposes only. It is the responsibility of the parties receiving this information to verify its accuracy. The Odan/Detech Group Inc. is not responsible for modified or reproduced versions of the data being transferred. These files are to be treated as unstamped and unsealed. To receive officially stamped and/or sealed files, contact The Odan/Detech Group Inc. to arrange for the receipt of hard copies.
From: Sydney McIvor <sydney.mcivor@tylin.com> Sent: Monday, May 27, 2024 8:53 AM To: Cc: Kevin Brown <kevin.brown@tylin.com> Subject: RE: Water-Wastewater Servicing Master Plan Update Municipal Class EA Hello You have been added to the City of Kawartha Lakes Water and Wastewater Servicing Master Plan Update Municipal Class EA distribution list. Attached is the Notice of Public Information Centre #2. All future project communications will be sent to you as well. 1
Thank you, Sydney
Sydney McIvor CIVIL E.I.T. – WATER LINEAR
TYLin
From: Kevin Brown <Kevin.Brown@TYLin.com> Sent: Monday, May 27, 2024 8:35 AM To: Sydney McIvor <sydney.mcivor@tylin.com> Cc: nrahman <nrahman@kawarthalakes.ca> Subject: FW: Water-Wastewater Servicing Master Plan Update Municipal Class EA Importance: High Syd: Please see below. -Kevin
Kevin Brown, P.Eng. (he, him) SENIOR MUNICIPAL ENGINEER TEAM LEAD - HYDRAULICS AND INFRASTRUCTURE PLANNING M
TYLin
From: Sent: Friday, May 24, 2024 3:36 PM To: Kevin Brown <Kevin.Brown@TYLin.com>; nrahman <nrahman@kawarthalakes.ca> Cc: Subject: Water-Wastewater Servicing Master Plan Update Municipal Class EA Importance: High You don't often get email from
Learn why this is important
Kevin/Nafiur, Pls. add me to the City of Kawartha Lakes Water-Wastewater Servicing Master Plan Update Municipal Class EA distribution list.
Thank you,
2
NOTICE OF CONFIDENTIALITY: This message and all files transmitted with it may contain information that is considered confidential and which may be prohibited from disclosure under applicable law or contractual agreement. It is intended solely for the use of the individual or entity to whom it is addressed. If you are not the named recipient, disclosing, copying, distributing or making use of the information contained in or attached to this message is strictly prohibited. If you have received this email transmission in error, please notify the sender immediately by replying to this email and then delete it from your system. The attached file(s) are for reference purposes only. It is the responsibility of the parties receiving this information to verify its accuracy. The Odan/Detech Group Inc. is not responsible for modified or reproduced versions of the data being transferred. These files are to be treated as unstamped and unsealed. To receive officially stamped and/or sealed files, contact The Odan/Detech Group Inc. to arrange for the receipt of hard copies.
3
Sydney McIvor From: Sent: To: Cc: Subject: Attachments:
Sydney McIvor Monday, February 24, 2025 3:03 PM ; Mateusz Lewandowski; Abe Khademi RE: Water-Wastewater Servicing Master Plan Update Municipal Class EA 2025-02-20-Notice-of-Completion-Final_Water-and-Wastewater-Servicing-andCapacity-Master-Plan_accessible.pdf
Hi Confirmed that you are on the distribution list. Please find attached Notice of Project Completion. If you have any questions, please feel free to contact Project Manager Abe Khademi, as noted in the attached letter. Thank you,
Sydney McIvor CIVIL E.I.T. – WATER LINEAR
From: Sent: Monday, February 24, 2025 2:17 PM To: Sydney McIvor <sydney.mcivor@tylin.com> Cc: Retired - Kevin Brown <kevin.brown@TYLIN1.onmicrosoft.com>; Subject: RE: Water-Wastewater Servicing Master Plan Update Municipal Class EA Sydney, I did not receive any updates as per the email below. Can you confirm that I am on the distribution list as I was recently informed that the study is complete. Thank you,
1
NOTICE s considered confidential and which may be prohibited from disclosure under applicable law or contractual agreement. It is intended solely for the use of the individual or entity to whom it is addressed. If you are not the named recipient, disclosing, copying, distributing or making use of the information contained in or attached to this message is strictly prohibited. If you have received this email transmission in error, please notify the sender immediately by replying to this email and then delete it from your system. The attached file(s) are for reference purposes only. It is the responsibility of the parties receiving this information to verify its accuracy. The Odan/Detech Group Inc. is not responsible for modified or reproduced versions of the data being transferred. These files are to be treated as unstamped and unsealed. To receive officially stamped and/or sealed files, contact The Odan/Detech Group Inc. to arrange for the receipt of hard copies.
From: Sydney McIvor <sydney.mcivor@tylin.com> Sent: Monday, May 27, 2024 8:53 AM To: Cc: Kevin Brown <kevin.brown@tylin.com> Subject: RE: Water-Wastewater Servicing Master Plan Update Municipal Class EA Hello You have been added to the City of Kawartha Lakes Water and Wastewater Servicing Master Plan Update Municipal Class EA distribution list. Attached is the Notice of Public Information Centre #2. All future project communications will be sent to you as well. Thank you, Sydney
Sydney McIvor CIVIL E.I.T. – WATER LINEAR
TYLin
From: Kevin Brown <Kevin.Brown@TYLin.com> Sent: Monday, May 27, 2024 8:35 AM To: Sydney McIvor <sydney.mcivor@tylin.com> Cc: nrahman <nrahman@kawarthalakes.ca> Subject: FW: Water-Wastewater Servicing Master Plan Update Municipal Class EA Importance: High Syd: Please see below. -Kevin
Kevin Brown, P.Eng. (he, him) SENIOR MUNICIPAL ENGINEER TEAM LEAD - HYDRAULICS AND INFRASTRUCTURE PLANNING M
2
TYLin
From: Sent: Friday, May 24, 2024 3:36 PM To: Kevin Brown <Kevin.Brown@TYLin.com>; nrahman <nrahman@kawarthalakes.ca> Cc: Subject: Water-Wastewater Servicing Master Plan Update Municipal Class EA Importance: High You don't often get email from
Learn why this is important
Kevin/Nafiur, Pls. add me to the City of Kawartha Lakes Water-Wastewater Servicing Master Plan Update Municipal Class EA distribution list.
Thank you,
NOTICE OF CONFIDENTIALITY: This message and all files transmitted with it may contain information that is considered confidential and which may be prohibited from disclosure under applicable law or contractual agreement. It is intended solely for the use of the individual or entity to whom it is addressed. If you are not the named recipient, disclosing, copying, distributing or making use of the information contained in or attached to this message is strictly prohibited. If you have received this email transmission in error, please notify the sender immediately by replying to this email and then delete it from your system. The attached file(s) are for reference purposes only. It is the responsibility of the parties receiving this information to verify its accuracy. The Odan/Detech Group Inc. is not responsible for modified or reproduced versions of the data being transferred. These files are to be treated as unstamped and unsealed. To receive officially stamped and/or sealed files, contact The Odan/Detech Group Inc. to arrange for the receipt of hard copies.
3
Sydney McIvor From: Sent: To: Cc: Subject: Attachments:
Nafiur Rahman <nrahman@kawarthalakes.ca> Tuesday, March 11, 2025 4:32 PM
Follow Up Flag: Flag Status:
Follow up Completed
Abe Khademi; ; cpurdy; Mateusz Lewandowski; Sydney McIvor RE: CKL WWMP 20231130 Request to Consult Water Wastewater Alderville.pdf
Good afternoon I acknowledge the receipt of your letter. I would like to mention that we had a previous meeting with Alderville First Nation when the Notice of Commencement of the Master Plan Study was issued. The Master Plan study that we have just completed actually identifies individual projects to accommodate future growth. However, during the implementation of these projects further detailed investigations will be undertaken following the Municipal Class EA planning and design process. Please let us know if you would like to meet further or just review the Master Plan Project File Report. We will process the fee of $300 as mentioned in the letter.
Thank you. Nafiur Rahman, P.Eng., PMP Supervisor, Environmental Capital Project Management Infrastructure Design and Construction, Engineering and Corporate Assets City of Kawartha Lakes www.kawarthalakes.ca
From: S nt: Monday, March 10, 2025 3:55 PM To: Nafiur Rahman <nrahman@kawarthalakes.ca> Cc: Abe.Khademi@TYLin.com Subj ct: CKL WWMP Aaniin Nafiur, 1
Please see attached. Miigwech. All the best,
This message, including any attachments, is privileged and intended only for the addressee(s) named above. If you are not the intended recipient, you must not read, use or disseminate the information contained in this e-mail. If you have received this e-mail in error, please notify the sender immediately by telephone, fax, or e-mail and shred this confidential e-mail, including any attachments, without making a copy. Access to this e-mail by anyone else is unauthorized.
2
Sydney McIvor From: Sent: To: Cc: Subject:
Thursday, March 20, 2025 9:25 AM nrahman Abe Khademi; cpurdy; Mateusz Lewandowski; Sydney McIvor RE: CKL WWMP
Follow Up Flag: Flag Status:
Follow up Completed
Some people who received this message don't often get email from
. Learn why this is important
Aaniin Nafiur, Thank you for your e-mail – and thank you for reminding us of the engagement thus far. Apologies, it is challenging at times to keep everything sorted in terms of projects, and their timing. Yes – I can just review the Master Plan Project File Report – no need to meet again at this time. Thank you for processing the filing fee – I checked my records and couldn’t locate a previous payment. Our interest moving forward, will be the actual construction of the project itself, and understanding the potential impacts to the lands and waters. Looking forward to working with your team at that time. Please keep us updated and engaged as the process moves forward. Miigwech. All the best,
From: Nafiur Rahman <nrahman@kawarthalakes.ca> S nt: March 11, 2025 4:32 PM To: Corby Purdy <cpurdy@kawarthalakes.ca>; Cc: Abe.Khademi@TYLin.com; 'Mateusz Lewandowski' <mateusz.lewandowski@tylin.com>; Sydney McIvor <sydney.mcivor@tylin.com> Subj ct: RE: CKL WWMP 1
Good afternoon I acknowledge the receipt of your letter. I would like to mention that we had a previous meeting with Alderville First Nation when the Notice of Commencement of the Master Plan Study was issued. The Master Plan study that we have just completed actually identifies individual projects to accommodate future growth. However, during the implementation of these projects further detailed investigations will be undertaken following the Municipal Class EA planning and design process. Please let us know if you would like to meet further or just review the Master Plan Project File Report. We will process the fee of $300 as mentioned in the letter.
Thank you. Nafiur Rahman, P.Eng., PMP Supervisor, Environmental Capital Project Management Infrastructure Design and Construction, Engineering and Corporate Assets City of Kawartha Lakes www.kawarthalakes.ca
From: S nt: Monday, March 10, 2025 3:55 PM To: Nafiur Rahman <nrahman@kawarthalakes.ca> Cc: Abe.Khademi@TYLin.com Subj ct: CKL WWMP Aaniin Nafiur, Please see attached. Miigwech. All the best,
2
This message, including any attachments, is privileged and intended only for the addressee(s) named above. If you are not the intended recipient, you must not read, use or disseminate the information contained in this e-mail. If you have received this e-mail in error, please notify the sender immediately by telephone, fax, or e-mail and shred this confidential e-mail, including any attachments, without making a copy. Access to this e-mail by anyone else is unauthorized.
3
Sydney McIvor From: Sent: To: Cc: Subject: Attachments:
Friday, March 21, 2025 5:42 PM Sydney McIvor nrahman; Mateusz Lewandowski; Abe Khademi RE: NOTICE OF COMPLETION - CITY OF KAWARTHA LAKES WATER AND WASTEWATER MASTER PLAN UPDATE [MCM File 0020031] 2025-03-21_KawarthaLakesWWWMP_MCMcomments.pdf
Follow Up Flag: Flag Status:
Follow up Flagged
Good a ernoon, Please see our comments a ached.
Heritage Planner | Heritage Operations Branch Ministry of Citizenship and Multiculturalism | Ontario Public Service
Taking pride in strengthening Ontario, its places and its people From: Sydney McIvor <sydney.mcivor@tylin.com> S nt: Thursday, February 20, 2025 4:07 PM Cc: nrahman <nrahman@kawarthalakes.ca>; Mateusz Lewandowski <mateusz.lewandowski@tylin.com>; Abe Khademi <abe.khademi@tylin.com> Subj ct: NOTICE OF COMPLETION - CITY OF KAWARTHA LAKES WATER AND WASTEWATER MASTER PLAN UPDATE CAUTION -- EXTERNAL E-MAIL - Do not click links or open attachments unless you recognize the sender. Good afternoon, T.Y. Lin International Canada Inc. has been retained by the City of Kawartha Lakes to assist in undertaking a Municipal Class Environmental Assessment (EA) with respect to updating the Water and Wastewater Master Plan. Please find attached Notice of Project Completion. If you have any questions, please feel free to contact Project Manager Abe Khademi, as noted in the attached letter. Thank you,
Sydney McIvor CIVIL E.I.T. – WATER LINEAR T
TYLin
Suite 301 1
209 Dundas Street East Whitby, ON L1N 7H8, Canada TYLin.com
2
Sydney McIvor From: Sent: To: Cc: Subject:
Sydney McIvor Monday, March 24, 2025 4:18 PM nrahman; Mateusz Lewandowski; Abe Khademi RE: NOTICE OF COMPLETION - CITY OF KAWARTHA LAKES WATER AND WASTEWATER MASTER PLAN UPDATE [MCM File 0020031]
Hello Thank you for the comments provided, confirming that they have been reviewed by the project team. Sydney
Sydney McIvor CIVIL E.I.T. – WATER LINEAR
From: S nt: Friday, March 21, 2025 5:42 PM To: Sydney McIvor <sydney.mcivor@tylin.com> Cc: nrahman <nrahman@kawarthalakes.ca>; Mateusz Lewandowski <mateusz.lewandowski@tylin.com>; Abe Khademi <abe.khademi@tylin.com> Subj ct: RE: NOTICE OF COMPLETION - CITY OF KAWARTHA LAKES WATER AND WASTEWATER MASTER PLAN UPDATE [MCM File 0020031] Good a<ernoon, Please see our comments a=ached.
Taking pride in strengthening Ontario, its places and its people From: Sydney McIvor <sydney.mcivor@tylin.com> S nt: Thursday, February 20, 2025 4:07 PM Cc: nrahman <nrahman@kawarthalakes.ca>; Mateusz Lewandowski <mateusz.lewandowski@tylin.com>; Abe Khademi <abe.khademi@tylin.com> Subj ct: NOTICE OF COMPLETION - CITY OF KAWARTHA LAKES WATER AND WASTEWATER MASTER PLAN UPDATE CAUTION -- EXTERNAL E-MAIL - Do not click links or open attachments unless you recognize the sender. Good afternoon,
1
T.Y. Lin International Canada Inc. has been retained by the City of Kawartha Lakes to assist in undertaking a Municipal Class Environmental Assessment (EA) with respect to updating the Water and Wastewater Master Plan. Please find attached Notice of Project Completion. If you have any questions, please feel free to contact Project Manager Abe Khademi, as noted in the attached letter. Thank you,
Sydney McIvor CIVIL E.I.T. – WATER LINEAR T
TYLin
Suite 301 209 Dundas Street East Whitby, ON L1N 7H8, Canada TYLin.com
2
Sydney McIvor From: Sent: To: Cc: Subject: Attachments:
Abe Khademi Monday, March 24, 2025 7:00 AM Mateusz Lewandowski Sydney McIvor FW: Water and Wastewater Master Plan Update - Comments Flato - Lindsay Master Plan Comments Memo.pdf
Follow Up Flag: Flag Status:
Follow up Flagged
FYI – I don’t think a response is required. From: S nt: Friday, March 21, 2025 5:09 PM To: nrahman <nrahman@kawarthalakes.ca>; Abe Khademi <abe.khademi@tylin.com> Cc: Subj ct: Water and Wastewater Master Plan Update - Comments You don't often get email from
Learn why this is important
Nafiur and Abe, Please see attached for comments of the master plan for your consideration. If you have any questions please feel free to reach out at any time. Thank you,
This message is directed in confidence solely to the person(s) named above and may contain privileged, confidential or private information which is not to be disclosed. If you are not the addressee or an authorized representative
thereof, please contact the undersigned and then destroy this message.
Ce message est destiné uniquement aux personnes indiquées dans l'entête et peut contenir une information privilégiée, confidentielle ou privée et ne pouvant être divulguée. Si vous n'êtes pas le destinataire de ce message ou une personne autorisée à le recevoir, veuillez communiquer avec le soussigné et ensuite détruire ce message.
1
Sydney McIvor From: Sent: To: Cc: Subject:
Mateusz Lewandowski Tuesday, April 8, 2025 1:53 PM
Follow Up Flag: Flag Status:
Follow up Flagged
cpurdy; Abe Khademi; nrahman; Sydney McIvor RE: Water and Wastewater Master Plan Update - Comments
Hello Please find the below red comment responses for your attention.
1. The per capita flow rate criteria could over estimate the actual capacity increase required at the treatment
2.
3.
4.
5.
plants given the rate used (450 l/cap/day) is higher than the observed existing rates (250 l/cap/day). A master plan serves as a high-level planning tool to evaluate water and wastewater capacity within the collection, distribution, and treatment systems, and to identify necessary upgrades to meet the anticipated growth. Considering several factors, such as, current unit density, water leakage, inflow & infiltration, accessory residential unit (ARU), etc. the City decided to keep the design criteria unchanged. Should the City wish to remain conservative in the water demand / sanitary flow generation rate per capita, we recommend the City expands in substantial tranches of capacity increase but that at each phase of plant expansion, the impact of new growth is compared against the master plan with the opportunity to recalibrate the ultimate targeted capacity required to service the full build out of anticipated growth. Given the duration of the plan, it is likely that an updated master plan in approximately 10 years would be a timely opportunity to undertake such an analysis. Typically, a master plan update is recommended to be completed within a 5–10-year timeframe, depending on the growth rate and the overall impacts on the water and wastewater systems. The City will consider a phasing approach in the design and construction of major facility upgrades/expansion. The Flato team is contemplating 3 or possibly 4 sanitary pumping stations within the Flato MZO lands, while the Master Plan Update contemplated two pumping stations for the Flato lands. The master plan utilizes the most up-to-date information available at the time of its completion. Any changes or impacts will need to be assessed individually during the development application review process. The Trunk Sewer alignment appears conservative in estimate of capital cost requirements as it is not aligned with the proposal from the Flato team to utilize the available capacity within the existing twinned St. David Street sanitary trunk sewer. This will be evaluated during the development application review process. Preliminary modelling has been completed for the Flato MZO lands based on the boundary conditions supplied by the City from the Master Plan model and an elevated storage tank is recommended by the Flato team in the north east quadrant of the MZO lands, north of Pigeon Lake Road and west of Fieldside Road. Any storage deficits for each respective community will require a separate Class EA study to identify the preferred alternative followed by design and construction.
Please feel free to forward to the remaining individuals on your team. Thanks, 1
Mateusz Lewandowski, P.Eng PROJECT MANAGER T
Suite 315 3381 Steeles Avenue East Toronto, ON M2H 3S7, Canada TYLin.com
From: Nafiur Rahman S nt: Monday, March 24, 2025 4:30 PM To: Cc: Subj ct: Re: Water and Wastewater Master Plan Update - Comments Hi I acknowledge receipt of your email and comments. We will review and provide response accordingly. Thanks, Nafiur
From: S nt: Friday, March 21, 2025 5:09 PM To: Nafiur Rahman <nrahman@kawarthalakes.ca>; abe.khademi@tylin.com <abe.khademi@tylin.com> Cc: Subj ct: Water and Wastewater Master Plan Update - Comments
Nafiur and Abe, Please see attached for comments of the master plan for your consideration. If you have any questions please feel free to reach out at any time. Thank you, Counterpoint Land Development by Dillon Consulting Limited 8395 Jane Street Suite 100 Vaughan, Ontario, Canada, L4K 5Y2 T: www.counterpointeng.com www.dillon.ca
2
This message is directed in confidence solely to the person(s) named above and may contain privileged, confidential or private information which is not to be disclosed. If you are not the addressee or an authorized representative thereof, please contact the undersigned and then destroy this message.
Ce message est destiné uniquement aux personnes indiquées dans l'entête et peut contenir une information privilégiée, confidentielle ou privée et ne pouvant être divulguée. Si vous n'êtes pas le destinataire de ce message ou une personne autorisée à le recevoir, veuillez communiquer avec le soussigné et ensuite détruire ce message.
3
Sydney McIvor From: Sent: To: Cc: Subject:
Nafiur Rahman <nrahman@kawarthalakes.ca> Monday, March 24, 2025 3:04 PM Abe Khademi; Mateusz Lewandowski cpurdy; Sydney McIvor Fw: City of Kawartha Lakes- Fenelon Falls
Follow Up Flag: Flag Status:
Follow up Flagged
Hi Abe/Mat, Forwarding the email received below. I understand your team will review the questions received so far during the review period and prepare responses accordingly. How would you like to respond to the questions? Please let me know and I will reply the following email accordingly. Thanks Nafiur
From: S nt: Monday, March 24, 2025 10:04 AM To: Nafiur Rahman Subj ct: Re: City of Kawartha Lakes- Fenelon Falls Good Morning Nafiur, The commenting deadline for the Water and Wastewater Servicing Capacity Master Plan was on Friday. Our office was wondering what is the next steps regarding the report and the feedback from the public? Hope to hear from you at your earliest convenience. Kind Regards, | Land Development Planner A. 80 Micro Court, Suite 105 Markham ON L3R 9Z5 E. P. The link ed image cannot be display ed. The file may hav e been mov ed, renamed, or deleted. Verify that the link points to the correct file and location.
This email and any files transmitted with it are confidential and intended solely for the use of the individual or entity to which they are addressed. If you have received this email in error, please notify the sender. Please note that any views or opinions presented in this email are solely those of the author and do not necessarily represent those of the Company. The Company accepts no liability for any damages caused by any virus transmitted by this email. 1
The link ed image can not be d isplay ed. The file may hav e been mov ed, ren amed, or deleted. Verify that the link points to the correct file and location.
The link ed image can not be d isplay ed. The file may hav e been mov ed, ren amed, or deleted. Verify that the link points to the correct file and location.
Please do not print this email unless it is absolutely necessary. Every time you don't print an email, you are helping the environment.
On Fri, Dec 13, 2024 at 11:33 AM Nafiur Rahman <nrahman@kawarthalakes.ca> wrote: Hi , The presentation slides are now available on the City website. Here is the link. Please scroll down to City-wide section. https://www.kawarthalakes.ca/en/municipal-services/major-projects.aspx Thanks Nafiur From: S nt: Thursday, December 12, 2024 3:44 PM To: Nafiur Rahman <nrahman@kawarthalakes.ca> Subj ct: Re: City of Kawartha Lakes- Fenelon Falls
Hello Nafiur, Thank you for the update. Is it possible to provide a copy of the PowerPoint presentation from Tuesday's meeting? Thank you. Kind Regards, | Land Development Planner A. 80 Micro Court, Suite 105 Markham ON L3R 9Z5 E. P.
This email and any files transmitted with it are confidential and intended solely for the use of the individual or entity to which they are addressed. If you have received this email in error, please notify the sender. Please note that any views or opinions presented in this email are solely those of the author and do not necessarily represent those of the Company. The Company accepts no liability for any damages caused by any virus transmitted by this email.
Error! Filename not specified.Please do not print this email unless it is absolutely necessary. Every time you don't print an email, you are helping the environment.
On Thu, Dec 12, 2024 at 2:07 PM Nafiur Rahman <nrahman@kawarthalakes.ca> wrote: 2
Good afternoon
,
The project hasn’t fully completed yet. We are targeting to get the project file report to council in February 2025. Thank you. Nafiur From: S nt: Thursday, December 12, 2024 1:56 PM To: Nafiur Rahman <nrahman@kawarthalakes.ca> Subj ct: Re: City of Kawartha Lakes- Fenelon Falls
Good Afternoon Nafiur, I was wondering where we can obtain a copy of the City of Kawartha Lakes Water/Wastewater Master Servicing Strategy? Hope to hear from you at your earliest convenience. Kind Regards, | Land Development Planner A. 80 Micro Court, Suite 105 Markham ON L3R 9Z5 E. P. The link ed image cannot be display ed. The file may hav e been mov ed, renamed, or deleted. Verify that the link points to the correct file and location.
This email and any files transmitted with it are confidential and intended solely for the use of the individual or entity to which they are addressed. If you have received this email in error, please notify the sender. Please note that any views or opinions presented in this email are solely those of the author and do not necessarily represent those of the Company. The Company accepts no liability for any damages caused by any virus transmitted by this email. The link ed image cannot be display ed. The file may hav e been mov ed, renamed, or deleted. Verify that the link points to the correct file and location.
Error! Filename not specified.Please do not print this email unless it is absolutely necessary. Every time you don't print an email, you are helping the environment.
On Mon, Jul 29, 2024 at 4:36 PM Nafiur Rahman <nrahman@kawarthalakes.ca> wrote: Good Afternoon
,
The Woodville and Fenelon Falls Standpipes Rehabilitation project is entirely for lifecycle repair and replacement so that the infrastructures can be maintained in a sate of good repair and be compliant with Drinking Water Works Permit and License. The major scopes of this project are 3
recoating of interior and exterior concrete, crack repair and some safety equipment replacement. There is no correlation between this work and Servicing Master Plan Study. I hope this clarifies your question. Thanks Nafiur Rahman, P.Eng., PMP Supervisor, Environmental Capital Project Management Infrastructure Design and Construction, Engineering and Corporate Assets City of Kawartha Lakes www.kawarthalakes.ca Error! Filename not specified.
From: S nt: Monday, July 29, 2024 4:23 PM To: Nafiur Rahman <nrahman@kawarthalakes.ca> Subj ct: City of Kawartha Lakes- Fenelon Falls
Good Afternoon Nafiur, I was wondering if you could briefly explain what is the Woodville and Fenelon Falls Standpipes Rehabilitation (from the July 23rd CKWL Regular Council Meeting) and is there a correlation between this and the City of Kawartha Lakes Water and Wastewater Servicing Capacity Master Plan update? Please advise. Thank you very much. Kind Regards, | Land Development Planner A. 327 Renfrew Dr., Suite 201 Markham ON L3R 9S8 E. P. Error! Filename not specified. This email and any files transmitted with it are confidential and intended solely for the use of the individual or entity to which they are addressed. If you have received this email in error, please notify the sender. Please note that any views or opinions presented in this email are solely those of the author and do not necessarily represent those of the Company. The Company accepts no liability for any damages caused by any virus transmitted by this email.
Error! Filename not specified.Error! Filename not specified.Please do not print this email unless it is absolutely necessary. Every time you don't print an email, you are helping the environment. This message, including any attachments, is privileged and intended only for the addressee(s) named above. If you are not the intended recipient, you must not read, use or disseminate the information contained in this e-mail. If you have received this e-mail in error, please notify the sender immediately by telephone, fax, or e-mail and shred this confidential e-mail, including any attachments, without making a copy. Access to this e-mail by anyone else is unauthorized. This message, including any attachments, is privileged and intended only for the addressee(s) named above. If you are not the intended recipient, you must not read, use or disseminate the information contained in this e-mail. If you have received this e-mail in error, please notify the sender immediately by telephone, fax, or e-mail and shred this confidential e-mail, including any attachments, without making a copy. Access to this e-mail by anyone else is unauthorized.
4
This message, including any attachments, is privileged and intended only for the addressee(s) named above. If you are not the intended recipient, you must not read, use or disseminate the information contained in this e-mail. If you have received this e-mail in error, please notify the sender immediately by telephone, fax, or e-mail and shred this confidential e-mail, including any attachments, without making a copy. Access to this e-mail by anyone else is unauthorized.
5
Sydney McIvor From: Sent: To: Cc: Subject:
Friday, March 28, 2025 1:41 PM nrahman Abe Khademi; cpurdy; Mateusz Lewandowski; Sydney McIvor Re: City of Kawartha Lakes- Fenelon Falls
Hello Nafiur, Thank you for your response. Much appreciated. Kind Regards, | Land Development Planner A. 80 Micro Court, Suite 105 Markham ON L3R 9Z5 E. P. To help protect y our priv acy , Microsoft Office prev ented automatic download of this picture from the Internet.
This email and any files transmitted with it are confidential and intended solely for the use of the individual or entity to which they are addressed. If you have received this email in error, please notify the sender. Please note that any views or opinions presented in this email are solely those of the author and do not necessarily represent those of the Company. The Company accepts no liability for any damages caused by any virus transmitted by this email. To help protect y our priv acy , Micro so ft Office prev ented auto matic download of this pictu re from the In ternet.
Please do not print this email unless it is absolutely necessary. Every time you don't print an email, you are helping the environment.
On Thu, Mar 27, 2025 at 11:39 AM Nafiur Rahman <nrahman@kawarthalakes.ca> wrote: Good morning Thank you for your email. We are currently reviewing comments received within the comment period. If no changes are required, the report posted to the website would be the final report. Based on the recommended upgrades and projects identified in the study report, our corporate assets team is currently undertaking Development Charges study and preparing a long-term financial plan for implementation. Regards, Nafiur
1
From: S nt: Monday, March 24, 2025 10:04 AM To: Nafiur Rahman Subj ct: Re: City of Kawartha Lakes- Fenelon Falls Good Morning Nafiur, The commenting deadline for the Water and Wastewater Servicing Capacity Master Plan was on Friday. Our office was wondering what is the next steps regarding the report and the feedback from the public? Hope to hear from you at your earliest convenience. Kind Regards,
| Land Development Planner A. 80 Micro Court, Suite 105 Markham ON L3R 9Z5 E. P. To help protect y our priv acy , Microsoft Office prev ented automatic download of this picture from the Internet.
This email and any files transmitted with it are confidential and intended solely for the use of the individual or entity to which they are addressed. If you have received this email in error, please notify the sender. Please note that any views or opinions presented in this email are solely those of the author and do not necessarily represent those of the Company. The Company accepts no liability for any damages caused by any virus transmitted by this email. To help protect y our priv acy , Micro so ft Office prev ented auto matic download of this pictu re from the In ternet.
Please do not print this email unless it is absolutely necessary. Every time you don't print an email, you are helping the environment.
On Fri, Dec 13, 2024 at 11:33 AM Nafiur Rahman <nrahman@kawarthalakes.ca> wrote: Hi
The presentation slides are now available on the City website. Here is the link. Please scroll down to City-wide section.
https://www.kawarthalakes.ca/en/municipal-services/major-projects.aspx
2
Thanks Nafiur
From: S nt: Thursday, December 12, 2024 3:44 PM To: Nafiur Rahman <nrahman@kawarthalakes.ca> Subj ct: Re: City of Kawartha Lakes- Fenelon Falls
Hello Nafiur,
Thank you for the update. Is it possible to provide a copy of the PowerPoint presentation from Tuesday's meeting? Thank you.
Kind Regards,
| Land Development Planner A. 80 Micro Court, Suite 105 Markham ON L3R 9Z5 E. P.
This email and any files transmitted with it are confidential and intended solely for the use of the individual or entity to which they are addressed. If you have received this email in error, please notify the sender. Please note that any views or opinions presented in this email are solely those of the author and do not necessarily represent those of the Company. The Company accepts no liability for any damages caused by any virus transmitted by this email.
3
Error! Filename not specified.Please do not print this email unless it is absolutely necessary. Every time you don't print an email, you are helping the environment.
On Thu, Dec 12, 2024 at 2:07 PM Nafiur Rahman <nrahman@kawarthalakes.ca> wrote: Good afternoon
The project hasn’t fully completed yet. We are targeting to get the project file report to council in February 2025.
Thank you.
Nafiur
From: S nt: Thursday, December 12, 2024 1:56 PM To: Nafiur Rahman <nrahman@kawarthalakes.ca> Subj ct: Re: City of Kawartha Lakes- Fenelon Falls
Good Afternoon Nafiur,
I was wondering where we can obtain a copy of the City of Kawartha Lakes Water/Wastewater Master Servicing Strategy? Hope to hear from you at your earliest convenience.
Kind Regards,
4
| Land Development Planner A. 80 Micro Court, Suite 105 Markham ON L3R 9Z5 E. P.
This email and any files transmitted with it are confidential and intended solely for the use of the individual or entity to which they are addressed. If you have received this email in error, please notify the sender. Please note that any views or opinions presented in this email are solely those of the author and do not necessarily represent those of the Company. The Company accepts no liability for any damages caused by any virus transmitted by this email.
Error! Filename not specified.Please do not print this email unless it is absolutely necessary. Every time you don't print an email, you are helping the environment.
On Mon, Jul 29, 2024 at 4:36 PM Nafiur Rahman <nrahman@kawarthalakes.ca> wrote: Good Afternoon
The Woodville and Fenelon Falls Standpipes Rehabilitation project is entirely for lifecycle repair and replacement so that the infrastructures can be maintained in a sate of good repair and be compliant with Drinking Water Works Permit and License. The major scopes of this project are recoating of interior and exterior concrete, crack repair and some safety equipment replacement. There is no correlation between this work and Servicing Master Plan Study.
I hope this clarifies your question.
Thanks
Nafiur Rahman, P.Eng., PMP Supervisor, Environmental Capital Project Management Infrastructure Design and Construction, Engineering and Corporate Assets 5
City of Kawartha Lakes
www.kawarthalakes.ca
Error! Filename not specified.
From: S nt: Monday, July 29, 2024 4:23 PM To: Nafiur Rahman <nrahman@kawarthalakes.ca> Subj ct: City of Kawartha Lakes- Fenelon Falls
Good Afternoon Nafiur,
I was wondering if you could briefly explain what is the Woodville and Fenelon Falls Standpipes Rehabilitation (from the July 23rd CKWL Regular Council Meeting) and is there a correlation between this and the City of Kawartha Lakes Water and Wastewater Servicing Capacity Master Plan update? Please advise. Thank you very much.
Kind Regards,
| Land Development Planner A. E. P. Error! Filename not specified.
6
This email and any files transmitted with it are confidential and intended solely for the use of the individual or entity to which they are addressed. If you have received this email in error, please notify the sender. Please note that any views or opinions presented in this email are solely those of the author and do not necessarily represent those of the Company. The Company accepts no liability for any damages caused by any virus transmitted by this email.
Error! Filename not specified.Error! Filename not specified.Please do not print this email unless it is absolutely necessary. Every time you don't print an email, you are helping the environment. This message, including any attachments, is privileged and intended only for the addressee(s) named above. If you are not the intended recipient, you must not read, use or disseminate the information contained in this e-mail. If you have received this e-mail in error, please notify the sender immediately by telephone, fax, or e-mail and shred this confidential e-mail, including any attachments, without making a copy. Access to this e-mail by anyone else is unauthorized. This message, including any attachments, is privileged and intended only for the addressee(s) named above. If you are not the intended recipient, you must not read, use or disseminate the information contained in this e-mail. If you have received this e-mail in error, please notify the sender immediately by telephone, fax, or e-mail and shred this confidential e-mail, including any attachments, without making a copy. Access to this e-mail by anyone else is unauthorized. This message, including any attachments, is privileged and intended only for the addressee(s) named above. If you are not the intended recipient, you must not read, use or disseminate the information contained in this e-mail. If you have received this e-mail in error, please notify the sender immediately by telephone, fax, or e-mail and shred this confidential e-mail, including any attachments, without making a copy. Access to this e-mail by anyone else is unauthorized.
7
Sydney McIvor From: Sent: To: Cc: Subject:
Mateusz Lewandowski Wednesday, April 2, 2025 8:52 AM nrahman Abe Khademi; Sydney McIvor RE: CKL Water and Wastewater Servicing and Capacity Master Plan
Hello Nafiur, We will review and log the comments. Regards,
Mateusz Lewandowski, P.Eng PROJECT MANAGER
From: Nafiur Rahman <nrahman@kawarthalakes.ca> S nt: Wednesday, April 2, 2025 8:49 AM To: Mateusz Lewandowski <mateusz.lewandowski@tylin.com> Cc: Abe Khademi <abe.khademi@tylin.com> Subj ct: Fw: CKL Water and Wastewater Servicing and Capacity Master Plan
Hi Mat, Please see email below for your review. Thanks Nafiur
From: Kirk Timms <ktimms@kawarthalakes.ca> S nt: Tuesday, April 1, 2025 5:13 PM To: Nafiur Rahman <nrahman@kawarthalakes.ca> Cc: Corby Purdy <cpurdy@kawarthalakes.ca>; Roberta Perdue <rperdue@kawarthalakes.ca> Subj ct: FW: CKL Water and Wastewater Servicing and Capacity Master Plan
Hi Nafiur,
Are you able to review the email below and provide a response that I can send along to Counterpoint? 1
Thank you, Kirk
From: S nt: Tuesday, April 1, 2025 2:26 PM To: Kirk Timms <ktimms@kawarthalakes.ca> Cc: Subj ct: CKL Water and Wastewater Servicing and Capacity Master Plan
Hi Kirk,
I hope this email finds you well.
I wanted to reach out regarding a couple questions related to the overall wastewater servicing of Lindsay, Ontario.
Upon review of the January 2025 CKL Water and Wastewater Servicing and Capacity Master Plan, we noticed there is a discrepancy for the overall capacity of the Lindsay Street North Sanitary Pumping Station.
In Technical Memorandum #4, page 66, section 3.1.2.3, the capacity of the Lindsay Street N SPS is described as follows.
2
Later on in Technical Memorandum #6, table 4-1, on page 65, the following capacity is stated:
Could you please confirm whether the Lindsay Street N SPS has a capacity of 690 L/s or 600 L/s?
I was also wondering if you could please confirm if the following future developments in the Lindsay Area are currently allocated to the stretch of Sanitary trunk main along Alcorn Drive which ultimately discharges to the Lindsay Street North SPS?
LIN-G-2: Ravines of Lindsay, 146 units 3
LIN-G-25: 2011 Growth Management Strategy - 29 units LIN-I-AA: 2011 Growth Management Strategy - 29 units LIN-G-22: 2011 Growth Management Strategy – 263 units for all of Woods of Jennings Creek Development (58 lots built in phase 1) LIN-G-21: 2011 Growth Management Strategy - 15 units LIN-G-20: Fernbrook Homes, 155 units
Thank you and please let me know if you require any clarification.
Regards,
4
Dillon Consulting Limited 425 Adelaide St W, Suite 300 Toronto, Ontario, M5V 3C1 Twww.dillon.ca
This message is directed in confidence solely to the person(s) named above and may contain privileged, confidential or private information which is not to be disclosed. If you are not the addressee or an authorized representative thereof, please
contact the undersigned and then destroy this message.
Ce message est destiné uniquement aux personnes indiquées dans l'entête et peut contenir une information privilégiée, confidentielle ou privée et ne pouvant être divulguée. Si vous n'êtes pas le destinataire de ce message ou une personne autorisée à le recevoir, veuillez communiquer avec le soussigné et ensuite détruire ce message.
From: Kirk Timms <ktimms@kawarthalakes.ca> S nt: Tuesday, April 1, 2025 5:13 PM To: Nafiur Rahman <nrahman@kawarthalakes.ca> Cc: Corby Purdy <cpurdy@kawarthalakes.ca>; Roberta Perdue <rperdue@kawarthalakes.ca> Subj ct: FW: CKL Water and Wastewater Servicing and Capacity Master Plan
Hi Nafiur,
Are you able to review the email below and provide a response that I can send along to Counterpoint?
Thank you, Kirk
From: S nt: Tuesday, April 1, 2025 2:26 PM To: Kirk Timms <ktimms@kawarthalakes.ca> Cc: S 5
Subj ct: CKL Water and Wastewater Servicing and Capacity Master Plan
Hi Kirk,
I hope this email finds you well.
I wanted to reach out regarding a couple questions related to the overall wastewater servicing of Lindsay, Ontario.
Upon review of the January 2025 CKL Water and Wastewater Servicing and Capacity Master Plan, we noticed there is a discrepancy for the overall capacity of the Lindsay Street North Sanitary Pumping Station.
In Technical Memorandum #4, page 66, section 3.1.2.3, the capacity of the Lindsay Street N SPS is described as follows.
Later on in Technical Memorandum #6, table 4-1, on page 65, the following capacity is stated:
6
Could you please confirm whether the Lindsay Street N SPS has a capacity of 690 L/s or 600 L/s?
I was also wondering if you could please confirm if the following future developments in the Lindsay Area are currently allocated to the stretch of Sanitary trunk main along Alcorn Drive which ultimately discharges to the Lindsay Street North SPS?
LIN-G-2: Ravines of Lindsay, 146 units LIN-G-25: 2011 Growth Management Strategy - 29 units LIN-I-AA: 2011 Growth Management Strategy - 29 units LIN-G-22: 2011 Growth Management Strategy – 263 units for all of Woods of Jennings Creek Development (58 lots built in phase 1) LIN-G-21: 2011 Growth Management Strategy - 15 units LIN-G-20: Fernbrook Homes, 155 units
7
Thank you and please let me know if you require any clarification.
Regards,
Dillon Consulting Limited 425 Adelaide St W, Suite 300 Toronto, Ontario, M5V 3C1 Twww.dillon.ca
This message is directed in confidence solely to the person(s) named above and may contain privileged, confidential or private information which is not to be disclosed. If you are not the addressee or an authorized representative thereof, please
contact the undersigned and then destroy this message.
Ce message est destiné uniquement aux personnes indiquées dans l'entête et peut contenir une information privilégiée, confidentielle ou privée et ne pouvant être divulguée. Si vous n'êtes pas le destinataire de ce message ou une personne autorisée à le recevoir, veuillez communiquer avec le soussigné et ensuite détruire ce message. 8
Sydney McIvor From: Sent: To: Cc: Subject: Attachments:
Kirk Timms <ktimms@kawarthalakes.ca> Thursday, June 5, 2025 8:57 AM 'Buffam, Ben' RE: CKL Water and Wastewater Servicing and Capacity Master Plan Lindsay St N SPS Pump stiker.jpg; Pump Curve - Lindsay St N LCS - Fontaine.pdf
Good morning Ben, We have received new information from OCWA and the pump manufacturer about the model and size of existing pumps at the Lindsay St N SPS. There are 3 pumps at the station – 2 duty and 1 standby, each 200 L/s (NOT 345 L/s). So, the theoretical firm capacity (largest pump out of service) of the station is 400 L/s. See attached pump sticker and pump curve. Please note that a 4th pump (2nd back up within the empty slot) has been considered to be designed and installed at this station in the long-term financial plan. Thank you, Kirk From: Kirk Timms Sent: Monday, April 7, 2025 9:54 AM To: 'Buffam, Ben' <bbuffam@counterpointeng.com> Cc: Subject: RE: CKL Water and Wastewater Servicing and Capacity Master Plan
Good morning Ben, The current firm capacity of Lindsay St N SPS is 690 L/s (345 L/s each). At this time only LIN-G21 is not proposed to connect to the sanitary main along Alcorn Drive, however flows from all developments mentioned below will ultimately be discharged to Lindsay St N SPS. Thank you, Kirk From: Buffam, Ben <bbuffam@counterpointeng.com> Sent: Tuesday, April 1, 2025 2:26 PM To: Kirk Timms <ktimms@kawarthalakes.ca> Cc: Subject: CKL Water and Wastewater Servicing and Capacity Master Plan 1
Hi Kirk, I hope this email finds you well. I wanted to reach out regarding a couple questions related to the overall wastewater servicing of Lindsay, Ontario. Upon review of the January 2025 CKL Water and Wastewater Servicing and Capacity Master Plan, we noticed there is a discrepancy for the overall capacity of the Lindsay Street North Sanitary Pumping Station. In Technical Memorandum #4, page 66, section 3.1.2.3, the capacity of the Lindsay Street N SPS is described as follows.
Later on in Technical Memorandum #6, table 4-1, on page 65, the following capacity is stated:
Could you please confirm whether the Lindsay Street N SPS has a capacity of 690 L/s or 600 L/s?
2
I was also wondering if you could please confirm if the following future developments in the Lindsay Area are currently allocated to the stretch of Sanitary trunk main along Alcorn Drive which ultimately discharges to the Lindsay Street North SPS?
LIN-G-2: Ravines of Lindsay, 146 units LIN-G-25: 2011 Growth Management Strategy - 29 units LIN-I-AA: 2011 Growth Management Strategy - 29 units LIN-G-22: 2011 Growth Management Strategy – 263 units for all of Woods of Jennings Creek Development (58 lots built in phase 1) LIN-G-21: 2011 Growth Management Strategy - 15 units LIN-G-20: Fernbrook Homes, 155 units
Thank you and please let me know if you require any clarification. Regards, Dillon Consulting Limited
3
This message is directed in confidence solely to the person(s) named above and may contain privileged, confidential or private information which is not to be disclosed. If you are not the addressee or an authorized representative thereof, please
contact the undersigned and then destroy this message. Ce message est destiné uniquement aux personnes indiquées dans l'entête et peut contenir une information privilégiée, confidentielle ou privée et ne pouvant être divulguée. Si vous n'êtes pas le destinataire de ce message ou une personne autorisée à le recevoir, veuillez communiquer avec le soussigné et ensuite détruire ce message.
4
Organization
Last Name
First Name
Phone
Property Address
Additional Comment
Stakeholder Response
Responded to?
Response Date?
TYLin Response
Politis Engineering
Any idea when the report will be made available to the public?
yes
2025 02 24
The City of Kawartha Lakes Water and Wastewater Servicing Capacity Master Plan Report is now available for public review. The report can be accessed on the project website here (scroll to city-wide section): https://www.kawarthalakes.ca/en/municipal-services/major-projects.aspx A hard copy report is also available at the City Clerk’s Office and Lindsay Library for public viewing.
Odan Detech Group
I did not receive any updates as per the email below. Can you confirm that I am on the distribution list as I was recently informed that the study is complete.
yes
2025 02 24
Confirmed that you are on the distribution list. Please find attached Notice of Project Completion. If you have any questions, please feel free to contact Project Manager Abe Khademi, as noted in the attached letter.
Please see attached.
yes
2025 03 11
I would like to mention that we had a previous meeting with Alderville First Nation when the Notice of Commencement of the Master Plan Study was issued. The Master Plan study that we have just completed actually identifies individual projects to accommodate future growth. However, during the implementation of these projects further detailed investigations will be undertaken following the Municipal Class EA planning and design process.
Please see our comments attached.
yes
2025 03 24
Thank you for the comments provided, confirming that they have been reviewed by the project team.
Alderville First Nation
Thank you for your e-mail – and thank you for reminding us of the engagement thus far. Apologies, it is challenging at times to keep everything sorted in terms of projects, and their timing. Yes – I can just review the Master Plan Project File Report – no need to meet again at this time.
Ministry of Citizenship and Multiculturalism (MCM)
Counterpoint Engineering
Hello Digram
,
Thank you for your response. Much appreciated. Kind Regards,
Counterpoint Engineering
Please see attached for comments of the master plan for your consideration.
yes
2025 04 08
1.A master plan serves as a high-level planning tool to evaluate water and wastewater capacity within the collection, distribution, and treatment systems, and to identify necessary upgrades to meet the anticipated growth. Considering several factors, such as, current unit density, water leakage, inflow & infiltration, accessory residential unit (ARU), etc. the City decided to keep the design criteria unchanged. 2.Typically, a master plan update is recommended to be completed within a 5–10-year timeframe, depending on the growth rate and the overall impacts on the water and wastewater systems. The City will consider a phasing approach in the design and construction of major facility upgrades/expansion. 3.The master plan utilizes the most up-to-date information available at the time of its completion. Any changes or impacts will need to be assessed individually during the development application review process. 4.This will be evaluated during the development application review process. 5.Any storage deficits for each respective community will require a separate Class EA study to identify the preferred alternative followed by design and construction.
The commenting deadline for the Water and Wastewater Servicing Capacity Master Plan was on Friday. Our office was wondering what is the next steps regarding the report and the feedback from the public? Hope to hear from you at your earliest convenience.
yes
2025 03 27
Thank you for your email. We are currently reviewing comments received within the comment period. If no changes are required, the report posted to the website would be the final report. Based on the recommended upgrades and projects identified in the study report, our corporate assets team is currently undertaking Development Charges study and preparing a long-term financial plan for implementation.
Could you please confirm whether the Lindsay Street N SPS has a capacity of 690 L/s or 600 L/s? I was also wondering if you could please confirm if the following future developments in the Lindsay Area are currently allocated to the stretch of Sanitary trunk main along Alcorn Drive which ultimately discharges to the Lindsay Street North SPS?
Good morning
,
The current firm capacity of Lindsay St N SPS is 690 L/s (345 L/s each).
yes
2025 04 07
At this time only LIN-G21 is not proposed to connect to the sanitary main along Alcorn Drive, however flows from all developments mentioned below will ultimately be discharged to Lindsay St N SPS.
ÈÉÊÉËÌÍÎÊÊÏÐÑÎÒÓ
ÓÔÕÖÎ×ÎØÔÙÕÚÖÖÚÎÒÙÛÚÜÝÎ×ÎÞßàÖááâ
123445 678
!"#$%5&'$(()&*52$(()+5,-,%2.,3,5/)01,2 3! 45166,(7&5/84&*99166,(+14182/%:4$82/8;014(2 4<2/:./8&<:,%%4-4&*<<:,%%4-+14182/%:4$82/8;014(2=&4>$8,&?,14194&*(@,1419+A$334801,2=&4#,%3&B/:5,4 *5%/:5,+14182/%:4$82/8;014(2 C&,22,1.(/82)&DEEFG H1(:&I1%J/&K&L$8A),@&<2&M&LI<&K&N482,$8/0:A6=&L$8A),@&<2&M&<H<&H1(:&)2$5/%0O:;=
PQQRSTQUVWVXSYZV[ S \ZS]^_ZSUZ`ZW_ZRSVZaSWVbQUT^cWQVSbUQTSde\fS^VRSc]ZSghTgST^Vhb^`chUZUS^iQhcSc]ZSTQRZj ^VRSkWlZSQbSZmWkcWVXSghTgkS^cSc]ZSnWVRk^oSpcSqSprps S t]ZUZS^UZSuSghTgkS^cSc]ZSkc^cWQVSvSwSRhcoS^VRSxSkc^VRio[SZ^`]SwyySnzkS{qdtSu|}Snzk~sSpQ[Sc]Z c]ZQUZcẀ^jSbWUTS`^g^`WcoS{j^UXZkcSghTgSQhcSQbSkZU_ẀZ~SQbSc]ZSkc^cWQVSWkS|yySnzksSpZZS^cc^`]ZR ghTgSkcẀ ZUS^VRSghTgS`hU_Zs S rjZ^kZSVQcZSc]^cS^S|c]SghTgS{wVRSi^` ShgSaWc]WVSc]ZSZTgcoSkjQc~S]^kSiZZVS`QVkWRZUZRScQSiZ RZkWXVZRS^VRSWVkc^jjZRS^cSc]WkSkc^cWQVSWVSc]ZSjQVX cZUTSbWV^V`W^jSgj^Vs S t]^V SoQh[ WU S ¡¢£ ¤ ¥¦§¨ ¦© ¥ ª««§¨ ¬ § ®© ®© ¯° ± ²³ ´®© µ© ´ ¶ ª´´ ¶¬ § ®© ®© ¯° ±· ¸ §« ª §«¬ ° ±· ¹© ª © ¬ § ®© ®© ¯° ± º»¼ ³ ¹½¢ ¾ ¿ À ®© À ®©¶ ®© ´© Á ¯ ¾ ® ®© Â
à PQQRSTQUVWVXSYZV[ S t]ZS`hUUZVcSbWUTS`^g^`WcoSQbSnWVRk^oSpcSqSprpSWkSÄÅySnzkS{u|}SnzkSZ^`]~s S fcSc]WkScWTZSQVjoSnÆq PwxSWkSVQcSgUQgQkZRScQS`QVVZ`cScQSc]ZSk^VWc^UoST^WVS^jQVXSfj̀QUVSÇUW_Z[ ]QaZ_ZUSbjQakSbUQTS^jjSRZ_ZjQgTZVckSTZVcWQVZRSiZjQaSaWjjShjcWT^cZjoSiZSRWk`]^UXZRScQSnWVRk^o pcSqSprps S t]^V SoQh[ WU S ãààäÝÏÉÉáßàÖááâåáææÕçÚåçáèÉèÔÕÖÉÕÛÉÒÒéâÒØéêÓèëÊìØíîïðíñìòéàóòéÌìôÊÕóñçñïðõöÓñìãÞðõèÞ÷øñíéÒéÒùúû÷àíüèøýþÙéüÈïÿËþ0Ýâáé1
ÊÉÐ
¡
01234 6789 6 !"#4 $7%&9' ()*+, - ./.0 .1.2 34 524 6+*7 $+ % 89 : 8 ; < = 8 : >?4 @A)B @)9**CD EE ; F 4+9 G9HC7I J K == F 69*, L)79 8 8 MNO!?#4 P6Q R9A* 9& R9%AD9A* @*S+H+T 9& P9)9H+A' 49%A* 3,9
U VWUXWYZ[U U \U]^_`Ua]WbÙcdWeUfWghbUi^jUk`eelU U \UkdgàhUa^UY`dm]U^jaUY`ndYhWgnUdUm^j_èUoj`baW^gbUY`edàhUa^Ua]`U^p`YdeeUkdbàkdàYUb`YpWmWgnU^fUqWghbdi[ rgadYW^lU U s_^gUY`pẀkU^fUa]`UtdgjdYiUuvuwUxXqUydàYUdghUydbàkdàYUz`YpWmWgnUdghUxd_dmWaiU{dbàYU|edg[Uk` g^aWm`hUa]`Y`UWbUdUhWbmY`_dgmiUf^YUa]`U^p`YdeeUmd_dmWaiU^fUa]`UqWghbdiUzaY``aU}^Ya]UzdgWadYiU|jc_Wgn zadaW^glU U \gU~`m]gWmdeU{`c^YdghjcU [U_dn`U [Ub`maW^gU l lul [Ua]`Umd_dmWaiU^fUa]`UqWghbdiUzaY``aU}Uz|zUWb h`bmYW `hUdbUf^ee^kblU U
U qdàYU^gUWgU~`m]gWmdeU{`c^YdghjcU [Uad èU [U^gU_dn`U w[Ua]`Uf^ee^kWgnUmd_dmWaiUWbUbadàh U
¢ £ ¡¤¥¥ ¦ ¤¦§ § ¨¡ ¨© §ª « ¬®¯¬°«±¨ ²±¨ «³ ²°¦°®¯´µ °«¢ ¯´§ ¶·°¬¨ ¨ ¸¹º¶ ¬»§·¼½ ¨» ®¾ ½¿ ¡¨À
§¨©ª̈«¬©©®¯°±²
²³µ́¶·³¸¹́µµ¹±¸º¹»¼¶½¾¿µÀÀÁ
1234562374898 2 8 8 8 596 88 9 9 979 62 2 9 942 258 623 234574898 2 82442 3 3 858 8427 8 8 596 899 8 3 8 4694429 85 2 8 8 2 9 9 6 3! 9 942 42 " 8 34 9 846 5 9 8 2 8 596 88 2 #$%&'&()*+,-./01*23*#./41,56*789*:/.;1* #$%&'&(<)*(=77*'>2?;@*A,/,B0C0/;*D;>,;0B5*&*(E*:/.;1 #$%&$&FF)*(=77*'>2?;@*A,/,B0C0/;*D;>,;0B5*&*(E*:/.;1 #$%&'&(()*(=77*'>2?;@*A,/,B0C0/;*D;>,;0B5*G*(9H*:/.;1*32>*,II*23*J2241*23*K0//./B1*L>00M N0-0I2OC0/;*P<Q*I2;1*R:.I;*./*O@,10*7S #$%&'&(7)*(=77*'>2?;@*A,/,B0C0/;*D;>,;0B5*&*7<*:/.;1 #$%&'&(=)*T0>/R>22M*U2C016*7<<*:/.;1
V 9!623957489848 8!2 623 8W3 896 49 9 2X Y8 9 5Z [\]^[_``ab cdeefghifgjkeldgmhndodlpq rstuvwxyz{wxu|}u~ u| {}xu } u }z{ u t u u ur s r t ¡ ¢¢
V 8 9 8 5 8 85 2 58 8 24846 2 878 2£¤ 9 859¥2 895 96 2 9 7 48 85Z2 58 942 7 9 8 2 9 2 2 2¥85 4285X 6239 8 2 8955 8 882 9 93 2 ¦85 87 88 9 8 8 82Z74898
2 9 8358 8595 8 58 26 8 9 8X
¿¿Ã¼®¨À̈¾¿µÀÀÁÄÀÅǺƹÄÆÀÇÇ̈³µ́¨º́±̈±ÈÁ±·ÈɲÇÊ©Ë·ÌÍÎÏÌÐËÑÈ¿ÒÑÈ«ËÓ©Ò́ÐÆÐÎÏÔÕ²Ð˽ÏÔǽÖ×ÐÌȱȱØÙÚÖ¿ÌÛÇ×ÜݸÈÛ§ÎÞªÝß¼ÁÀÈà
ͨ¯
!"# $%&#'(
()*+#,#-).*/++/#'.0/12#,#345+667
12324456224782479 9 23275 2 4 24989 24854 27 7227 27 729 29 3579 9 9 692 982792 2 9 2272 57 7 289 6 2 9 4 724 54 2824795759 282 23244562 2 2 4 2 57 942 2 2 2 9 29 2 33 9 2 5 2 24 4496 272497287 9 2 23244562
85592$ 645+667:6;;*</:<6= =)*+ *0 ''>7'->?(=@ A-BCDEBFAG>5HG>!AI *HF<FDEJK(FA83EJ=3LMFB>'>'NOPL5BQ=MRS.>Q DT SU276>V
% %
Project File Report Kawartha Lakes Water-Wastewater Master Plan Capacity Assessment
APPENDIX B COMPREHENSIVE WATER/WASTEWATER SYSTEM CAPACITY ASSESSMENT (TECHNICAL MEMORANDUM 4)
Technical Memorandum 4
Kawartha Lakes Water-Wastewater Master Plan Facility Wide Comprehensive Water/ Wastewater System Capacity Assessment January 2025 | CKL Contract 2022-13-CP | TYLin Project 10599 City of Kawartha Lakes
Technical Memorandum #4 Kawartha Lakes Water-Wastewater Master Plan Capacity Assessment
APPENDIX A Capacity Assessment Tables
Technical Memorandum #4 Kawartha Lakes Water Wastewater Servicing and Capacity Master Plan
EXECUTIVE SUMMARY The City of Kawartha Lakes has experienced a significant increase in growth over the recent years which is driving the demands for improvements and upgrades to its water and wastewater infrastructure. The City retained T.Y. Lin International Canada Inc. (TYLin) in 2022 to complete the Water and Wastewater Master Plan based on the new Growth Management Strategy initiated in 2021. The Master Plan will identify the existing servicing constraints and provide a long-term water and wastewater servicing strategy that supports existing communities and growth to 2051 and beyond. To characterize the capacity to service the growth projections through the Master Plan update process and identify the existing servicing constraints, TM4 provided a desktop capacity assessment of each of the water and wastewater facilities owned by the City of Kawartha Lakes. This memorandum is intended to review and document the facility capacities through the various communities in the City. For the treatment plants, the reserve capacity is analyzed through two distinct approaches, reserve capacity to 80% rated capacity where a Class Environmental Assessment for a plant expansion is typically triggered, and reserve capacity to 100% rated capacity. The capacity of the City of Kawartha Lakes owned Water Treatment Plants (WTP), Booster Pumping Stations (BPS), Wastewater Treatment Plants (WWTP) and Sewage Pumping Stations (SPS) are summarized in the following tables. This capacity assessment reviewed and extracted information from existing documentation provided by the City of Kawartha Lakes, including: ► Ontario Drinking Water Works Permits/Licenses (DWWP/DWWL); ► Permit to Take Water (PTTW); ► Environmental Compliance Approvals (ECAs); ► Engineer’s Reports; ► Annual Performance Reports; ► SCADA Data; and, ► Meetings with facility operators. The review of capacity information from existing documents was supplemented with design calculations to obtain theoretical process capacities where published process capacities have not been documented.
Project Number 10599 January 2025
Page | i
Technical Memorandum #4 Kawartha Lakes Water Wastewater Servicing and Capacity Master Plan
The facility capacities are summarized in the following tables: ► Table ES-1: Water Treatment Plants •
The City owns a total of 21 water treatment plants
•
Water treatment plants are sized based on Maximum Day Demands (MDD)
•
The table summarizes the rated MDD capacity of each facility, the highest reported MDD from the past years, the percentage of the plant’s capacity utilized in that highest reported MDD, and the remaining MDD capacity to 80% of the plant capacity and 100% of the plant capacity
•
Planning for treatment plant expansions is typically started as a plant nears 80% capacity.
► Table ES-2: Water Booster Pumping Stations •
The City owns two booster pumping stations
•
These are considered separate from the high-lift pumps at the treatment plants, whose capacities are typically tied to the rated capacities of the plants themselves
•
The firm capacity of each station is identified, which considers the pumping capacity with the largest pump out-of-service
► Table ES-3: Water Storage Facilities •
The City owns five storage facilities (elevated tanks and in-ground reservoirs)
•
These are considered separate from storage included as part of the water treatment plants themselves
► Table ES-4: Wastewater Treatment Plants: •
The City owns a total of six wastewater treatment plants
•
Wastewater treatment plants are sized based on the Average Day Flows (ADF)
•
The table summarizes the rated ADF capacity of each facility, the highest reported ADF from the past years, the percentage of the plant’s capacity utilized in that highest reported ADF, and the remaining ADF capacity to 80% of the plant capacity and 100% of the plant capacity
•
Planning for treatment plant expansions is typically started as a plant nears 80% capacity.
► Table ES-5: Sewage Pumping Stations: •
The City owns 28 sewage pumping stations
•
The firm capacity of each station is identified, which considers the pumping capacity with the largest pump out-of-service
Project Number 10599 January 2025
Page | ii
Technical Memorandum #4 Kawartha Lakes Water Wastewater Servicing and Capacity Master Plan
Table ES-1: Water Treatment Plant Capacity Summary Plant
Rated Capacity [m3/d]
5-Year Max Demand [m3/d]
5-Year Capacity [%]
Reserve Capacity to 80% of Rated [m3/d]
Reserve Capacity to 100% of Rated [m3/d]
Lindsay WTP
22,730
13,213
58%
4,971
9,517
Bobcaygeon WTP
5,184
3,575
69%
572
1,609
Fenelon Falls WTP
4,100
1,693
41%
1,587
2,407
Woodville WTP
588
322
55%
148
266
Birch Point WTP
360
198
55%
90
162
Canadiana Shores WTP
984
268
27%
519
716
Janetville WTP
449
242
54%
117
207
Kings Bay WTP
409
235
57%
92
174
Kinmount WTP
340
88
26%
184
252
Manilla WTP
157
86
55%
40
71
Manorview WTP
302
67
22%
175
235
Mariposa Estates WTP
72
67
93%
-9
5
Norland WTP
264
186
70%
25
78
Omemee WTP
461
92
20%
277
369
Pinewood WTP
590
274
46%
198
316
Pleasant Point WTP
490
145
30%
247
345
Sonya WTP
170
78
46%
58
92
Southview Estates WTP
484
143
30%
244
341
Victoria Place WTP
331
298
90%
-33
34
Western Trent/Palmina WTP
294
240
82%
-5
54
Woodfield WTP
295
83
28%
153
212
Project Number 10599 January 2025
Page | iii
Technical Memorandum #4 Kawartha Lakes Water Wastewater Servicing and Capacity Master Plan
Table ES-2: Water Booster Pumping Station Capacity Summary Station
Firm Capacity [m3/d]
Lindsay
Thornhill Road BPS
22,800
Lindsay
Oakwood BPS
1,390
Community
Table ES-3: Water Storage Capacity Summary Community
Storage Facility
Volume
Rechlorination?
Lindsay
Thornhill Road Reservoir
9,000 m3
Yes
Lindsay
Verulam Road Elevated Tank
2,650 m3
Yes
Oakwood
Oakwood Reservoir
232 m3
Bobcaygeon
Dunn Street Elevated Tank
4,400 m3
Fenelon Falls
Church Street Standpipe
2,450 m3
Yes
Table ES-4: Wastewater Treatment Plant Capacity Summary
Wastewater Treatment Plant
Rated Capacity [m3/d]
5-Year Avg Flow [m3/d]
5-Year Capacity [%]
Reserve Capacity to 80% of Rated [m3/d]
Reserve Capacity to 100% of Rated [m3/d]
Lindsay WPCP
24,500
14,178
58%
5,422
10,322
Bobcaygeon WPCP
3,055
2,583
85%
-139
472
Fenelon Falls WPCP
1,800
1,158
64%
282
642
Omemee WWTP
1,353
590
44%
492
763
Coboconk WWTP
421
411
98%
-74
10
King’s Bay WWTP
170
46
27%
90
124
Project Number 10599 January 2025
Page | iv
Technical Memorandum #4 Kawartha Lakes Water Wastewater Servicing and Capacity Master Plan
Table ES-5: Sewage Pumping Station Capacity Summary Community
Station
Firm Capacity [L/s]
Lindsay
Fairgrounds SPS
18.0
Lindsay
Jennings Creek SPS
550.0
Lindsay
Lindsay St North SPS
400.0
Lindsay
Logie Street SPS
69.1
Lindsay
Mary Street SPS
20.0
Lindsay
Ridout Street SPS
360.0
Lindsay
Rivera Park SPS
732.0
Lindsay
Riverview Estates SPS
8.4
Lindsay
Wellington Street SPS
6.9
Bobcaygeon
SPS #1
35.6
Bobcaygeon
SPS #2
13.9
Bobcaygeon
SPS #3
6.7
Bobcaygeon
SPS #4
6.3
Bobcaygeon
SPS #5
13.9
Bobcaygeon
SPS #6
61.0
Bobcaygeon
SPS #7
42.0
Bobcaygeon
SPS #8
18.9
Bobcaygeon
SPS #9
18.9
Bobcaygeon
SPS #10
15.0
Bobcaygeon
SPS #11
14.1
Fenelon Falls
Colbourne Street SPS
50.0
Fenelon Falls
Ellice Street SPS
120.0
Fenelon Falls
Francis Street SPS
6.2
Omemee
Church Street SPS
45.0
Omemee
Sturgeon Road SPS
88.0
Project Number 10599 January 2025
Page | v
Technical Memorandum #4 Kawartha Lakes Water Wastewater Servicing and Capacity Master Plan
Table ES-5: Sewage Pumping Station Capacity Summary (cont’d) Community
Station
Firm Capacity [L/s]
Coboconk
South Water Street SPS (No 1)
8.2
Coboconk
Water Street SPS (No 2)
18.2
Coboconk
Main Street SPS (No 3)
19.5
Project Number 10599 January 2025
Page | vi
Technical Memorandum 4 – Final
Kawartha Lakes Water-Wastewater Master Plan Facility Wide Comprehensive Water/ Wastewater System Capacity Assessment January 2025 | CKL Contract 2022-13-CP | TYLin Project 10599 City of Kawartha Lakes
Technical Memorandum #4 Kawartha Lakes Water-Wastewater Master Plan Capacity Assessment
TABLE OF CONTENTS 1
INTRODUCTION....................................................................................................................... 1
2
REVIEW OF WATER FACILITIES .............................................................................................. 2 2.1
2.2
2.3
2.4
2.5
Lindsay and Oakwood................................................................................................. 2 2.1.1
Water Treatment........................................................................................................................ 2
2.1.2
Booster Pumping – Lindsay ................................................................................................... 7
2.1.3
Booster Pumping – Oakwood............................................................................................... 8
2.1.4
Water Storage – Lindsay ......................................................................................................... 8
2.1.5
Water Storage – Oakwood..................................................................................................... 9
Bobcaygeon ............................................................................................................... 10 2.2.1
Water Treatment......................................................................................................................10
2.2.2
Booster Pumping .....................................................................................................................14
2.2.3
Water Storage...........................................................................................................................14
Fenelon Falls .............................................................................................................. 16 2.3.1
Water Treatment......................................................................................................................16
2.3.2
Booster Pumping .....................................................................................................................20
2.3.3
Water Storage...........................................................................................................................20
Woodville ................................................................................................................... 21 2.4.1
Water Treatment......................................................................................................................21
2.4.2
Water Storage...........................................................................................................................24
Small Systems ............................................................................................................ 26 2.5.1
Birch Point Water Treatment Plant ...................................................................................26
2.5.2
Canadiana Shores Water Treatment Plant .....................................................................28
2.5.3
Janetville Water Treatment Plant.......................................................................................30
2.5.4
Kings Bay Water Treatment Plant......................................................................................32
2.5.5
Kinmount Water Treatment Plant .....................................................................................34
2.5.6
Manilla Water Treatment Plant ..........................................................................................36
2.5.7
Manorview Water Treatment Plant...................................................................................38
2.5.8
Mariposa Estates Water Treatment Plant.......................................................................40
2.5.9
Norland Water Treatment Plant.........................................................................................42
2.5.10 Omemee Water Treatment Plant.......................................................................................44 2.5.11 Pinewood Water Treatment Plant .....................................................................................46 2.5.12 Pleasant Point Water Treatment Plant.............................................................................48 Project Number 10599 January 2025
Page | ii
Technical Memorandum #4 Kawartha Lakes Water-Wastewater Master Plan Capacity Assessment
2.5.13 Sonya Water Treatment Plant.............................................................................................50 2.5.14 Southview Estates Water Treatment Plant.....................................................................52 2.5.15 Victoria Place Water Treatment Plant ..............................................................................54 2.5.16 Western Trent/Palmina Water Treatment Plant...........................................................56 2.5.17 Woodfield Water Treatment Plant ....................................................................................58 3
REVIEW OF WASTEWATER FACILITIES................................................................................ 60 3.1
3.2
3.3
3.4
3.5
Lindsay........................................................................................................................ 60 3.1.1
Wastewater Treatment ..........................................................................................................60
3.1.2
Sewage Pumping Stations....................................................................................................65
Bobcaygeon ............................................................................................................... 68 3.2.1
Wastewater Treatment ..........................................................................................................68
3.2.2
Sewage Pumping Stations....................................................................................................72
Fenelon Falls .............................................................................................................. 75 3.3.1
Wastewater Treatment ..........................................................................................................75
3.3.2
Sewage Pumping Stations....................................................................................................80
Omemee ..................................................................................................................... 82 3.4.1
Wastewater Treatment ..........................................................................................................82
3.4.2
Sewage Pumping Stations....................................................................................................85
Small Systems ............................................................................................................ 87 3.5.1
Coboconk Sewage Lagoons ................................................................................................87
3.5.2
Coboconk Sewage Pumping Stations..............................................................................89
3.5.3
King’s Bay Environmental Centre.......................................................................................90
APPENDICES APPENDIX A CAPACITY ASSESSMENT TABLES
LIST OF FIGURES Figure 2-1 Lindsay WTP Historical Water Demands .......................................................................................... 5 Figure 2-2 Bobcaygeon Historical Water Demands.........................................................................................12
Project Number 10599 January 2025
Page | iii
Technical Memorandum #4 Kawartha Lakes Water-Wastewater Master Plan Capacity Assessment
Figure 2-3 Fenelon Falls Historical Water Demands........................................................................................18 Figure 2-4 Woodville Historical Water Demand ...............................................................................................23 Figure 2-5 Birch Point Historical Water Demands............................................................................................27 Figure 2-6 Canadiana Shores Historical Water Demands..............................................................................29 Figure 2-7 Janetville Historical Water Demands ...............................................................................................31 Figure 2-8 Kings Bay Historical Water Demands ..............................................................................................33 Figure 2-9 Kinmount Historical Water Demands ..............................................................................................35 Figure 2-10 Manilla Historical Water Demands.................................................................................................37 Figure 2-11 Manorview Historical Water Demands.........................................................................................39 Figure 2-12 Mariposa Estates Historical Water Demands .............................................................................41 Figure 2-13 Norland Historical Water Demands...............................................................................................43 Figure 2-14 Omemee Historical Water Demands.............................................................................................45 Figure 2-15 Pinewood Historical Water Demands ...........................................................................................47 Figure 2-16 Pleasant Point Historical Water Demands...................................................................................49 Figure 2-17 Sonya Historical Water Demands..................................................................................................51 Figure 2-18 Southview Estates Historical Water Demands ...........................................................................53 Figure 2-19 Victoria Place Historical Water Demands ....................................................................................55 Figure 2-20 Western Trent/Palmina Historical Water Demands.................................................................57 Figure 2-21 Woodfield Historical Water Demands ..........................................................................................59 Figure 3-1 Lindsay WPCP Historical Wastewater Flow ...................................................................................63 Figure 3-2 Bobcaygeon WPCP Historical Wastewater Flow .........................................................................70 Figure 3-3 Fenelon Falls WPCP Historical Wastewater Flow ........................................................................78 Figure 3-4 Omemee WPCP Historical Wastewater Flow................................................................................84 Figure 3-5 Coboconk WPCP Historical Wastewater Flow..............................................................................88 Figure 3-6 King’s Bay WPCP Historical Wastewater Flow..............................................................................91
LIST OF TABLES Table 2-1 Lindsay WTP Capacity Summary........................................................................................................... 3 Table 2-2 Lindsay Historical Water Supply Data ................................................................................................. 4 Table 2-3 Lindsay WTP Reserve Capacity and Additional Serviceable Population ................................ 6 Table 2-4 Bobcaygeon WTP Capacity Summary...............................................................................................11 Table 2-5 Bobcaygeon Historical Water Supply Data .....................................................................................12 Table 2-6 Bobcaygeon WTP Reserve Capacity and Additional Serviceable Population ....................13 Table 2-7 Fenelon Falls WTP Capacity Summary..............................................................................................17 Table 2-8 Fenelon Falls Historical Water Supply Data ....................................................................................18 Table 2-9 Fenelon Falls WTP Reserve Capacity and Additional Serviceable Population ...................19 Project Number 10599 January 2025
Page | iv
Technical Memorandum #4 Kawartha Lakes Water-Wastewater Master Plan Capacity Assessment
Table 2-10 Woodville WTP Capacity Summary .................................................................................................22 Table 2-11 Woodville Historical Water Supply Data .......................................................................................23 Table 2-12 Woodville WTP Reserve Capacity and Additional Serviceable Population ......................24 Table 2-13 Birch Point WTP Capacity Summary................................................................................................26 Table 2-14 Birch Point Historical Water Supply Data......................................................................................26 Table 2-15 Canadiana Shores WTP Capacity Summary .................................................................................28 Table 2-16 Canadiana Shores Historical Water Supply Data........................................................................29 Table 2-17 Janetville WTP Capacity Summary ...................................................................................................30 Table 2-18 Janetville Historical Water Supply Data .........................................................................................30 Table 2-19 Kings Bay WTP Capacity Summary ..................................................................................................32 Table 2-20 Kings Bay Historical Water Supply Data ........................................................................................32 Table 2-21 Kinmount WTP Capacity Summary..................................................................................................34 Table 2-22 Kinmount Historical Water Supply Data........................................................................................35 Table 2-23 Manilla WTP Capacity Summary.......................................................................................................36 Table 2-24 Manilla Historical Water Supply Data.............................................................................................36 Table 2-25 Manorview WTP Capacity Summary ...............................................................................................38 Table 2-26 Manorview WTP Historical Water Supply Data...........................................................................39 Table 2-27 Mariposa Estates WTP Capacity Summary ...................................................................................40 Table 2-28 Mariposa Estates Historical Water Supply Data..........................................................................40 Table 2-29 Norland WTP Capacity Summary .....................................................................................................42 Table 2-30 Norland Historical Water Supply Data ...........................................................................................42 Table 2-31 Omemee WTP Capacity Summary ...................................................................................................44 Table 2-32 Omemee Historical Water Supply Data .........................................................................................44 Table 2-33 Pinewood WTP Capacity Summary .................................................................................................46 Table 2-34 Pinewood Historical Water Supply Data........................................................................................46 Table 2-35 Pleasant Point WTP Capacity Summary.........................................................................................48 Table 2-36 Pleasant Point Historical Water Supply Data ...............................................................................48 Table 2-37 Sonya WTP Capacity Summary .........................................................................................................50 Table 2-38 Sonya Historical Water Supply Data ...............................................................................................50 Table 2-39 Southview Estates WTP Capacity Summary .................................................................................52 Table 2-40 Southview Estates Historical Water Supply Data .......................................................................53 Table 2-41 Victoria Place WTP Capacity Summary ..........................................................................................54 Table 2-42 Victoria Place Historical Water Supply Data ................................................................................54 Table 2-43 Western Trent/Palmina WTP Capacity Summary .......................................................................56 Table 2-44 Western Trent/Palmina Historical Water Supply Data .............................................................56 Table 2-45 Woodfield WTP Capacity Summary ................................................................................................58 Table 2-46 Woodfield Historical Water Supply Data.......................................................................................58
Project Number 10599 January 2025
Page | v
Technical Memorandum #4 Kawartha Lakes Water-Wastewater Master Plan Capacity Assessment
Table 3-1 Lindsay WPCP Capacity Summary......................................................................................................61 Table 3-2 Lindsay WPCP Historical Wastewater Flow Data ..........................................................................62 Table 3-3 Lindsay WPCP Reserve Capacity and Additional Serviceable Population ...........................64 Table 3-4 Bobcaygeon WPCP Capacity Summary............................................................................................69 Table 3-5 Bobcaygeon WPCP Historical Wastewater Flow Data ................................................................70 Table 3-6 Bobcaygeon WPCP Reserve Capacity and Additional Serviceable Population .................71 Table 3-7 Fenelon Falls WPCP Capacity Summary...........................................................................................76 Table 3-8 Fenelon Falls WPCP Historical Wastewater Flow Data ...............................................................77 Table 3-9 Fenelon Falls WPCP Reserve Capacity and Additional Serviceable Population ................79 Table 3-10 Omemee WPCP Capacity Summary................................................................................................82 Table 3-11 Omemee WPCP Historical Wastewater Flow Data ....................................................................83 Table 3-12 Omemee WPCP Reserve Capacity and Additional Serviceable Population .....................85 Table 3-13 Coboconk WPCP Capacity Summary..............................................................................................87 Table 3-14 Coboconk WPCP Historical Wastewater Flow Data ..................................................................88 Table 3-15 King’s Bay EC Capacity Summary .....................................................................................................90 Table 3-16 King’s Bay EC Historical Wastewater Flow Data..........................................................................91
Project Number 10599 January 2025
Page | vi
Technical Memorandum #4 Kawartha Lakes Water-Wastewater Master Plan Capacity Assessment
1 INTRODUCTION The purpose of this technical memorandum is to provide a desktop capacity assessment of each of the water and wastewater facilities owned by the City of Kawartha Lakes, to characterize their capacity to service the growth projections through the Master Plan update process. This capacity assessment reviewed and extracted information from existing documentation provided by the City of Kawartha Lakes, including: ► Ontario Drinking Water Works Permits/Licenses (DWWP/DWWL); ► Permit to Take Water (PTTW); ► Environmental Compliance Approvals (ECAs); ► Engineer’s Reports; ► Annual Performance Reports; ► SCADA Data; and, ► Meetings with facility operators. The review of capacity information from existing documents was supplemented with design calculations to obtain theoretical process capacities where published process capacities have not been documented.
Project Number 10599 January 2025
Page | 1
Technical Memorandum #4 Kawartha Lakes Water-Wastewater Master Plan Capacity Assessment
2 REVIEW OF WATER FACILITIES 2.1 Lindsay and Oakwood The communities of Lindsay and Oakwood are jointly supplied with water treated at the Lindsay Water Treatment Plant (WTP). The Lindsay distribution system is pressurized by the Lindsay WTP high-lift pumps, whereas the Oakwood system is pressurized by the Oakwood Reservoir and Booster Pumping Station (BPS).
2.1.1 Water Treatment The Lindsay Water Treatment Plant is a conventional treatment plant owned and operated by City of Kawartha Lakes. The Lindsay Water Treatment Plant draws water from the Scugog River. The WTP is equipped with two sets of high-rate clarifiers and five multi-media filters with a rated capacity of 22,730 m3/d. Water treatment facilities are rated for maximum day demand. The Lindsay WTP consists of two 600 mm diameter intake pipes, two passive intake screening systems, three low lift pumps, chemical addition for coagulation, pH and corrosion control, two ballasted floc/clarification units, two sedimentation units, five dual media (granular activated carbon and sand) filters, a sodium hypochlorite chlorination system, two in-ground clearwells, four high lift pumps, onsite wastewater equalization and sludge thickening, and a standby electrical generator set, one diesel generator set. The plant process is controlled by a SCADA system. 2.1.1.1 Permits and Approvals The Lindsay Drinking Water Works permit was renewed on November 10, 2021, under permit number 141-220. The permit encompasses the Lindsay Water Treatment Plant, two off-site storage reservoirs and re-chlorination facilities, one elevated tank storage and re-chlorination facility, as well as 206 kilometers of watermain. A Permit to Take Water (PTTW) was renewed on August 15, 2018, under the permit number 53658W2JWA. This permit allows water taking from the Scugog River for Municipal water supply purposes for a maximum water taking of 30,685.5 m3/d for a maximum of 24 hours per day and 365 days per year. The Municipal Drinking Water License was renewed on November 10, 2021, under permit number 141-104. The permit stipulates the requirements established as part of the Drinking Water Works Permit and PTTW as well as identifying City of Kawartha Lakes as the accredited operating authority of the Lindsay WTP respectively. The permit outlines the rated capacity of the Lindsay WTP as 22,730 m3/d.
Project Number 10599 January 2025
Page | 2
Technical Memorandum #4 Kawartha Lakes Water-Wastewater Master Plan Capacity Assessment
2.1.1.2 7Review of Treatment Plant Capacity The following Table 2-1 provides capacity summary information for the main treatment processes at the Lindsay WTP. The values are generally obtained from various documents such as permits, O&M manuals, or other documentation, and have not been verified by actual stress tests as part of this project. At present, the actual plant capacity is limited by the capacity of the filtration system, but all processes meet the plant rated capacity.
Table 2-1 Lindsay WTP Capacity Summary Treatment Process
Capacity
Process Equipment
Rated Plant Capacity
22,730 m3/d
N/A
Intake Pipes
44,050 m3/d
2 pipes, 22,025 m3/d each [1]
Low Lift Pumping
Meets Rated Capacity?
Yes Yes
3
Firm Capacity
29,600 m /d
3 Low lift pumps
Total Capacity
44,400 m3/d
Each rated at 14,800 m3/d @ 10.83 m TDH [2]
Low Lift Well
44,050 m3/d
Actiflo
27,280 m3/d
Two units, 13,640 m3/d each [2]
Yes
Filtration
22,730 m3/d
Five dual media filters2
Yes, but limiting
Pump 1 & 2 rated at 5,996 m3/d @ 64 m TDH
Yes
Yes
High Lift Pumping 3
Firm Capacity
23,129 m /d
Total Capacity
36,754 m3/d
Pump 3 rated at 13,625 m3/d @ 64 m TDH Pump 4 rated at 11,137 m3/d @ 64 m TDH[2]
1. Water and Wastewater Infrastructure Capacity Review, July 2014, WSP 2. Drinking Water Works Permit, Permit Number: 141-220
The low lift pumping station has sufficient firm capacity to meet the current plant capacity. The low lift works include three vertical turbine low lift pumps, each rated at 14,800 m3/d, two 600mm diameter inlet pipes, each rated at 22,025 m3/d, and an in-ground low lift well which was sized for a maximum day design capacity of 44,050 m3/d (Associate Engineering, 2013). Project Number 10599 January 2025
Page | 3
Technical Memorandum #4 Kawartha Lakes Water-Wastewater Master Plan Capacity Assessment
The Actiflo system meets the rated capacity if all units are in service. The Actiflo system provides flocculation and clarification in the small footprint. The Lindsay WTP has two Actiflo units, each rated for 13,640 m3/d. The filtration unit meets the plant capacity, but it is a limiting factor for capacity increase. New process equipment needs to be added if an expansion is considered. There are five dual media (GAC/sand) filters in parallel. The filters have a total surface area of 195.17 m2 providing a filtration rate of 4.85m/hr (equals 22,730 m3/d) at plant rated capacity. The plant process PLC/SCADA system is near capacity and due for upgrades (CKL, Water Treatment Operational Issues, 2021). 2.1.1.3 Review of Annual Demand Water supply data from 2019 to 2023 annual reports were reviewed to determine historical water demands in Lindsay. Average day and maximum day demand for the past five years are included in Table 2-2 below. The maximum day demand in the past five years was 13,213 m3/d in 2020, which is 58% of the plant rated capacity. Table 2-2 Lindsay Historical Water Supply Data ADD
MDD
Estimated Serviced Population [1]
Per Capita ADD (Lpcd)
Maximum Day Peaking Factor
(m3/d)
(m3/d)
2023
7,134
10,288
23,086
309
1.44
2022
7,240
10,085
22,723
319
1.39
2021
7,298
12,050
22,365
326
1.65
2020
7,219
13,213
22,012
328
1.83
2019
7,204
10,571
21666
333
1.47
Year
1. Populations and rate of growth based on data from 2021 and 2016 Census
The historical average and maximum day demand from Table 2-2 are plotted versus the rated WTP capacity in Figure 2-1 below.
Project Number 10599 January 2025
Page | 4
Technical Memorandum #4 Kawartha Lakes Water-Wastewater Master Plan Capacity Assessment
Figure 2-1 Lindsay WTP Historical Water Demands
According to the maximum day demand of 13,213 m3/d in 2020, the plant has a MDD reserve capacity of 9,517 m3/d. Historically, the blended per capita water demand (residential plus employment) has ranged from 309 to 333 Lpcd. Based on 9,517 m3/d of reserve MDD capacity and a per-capita consumption of 333 Lpcd, the Lindsay WTP can accommodate additional residential and employment water demands associated with a population increase of approximately 11,500 residents based on a design criteria of 450 Lpcd (to a total community population of approximately 35,500 residents). Typically, upgrades to a plant are planned once the facility reaches 80% of its rated capacity. The reserve capacity of the plant to 80% capacity is 4,971 m3/d which equates to approximately 6,000 additional serviceable population (residential and employment).
Project Number 10599 January 2025
Page | 5
Technical Memorandum #4 Kawartha Lakes Water-Wastewater Master Plan Capacity Assessment
Table 2-3 Lindsay WTP Reserve Capacity and Additional Serviceable Population Demand Scenario
Existing MDD (m3/d)
Limiting MDD (m3/d)
Reserve MDD (m3/d)
Serviceable Population – Observed (Lpcd) (1)
Serviceable Population – Design (Lpcd) (2)
100% Capacity
13,213
22,730
9,517
15,636
11,554
80% Capacity
13,213
18,184
4,971
8,167
6,035
Notes: 1) Based on historical Max Day factor and historical ADD 2) Based on historical Max Day factor and design ADD
2.1.1.4 Operational and Facility Capacity Constraints TYLin visited the Lindsay WTP in December 2022, and met with facility operators on February 7th, 2024. Overall, the Lindsay WTP is in poor condition, and significant upgrades appear to be warranted. Appendix A contains the site investigation notes from the overall facility condition assessment, including photos and details. The following observations were compiled: 1. No Clearwell Redundancy: The WTP has two in-ground clearwells, which are approximately 70 years old. However, based on the discussions with the facility operators, only one clearwell is in operation. An additional clearwell is recommended to provide redundancy. If the clearwell needs to be taken off-line for maintenance, the entire facility would have to be shut down. 2. Wall at Filter #3: There are visible cracks along the wall of Filter #3 which should be further investigated and repaired as required. 3. Corrosion Low Lift Pump Basement: The existing HVAC equipment including the unit heater in the basement is heavily corroded. This could indicate a high chlorine concentration in the room (it should be tested). Further investigation recommended. 4. Corrosion - General: Many pipes and accessories are corroded. A detailed inspection should be completed to assess whether the corrosion is impacting operation of any components of the process (valve stems, as an example), and also whether corrosion inhibiting measures can be implemented or whether the corroded components should be replaced. Refer to Appendix A for detailed location for the corroded parts. 5. Outdated PLC components: Some components of the existing facility PLC are outdated. Replacement of these components should be considered, and the wiring within the PLC Project Number 10599 January 2025
Page | 6
Technical Memorandum #4 Kawartha Lakes Water-Wastewater Master Plan Capacity Assessment
should be reworked. 6. Chemical Storage: Per applicable Guidelines, chemical storage should be available for a minimum 30 days of consumption. The current storage capacity allows for only 19 days of consumption 7. No Actiflo Redundancy: When one of the two Actiflo units is out of service, the plant’s process capacity is compromised. 8. Water Age: There are reportedly challenges with trihalomethanes (THM) and haloacetic acids (HAAs), associated with water age, particularly within the Oakwood distribution system. 9.
Sludge Thickener (Reactivator): The Lindsay WTP Sludge Thickener (Reactivator) has been experiencing operational and maintenance issues due to the failure of sludge scraper mechanism. If the repair of the reactivator system is not feasible all water treatment process waste including supernatant could eventually be discharged to Mary St SPS.
2.1.1.5 Potential for Future Expansion The existing plant does not have sufficient space to accommodate a future expansion. If additional process equipment is required in order to increase the rated capacity of the facility, the existing processes would have to be replaced with more compact and more efficient technologies. The PLC/SCADA system is full, without any space for an additional bracket.
2.1.2 Booster Pumping – Lindsay The community of Lindsay is serviced through a single pressure zone, with a design top water level (TWL) of 310.29 m. Water Pressure in the Lindsay distribution system is provided by the following facilities: 1. Lindsay WTP High-Lift Pumps: •
Located at the Lindsay WTP
•
Firm capacity of 23,129 m3/day, which exceeds the WTP rated capacity (22,730 m3/day).
•
Supplies the Lindsay Distribution system, the Verulam Road Elevated Tank and the Thornhill Road Reservoir.
2. Thornhill Road Booster Pumping Station: •
Located at the Thornhill Road Reservoir;
•
Firm capacity of 22,800 m3/day;
•
Supplies the Lindsay distribution system, the Verulam Road Elevated Tank and
Project Number 10599 January 2025
Page | 7
Technical Memorandum #4 Kawartha Lakes Water-Wastewater Master Plan Capacity Assessment
the Oakwood Road Reservoir. While the theoretical combined capacity of the pumps supplying the Lindsay distribution network is 45,929 m3/day, the Thornhill Road BPS technically does not have an independent supply. As such, the effective pumping capacity to the Lindsay distribution system is limited by the Lindsay WTP supply capacity (22,730 m3/day).
2.1.3 Booster Pumping – Oakwood The community of Oakwood is serviced through a single pressure zone, with a design top water level (TWL) of 277.40 m. Water Pressure in the Oakwood distribution system is provided by the Oakwood Road BPS: •
Located at the Oakwood Road Reservoir;
•
Firm capacity of 2,330 m3/day;
•
Supplies the Oakwood distribution system.
2.1.4 Water Storage – Lindsay The Lindsay Water storage facilities are intended to provide fire storage, equalization storage and emergency storage. Water storage for Lindsay is provided through the following facilities: 1. Thornhill Road Reservoir: •
Located at 50 Thornhill Road;
•
Currently consists of two cells, with a total combined volume of 9,000 m3;
•
Can be expanded by adding two more cells, to an ultimate volume of 18,000 m3;
•
Does not float on the Lindsay pressure zone; water is pumped to system pressure through the Thornhill Road BPS;
•
Top water level is 277.4 m; Low water level is 271.3 m;
•
Facility has re-chlorination (sodium hypochlorite feed).
2. Verulam Road Elevated Tank: •
Located at Verulam Road North and Colborne Street;
•
Tank volume is 2,650 m3;
•
Top water level is 310.29 m; Low water level is 299.09 m;
•
Facility has re-chlorination (sodium hypochlorite feed).
The total existing storage volume in Lindsay is 11,650 m3. Based on 2024 populations and water demand data, the recommended storage volume is 8,629 m3. Based on the rated capacity of the
Project Number 10599 January 2025
Page | 8
Technical Memorandum #4 Kawartha Lakes Water-Wastewater Master Plan Capacity Assessment
Lindsay WTP, the recommended storage volume is 11,603 m3. If the Verulam Road ET is out of service, the Thornhill Road Reservoir can supply the current required storage volume, but not the storage volume associated with the WTP rated capacity. With a possible expansion of the Thornhill Road Reservoir, the storage volume would be increased to 20,650 m3.
2.1.5 Water Storage – Oakwood As the Oakwood system is not sized for fire protection, the storage required is only intended to provide equalization and emergency storage. Water storage for Oakwood is provided at the Oakwood Road Reservoir: •
Located at 1020 Eldon Road;
•
Tank volume is 232 m3;
•
Does not float on the Oakwood pressure zone; water is pumped to system pressure through the Oakwood Road BPS;
•
Top water level is 277.4 m; Low water level is 271.3 m;
•
Facility has re-chlorination.
Based on the capacity of the Oakwood Booster Pumping Station, the required storage volume (equalization and emergency storage only) is 997 m3.
Project Number 10599 January 2025
Page | 9
Technical Memorandum #4 Kawartha Lakes Water-Wastewater Master Plan Capacity Assessment
2.2 Bobcaygeon 2.2.1 Water Treatment The Bobcaygeon Water Treatment Plant is a two packaged-type water treatment plant owned by City of Kawartha Lakes and operated by Ontario Clean Water Agency (OCWA). The Bobcaygeon Water Treatment Plant draws water from the Big Bob River. The rated capacity of the WTP is 5,184 m3/d. Water treatment facilities are rated for maximum day demand. The Bobcaygeon WTP consists of two 450 mm diameter raw water intake pipes, a fine screen, three low lift pumps, one raw water well, two solids re-circulating reactivator type floc/clarification units, chemical addition for coagulation, pH and corrosion control, two dual media (anthracite and sand) filters, a sodium hypochlorite chlorination system, a ammonium sulphate solution tank, four inground clearwells, three high lift pumps, one surge/equalization tank for sludge, one 350 kW diesel generator set. The plant process is controlled by a SCADA system. 2.2.1.1 Permits and Approvals The Bobcaygeon Drinking Water Works permit was renewed on July 1, 2021, under permit number 141-205. The permit encompasses the Bobcaygeon Water Treatment Plant and one elevated tank storage, as well as 25 kilometers of watermain. A Permit to Take Water (PTTW) was renewed on August 28, 2017, under the permit number 68377JCP2G. This permit allows water taking from the Sturgeon Lake (Big Bob Channel) for Municipal water supply purposes for a maximum water taking of 5184 m3/d for a maximum of 24 hours per day and 365 days per year. The Municipal Drinking Water License was renewed on July 11, 2021, under permit number 141105. The permit stipulates the requirements established as part of the Drinking Water Works Permit and PTTW as well as identifying City of Kawartha Lakes and Ontario Clean Water Agency as the accredited operating authorities of the Bobcaygeon distribution system and WTP respectively. The permit confirms the rated capacity outlined in the PTTW of 5,184 m3/d from Bobcaygeon WTP. 2.2.1.2 Review of Treatment Plant Capacity Table 2-4 provides the capacity summary information for the main treatment processes at the Bobcaygeon WTP. The values are generally obtained from various documents such as permits, O&M manuals, or other documentation, and have not been verified by actual stress tests as part of this project.
Project Number 10599 January 2025
Page | 10
Technical Memorandum #4 Kawartha Lakes Water-Wastewater Master Plan Capacity Assessment
Table 2-4 Bobcaygeon WTP Capacity Summary Treatment Process
Capacity
Process Equipment
Rated Plant Capacity
5,184 m3/d
N/A 3 Low lift pumps, 2 duty 1 standby
Low Lift Pumping 3
Meets Rated Capacity?
Yes
Firm Capacity
5,184 m /d
Total Capacity
7,776 m3/d
Each rated at 2,592 m3/d @ 7.5 m TDH [1]
Flocculator/clarifier
5,184 m3/d
Two units, 2,592 m3/d each [1]
Yes
Filtration
5,184 m3/d
Two dual media filters, each rated at 2,592 m3/d [1]
Yes
3 high lift pumps, 2 duty 1 standby
Yes
High Lift Pumping 3
Firm Capacity
5,184 m /d
Total Capacity
7,776 m3/d
Each rated at 2,592 m3/d @ 64 m TDH [1]
1. Drinking Water Works Permit, Permit Number: 141-205
The low lift pumping station has sufficient firm capacity to meet the current plant capacity. The low lift works include three vertical turbine low lift pumps, each rated at 30 L/s, 450mm diameter inlet pipes. The reactivator type flocculator/clarifier meets the rated capacity if all units are in service. The system has two units in parallel, each unit rated for 30 L/s. The filtration unit meets the plant capacity. The water is conveyed to two dual media (anthracite/sand), two cell high-rate gravity filtration units in parallel (WSP, 2015). Each cell providing a filtration capacity of 15 L/s. The high lift pumping station has sufficient firm capacity to meet the current plant capacity. The high lift works include three vertical turbine high lift pumps, each rated at 30 L/s. 2.2.1.3 Review of Annual Demands Water supply data from 2019 to 2023 annual reports were reviewed to determine historical water demands in Bobcaygeon. Average day and maximum day demand for the past five years are included in Table 2-7 below. The maximum day demand in the past five years was 3,575 m3/d in 2020, which is 69% of the plant
Project Number 10599 January 2025
Page | 11
Technical Memorandum #4 Kawartha Lakes Water-Wastewater Master Plan Capacity Assessment
rated capacity. Table 2-5 Bobcaygeon Historical Water Supply Data ADD
MDD
Estimated Serviced Population [1]
Per-Capita ADD (Lpcd)
Maximum Day Peaking Factor
(m3/d)
(m3/d)
2023
2,278
2,983
3,595
634
1.31
2022
2,109
3,505
3,585
588
1.66
2021
2,463
3,481
3,575
689
1.41
2020
2,425
3,575
3,565
680
1.47
2019
2,355
3,304
3,555
663
1.40
Year
1. Populations and rate of growth based on data from 2021 and 2016 Census
Figure 2-2 Bobcaygeon Historical Water Demands
According to the maximum day demand of 3,575 m3/d in 2020, the plant has a MDD reserve Project Number 10599 January 2025
Page | 12
Technical Memorandum #4 Kawartha Lakes Water-Wastewater Master Plan Capacity Assessment
capacity of 1,609 m3/d. Historically, the blended per capita water demand (residential plus employment) has ranged from 588 to 688 Lpcd, which is very high, and exceeds the design criteria of 450 Lpcd. Based on 1,609 m3/d of reserve MDD capacity and a per-capita consumption of 688 Lpcd, the Bobcaygeon WTP can accommodate additional residential and employment water demands associated with a population increase of approximately 5,000 residents based on a design criteria of 450 Lpcd (to a total community population of approximately 8,600 residents). Typically, upgrades to a plant are planned once the facility reaches 80% of its rated capacity. The reserve capacity of the plant to 80% capacity is 572 m3/d which equates to approximately 2,000 additional serviceable population (residential and employment). Table 2-6 Bobcaygeon WTP Reserve Capacity and Additional Serviceable Population Existing MDD (m3/d)
Limiting MDD (m3/d)
Reserve MDD (m3/d)
Serviceable Population – Observed (Lpcd) (1)
Serviceable Population – Design (Lpcd) (2)
100% Capacity
3,575
5,184
1,609
3,390
5,185
80% Capacity
3,575
4,147
572
1,205
1,844
Demand Scenario
Notes: 1) Based on historical Max Day factor and historical ADD 2) Based on historical Max Day factor and design ADD
2.2.1.4 Operational and Facility Capacity Constraints TYLin visited the Bobcaygeon WTP in December 2022, and met with facility operators on February 7th, 2024. Overall, the Bobcaygeon WTP is in average condition for facility originally constructed in early 1960s. The process equipment is functional, however some pipe corrosion was observed. Appendix A contains the site investigation notes from the overall facility condition assessment, including photos and details. The following improvements should be considered: 1. General Corrosion: Many pipes and accessories were corroded. A detailed inspection should be completed to assess whether the corrosion is impacting operation of any components of the process (valve stems, as an example), and also whether corrosion inhibiting measures can be implemented or whether the corroded components should be replaced.
Project Number 10599 January 2025
Page | 13
Technical Memorandum #4 Kawartha Lakes Water-Wastewater Master Plan Capacity Assessment
2. Roof Access Ladder: The roof access ladder in the chemical room does not meet the current code for working at heights. Further – based on a review of the WTP capacity and identification of optimization opportunities (Associated Engineering, 2021), the Bobcaygeon WTP struggles to produce finished water at a capacity higher than approximately 2,800 m3/day due to the high rate of process waste residual generation. This suggests that the overall WTP production efficiency is low. The study recommended a stepwise process optimization plan, which included a jar-testing program, filter backwashing and clarifier sludge production monitoring, etc. Based on jar-testing in the spring of 2022, OCWA implemented a recommended coagulant dose which improved the plant production performance to some extent, but did not restore the full rate plant production capacity. Further optimization and pilot testing using polymer has been recommended as a next step to improve the plant production efficiency. 2.2.1.5 Potential for Future Expansion The plant has adequate space available to potentially accommodate expansions if the abandoned process area can be reused. The existing MCC has spare brackets for possible expansion.
2.2.2 Booster Pumping The community of Bobcaygeon is serviced through a single pressure zone, with a design top water level (TWL) of 311.63 m. Water Pressure in the Bobcaygeon distribution system is provided by the Bobcaygeon WTP High-lift pumps: •
Located at the Bobcaygeon WTP;
•
Firm capacity of 5,184 m3/day;
•
Supplies the Bobcaygeon distribution system and the Dunn Street Elevated Tank.
•
Pumps are controlled by levels in the Dunn Street ET, with the lead/lag pumps starting at 305.0 m/304.16 m.
2.2.3 Water Storage Water storage for Bobcaygeon is provided through the Dunn Street Elevated Tank: •
Located at 85 Dunn Street;
•
Tank volume is 4,400 m3;
•
Top water level is 311.63 m; Low water level is 300.20 m;
The Bobcaygeon Water storage facilities are intended to provide fire storage, equalization storage and emergency storage. Project Number 10599 January 2025
Page | 14
Technical Memorandum #4 Kawartha Lakes Water-Wastewater Master Plan Capacity Assessment
The Dunn Street ET provides fire storage, equalization storage and emergency storage. Based on 2024 populations and water demand data, the recommended storage volume is 1,969 m3. Based on the rated capacity of the Bobcaygeon WTP, the recommended storage volume is 2,916 m3.
Project Number 10599 January 2025
Page | 15
Technical Memorandum #4 Kawartha Lakes Water-Wastewater Master Plan Capacity Assessment
2.3 Fenelon Falls 2.3.1 Water Treatment The Fenelon Falls Water Treatment Plant is a conventional treatment plant owned by City of Kawartha Lakes and operated by Ontario Clean Water Agency (OCWA). The Fenelon Falls Water Treatment Plant draws water from the Cameron Lake. The rated capacity of this WTP is 4,100 m3/d. Water treatment facilities are rated for maximum day demand. The Fenelon Falls WTP consists of an intake chamber with coarse screen, a 450mm diameter intake pipe, Zebra Mussel Control System, low lift well, three low lift pumps, chemical addition for coagulation, pH and corrosion control, two settling basins, two microfilter units in parallel, a sodium hypochlorite chlorination system and UV disinfection system for primary disinfection, chloramination for secondary disinfection, one process residual settling tank, one clearwell with two interconnected cells, four high lift pumps and a 160-kW diesel generator. The plant process is controlled by a SCADA system. 2.3.1.1 Permits and Approvals The Fenelon Falls Drinking Water Works permit was renewed on July 11, 2021, under permit number 141-204. The permit provides detailed description of the Fenelon Falls Water Treatment Plant, one standpipe storage, as well as 16.2 kilometers of watermain. A Permit to Take Water (PTTW) was renewed on August 28, 2017, under the permit number 5830AQFGZR. This permit allows water taking from the Cameron Lake for Municipal water supply purposes for a maximum water taking of 4,100 m3/d for a maximum of 24 hours per day and 365 days per year. The Municipal Drinking Water License was renewed on July 11, 2021, under permit number 141104. The permit stipulates the requirements established as part of the Drinking Water Works Permit and PTTW as well as identifying City of Kawartha Lakes and Ontario Clean Water Agency as the accredited operating authorities of the Fenelon Fall distribution system and WTP respectively. The permit confirms the rated capacity outlined in the PTTW of 4,100 m3/d from the Fenelon Falls WTP. Additionally, it stipulates the treatment method as UV disinfection and maximum flow rate of 47.45 L/s. 2.3.1.2 Review of Treatment Plant Capacity The following Table 2-7 provides capacity summary information for the main treatment processes at the Fenelon Falls WTP. The values are generally obtained from various documents such as permits, O&M manuals, or other documentation, and have not been verified by actual stress tests as part of this project.
Project Number 10599 January 2025
Page | 16
Technical Memorandum #4 Kawartha Lakes Water-Wastewater Master Plan Capacity Assessment
Table 2-7 Fenelon Falls WTP Capacity Summary Treatment Process
Capacity
Process Equipment
Rated Plant Capacity
4,100 m3/d
N/A
Meets Rated Capacity?
3 Low lift pumps
Low Lift Pumping 3
Yes 3
Total Capacity
6,558 m /d
Each rated at 2,048 m /d @ 4.2 m TDH
Microfiltration
4,100 m3/d
Two membrane trains
Yes
UV Disinfection
4,100 m3/d
Two medium pressure UV units
Yes
Firm Capacity
4,096 m /d 3
One duty one standby High Lift Pumping
4 high lift pumps, 3 duty 1 standby
3
Firm Capacity
4,100 m /d
Total Capacity
5,460 m3/d
Yes
Each rated at 1,365 m3/d @ 64.6 m TDH [1]
1. Water and Wastewater Infrastructure Capacity Review, July 2014, WSP 2. Drinking Water Works Permit, Permit Number: 141-204
The plant has two trains of membrane filters, each run at 12 L/s in the high demand seasons. If a train is taken for backwash/maintenance activity, the other train runs at 24 L/s. However, when the demand rate is at 20 L/s, the membrane clogging occurs. UV disinfection system capable of delivering a minimum dose of 40 mJ/cm2 at the full rated plant capacity of 4,100 m3/d (47.45 L/s) at a UV transmittance (UVT) of 76%. The high lift pumping station includes four vertical turbine high lift pumps, each rated at 1,365 m3/d, the firm capacity of the high lift pumps is 4,100 m3/d, equal to the rated capacity of the plant. 2.3.1.3 Review of Annual Demands Water supply data from 2019 to 2023 annual reports were reviewed to determine historical water demands in Fenelon Falls. Average day and maximum day demand for the past five years are included in Table 2-8 below. The maximum day demand in the past five years was 1,693 m3/d in 2019, which is 41% of the plant rated capacity.
Project Number 10599 January 2025
Page | 17
Technical Memorandum #4 Kawartha Lakes Water-Wastewater Master Plan Capacity Assessment
Table 2-8 Fenelon Falls Historical Water Supply Data ADD
MDD
Estimated Serviced Population [1]
Per-Capita ADD (Lpcd)
Maximum Day Peaking Factor
(m3/d)
(m3/d)
2023
829
1,272
2,502
331
1.54
2022
808
1,391
2,496
324
1.72
2021
823
1,267
2,491
330
1.54
2020
728
1,225
2,486
293
1.68
2019
798
1,693
2,480
322
2.12
Year
1. Populations and rate of growth based on data from 2021 and 2016 Census
The historical average and maximum day demand from Table 2-8 are plotted versus the rated WTP capacity in Figure 2-3 below. Figure 2-3 Fenelon Falls Historical Water Demands
Project Number 10599 January 2025
Page | 18
Technical Memorandum #4 Kawartha Lakes Water-Wastewater Master Plan Capacity Assessment
According to the maximum day demand of 1,693 m3/d in 2019, the plant has a MDD reserve capacity of 2,407 m3/d. Historically, the blended per capita water demand (residential plus employment) has ranged from 293 to 331 Lpcd. Based on 2,407 m3/d of reserve capacity and 331 Lpcd, the Fenelon Falls WTP can accommodate additional residential and employment water demands associated with a population increase of approximately 2,500 residents based on a design criteria of 450 Lpcd (to a total community population of approximately 4,500 residents). Typically, upgrades to a plant are planned once the facility reaches 80% of its rated capacity. The reserve capacity of the plant to 80% capacity is 1,587 m3/d which equates to approximately 1,600 additional serviceable population (residential and employment). Table 2-9 Fenelon Falls WTP Reserve Capacity and Additional Serviceable Population Existing MDD (m3/d)
Limiting MDD (m3/d)
Reserve MDD (m3/d)
Serviceable Population – Observed (Lpcd) (1)
Serviceable Population – Design (Lpcd) (2)
100% Capacity
1,693
4,100
2,407
3,425
2,521
80% Capacity
1,693
3,280
1,587
2,258
1,662
Demand Scenario
Notes: 1) Based on historical Max Day factor and historical ADD 2) Based on historical Max Day factor and design ADD
2.3.1.4 Operational and Facility Capacity Constraints TYLin visited the Fenelon Falls WTP in December 2022, and met with facility operators on February 7th, 2024. Overall, the Fenelon Falls WTP is in excellent condition. Most process equipment has been replaced recently, including a new control panel, new membrane piping and new blowers. The high lift pumps have also been rebuilt recently. There are some concerns with individual processes, as reported by the operators: 1. Membrane Filtration: During the summer months the WTP runs continuously due to increased water demand from the splash pad and new housing developments. As a result, each filter requires a thorough cleaning every three weeks which takes one train out of service for up to four days at a time and forces the remaining train to operate at full capacity which leads to quicker clogging. The City is currently upgrading the filtration system which will allow the filters longer run time between cleans, enhance contaminant removal, and increase the operational efficiency and reliability.
Project Number 10599 January 2025
Page | 19
Technical Memorandum #4 Kawartha Lakes Water-Wastewater Master Plan Capacity Assessment
Appendix A contains the site investigation notes from the overall facility condition assessment, including photos and details. 2.3.1.5
Potential for Future Expansion
The plant has adequate space available to potentially accommodate expansions. However, the existing filters and MCC do not have additional capacity and replacement of these equipment are necessary.
2.3.2 Booster Pumping The community of Fenelon Falls is serviced through a single pressure zone, with a design top water level (TWL) of 314.02 m. Water Pressure in the Fenelon Falls distribution system is provided by the Fenelon Falls WTP High-lift pumps: •
Located at the Fenelon Falls WTP;
•
Firm capacity of 4,100 m3/day;
•
Supplies the Fenelon Falls distribution system and the Fenelon Falls Standpipe.
•
Pumps are controlled by levels in the Fenelon Falls Standpipe.
2.3.3 Water Storage The storage in the water distribution system in Fenelon Falls is provided by a standpipe located 18 Church Street. The standpipe is approximately 31 m in height with a top water level (TWL) of 314.02 m, and an internal diameter of approximately 10 m resulting in a volume of 2,450 m3. The standpipe is intended to provide fire storage, equalization storage and emergency storage. Based on 2024 populations and water demand data, the recommended storage volume is 1,512 m3. Based on the rated capacity of the Fenelon Falls WTP, the recommended storage volume is 2,406 m3.
Project Number 10599 January 2025
Page | 20
Technical Memorandum #4 Kawartha Lakes Water-Wastewater Master Plan Capacity Assessment
2.4 Woodville 2.4.1 Water Treatment The Woodville Water Treatment System is owned by City of Kawartha Lakes and operated by Ontario Clean Water Agency (OCWA). The Woodville Water Treatment Plant is supplied by groundwater, with two GUDI wells rated at 6.8 L/s each at 75.5 m TDH. The rated capacity of this WTP is 588 m3/d. Water treatment facilities are rated for maximum day demand. 2.4.1.1 Permits and Approvals The Woodville Drinking Water Works permit was renewed on November 10, 2021, under permit number 141-215. The permit provides detailed description of the Woodville groundwater wells, water treatment plant and a water distribution network and one elevated storage reservoir (standpipe). A Permit to Take Water (PTTW) was renewed on Feb 15, 2017, under the permit number 1207AHKRXV. The Municipal Drinking Water License was renewed on April 30, 2021, under permit number 141115. The permit stipulates the requirements established as part of the Drinking Water Works Permit and PTTW as well as identifying City of Kawartha Lakes and Ontario Clean Water Agency as the accredited operating authorities of the Woodville distribution system and treatment plant respectively. 2.4.1.2 Review of Treatment Plant Capacity The following Table 2-10 provides capacity summary information for the main treatment processes at the Woodville WTP. The values are generally obtained from various documents such as permits, O&M manuals, or other documentation, and have not been verified by actual stress tests as part of this project.
Project Number 10599 January 2025
Page | 21
Technical Memorandum #4 Kawartha Lakes Water-Wastewater Master Plan Capacity Assessment
Table 2-10 Woodville WTP Capacity Summary Treatment Process
Capacity
Rated Plant Capacity
588 m3/d
Well Pumps Firm Capacity
594 m3/d
Process Equipment
Meets Rated Capacity?
2 wells/pumps
Yes
1,188 m3/d
Each rated at 594 m3/d @ 75.5 m TDH
981 m3/d
Bag filter and cartridge filter.
Total Capacity Filtration
Yes
Flow-controlled to 588 m3/d Chlorination
Sodium hypochlorite chemical feed system
2.4.1.3 Review of Annual Demands Water supply data from 2019 to 2023 annual reports were reviewed to determine historical water demands in Woodville. Average day and maximum day demand for the past five years are included in Table 2-11 below. The maximum day demand in the past five years was 438 m3/d in 2023, which translates to 74% of the plant rated capacity. Given that this is 36 percent greater than the next highest annual value (322 m3/d), and that it occurred in November (not traditionally a high-demand month) it is assumed that there might have been a specific process or maintenance-related demand on that date, and that this is not a true indication of the system demands. Ignoring the presumed outlier from November 2023, the maximum day demand in the past five years was 322 m3/d in 2020 and 2023, which translates to 55% of the plant rated capacity.
Project Number 10599 January 2025
Page | 22
Technical Memorandum #4 Kawartha Lakes Water-Wastewater Master Plan Capacity Assessment
Table 2-11 Woodville Historical Water Supply Data ADD
MDD
Estimated Serviced Population [1]
Per-Capita ADD (Lpcd)
Maximum Day Peaking Factor
(m3/d)
(m3/d)
2023
191
322 (1)
619
309
1.68
2022
171
304
619
276
1.78
2021
161
311
619
260
1.93
2020
155
322
619
250
2.08
2019
182
319
619
294
1.75
Year
Notes: 1) High MDD from November 2023 (438 m3/d) was removed from the analysis, as it appears to have been an outlier, and not representative of the true system demands.
Figure 2-4 Woodville Historical Water Demand
Project Number 10599 January 2025
Page | 23
Technical Memorandum #4 Kawartha Lakes Water-Wastewater Master Plan Capacity Assessment
According to the maximum day demand of 322 m3/d in 2020 and 2023, the plant has a reserve MDD capacity of 266 m3/d. Historically, the blended per capita water demand (residential plus employment) has ranged from 250 to 309 Lpcd. Based on 266 m3/d of reserve capacity and 309 Lpcd, the Woodville WTP can accommodate additional residential and employment water demands associated with a population increase of approximately 400 residents based on a design criteria of 450 Lpcd (to a total population of approximately 1,000 residents). Typically, upgrades to a plant are required once the facility reaches 80% of its rated capacity. The reserve capacity of the plant at 80% is 148 m3/d which equates to approximately 150 additional serviceable population (residential and employment). Table 2-12 Woodville WTP Reserve Capacity and Additional Serviceable Population Existing MDD (m3/d)
Limiting MDD (m3/d)
Reserve MDD (m3/d)
Serviceable Population – Observed (Lpcd) (1)
Serviceable Population – Design (Lpcd) (2)
100% Capacity
322
588
266
412
283
80% Capacity
322
470
148
230
158
Demand Scenario
Notes: 1) Based on historical Max Day factor and historical ADD 2) Based on historical Max Day factor and design ADD
2.4.1.4 Operational and Facility Capacity Constraints TYLin met with facility operators on February 26th, 2024. Overall, the Woodville WTP is in good condition. The only concern identified is low pressures within the system, but these are limited by the height of the standpipe. 2.4.1.5
Potential for Future Expansion
Operators were uncertain whether the plant was designed for expansion. As this is a groundwater-based system, the capacity might be limited by the aquifer, or even potential interference between the municipal wells and private wells.
2.4.2 Water Storage The storage in the water distribution system in Woodville is provided by a standpipe located near the intersection of Nappadale Street and Argyle Street. This facility is a concrete tank with a diameter of 7.3m and is 28m in height with a total capacity of 1,160 m3. The standpipe also serves as pressure equalization to the distribution system.
Project Number 10599 January 2025
Page | 24
Technical Memorandum #4 Kawartha Lakes Water-Wastewater Master Plan Capacity Assessment
As the Woodville system is not sized for fire protection, the storage required is only intended to provide equalization and emergency storage. Based on 2024 populations and water demand data, the recommended storage volume is 192 m3. Based on the rated capacity of the Woodville WTP, the recommended storage volume is 233 m3.
Project Number 10599 January 2025
Page | 25
Technical Memorandum #4 Kawartha Lakes Water-Wastewater Master Plan Capacity Assessment
2.5 Small Systems 2.5.1 Birch Point Water Treatment Plant The Birch Point Estates Water Treatment System is owned by City of Kawartha Lakes and operated by Ontario Clean Water Agency (OCWA). The Birch Point Estates Water Treatment Plant draws water from groundwater wells. The rated capacity of this WTP is 360 m3/d. Water treatment facilities are rated for maximum day demand. Table 2-13 Birch Point WTP Capacity Summary Meets Rated Capacity?
Treatment Process
Capacity
Process Equipment
Rated Plant Capacity
360 m3/d
N/A
Cartridge Filtration
360 m3/d [1]
Two trains, each rated 360 m3/d
Yes Yes
Firm Capacity
588 m3/d
Total Capacity
882 m3/d
Three vertical centrifugal high lift pumps (lead duty), each rated 294 m3/d
High Lift Pumping
1. Drinking Water Works Permit, Permit Number: 141-209
Review of Annual Demands Water supply data from 2019 to 2023 annual reports were reviewed to determine historical water demands in Birch Point Estates. Based on the maximum day demand of 198 m3/d in 2022, the plant is operating at approximately 55% of its rated capacity. Table 2-14 Birch Point Historical Water Supply Data ADD
MDD
% Capacity
Maximum Day Factor
(m3/d)
(m3/d)
2023
64
162
45%
2.53
2022
103
198
55%
1.93
2021
83
133
37%
1.61
2020
82
152
42%
1.85
2019
61
100
28%
1.63
Year
Project Number 10599 January 2025
Page | 26
Technical Memorandum #4 Kawartha Lakes Water-Wastewater Master Plan Capacity Assessment
Figure 2-5 Birch Point Historical Water Demands
Operational and Facility Capacity Constraints TYLin met with facility operators on February 26th, 2024. Overall, the quantity of water available is good. One of the three production wells has recently been rehabilitated, and the MDD can be met with two of the three wells operating. Iron and Manganese levels are elevated in Well 4. When Well 4 is required to meet the demand, the Well 4 water is blended with Well 3 to maintain water quality within acceptable levels.
Project Number 10599 January 2025
Page | 27
Technical Memorandum #4 Kawartha Lakes Water-Wastewater Master Plan Capacity Assessment
2.5.2 Canadiana Shores Water Treatment Plant The Canadiana Shores Water Treatment System is owned by City of Kawartha Lakes and operated by Ontario Clean Water Agency (OCWA). The Canadiana Shores Water Treatment Plant draws water from groundwater wells. The rated capacity of this WTP is 984 m3/d. Water treatment facilities are rated for maximum day demand. The following Table 2-15 provides capacity summary information for the main treatment processes at the Canadiana Shores WTP. Table 2-15 Canadiana Shores WTP Capacity Summary Meets Rated Capacity?
Treatment Process
Capacity
Process Equipment
Rated Plant Capacity
984 m3/d
N/A
Filters
1,040 m3/d
Two Dual Media (anthracite/silica sand) Gravity Filters, each having a total rated filtration capacity of 520 m³/day
Yes
Cartridge Filtration
1,090 m3/d1
Two trains
Yes
Four vertical turbine pumps
High Lift Pumping Firm Capacity
3
1,713.6 m /d
Two rated 381.6 m /d
Total Capacity
2,664 m3/d
Two rated 950.4 m3/d
Yes
3
1. Drinking Water Works Permit, Permit Number: 141-212
Review of Annual Demand Water supply data from 2019 to 2023 annual reports were reviewed to determine historical water demands in Canadiana Shores. Based on the maximum day demand of 268 m3/d in 2020, the plant is operating at approximately 27% of its rated capacity.
Project Number 10599 January 2025
Page | 28
Technical Memorandum #4 Kawartha Lakes Water-Wastewater Master Plan Capacity Assessment
Table 2-16 Canadiana Shores Historical Water Supply Data ADD
MDD
% Capacity
Maximum Day Factor
(m3/d)
(m3/d)
2023
144
233
24%
1.62
2022
143
248
25%
1.73
2021
146
254
26%
1.74
2020
151
268
27%
1.78
2019
116
217
22%
1.88
Year
Figure 2-6 Canadiana Shores Historical Water Demands
Operational and Facility Capacity Constraints TYLin met with facility operators on February 26th, 2024. There are some water quality concerns relating to iron and manganese. Based on updated regulations (since the facility was constructed), there may be a need to replace the existing cartridge filter system with a system which supports NSF-53 filtration. This will require specific investigation and recommendations.
Project Number 10599 January 2025
Page | 29
Technical Memorandum #4 Kawartha Lakes Water-Wastewater Master Plan Capacity Assessment
2.5.3 Janetville Water Treatment Plant Janetville Water Treatment Plant is owned by City of Kawartha Lakes and operated by Ontario Clean Water Agency (OCWA). The Janetville Water Treatment Plant draws water from groundwater wells. The rated capacity of this WTP is 449 m3/d. Water treatment facilities are rated for maximum day demand. Table 2-17 provides capacity summary information for the main treatment processes at the Janetville WTP. Table 2-17 Janetville WTP Capacity Summary Treatment Process
Capacity
Process Equipment
Meets Rated Capacity?
Rated Plant Capacity
449 m3/d
N/A
High Lift Pumping
Three submersible pumps
Firm Capacity
674 m3/d
Two rated 501.12 m3/d
Total Capacity
1,175 m3/d
One rated 950.4 m3/d
Yes
1. Drinking Water Works Permit, Permit Number: 141-211
Review of Annual Demand Water supply data from 2019 to 2023 annual reports were reviewed to determine historical water demands in Janetville. Based on the maximum day demand of 242 m3/d in 2022, the plant is operating at approximately 54% of its rated capacity. Table 2-18 Janetville Historical Water Supply Data ADD
MDD
% Capacity
Maximum Day Factor
(m3/d)
(m3/d)
2023
77
203
45%
2.96
2022
73
242
54%
3.33
2021
79
235
52%
2.96
2020
75
223
50%
2.98
2019
70
234
52%
3.33
Year
Typically, upgrades to a plant are required once the facility reaches 80% of its rated capacity.
Project Number 10599 January 2025
Page | 30
Technical Memorandum #4 Kawartha Lakes Water-Wastewater Master Plan Capacity Assessment
Figure 2-7 Janetville Historical Water Demands
Operational and Facility Capacity Constraints TYLin met with facility operators on February 26th, 2024. No significant operational concerns were described. Overall, the quality from the three wells is good. The facility is old, and has been retro-fitted several times over the years. There is property available for a potential expansion, but this might trigger an expansion to the building, as there is limited space available inside.
Project Number 10599 January 2025
Page | 31
Technical Memorandum #4 Kawartha Lakes Water-Wastewater Master Plan Capacity Assessment
2.5.4 Kings Bay Water Treatment Plant The King’s Bay Water Treatment Plant is owned by City of Kawartha Lakes and operated by Ontario Clean Water Agency (OCWA). The King’s Bay WTP draws water from three wells. The rated capacity of this plant is 409 m3/d. Water treatment facilities are rated for maximum day demand. Table 2-19 provides capacity summary information for the main treatment processes at the King’s Bay WTP. Table 2-19 Kings Bay WTP Capacity Summary Treatment Process
Capacity
Process Equipment
Meets Rated Capacity?
Rated Plant Capacity
409 m3/d
N/A Yes
High Lift Pumping Firm Capacity
561.6 m3/d
Three submersible pumps
Total Capacity
842.4 m3/d
Each rated 280.8 m3/d
1. Drinking Water Works Permit, Permit Number: 141-219
Review of Annual Demand Water supply data from 2019 to 2023 annual reports were reviewed to determine historical water demands in King’s Bay. Based on the maximum day demand of 235 m3/d in 2021, the plant is operating at approximately 57% of its rated capacity. Table 2-20 Kings Bay Historical Water Supply Data ADD
MDD
% Capacity
Maximum Day Factor
(m3/d)
(m3/d)
2023
47
152
37%
3.26
2022
49
130
32%
2.65
2021
56
235
57%
4.19
2020
52
175
43%
3.38
2019
44
98
24%
2.24
Year
Project Number 10599 January 2025
Page | 32
Technical Memorandum #4 Kawartha Lakes Water-Wastewater Master Plan Capacity Assessment
Figure 2-8 Kings Bay Historical Water Demands
Operational and Facility Capacity Constraints TYLin met with facility operators on February 26th, 2024. No specific concerns were identified. The system currently operates with three wells, and has no redundancy. Well testing might be needed to confirm the viability of a fourth well.
Project Number 10599 January 2025
Page | 33
Technical Memorandum #4 Kawartha Lakes Water-Wastewater Master Plan Capacity Assessment
2.5.5 Kinmount Water Treatment Plant The Kinmount Water Treatment System is owned by City of Kawartha Lakes and operated by Ontario Clean Water Agency (OCWA). The Kinmount Water Treatment Plant draws water from Burnt River. The rated capacity of this WTP is 340 m3/d. Water treatment facilities are rated for maximum day demand. Table 2-21 provides capacity summary information for the main treatment processes at the Kinmount WTP. Table 2-21 Kinmount WTP Capacity Summary Treatment Process
Capacity
Process Equipment
Rated Plant Capacity
340 m3/d
N/A Yes
Low Lift Pumping Firm Capacity
Meets Rated Capacity?
337 m3/d
Two submersible pumps
3
Total Capacity
674 m /d
Each rated 337 m3/d
Filters
340 m3/d
Dual train conventional filtration package system rated for a total of 340m³/d. Each train consists of a two-stage variable speed flocculator, tube settler clarifier, and one (1) dual media rapid gravity filter.
Yes
Four vertical turbine pumps
Yes
High Lift Pumping Firm Capacity Total Capacity
3
3
Three rated 630.7 m /d
3
One rated 172.8 m3/d
1,434.2 m /d 2,064.9 m /d
1. Drinking Water Works Permit, Permit Number: 141-221
Review of Annual Demand Water supply data from 2017 to 2021 annual reports were reviewed to determine historical water demands in Kinmount. Based on the maximum day demand of 88 m3/d in 2019, the plant is operating at approximately 26% of its rated capacity.
Project Number 10599 January 2025
Page | 34
Technical Memorandum #4 Kawartha Lakes Water-Wastewater Master Plan Capacity Assessment
Table 2-22 Kinmount Historical Water Supply Data ADD
MDD
% Capacity
Maximum Day Factor
(m3/d)
(m3/d)
2023
22
60
18%
2.71
2022
20
63
19%
3.15
2021
19
54
16%
2.83
2020
19
58
16%
3.02
2019
19
88
26%
4.54
Year
Figure 2-9 Kinmount Historical Water Demands
Operational and Facility Capacity Constraints TYLin met with facility operators on February 26th, 2024. No specific concerns relating to the operation of the plant were identified. Overall, the water quality is good. The property is sized for a potential process expansion.
Project Number 10599 January 2025
Page | 35
Technical Memorandum #4 Kawartha Lakes Water-Wastewater Master Plan Capacity Assessment
2.5.6 Manilla Water Treatment Plant The Manilla Water Treatment System is owned and operated by City of Kawartha Lakes. The Manilla Water Treatment Plant draws water from groundwater wells. The rated capacity of this WTP is 157 m3/d. Water treatment facilities are rated for maximum day demand. Table 2-23 provides capacity summary information for the main treatment processes at the Manilla WTP. Table 2-23 Manilla WTP Capacity Summary Treatment Process
Capacity
Process Equipment
Rated Plant Capacity
157 m3/d
N/A
Meets Rated Capacity?
High Lift Pumping
Yes 3
Firm Capacity
259.2 m /d
Two pumps
Total Capacity
518.4 m3/d
Each rated 259.2 m3/d
1. Drinking Water Works Permit, Permit Number: 141-206
Review of Annual Demand Water supply data from 2019 to 2023 annual reports were reviewed to determine historical water demands in Manilla. Based on the maximum day demand of 86 m3/d in 2020, the plant is operating at approximately 55% of its rated capacity. Table 2-24 Manilla Historical Water Supply Data ADD
MDD
% Capacity
Maximum Day Factor
(m3/d)
(m3/d)
2023
34
78
50%
2.28
2022
36
65
41%
1.80
2021
35
64
41%
1.82
2020
38
86
55%
2.27
2019
36
74
47%
2.07
Year
Project Number 10599 January 2025
Page | 36
Technical Memorandum #4 Kawartha Lakes Water-Wastewater Master Plan Capacity Assessment
Figure 2-10 Manilla Historical Water Demands
Operational and Facility Capacity Constraints TYLin met with facility operators on February 26th, 2024. No specific concerns relating to the operation of the plant were identified. Planned capital projects include a new production well, and a SCADA system.
Project Number 10599 January 2025
Page | 37
Technical Memorandum #4 Kawartha Lakes Water-Wastewater Master Plan Capacity Assessment
2.5.7 Manorview Water Treatment Plant The Manorview Water Treatment System is owned by City of Kawartha Lakes and operated by Ontario Clean Water Agency (OCWA). The Manorview Water Treatment Plant draws water from groundwater wells. The rated capacity of this WTP is 302 m3/d. Water treatment facilities are rated for maximum day demand. Table 2-25 provides capacity summary information for the main treatment processes at the Manorview WTP. Table 2-25 Manorview WTP Capacity Summary Meets Rated Capacity?
Treatment Process
Capacity
Process Equipment
Rated Plant Capacity
302 m3/d
N/A
Filtration
302.4 m3/d [1]
Two NSF 61 approved cartridge filters each rated at 3.5 L/s
Yes
UV Disinfection
302.4 m3/d [1]
Two UV lights (duty, standby), each rated at 3.5 L/s
Yes Yes
High Lift Pumping Firm Capacity Total Capacity
3
Two centrifugal pumps
3
Each rated 302 m3/d
302 m /d 604 m /d
1. Drinking Water Works Permit, Permit Number: 141-218
Review of Annual Demand Water supply data from 2019 to 2023 annual reports were reviewed to determine historical water demands in Manorville. Based on the maximum day demand of 67 m3/d in 2020, the plant is operating at approximately 22% of its rated capacity.
Project Number 10599 January 2025
Page | 38
Technical Memorandum #4 Kawartha Lakes Water-Wastewater Master Plan Capacity Assessment
Table 2-26 Manorview WTP Historical Water Supply Data ADD
MDD
% Capacity
Maximum Day Factor
(m3/d)
(m3/d)
2023
17
41
14%
2.41
2022
18
47
16%
2.61
2021
19
40
13%
2.13
2020
19
67
22%
3.62
2019
19
49
16%
2.55
Year
Figure 2-11 Manorview Historical Water Demands
Operational and Facility Capacity Constraints TYLin met with facility operators on February 26th, 2024. No specific concerns relating to the operation of the plant were identified. This facility was designed for the specific neighbourhood that it currently services, with no plan nor capacity for expansion Based on updated regulations (since the facility was constructed), there may be a need to replace the existing cartridge filter system with a system which supports NSF-53 filtration. This will require specific investigation and recommendations.
Project Number 10599 January 2025
Page | 39
Technical Memorandum #4 Kawartha Lakes Water-Wastewater Master Plan Capacity Assessment
2.5.8 Mariposa Estates Water Treatment Plant The Mariposa Estates Water Treatment System is owned by City of Kawartha Lakes and operated by Ontario Clean Water Agency (OCWA). The Mariposa Estates Water Treatment Plant draws water from groundwater wells. The rated capacity of this WTP is 72 m3/d. Water treatment facilities are rated for maximum day demand. Table 2-27 provides capacity summary information for the main treatment processes at the Mariposa Estates WTP. Table 2-27 Mariposa Estates WTP Capacity Summary Treatment Process
Capacity
Process Equipment
Rated Plant Capacity
72 m3/d
N/A
Nitrate Removal
72 m3/d
Meets Rated Capacity?
Yes Yes
High Lift Pumping Firm Capacity
345.6 m3/d
Two submersible pumps
Total Capacity
691.2 m3/d
Each rated 345.6 m3/d
1. Drinking Water Works Permit, Permit Number: 141-217
Review of Annual Demand Water supply data from 2019 to 2023 annual reports were reviewed to determine historical water demands in Mariposa Estates. Based on the maximum day demand of 67 m3/d in 2020 and 2023, the plant is operating at approximately 93% of its rated capacity. The plant is fairly consistently operating at over 75% capacity, so a capacity upgrade should be considered. Table 2-28 Mariposa Estates Historical Water Supply Data ADD
MDD
% Capacity
Maximum Day Factor
(m3/d)
(m3/d)
2023
30
67
93%
2.25
2022
29
56
78%
1.92
2021
29
55
76%
1.90
2020
28
67
93%
2.40
2019
25
52
72%
2.04
Year
Project Number 10599 January 2025
Page | 40
Technical Memorandum #4 Kawartha Lakes Water-Wastewater Master Plan Capacity Assessment
Figure 2-12 Mariposa Estates Historical Water Demands
Operational and Facility Capacity Constraints TYLin met with facility operators on February 26th, 2024. Operational concerns are as follows: •
There are issues with both wells, and they need to be replaced.
•
The plant is nearing capacity, and there are challenges in keeping up with demand in the early summer as residents are filling swimming pools.
•
There are challenges related to meeting the nitrate-removal requirements while backwashing the ion-exchange system. The water consumption requirement for the ionexchange backwashing process also limit the volume of water available to the residents.
Project Number 10599 January 2025
Page | 41
Technical Memorandum #4 Kawartha Lakes Water-Wastewater Master Plan Capacity Assessment
2.5.9 Norland Water Treatment Plant The Norland Water Treatment System is owned by City of Kawartha Lakes and operated by Ontario Clean Water Agency (OCWA). The Norland Water Treatment Plant draws water from groundwater wells. The rated capacity of this WTP is 264 m3/d. Table 2-29 provides capacity summary information for the main treatment processes at the Norland WTP. Table 2-29 Norland WTP Capacity Summary Treatment Process
Capacity
Process Equipment
Rated Plant Capacity
264 m3/d
N/A
Meets Rated Capacity?
Yes
Low Lift Pumping Firm Capacity Total Capacity
3
Two submersible pumps
3
Each rated 267.8 m3/d
267.8 m /d 535.7 m /d
High Lift Pumping Firm Capacity Total Capacity
Four high lift pumps 3
Three rated 630.7 m /d
3
One rated 172.8 m3/d
Yes
3
1,434.2 m /d 2,064.9 m /d
1. Drinking Water Works Permit, Permit Number: 141-203
Review of Annual Demand Water supply data from 2019 to 2023 annual reports were reviewed to determine historical water demands in Norland. Based on the maximum day demand of 186 m3/d in 2020, the plant is operating at approximately 70% of its rated capacity. Table 2-30 Norland Historical Water Supply Data ADD
MDD
% Capacity
Maximum Day Factor
(m3/d)
(m3/d)
2023
75
143
54%
1.91
2022
50
136
52%
2.70
2021
69
160
61%
2.33
2020
107
185
70%
1.73
2019
96
186
70%
1.93
Year
Project Number 10599 January 2025
Page | 42
Technical Memorandum #4 Kawartha Lakes Water-Wastewater Master Plan Capacity Assessment
Figure 2-13 Norland Historical Water Demands
Operational and Facility Capacity Constraints TYLin met with facility operators on February 26th, 2024. No specific concerns relating to the operation of the plant were identified. The facility is located on a small property, with limited opportunity for expansion.
Project Number 10599 January 2025
Page | 43
Technical Memorandum #4 Kawartha Lakes Water-Wastewater Master Plan Capacity Assessment
2.5.10 Omemee Water Treatment Plant The Omemee Water Treatment System is owned by City of Kawartha Lakes and operated by Ontario Clean Water Agency (OCWA). The Omemee Water Treatment Plant draws water from groundwater wells. The rated capacity of this WTP is 461 m3/d. Table 2-31 provides capacity summary information for the main treatment processes at the Omemee WTP. Table 2-31 Omemee WTP Capacity Summary Treatment Process
Capacity
Process Equipment
Rated Plant Capacity
461 m3/d
N/A Three pumps,
High Lift Pumping Firm Capacity Total Capacity
Meets Rated Capacity?
Yes
3
3
Pump 3 rated at 234 m /d
3
Pump 4 rated at 295 m3/d
529 m /d 878 m /d
Pump 5 rated at 349 m3/d 1. Drinking Water Works Permit, Permit Number: 141-208
Review of Annual Demand Water supply data from 2017 to 2021 annual reports were reviewed to determine historical water demands in Omemee. Based on the maximum day demand of 92 m3/d in 2020, the plant is operating at approximately 20% of its rated capacity. Table 2-32 Omemee Historical Water Supply Data ADD
MDD
% Capacity
Maximum Day Factor
(m3/d)
(m3/d)
2023
32
55
12%
1.72
2022
33
73
16%
2.24
2021
34
76
16%
2.24
2020
35
92
20%
2.62
2019
34
76
16%
2.25
Year
Project Number 10599 January 2025
Page | 44
Technical Memorandum #4 Kawartha Lakes Water-Wastewater Master Plan Capacity Assessment
Figure 2-14 Omemee Historical Water Demands
Operational and Facility Capacity Constraints TYLin met with facility operators on February 7th, 2024. No specific concerns relating to the operation of the plant were identified.
Project Number 10599 January 2025
Page | 45
Technical Memorandum #4 Kawartha Lakes Water-Wastewater Master Plan Capacity Assessment
2.5.11 Pinewood Water Treatment Plant The Pinewood Water Treatment System is owned by City of Kawartha Lakes and operated by Ontario Clean Water Agency (OCWA). The Pinewood Water Treatment Plant draws water from groundwater wells. The rated capacity of this WTP is 590 m3/d. Table 2-33 provides capacity summary information for the main treatment processes at the Pinewood WTP. Table 2-33 Pinewood WTP Capacity Summary Treatment Process
Capacity
Process Equipment
Rated Plant Capacity
590 m3/d
N/A
Meets Rated Capacity?
Yes
High Lift Pumping Firm Capacity Total Capacity
3
Three high lift pumps
3
Each rated 634.2 m3/d
1268.4 m /d 1902.6 m /d
1. Drinking Water Works Permit, Permit Number: 141-210
Review of Annual Demand Water supply data from 2019 to 2023 annual reports were reviewed to determine historical water demands in Pinewood. Based on the maximum day demand of 274 m3/d in 2021, the plant is operating at approximately 46% of its rated capacity. Table 2-34 Pinewood Historical Water Supply Data ADD
MDD
(m3/d)
(m3/d)
2023
142
2022
% Capacity
Maximum Day Factor
243
41%
1.71
136
198
34%
1.46
2021
159
274
46%
1.72
2020
137
211
36%
1.54
2019
138
227
38%
1.64
Year
Project Number 10599 January 2025
Page | 46
Technical Memorandum #4 Kawartha Lakes Water-Wastewater Master Plan Capacity Assessment
Figure 2-15 Pinewood Historical Water Demands
Operational and Facility Capacity Constraints TYLin met with facility operators on February 26th, 2024. Overall, the water quality is quite good. In terms of a future expansion, the facility is supplied by a single-phase electrical supply, which might not be able to support additional processes and high-lift pumping. Upgrading to threephase power would require replacing the existing pumps.
Project Number 10599 January 2025
Page | 47
Technical Memorandum #4 Kawartha Lakes Water-Wastewater Master Plan Capacity Assessment
2.5.12 Pleasant Point Water Treatment Plant The Pleasant Point Water Treatment System is owned by City of Kawartha Lakes and operated by Ontario Clean Water Agency (OCWA). The Pleasant Point Water Treatment Plant draws water from groundwater wells. The rated capacity of this WTP is 490 m3/d. Table 2-35 provides capacity summary information for the main treatment processes at the Pleasant Point WTP. Table 2-35 Pleasant Point WTP Capacity Summary Meets Rated Capacity?
Treatment Process
Capacity
Process Equipment
Rated Plant Capacity
490 m3/d
N/A
UV
490 m3/d
Two UV reactors, one duty one standby, each rated 490 m3/d
Yes
Cartridge Filtration
818 m3/d
Two filter units, rated filtration capacity of 818 m³/day each
Yes
1. Drinking Water Works Permit, Permit Number: 141-213
Review of Annual Demand Water supply data from 2019 to 2023 annual reports were reviewed to determine historical water demands in Pleasant Point. Based on the maximum day demand of 145 m3/d in 2020, the plant is operating at approximately 30% of its rated capacity. Table 2-36 Pleasant Point Historical Water Supply Data ADD
MDD
% Capacity
Maximum Day Factor
(m3/d)
(m3/d)
2023
44
96
20%
2.18
2022
46
92
19%
1.99
2021
49
113
23%
2.32
2020
47
145
30%
3.10
2019
42
74
15%
1.75
Year
Project Number 10599 January 2025
Page | 48
Technical Memorandum #4 Kawartha Lakes Water-Wastewater Master Plan Capacity Assessment
Figure 2-16 Pleasant Point Historical Water Demands
Operational and Facility Capacity Constraints TYLin met with facility operators on February 26th, 2024. Based on updated regulations (since the facility was constructed), there may be a need to replace the existing cartridge filter system with a system which supports NSF-53 filtration. This will require specific investigation and recommendations.
Project Number 10599 January 2025
Page | 49
Technical Memorandum #4 Kawartha Lakes Water-Wastewater Master Plan Capacity Assessment
2.5.13 Sonya Water Treatment Plant The Sonya Water Treatment System is owned and operated by City of Kawartha. The Sonya Water Treatment Plant draws water from groundwater wells. The rated capacity of this WTP is 170 m3/d. Table 2-37 provides capacity summary information for the main treatment processes at the Sonya WTP. Table 2-37 Sonya WTP Capacity Summary Treatment Process
Capacity
Process Equipment
Rated Plant Capacity
170 m3/d
N/A
Meets Rated Capacity?
High Lift Pumping
Yes 3
Firm Capacity
648 m /d
Four high lift pumps
Total Capacity
864 m3/d
Each rated 216 m3/d
1. Drinking Water Works Permit, Permit Number: 141-207
Review of Annual Demand Water supply data from 2017 to 2021 annual reports were reviewed to determine historical water demands in Sonya. Based on the maximum day demand of 78 m3/d in 2020, the plant is operating at approximately 46% of its rated capacity. Table 2-38 Sonya Historical Water Supply Data ADD
MDD
% Capacity
Maximum Day Factor
(m3/d)
(m3/d)
2023
22
65
38%
2.97
2022
23
49
29%
2.16
2021
26
69
40%
2.68
2020
28
78
46%
2.83
2019
22
48
28%
2.14
Year
Project Number 10599 January 2025
Page | 50
Technical Memorandum #4 Kawartha Lakes Water-Wastewater Master Plan Capacity Assessment
Figure 2-17 Sonya Historical Water Demands
Operational and Facility Capacity Constraints TYLin met with facility operators on February 26th, 2024. Iron is a fairly significant concern at the Sonya WTP. Iron coats all of the processes, and clogs the filters. The pumps have to be cleaned on an annual basis. Manganese might also be a concern. Despite the challenges relating to the iron concentrations, the water quality concerns are managed and the facility operates within the required limits.
Project Number 10599 January 2025
Page | 51
Technical Memorandum #4 Kawartha Lakes Water-Wastewater Master Plan Capacity Assessment
2.5.14 Southview Estates Water Treatment Plant The Southview Water Treatment System is owned by City of Kawartha Lakes and operated by Ontario Clean Water Agency (OCWA). The Southview Water Treatment Plant draws water from Sturgeon Lake. The rated capacity of this WTP is 484 m3/d. Table 2-39 provides capacity summary information for the main treatment processes at the Southview WTP. Table 2-39 Southview Estates WTP Capacity Summary Treatment Process
Capacity
Process Equipment
Rated Plant Capacity
484 m3/d
N/A Yes
Low Lift Pumping Firm Capacity
Meets Rated Capacity?
3
Two low lift pumps
3
Each rated 484 m3/d
484 m /d
Total Capacity
968 m /d
Flocculation/ clarification/ Filtration
484 m3/d
Yes Two (2) trains each rated 242 m³/day
Firm Capacity
484 m3/d
Three vertical turbine pumps, two duty one standby
Total Capacity
968 m3/d
Each rated 484 m3/d
High Lift Pumping
Yes
1. Drinking Water Works Permit, Permit Number: 141-201
Review of Annual Demand Water supply data from 2019 to 2023 annual reports were reviewed to determine historical water demands in Southview Estates. Based on the maximum day demand of 143 m3/d in 2020, the plant is operating at approximately 30% of its rated capacity.
Project Number 10599 January 2025
Page | 52
Technical Memorandum #4 Kawartha Lakes Water-Wastewater Master Plan Capacity Assessment
Table 2-40 Southview Estates Historical Water Supply Data ADD
MDD
% Capacity
Maximum Day Factor
(m3/d)
(m3/d)
2023
38
81
17%
2.14
2022
38
93
19%
2.43
2021
48
113
23%
2.36
2020
49
143
30%
2.91
2019
43
91
19%
2.11
Year
Figure 2-18 Southview Estates Historical Water Demands
Operational and Facility Capacity Constraints TYLin met with facility operators on February 26th, 2024. Trihalomethane formation can limit plant capacity in late summer and early fall. The low-lift pumps do not have backup power.
Project Number 10599 January 2025
Page | 53
Technical Memorandum #4 Kawartha Lakes Water-Wastewater Master Plan Capacity Assessment
2.5.15 Victoria Place Water Treatment Plant The Victoria Place Water Treatment System is owned by City of Kawartha Lakes and operated by Ontario Clean Water Agency (OCWA). The Victoria Place Water Treatment Plant draws water from groundwater wells. The rated capacity of this WTP is 331 m3/d. Table 2-41 provides capacity summary information for the main treatment processes at the Victoria Place WTP. Table 2-41 Victoria Place WTP Capacity Summary Treatment Process
Capacity
Process Equipment
Rated Plant Capacity
331 m3/d
N/A
Meets Rated Capacity?
Yes
High Lift Pumping 3
Firm Capacity
622 m /d
Total Capacity
3
Two submersible pumps Each rated 622 m3/d
1,244 m /d
1. Drinking Water Works Permit, Permit Number: 141-214
Review of Annual Demand Water supply data from 2019 to 2023 annual reports were reviewed to determine historical water demands in Victoria Place. Based on the maximum day demand of 298 m3/d in 2021, the plant is operating at approximately 90% of its rated capacity. The plant is fairly consistently operating at over 80% capacity, so a capacity upgrade should be considered. Table 2-42 Victoria Place Historical Water Supply Data ADD
MDD
3
(m /d)
3
(m /d)
2023
202
2022
% Capacity
Maximum Day Factor
266
80%
1.32
205
273
82%
1.33
2021
222
298
90%
1.34
2020
210
266
80%
1.27
2019
191
274
83%
1.43
Year
Project Number 10599 January 2025
Page | 54
Technical Memorandum #4 Kawartha Lakes Water-Wastewater Master Plan Capacity Assessment
Figure 2-19 Victoria Place Historical Water Demands
Operational and Facility Capacity Constraints TYLin met with facility operators on February 26th, 2024. There are three production wells: •
Wells 1 and 2 operate together, but have a lower combined capacity than Well 7 (which runs alone)
•
Well 7 alone can meet the limit of the PTTW; when it is out of service, the MDD supply capacity of the plant is compromised.
There are also reportedly leaks in the system which reduce the storage levels in the clearwell, and the PTTW sometimes limits the ability of the plant to replenish the storage volume.
Project Number 10599 January 2025
Page | 55
Technical Memorandum #4 Kawartha Lakes Water-Wastewater Master Plan Capacity Assessment
2.5.16 Western Trent/Palmina Water Treatment Plant The Western Trent Palmina Water Treatment System is owned by City of Kawartha Lakes and operated by Ontario Clean Water Agency (OCWA). The Western Trent Palmina Water Treatment Plant draws water from groundwater wells. The rated capacity of this WTP is 294 m3/d. Water treatment facilities are rated for maximum day demand. Table 2-43 provides capacity summary information for the main treatment processes at the Western Trent Palmina WTP. Table 2-43 Western Trent/Palmina WTP Capacity Summary Treatment Process
Capacity
Process Equipment
Rated Plant Capacity
294 m3/d
N/A
Meets Rated Capacity?
Yes
High Lift Pumping 3
Firm Capacity
536 m /d
Two vertical turbine pumps
Total Capacity
1,072 m3/d
Each rated 536 m3/d
1. Drinking Water Works Permit, Permit Number: 141-202
Review of Annual Demands Water supply data from 2017 to 2021 annual reports were reviewed to determine historical water demands in Western Trent/Palmina. Based on the maximum day demand of 240 m3/d in 2023, the plant is operating at approximately 82% of its rated capacity. As this value is 41 percent higher than the next-highest annual MDD (170 m3/d, in 2020), this value could be related to a specific operational issue, and not indicative of actual flow increases to the WTP. Table 2-44 Western Trent/Palmina Historical Water Supply Data ADD
MDD
% Capacity
Maximum Day Factor
(m3/d)
(m3/d)
2023
86
240
82%
2.80
2022
64
136
46%
2.12
2021
71
140
48%
1.97
2020
71
170
58%
2.41
2019
66
144
49%
2.19
Year
Project Number 10599 January 2025
Page | 56
Technical Memorandum #4 Kawartha Lakes Water-Wastewater Master Plan Capacity Assessment
Figure 2-20 Western Trent/Palmina Historical Water Demands
Operational and Facility Capacity Constraints TYLin met with facility operators on February 26th, 2024. No specific concerns relating to the operation of the plant were identified. Based on updated regulations (since the facility was constructed), there may be a need to replace the existing cartridge filter system with a system which supports NSF-53 filtration. This will require specific investigation and recommendations.
Project Number 10599 January 2025
Page | 57
Technical Memorandum #4 Kawartha Lakes Water-Wastewater Master Plan Capacity Assessment
2.5.17 Woodfield Water Treatment Plant The Woodfield Water Treatment System is owned by City of Kawartha Lakes and operated by Ontario Clean Water Agency (OCWA). The Woodfield Water Treatment Plant draws water from groundwater wells. The rated capacity of this WTP is 295 m3/d. Water treatment facilities are rated for maximum day demand. Review of Treatment Plant Capacity Table 2-45 Woodfield WTP Capacity Summary Treatment Process
Capacity
Process Equipment
Rated Plant Capacity
295 m3/d
N/A
Meets Rated Capacity?
Review of Annual Demand Water supply data from 2019 to 2023 annual reports were reviewed to determine historical water demands in Woodfield. Based on the maximum day demand of 83 m3/d in 2023, the plant is operating at approximately 28% of its rated capacity. Table 2-46 Woodfield Historical Water Supply Data ADD
MDD
% Capacity
Maximum Day Factor
(m3/d)
(m3/d)
2023
20
83
28%
4.11
2022
20
42
14%
2.14
2021
20
61
21%
3.10
2020
20
55
19%
2.70
2019
17
39
13%
2.18
Year
Project Number 10599 January 2025
Page | 58
Technical Memorandum #4 Kawartha Lakes Water-Wastewater Master Plan Capacity Assessment
Figure 2-21 Woodfield Historical Water Demands
Operational and Facility Capacity Constraints TYLin met with facility operators on February 26th, 2024. The facility operates from two wells; a third well has been drilled, but is not connected to the supply. Maintaining chlorine residual without storage is sometimes a challenge. There were never plans to expand the service area of the facility beyond the homes which are currently connected to the water system. The peak hour demands from this facility are quite high – often about 5 times average. As there is no storage in the system, the peak hour demands are capacity-limiting.
Project Number 10599 January 2025
Page | 59
Technical Memorandum #4 Kawartha Lakes Water-Wastewater Master Plan Capacity Assessment
3 REVIEW OF WASTEWATER FACILITIES 3.1 Lindsay 3.1.1 Wastewater Treatment The Lindsay Water Pollution Control Plant (WPCP) is a conventional extended aeration treatment plant owned by City of Kawartha Lakes and operated by Ontario Clean Water Agency (OCWA). The Lindsay WPCP is operated under the Ministry of Environment, Conservation, and Parks (MECP) amended Environmental Compliance Approval (ECA) 1696-BPLL4R (Issued in June 2020). The WPCP has recently been expanded to Phase 1 with a rated average day flow (ADF) capacity of 24,500 m3/d. The Phase 2 full build-out capacity has been recommended to be increased by 42,756 m3/d in 2048 (Schedule “C” Municipal Class Environmental Assessment, Associated Engineering, 2015), and this requirement will be confirmed in this Master Plan. The Lindsay WPCP is located directly north of the community of Lindsay settlement area, in close proximity to the Scugog River and the City’s landfill site. The treatment plant consists of headworks (Bar Screen and Grit Removal units), conventional extended aeration tanks, two secondary clarifiers, and ballasted high-rate sedimentation (Actiflo process). The effluent receives UV disinfection prior to discharge to the Scugog River. 3.1.1.1 Permits and Approvals The Environmental Compliance Approval for the Lindsay Water Pollution Control Plant (WPCP) was amended on June 29th, 2020 under permit number 1696-BPLL4R. The permit authorizes the upgrade, expansion, usage and operation of the existing plant for treatment of sewage and disposal of effluent to Scugog River. The permit specifies the rated capacity of the plant at 24,500 m3/d with a peak hourly rate of 45,150 m3/d and peak daily flow of 30,100 m3/d. 3.1.1.2 Review of Treatment Plant Capacity The following Table 3-1 provides capacity summary information for the main treatment processes at the Lindsay WPCP. The values are generally obtained from various documents such as permits, O&M manuals, or other documentation, and have not been verified by actual stress tests as part of this project.
Project Number 10599 January 2025
Page | 60
Technical Memorandum #4 Kawartha Lakes Water-Wastewater Master Plan Capacity Assessment
Table 3-1 Lindsay WPCP Capacity Summary Treatment Process
Capacity
Process Equipment
Meets Rated Capacity?
N/A
Rated Plant Capacity 3
[1]
Average Day Flow
24,500 m /d
Maximum Day Flow
30,100 m3/d [1]
Headworks
Yes 3
[1]
Average Day Flow
24,500 m /d
Peak Hour Flow
45,150 m3/d [1]
One duty automated bar screen Grit removal
Aeration
Yes 3
[1]
Average Day Flow
24,500 m /d
Peak Hour Flow
30,100 m3/d [1]
Two two-pass concrete aeration tanks
Secondary Clarifier
36,750 m3/d [1]
Two concrete circular clarifiers
Yes
Tertiary
30,100 m3/d [1]
Actiflo, two units each rated 15,050 m3/d [2]
Yes
UV
30,100 m3/d [1]
Trojan UV3000A
Yes
1. Lindsay WPCP Phase 1 Upgrade and Expansion, October 2019, CIMA 2. Amended Environmental Compliance Approval: 1696-BPLL4R, June 2020
The old mechanically cleaned bar screen reached the end of its useful life and was replaced by an automated bar screen rated for 24,500 m3/d. The old extended aeration facility couldn’t provide sufficient capacity for Phase 1 and was replaced by a new extended aeration facility which provides a rated ADF capacity of 24,500 m3/d. The new extended aeration facility is designed to be a nitrifying plant with partial oxidized nitrogen removal to reduce energy consumption and promote the growth of well-settling sludge (CIMA, 2019). 3.1.1.3 Review of Annual Flows WPCP flow data from 2019 to 2023 annual reports were reviewed to determine historical wastewater flows in Lindsay. Average day and maximum day flow for the past five years are included in Table 3-2 below.
Project Number 10599 January 2025
Page | 61
Technical Memorandum #4 Kawartha Lakes Water-Wastewater Master Plan Capacity Assessment
Table 3-2 Lindsay WPCP Historical Wastewater Flow Data ADF
MDF
(m3/d) 2023
Year
1) 2)
Per Capita ADF
(m3/d) [1]
Estimated Serviced Population [2]
14,178
31,203
23,086
614
2022
13,210
35,938
22,725
581
2021
12,110
25,604
22,365
541
2020
13,576
30,364
22,012
617
2019
13,646
26,346
21,666
630
(Lpcd)
This represents the volume processed through the plant, and not the total flow towards the plant. When the plant’s MDF capacity is exceeded, influent flows are bypassed to equalization storage lagoons. Populations and rate of growth based on data from 2021 and 2016 Census
The historical average day flows from Table 3-2 are plotted versus the rated WPCP capacity in Figure 3-1 below.
Project Number 10599 January 2025
Page | 62
Technical Memorandum #4 Kawartha Lakes Water-Wastewater Master Plan Capacity Assessment
Figure 3-1 Lindsay WPCP Historical Wastewater Flow
The highest annual average flow to the plant was 14,178 m3/day, in 2023. Based on this, the plant is operating at approximately 58% of its rated capacity. As shown in the chart above, there are instances – during wet-weather events – there the plant’s maximum day capacity is exceeded. In these events, influent flows are diverted into equalization lagoons, and then processed through the plant once peak flows have subsided. According to the maximum annual average flow of 14,178 m3/d in 2023, the plant has an ADF reserve capacity of 10,322 m3/d. Historically, the blended per capita wastewater flow (total flow divided by residential population) has ranged from 541 to 630 Lpcd. While the blended per-capita flow could exceed the design criteria, the magnitude of this calculated per-capita flow suggests that there is a high degree of inflow and infiltration into the collection system. Based on 10,322 m3/d of reserve ADF capacity and a design per-capita flow of 450 Lpcd, the Lindsay WPCP can accommodate additional residential and employment wastewater flows associated with a population increase of approximately 26,000 residents (to a total community
Project Number 10599 January 2025
Page | 63
Technical Memorandum #4 Kawartha Lakes Water-Wastewater Master Plan Capacity Assessment
population of approximately 50,000 residents). Typically, upgrades to a plant are planned once the facility reaches 80% of its rated capacity. The reserve capacity of the plant to 80% capacity is 5,422 m3/d which equates to approximately 13,700 additional serviceable population (residential and employment). Table 3-3 Lindsay WPCP Reserve Capacity and Additional Serviceable Population Demand Scenario
Existing ADF (m3/d)
Limiting ADF (m3/d)
Reserve ADF (m3/d)
Serviceable Population – Observed (Lpcd) (1)
Serviceable Population – Design (Lpcd) (2)
100% Capacity
14,178
24,500
10,322
16,389
26,020
80% Capacity
14,178
19,600
5,422
8,609
13,668
Notes: 1) Based on historical ADF and per-capita flows 2) Based on historical ADF and design per-capita flows
3.1.1.4 Review of Effluent Quality The 2017-2022 performance report indicated several exceedances of TP, TAN and TSS. These exceedances were mostly caused by repeated mechanical aerators failure. The aerators and the aeration tank were replaced with a new aeration system with fine bubble diffusers in the year 2022. It is recommended that the city keep monitoring the effluent quality. The historic effluent parameter tracking table can be found in Appendix A. 3.1.1.5 Operational and Facility Capacity Constraints TYLin visited the Lindsay WPCP in December 2022, and met with facility operators on February 7th, 2024. Overall, the Lindsay WPCP is in excellent condition. The headworks, aeration tanks, aeration blower room, and RAS/WAS system has been updated recently. Appendix A includes an overall facility condition assessment, including photos and details. The following improvements could be considered: 1. Headworks Redundancy: There was concern expressed by the operators that there is no redundancy to the headworks. There is a single bar screen and a single grit separator. 2. General Corrosion: Corrosion was observed in headworks building. Repair as required. Refer to Appendix A for detailed location for the corroded parts.
Project Number 10599 January 2025
Page | 64
Technical Memorandum #4 Kawartha Lakes Water-Wastewater Master Plan Capacity Assessment
3. Spool Piece: A pipe spool piece is in poor condition. 4. Inflow and Infiltration: The per-capita flows indicate that there is high I/I in the collection system. While the plant’s maximum day capacity is exceeded on occasion, the operators have expressed that the equalization lagoon storage capacity is adequate. 3.1.1.6 Potential for Future Expansion A Class EA study was completed to assess future requirements for the Lindsay WPCP. The EA study recommended the expansion to 24,500 m3/d to meet the servicing requirements up to 2025 (Phase 1) and to 42,756 m3/d for full build out in 2048 (Phase 2). Phase 1 upgrades have been completed recently. No spares in the existing MCCs. While the treatment plant has plenty of space for the new MCC unit if needed.
3.1.2 Sewage Pumping Stations The discharge capacities of the Lindsay sewage pumping stations are presented below. The capacities are generally documented based on design reports or nameplate data. In stations where there are multiple duty-pumps, it can sometimes be unclear whether the stated capacities of the pumps include the operation of other pumps. Because of this, the specified TDH of the pumps has been provided, and the modelling results indicating the pump combinations has also been provided. While this degree of information is reasonable for Master Planning purposes, where the pump capacities are uncertain and could potentially limit the ability of the stations to service the forecasted growth, pump testing may ultimately be recommended. 3.1.2.1 Fairgrounds Sewage Pumping Station The Fairgrounds SPS is located within the Lindsay Fairgrounds next to Angeline Street near Highway 7. The flows are conveyed via a 150 mm PVC forcemain before discharging into a gravity sewer on Angeline Street South. The facility consists of two submersible pumps, rated for 18 L/s at 22 m TDH each in duty/standby operation. 3.1.2.2 Jennings Creek Sewage Pumping Station The Jennings Creek SPS is located just north of Colborne Street West and Highway 35. The flows are conveyed via a forcemain along Angeline Street North to the Lindsay WPCP. The facility consists of three pumps, each rated for 275 L/s at 46 m TDH, for a combined firm
Project Number 10599 January 2025
Page | 65
Technical Memorandum #4 Kawartha Lakes Water-Wastewater Master Plan Capacity Assessment
capacity of 550 L/s. 3.1.2.3 Lindsay Street North Sewage Pumping Station Lindsay Street North SPS is located by Lindsay Street North right-of-way near the northern area of the community. The flows are conveyed via a 450 mm HDPE (500 mm CPP under river) and a 400 mm DI (350 mm CPP under river) forcemain to the Lindsay WPCP. The facility consists of three pumps, each rated for 345 L/s at 35 m TDH, for a combined theoretical firm capacity of 690 L/s. A fourth pump can be installed at Lindsay Street North SPS, potentially increasing the firm capacity to 1,035 L/s. 3.1.2.4 Logie Street Sewage Pumping Station Logie Street SPS is located at the east river of the river on the south end of the community. The flows are conveyed via a 250 mm PVC forcemain to the gravity sewer on Parkside Drive. The facility consists of two submersible pumps, rated for 69.1 L/s at 14.07 m TDH each in duty/standby operation. 3.1.2.5 Mary Street Sewage Pumping Station The Mary Street SPS is located on the northwest corner of Mary Street and Wolfe Street. The flows are being conveyed via a 150mm AC forcemain to the existing gravity sewer system on Wolfe and George Street. The facility consists of two submersible pumps, one rated for 28 L/s and the other for 30 L/s at 20 m TDH in duty/standby operation. 3.1.2.6 Ridout Street Sewage Pumping Station The Ridout Street SPS is located on Ridout Street right-of-way west of the Scugog River. The flows are conveyed via a 500 mm HDPE forcemain to the existing gravity sewer manhole on St. David Street. The facility consists of three centrifugal pumps, each rated for 180 L/s at 29 m TDH, for a combined firm capacity of 360 L/s. 3.1.2.7 Rivera Park Sewage Pumping Station Rivera Park SPS is located east of the river by Lindsay Street North and Colborne Street. The flows are being conveyed via 450 mm PVC and 500 mm HDPE forcemains to the existing gravity sewer at the intersection of St. David and Needham Street. The facility consists of four pumps, one of which were part of the old Colborne Street SPS (Pump 4). Pump 1 and Pump 3 have a capacity of 235 L/s at 32 m TDH, Pump 2 and Pump 4 have a capacity Project Number 10599 January 2025
Page | 66
Technical Memorandum #4 Kawartha Lakes Water-Wastewater Master Plan Capacity Assessment
of 200 L/s at 29 m TDH. This facility has a combined theoretical firm capacity of approximately 635 L/s. The Rivera Park SPS including wet well and forcemains were originally designed (in 2017) to provide the ultimate firm capacity of 701 L/s. However, the station was initially equipped with pumps to provide a minimum required firm rated pumping capacity of 621 L/s to accommodate 2031 estimated peak flow projection and included provisions to increase the required firm rated pumping capacity to 684 L/s to accommodate 2048 estimated peak flow projection in the future. In order to allow some flexibility in accommodating unforeseen future growth/development the design of this new SPS considered the firm rated pumping capacity to accommodate flows in the order of 2.5% above the projected flows and the pumps were selected accordingly. It is noted that the mentioned flow projections were estimated during the design of this station. The current servicing study is reviewing the ultimate buildout flow projection. 3.1.2.8 Riverview Estates Sewage Pumping Station Riverview Street Estates SPS is located on Baron Street. The flows are conveyed via a 150mm PE forcemain to a gravity sewer located at the dead end of David Street. The facility consists of two submersible pumps, rated for 8.4 L/s at 13.6 m TDH each in duty/standby operation. 3.1.2.9 Wellington Street Sewage Pumping Station Wellington Street SPS is located east of Scugog river at Wellington St and Lindsay Street North. The Wellington Street SPS flows are conveyed via a 100 mm CI forcemain to the gravity sewer on Lindsay Street North. The facility consists of two submersible pumps, rated for 6.9 L/s each in duty/standby operation.
Project Number 10599 January 2025
Page | 67
Technical Memorandum #4 Kawartha Lakes Water-Wastewater Master Plan Capacity Assessment
3.2 Bobcaygeon 3.2.1 Wastewater Treatment The Bobcaygeon Water Pollution Control Plant (WPCP) is a conventional extended aeration treatment plant owned by City of Kawartha Lakes and operated by Ontario Clean Water Agency (OCWA). The Bobcaygeon WPCP is operated under the Ministry of Environment, Conservation, and Parks (MECP) amended Environmental Compliance Approval (ECA) 3028-AEUKDQ (Issued in April 2017). The plant discharges to the Big Bob Channel, which flows to Pigeon Lake. The rated average flow capacity of the plant is 3,055 m3/d. The treatment plant consists of headworks (grit channels), conventional extended aeration tanks, two secondary clarifiers and one aerobic sludge digesters. The effluent receives UV disinfection prior to discharge to Big Bob Channel. 3.2.1.1 Permits and Approvals The Environmental Compliance Approval for the Bobcaygeon Water Pollution Control Plant (WPCP) and Sewage Pumping Station (SPS) was amended on April 10th, 2017 under permit number 3028AEUKDQ. The permit authorizes the transmission, treatment of sewage flow, and disposals of effluent to Big Bob Channel. The permit specifies the rated capacity of the plant at 3,055 m3/d. The permit also stipulates previous upgrades to the other Sewage Pumping Stations in Bobcaygeon as well as detailed information on the Bobcaygeon WPCP. The Environmental Compliance Approval was amended on April 10th, 2017, under permit number 4075-AFRJQM. The permit authorizes the municipal sewage works for the collection and transmission of sanitary sewage in the village of Bobcaygeon and ultimately to Bobcaygeon Water Pollution Control Plant (WPCP) for treatment from the 11 SPSs and 25 kilometers of sanitary sewer. 3.2.1.2 Review of Treatment Plant Capacity The following Table 3-4 provides capacity summary information for the main treatment processes at the Bobcaygeon WPCP. The values are generally obtained from various documents such as permits, O&M manuals, or other documentation, and have not been verified by actual stress tests as part of this project.
Project Number 10599 January 2025
Page | 68
Technical Memorandum #4 Kawartha Lakes Water-Wastewater Master Plan Capacity Assessment
Table 3-4 Bobcaygeon WPCP Capacity Summary Treatment Process
Capacity
Process Equipment
Meets Rated Capacity?
N/A
Rated Plant Capacity 3
[1]
Average Day Flow
3,055 m /d
Peak Flow
10,440 m3/d [1]
Headworks Average Day Flow
N/A
One manual bar screen
Peak Flow
N/A [2]
Three grit channels
Average Day Flow
N/A
Annular aeration units
Peak Flow
N/A[2]
Secondary Clarifier
10,440 m3/d [3]
Two circular clarifiers
Yes
UV
5,220 m3/d [1]
Two channels, each rated 5,220 m3/d1
Yes
Aeration
1. Amended Environmental Compliance Approval: 3028-AEUKDQ 2. Given the limited information contained in the record drawings available, the true capacity of this process could not be determined. A more detailed evaluation is recommended to assess the true capacity. 3. Peak flow capacity needs re-rated based on MECP Guidelines (WSP, 2015)
3.2.1.3 Review of Annual Flows WPCP flow data from 2019 to 2023 annual reports were reviewed to determine historical wastewater flows in Bobcaygeon. Average day and maximum day flow for the past five years are included in Table 3-5 below.
Project Number 10599 January 2025
Page | 69
Technical Memorandum #4 Kawartha Lakes Water-Wastewater Master Plan Capacity Assessment
Table 3-5 Bobcaygeon WPCP Historical Wastewater Flow Data ADF
MDF
(m3/d) 2023
Year
Per Capita ADF
(m3/d)
Estimated Serviced Population [1]
2,583
5,586
3,595
719
2022
2,287
4,389
3,585
638
2021
2,327
4,594
3,575
651
2020
2,340
6,055
3,565
656
2019
2,548
5,137
3,555
717
(Lpcd)
1. Populations and rate of growth based on data from 2021 and 2016 Census
The historical average day flows from Table 3-5 are plotted versus the rated WPCP capacity in Figure 3-2 below. Figure 3-2 Bobcaygeon WPCP Historical Wastewater Flow
Project Number 10599 January 2025
Page | 70
Technical Memorandum #4 Kawartha Lakes Water-Wastewater Master Plan Capacity Assessment
The highest annual average flow to the plant was 2,583 m3/day, in 2023. Based on this, the plant is operating at approximately 85% of its rated capacity. The plant experienced a bypass event on December 4, 2020. The bypass event lasted for 61 hours. Approximately 6,164 m3 flowed through the process during this event. The bypass event was not caused by insufficient plant capacity, but by utility hydropower interruptions. According to the maximum annual average flow of 2,583 m3/d in 2023, the plant has an ADF reserve capacity of 472 m3/d. Historically, the blended per capita wastewater flow (residential plus employment) has ranged from 638 to 719 Lpcd, which exceeds the design criteria and suggests that there is a high degree of inflow and infiltration into the collection system. Based on 472 m3/d of reserve ADF capacity and a design per-capita flow of 450 Lpcd, the Bobcaygeon WPCP can accommodate additional residential and employment wastewater flows associated with a population increase of approximately 1,900 residents (to a total community population of approximately 5,600 residents). Typically, upgrades to a plant are planned once the facility reaches 80% of its rated capacity. The plant has been operating at 75% to 85% of its rated capacity for the past five years. As such, planning for future upgrades should be underway. Table 3-6 Bobcaygeon WPCP Reserve Capacity and Additional Serviceable Population Existing ADF (m3/d)
Limiting ADF (m3/d)
Reserve ADF (m3/d)
Serviceable Population – Observed (Lpcd) (1)
Serviceable Population – Design (Lpcd) (2)
100% Capacity
2,583
3,055
472
657
1,888
80% Capacity
2,583
2,444
-139
-194
-556
Demand Scenario
Notes: 1) Based on historical ADF and per-capita flows 2) Based on historical ADF and design per-capita flows
3.2.1.4 Review of Effluent Quality The 2017-2021 performance report indicated a few exceedances of TP, CBOD5 and TSS. These exceedance reasons were not identified in the report. The historic effluent parameter tracking table can be found in Appendix A. 3.2.1.5 Operational and Facility Capacity Constraints TYLin visited the Bobcaygeon WPCP in December 2022, and met with facility operators on February 7th, 2024.
Project Number 10599 January 2025
Page | 71
Technical Memorandum #4 Kawartha Lakes Water-Wastewater Master Plan Capacity Assessment
Overall, the Bobcaygeon WPCP is in good condition. Appendix A includes an overall facility condition assessment, including photos and details. The following improvements could be considered: 1. Sludge Handling: The current practice of gravity decant within the Aerobic Digester is not an effective process which yields a higher sludge hauling cost and odour complaints. A sludge thickening process (e.g., Rotational Drum Thickener) and proper odour control measure are necessary to address these issues. 2. Inflow and Infiltration: The per-capita flows indicate that there is high I/I in the collection system. 3.2.1.6 Potential for Future Expansion There is no room for expansion in the current envelope. As the plant is exceeding 80% of its design average day flow capacity, a class Environmental Assessment should be undertaken to service the forecasted population growth.
3.2.2 Sewage Pumping Stations The discharge capacities of the Bobcaygeon sewage pumping stations are presented below. The capacities are generally documented based on design reports or nameplate data. In stations where there are multiple duty-pumps, it can sometimes be unclear whether the stated capacities of the pumps include the operation of other pumps. Because of this, the specified TDH of the pumps has been provided, and the modelling results indicating the pump combinations has also been provided. While this degree of information is reasonable for Master Planning purposes, where the pump capacities are uncertain and could potentially limit the ability of the stations to service the forecasted growth, pump testing may ultimately be recommended. 3.2.2.1 Sewage Pumping Station No. 1 SPS #1 is located by Canal Street East and Boyd Street. The flows are conveyed via a 200 mm forcemain along Boyd Street, towards Bobcaygeon WPCP. This station is equipped with a 100mm bypass. The facility consists of three pumps, each rated for 17.8 L/s at 24.4 m TDH, for a combined firm capacity of 35.6 L/s. 3.2.2.2 Sewage Pumping Station No. 2 SPS #2 is located on Lance Street just north of King Street. The flows are conveyed via a 150mm
Project Number 10599 January 2025
Page | 72
Technical Memorandum #4 Kawartha Lakes Water-Wastewater Master Plan Capacity Assessment
forcemain along King Street, towards MH 135 which flows to SPS# 1 before discharging to the Bobcaygeon WPCP. The facility consists of two submersible pumps, rated for 13.9 L/s at 13.6 m TDH each in duty/standby operation. 3.2.2.3 Sewage Pumping Station No. 3 SPS #3 is located on Bolton Street just south of Canal Street West. The flows are conveyed via a 100mm forcemain along Main Street, towards MH 187 which flows to SPS# 4. The facility consists of two submersible pumps, rated for 6.7 L/s at 15.8 m TDH each in duty/standby operation. 3.2.2.4 Sewage Pumping Station No. 4 SPS #4 is located on Main Street just south of Front Street West. The flows are conveyed via a 100mm forcemain along Main Street, towards MH 91 which flows to SPS# 6. The facility consists of two submersible pumps, rated for 6.3 L/s at 6.4 m TDH each in duty/standby operation. 3.2.2.5 Sewage Pumping Station No. 5 SPS #5 is located by the intersection of Front Street West and Greenwood Street. The flows are conveyed via a 150mm forcemain along Front Street, towards MH 100 which flows to SPS# 6. The facility consists of two submersible pumps, rated for 13.9 L/s at 8.1 m TDH each in duty/standby operation. 3.2.2.6 Sewage Pumping Station No. 6 SPS #6 is located on Anne Street by East Street North. The flows are conveyed via a 300mm forcemain along Boyd Street, towards before discharging to the Bobcaygeon WPCP. The facility consists of three pumps, each rated for 38.6 L/s at 24.1 m TDH, for a combined firm capacity of 77.2 L/s. 3.2.2.7 Sewage Pumping Station No. 7 SPS #7 is located just east on the intersection of Navigators Trail and Island Bay Drive. The flows are conveyed via a 250mm forcemain along Navigators Trail, before discharging to the Bobcaygeon WPCP. This forcemain is interconnected at Boyd St to 300 mm forcemain from Anne St SPS. The facility consists of two submersible pumps, rated for 42 L/s at 16.3 m TDH each in duty/standby operation.
Project Number 10599 January 2025
Page | 73
Technical Memorandum #4 Kawartha Lakes Water-Wastewater Master Plan Capacity Assessment
A field test of this SPS #7 was undertaken in 2014, indicating that the station has a total capacity of 40 L/s, consistent with the above data. 3.2.2.8 Sewage Pumping Station No. 8 SPS #8 is located on Navigators Trail by Patricia Place. The flows are conveyed via a 150mm forcemain along Navigators Trail, before discharging to MH 35P1 that flows to SPS #7. The facility consists of two submersible pumps, rated for 18.9 L/s at 7.5 m TDH each in duty/standby operation. 3.2.2.9 Sewage Pumping Station No. 9 SPS #9 is located at the intersection of Mill Street and Marina. The flows are conveyed via a 150mm forcemain along Mill Street, before discharging to MH 42P2 that flows to SPS #7. The facility consists of two submersible pumps, rated for 18.9 L/s at 7.5 m TDH each in duty/standby operation. 3.2.2.10 Sewage Pumping Station No. 10 SPS #10 is located on Little Bob Drive by East Street South. The flows are conveyed via a 150mm forcemain along Little Bob Drive, before discharging to MH 441 that flows to SPS #1. The facility consists of two 5 hp submersible pumps, rated for 15.0 L/s at 9.8 TDH each in duty/standby operation. 3.2.2.11 Sewage Pumping Station No. 11 SPS #11 is located at Riverside Drive. The flows are conveyed via a 150mm forcemain along Riverside Drive, before discharging to MH 433 that flows to SPS #6. The facility consists of two 5 hp submersible pumps, rated for 14.1 L/s at 9.2 TDH each in duty/standby operation.
Project Number 10599 January 2025
Page | 74
Technical Memorandum #4 Kawartha Lakes Water-Wastewater Master Plan Capacity Assessment
3.3 Fenelon Falls 3.3.1 Wastewater Treatment The Fenelon Falls Water Pollution Control Plant (WPCP) is a conventional extended aeration activated sludge plant owned by City of Kawartha Lakes and operated by Ontario Clean Water Agency (OCWA). The Fenelon Falls WPCP is operated under the Ministry of Environment, Conservation, and Parks (MECP) amended Environmental Compliance Approval (ECA) 3688BW3RGB (Issued in Jan 2021). The plant discharges to the Fenelon River. The rated average flow capacity of the plant is 1,800 m3/d. The treatment plant consists of 200 mm diameter inlet sewer, headworks (screening and grit channels), conventional extended aeration tank, two secondary clarifiers, one sand filter, one UV disinfection channel, and two sludge holding tanks. 3.3.1.1 Permits and Approvals The Environmental Compliance Approval for the Fenelon Falls Water Pollution Control Plant (WPCP) was amended on January 15, 2021, under permit number 3688-BW3RGB. The permit authorizes the usage and operation of existing municipal sewage works, for the treatment of sanitary sewage and disposal of effluent to Fenelon River. The permit provides a detailed description of the Sanitary network consisting of 3 SPSs, sanitary sewers, and WPCP. The rated capacity of the WPCP is 1,800 m3/d. 3.3.1.2 Review of Treatment Plant Capacity The following Table 3-7 provides capacity summary information for the main treatment processes at the Fenelon Falls WPCP. The values are generally obtained from various documents such as permits, O&M manuals, or other documentation, and have not been verified by actual stress tests as part of this project.
Project Number 10599 January 2025
Page | 75
Technical Memorandum #4 Kawartha Lakes Water-Wastewater Master Plan Capacity Assessment
Table 3-7 Fenelon Falls WPCP Capacity Summary Treatment Process
Capacity
Process Equipment N/A
Rated Plant Capacity 3
[1]
Average Day Flow
1,800 m /d
Peak Flow
6,120 m3/d [1]
Headworks
Yes 3
[2]
Average Day Flow
5,832 m /d
Peak Flow
5,832 m3/d [2]
One manual bar screen Three grit channels, 2 duty 1 standby
Aeration
Yes 3
[3]
3
[3]
Average Day Flow
1,800 m /d
Peak Flow
N/A2
Secondary Clarifier Average Day Flow
1,800 m /d
Peak Flow
6,120 m3/d [1]
Sand Filters Peak Flow
3
5,040 m /d
[1]
UV Peak Flow
Meets Rated Capacity?
Aeration tank and Oxidation tank Two circular clarifiers
Yes
Three continuous upflow sand filter. Each rated at 1,680 m3/d [1]
Yes - Average
One UV channel
Yes - Average
5,040 m3/d [1]
1. Amended Environmental Compliance Approval: 3688-BW3RGB 2. The true capacity of the grit tanks is 5,832 m3/d based on a desktop review performed by WSP. (2014) 3. Water and Wastewater Infrastructure Capacity Review – Fenelon Falls by WSP (2014)
3.3.1.3 Review of Annual Flows WPCP flow data from 2019 to 2023 annual reports were reviewed to determine historical wastewater flows in Fenelon Falls. Average day and maximum day flow for the past five years are included in Table 3-8 below.
Project Number 10599 January 2025
Page | 76
Technical Memorandum #4 Kawartha Lakes Water-Wastewater Master Plan Capacity Assessment
Table 3-8 Fenelon Falls WPCP Historical Wastewater Flow Data ADF
MDF
Estimated Serviced Population
Per Capita ADF
(m3/d)
(m3/d)
2023
1,120
3,509
2,502
448
2022
1,158
4,360
2,496
464
2021
1,084
4,149
2,491
435
2020
1,060
4,072
2,486
426
2019
1,137
/
2,480
458
Year
(Lpcd)
1. Populations and rate of growth based on data from 2021 and 2016 Census
The historical average day flows from Table 3-8 are plotted versus the rated WPCP capacity in Figure 3-3 below.
Project Number 10599 January 2025
Page | 77
Technical Memorandum #4 Kawartha Lakes Water-Wastewater Master Plan Capacity Assessment
Figure 3-3 Fenelon Falls WPCP Historical Wastewater Flow
The highest annual average flow to the plant was 1,158 m3/day, in 2022. Based on this, the plant is operating at approximately 64% of its rated capacity. According to the maximum annual average flow of 1,158 m3/d in 2022, the plant has an ADF reserve capacity of 642 m3/d. Historically, the blended per capita wastewater flow (residential plus employment) has ranged from 426 to 464 Lpcd, which is consistent with the design criteria Based on 642 m3/d of reserve ADF capacity and a design per-capita flow of 450 Lpcd, the Fenelon Falls WPCP can accommodate additional residential and employment wastewater flows associated with a population increase of approximately 1,400 residents (to a total community population of approximately 3,900 residents). Typically, upgrades to a plant are planned once the facility reaches 80% of its rated capacity. The reserve capacity of the plant to 80% capacity is 1,440 m3/d which equates to approximately 600 additional serviceable population (residential and employment).
Project Number 10599 January 2025
Page | 78
Technical Memorandum #4 Kawartha Lakes Water-Wastewater Master Plan Capacity Assessment
Table 3-9 Fenelon Falls WPCP Reserve Capacity and Additional Serviceable Population Demand Scenario
Existing ADF (m3/d)
Limiting ADF (m3/d)
Reserve ADF (m3/d)
Serviceable Population – Observed (Lpcd) (1)
Serviceable Population – Design (Lpcd) (2)
100% Capacity
1,158
1,800
642
1,386
1,428
80% Capacity
1,158
1,440
282
609
628
Notes: 1) Based on historical ADF and per-capita flows 2) Based on historical ADF and design per-capita flows
The plant has experienced a few bypass events in the past years, the bypasses are summarized as following: ► Two partial bypasses of the tertiary sand filters caused by high flows due to weather conditions occurred in February and November 2018. No objective exceedance occurred, as the tertiary filters are not technically required to meet the effluent quality objectives. ► In January and March 2020, two sand filter bypasses occurred because of the wet weather events. No objective exceedance occurred, as the tertiary filters are not technically required to meet the effluent quality objectives. ► In 2021, three partial sand filter bypasses occurred in March, September and December due to the wet weather events. TP results were impacted, exceeding effluent quality objectives as a result. The bypass at Fenelon Falls Water Pollution Control Plant experienced were related to the sand filter hydraulically overloading. Of note, the plant’s maximum daily volume was not exceeded (see Figure 3-3), indicating that this is a peak instantaneous hydraulic loading issue, and not a plant capacity issue. The sand filter has been subjected to more water than it was designed to handle, and the tankage within the plant’s processes are not capable of equalizing the flows sufficiently to prevent overloading of the filters. Additionally, sand filtration is an outdated technology, and it is rarely used for Tertiary treatment in Ontario. The City should review opportunities to increase the tertiary filtration capacity at Fenelon Falls WPCP. 3.3.1.4 Review of Effluent Quality The 2019-2023 performance report indicated one exceedance of TP in the year 2021. The wet weather resulted in high flows, overloading sand filters and bypassing the sand filter partially. The bypass event impacted the TP results. Project Number 10599 January 2025
Page | 79
Technical Memorandum #4 Kawartha Lakes Water-Wastewater Master Plan Capacity Assessment
The historic effluent parameter tracking table can be found in Appendix A. 3.3.1.5 Operational and Facility Capacity Constraints TYLin visited the Fenelon Falls WPCP in December 2022, and met with facility operators on February 7th, 2024. Overall, the Fenelon Falls WPCP is in average condition. Appendix A includes an overall facility condition assessment, including photos and details. The following improvements could be considered: 1. General Corrosion: Corrosion was observed in the plant. Repair as required. Refer to Appendix A for detailed location for the corroded parts. 2. Repair and recoat the concrete: The concrete that has deteriorated in the influent channels is in poor condition. It should be repaired and recoated in the near future. 3. Replace the post-secondary treatment system with a latest technology: The technology used for the existing Upflow Sand Filters is unique and not common in Ontario. These filters have a few challenges to address as follows: •
Mechanical Challenges: The technology is mechanically complicated and often prone to maintenance issues. The filters have many moving parts which are difficult to get for replacement.
•
Operation and Filter Media Issues: The cleaning and backwash cycles could lead to media loss or uneven distribution of the media which would reduce filter capacity and effectiveness. Biological and other fouling is also possible, which could cause these filters to blind and lose their filtration capability.
•
Larger Footprint
•
Do not provide adequate treatment to the wastewater. The quality of influent and effluent of the sand filter remain the same.
3.3.1.6 Potential for Future Expansion There is no room for expansion in the current plant envelope, and no spare slots in the MCC.
3.3.2 Sewage Pumping Stations The discharge capacities of the Fenelon Falls sewage pumping stations are presented below. The capacities are generally documented based on design reports or nameplate data. In stations where there are multiple duty-pumps, it can sometimes be unclear whether the stated capacities of the pumps include the operation of other pumps. Because of this, the specified TDH of the pumps has been provided, and the modelling results indicating the pump
Project Number 10599 January 2025
Page | 80
Technical Memorandum #4 Kawartha Lakes Water-Wastewater Master Plan Capacity Assessment
combinations has also been provided. While this degree of information is reasonable for Master Planning purposes, where the pump capacities are uncertain and could potentially limit the ability of the stations to service the forecasted growth, pump testing may ultimately be recommended. 3.3.2.1 Colbourne Street Sewage Pumping Station Colborne Street SPS is located approximately 76m east of Colborne Street on the extension of Oak Street. The flows are conveyed via a 200mm DI forcemain along Colborne Street, before discharging to the sanitary MH located at the intersection of Lindsay Street and Helen Street. The facility consists of two submersible pumps, rated for 50.0 L/s at 13 m TDH each in duty/standby operation. The Colbourne Street SPS discharges upstream of the Ellice Street SPS. There have been historical bypasses at the Colbourne Street SPS, in order to prevent basement flooding related to overloading the Ellice Street SPS, which was built without a high-level bypass. A detention tank was constructed kat Ellice Street SPS in 2017, reducing the risk of bypassing at Colbourne. 3.3.2.2 Ellice Street Sewage Pumping Station Ellice Street SPS is located on Elice just north of Wychwood Crescent. The flows are conveyed via a 200mm DI forcemain along Ellice Street, before discharging to the Fenelon Falls WPCP. Ellice Street SPS is also equipped with a detention storage tank in lieu of an emergency overflow pipe. In instances where the pumps are potentially overwhelmed, influent flows are diverted into the tank. The facility consists of three dry-pit variable-speed pumps, each rated for 60 L/s at 21 m TDH, for a combined firm capacity of 120.0 L/s. There are two pumps in the station, and the third pump is in the detention tank. The two main station pumps are configured that they can both run simultaneously if needed (and available). If one pump is not available, excess flows will flow into the detention tank where the third pump is available. Because of this configuration, the firm capacity of the facility can be considered to be 120 L/s at 21 m TDH. 3.3.2.3 Francis Street Sewage Pumping Station The Francis Street SPS is located on Francis Street, west of Concession Road. The flows are conveyed via a 100mm CI forcemain along Francis Street, before discharging to a sanitary MH approximately 40m east of Clifton Street. The facility consists of two submersible pumps, rated for 6.2 L/s at 15.2 m TDH each in duty/standby operation.
Project Number 10599 January 2025
Page | 81
Technical Memorandum #4 Kawartha Lakes Water-Wastewater Master Plan Capacity Assessment
3.4 Omemee 3.4.1 Wastewater Treatment The Omemee Wastewater Treatment Plant (WWTP) is a wastewater treatment lagoon owned by City of Kawartha Lakes and operated by Ontario Clean Water Agency (OCWA). The Omemee Wastewater Treatment Plant is operated under the Ministry of Environment, Conservation, and Parks (MECP) amended Environmental Compliance Approval (ECA) 2737-B4DH46 (Issued in Sep 2018). The rated average flow capacity of the plant is 1,353 m3/d. The treatment plant consists of two waste stabilization lagoons, subsurface disposal system and spray irrigation system. A pump house containing two wet wells equipped with four submersible pumps discharging treated effluent from the lagoons to the subsurface disposal system. 3.4.1.1 Permits and Approvals The Environmental Compliance Approval for the Omemee Sewage Lagoon was amended on September 28, 2018, under permit number 2737-B4DH46. The permit authorizes usage and operation of existing municipal sewage works, for the treatment of sanitary sewage and disposal of effluent to the ground via the Omemee Sewage Lagoon. The permit provides a detailed description of the Omemee Sewage Lagoon facility. The rated capacity of the plant is 1,353 m3/d. 3.4.1.2 Review of Treatment Plant Capacity The following provides capacity summary information for the main treatment processes at the Omemee WWTP. The values are generally obtained from various documents such as permits, O&M manuals, or other documentation, and have not been verified by actual stress tests as part of this project. Table 3-10 Omemee WPCP Capacity Summary Meets Rated Capacity?
Treatment Process
Capacity
Process Equipment
Rated Plant Capacity
1,353 m3/d1
N/A
Lagoons
1,353 m3/d1
Two (2) 3.6 ha. waste Yes stabilization lagoons, providing a total storage volume of approximately 178,000 m3.
Effluent Disposal System
1,353 m3/d1
Final effluent forcemain
Yes
1. Amended Environmental Compliance Approval: 2737-B4DH46
Project Number 10599 January 2025
Page | 82
Technical Memorandum #4 Kawartha Lakes Water-Wastewater Master Plan Capacity Assessment
3.4.1.3 Review of Annual Flows WWTP flow data from 2019 to 2023 annual reports were reviewed to determine historical wastewater flows in Omemee. Average day and maximum day flow for the past five years are included in Table 3-11 below. The Omemee wastewater treatment system was originally constructed as a dual lagoon/spray irrigation system in 1976. In 2013, the facility was upgraded with a large Subsurface disposal system (LSSDS), and the spray irrigation system was considered to be decommissioned. However, the LSSDS has not performed to its original design and is unable to handle the design flows as the LSSDS has experienced malfunctions in the pumping chamber and the tile bed due to slime buildup and seasonal spikes in suspended solids. Although the current ECA for the Omemee lagoon site no longer supports spray irrigation, the MECP has continued to authorize its use as an emergency measure to minimize the risk of an uncontrolled sewage discharge to the environment. A recently-completed Schedule C Class EA (2023, ___) recommended running the existing LSSDS at a reduced capacity with some upgrades (DAF units), and continuing to run the spray irrigation system during the spray season. Based on the EA study, the proposed revised rated capacity of the upgraded WPCP with both systems available throughout the year would be 958 m3/day. Table 3-11 Omemee WPCP Historical Wastewater Flow Data Year
ADF
MDF
(m3/d)
(m3/d)
Estimated Serviced Population [1]
Blended Per Capita ADF (Lpcd)
2023
590
5,653
1,035
570
2022
474
2,580
1,035
458
2021
560
2,580
1,035
541
2020
543
2,629
1,035
525
2019
497
1,748
1,035
480
1. Populations and rate of growth based on data from 2021 and 2016 Census
The historical average day flows from Table 3-11 are plotted versus the rated WWTP capacity in Figure 3-4 below.
Project Number 10599 January 2025
Page | 83
Technical Memorandum #4 Kawartha Lakes Water-Wastewater Master Plan Capacity Assessment
Figure 3-4 Omemee WPCP Historical Wastewater Flow
The highest annual average flow to the plant was 590 m3/day, in 2023. Based on this, the plant is operating at approximately 44% of its rated capacity. According to the maximum annual average flow of 590 m3/d in 2023, the plant has an ADF reserve capacity of 763 m3/d. Historically, the blended per capita wastewater flow (residential plus employment) has ranged from 458 to 570 Lpcd. Based on 763 m3/d of reserve ADF capacity and a design per-capita flow of 450 Lpcd, the Omemee WPCP can accommodate additional residential and employment wastewater flows associated with a population increase of approximately 1,700 residents (to a total community population of approximately 2,700 residents). Typically, upgrades to a plant are planned once the facility reaches 80% of its rated capacity. The reserve capacity of the plant to 80% capacity is 492 m3/d which equates to approximately 1,100 additional serviceable population (residential and employment).
Project Number 10599 January 2025
Page | 84
Technical Memorandum #4 Kawartha Lakes Water-Wastewater Master Plan Capacity Assessment
Table 3-12 Omemee WPCP Reserve Capacity and Additional Serviceable Population Demand Scenario
Existing ADF (m3/d)
Limiting ADF (m3/d)
Reserve ADF (m3/d)
Serviceable Population – Observed (Lpcd) (1)
Serviceable Population – Design (Lpcd) (2)
100% Capacity
590
1,353
763
1,338
1,696
80% Capacity
590
1,082
492
864
1,094
Notes: 1) Based on historical ADF and per-capita flows 2) Based on historical ADF and design per-capita flows
3.4.1.4 Review of Effluent Quality The 2017-2021 performance report indicated one exceedance of TSS in the year 2020, and one exceedance of nitrate in the year 2018. The exceedances were caused by the low effluent level and mechanical failure. The historic effluent parameter tracking table can be found in Appendix A. 3.4.1.5 Operational and Facility Capacity Constraints TYLin visited the Omemee WPCP in December 2022, and met with facility operators on February 7th, 2024. Overall, the Omemee WWTP is in average condition. Appendix A includes an overall facility condition assessment, including photos and details. The following improvements could be considered: 1. General Corrosion: Corrosion was observed in the pump house. Repair as required. 2. Alum Storage: The storage capacity is insufficient. 3.4.1.6 Potential for Future Expansion There is no physical room in the pump station building for new equipment. There is no spare room in MCC.
3.4.2 Sewage Pumping Stations The discharge capacities of the Omemee sewage pumping stations are presented below. The capacities are generally documented based on design reports or nameplate data.
Project Number 10599 January 2025
Page | 85
Technical Memorandum #4 Kawartha Lakes Water-Wastewater Master Plan Capacity Assessment
While this degree of information is reasonable for Master Planning purposes, where the pump capacities are uncertain and could potentially limit the ability of the stations to service the forecasted growth, pump testing may ultimately be recommended. 3.4.2.1 Church Street Sewage Pumping Station The Church Street SPS is located east off of Colborne Street just north of King Street East. The flows are conveyed via a 250 mm PVC forcemain. The facility consists of two submersible pumps, rated for 45 L/s at 12.2 TDH each in duty/standby operation. A planned third pump can be installed at Church Street SPS, potentially increasing the station capacity to 64 L/s 3.4.2.2 Sturgeon Road Sewage Pumping Station The Sturgeon Road SPS is located on Sturgeon Road just south of Mary Street East. The flows are being conveyed via a 300 mm PVC forcemain North on Sturgeon Road. The facility consists of two submersible pumps, rated for 88 L/s at 46 m TDH each in duty/standby operation. A planned third pump can be installed at Sturgeon Road SPS, potentially increasing the station capacity to 122 L/s
Project Number 10599 January 2025
Page | 86
Technical Memorandum #4 Kawartha Lakes Water-Wastewater Master Plan Capacity Assessment
3.5 Small Systems 3.5.1 Coboconk Sewage Lagoons The Coboconk Sewage Lagoons are a wastewater treatment lagoon system owned by City of Kawartha Lakes and operated by Ontario Clean Water Agency (OCWA). The Coboconk Wastewater Treatment Plant is operated under the Ministry of Environment, Conservation, and Parks (MECP) amended Environmental Compliance Approval (ECA) 9527-AHVRDY (Issued in March 2017). The rated average flow capacity of the plant is 421 m3/d. The treatment plant consists of an influent pumping station, two cell waste stabilization ponds trains, and effluent transfer pumps. The lagoon discharges to Gull River. Review of Treatment Plant Capacity The following Table 3-13 provides capacity summary information for the main treatment processes at the Coboconk WWTP. Table 3-13 Coboconk WPCP Capacity Summary Treatment Process
Capacity
Process Equipment
Rated Plant Capacity
421 m3/d1
N/A
Sewage Treatment
421 m3/d1
Meets Rated Capacity?
Yes
Review of Effluent Quality There is no exceedance identified in the 2019-2023 annual reports. Review of Annual Flows WWTP flow data from 2019 to 2023 annual reports were reviewed to determine historical water demands in Coboconk. Based on the average day flow of 411 m3/d in 2019, the plant is operating at approximately 98% of its rated capacity. The annual reports indicate that “weather conditions have an impact on the amount of effluent discharged each year”. No bypasses were reported in 2023.
Project Number 10599 January 2025
Page | 87
Technical Memorandum #4 Kawartha Lakes Water-Wastewater Master Plan Capacity Assessment
Table 3-14 Coboconk WPCP Historical Wastewater Flow Data ADF
MDF
(m3/d)
(m3/d)
2023
366
/
87%
2022
246
/
59%
2021
229
369
54%
2020
219
645
52%
2019
411
/
98%
Year
% ADF Capacity
Figure 3-5 Coboconk WPCP Historical Wastewater Flow
Operational and Facility Capacity Constraints TYLin met with facility operators on February 26th, 2024. The system is susceptible to high levels of inflow and infiltration, and there are occasional
Project Number 10599 January 2025
Page | 88
Technical Memorandum #4 Kawartha Lakes Water-Wastewater Master Plan Capacity Assessment
reports concerning odours from the plant. There is no land available to add another lagoon
3.5.2 Coboconk Sewage Pumping Stations South Water Street Sewage Pumping Station (No. 1) The South Water Street SPS is located on South Water Street just east of the Gull River. The flows from the station are conveyed via a 100mm forcemain along Highway 35 towards the Water Street Pumping Station. This station is equipped with two pumps with each pump having a rated capacity of 8.2 L/s. Water Street Sewage Pumping Station (No. 2) The Water Street SPS is located on Water Street and Highway 35. The flows from the station are conveyed via a 150mm forcemain along Highway 35 towards the Main Street SPS. This station is equipped with two pumps with each pump having a rated capacity of 18.2 L/s. Main Street Sewage Pumping Station (No. 3) The Main Street SPS is located on the southeast corner from Grandy Road and Highway 35 intersection. The flows from the station are conveyed via a 150mm forcemain towards the lagoon. This station is equipped with two pumps with each pump having a rated capacity of 19.5 L/s.
Project Number 10599 January 2025
Page | 89
Technical Memorandum #4 Kawartha Lakes Water-Wastewater Master Plan Capacity Assessment
3.5.3 King’s Bay Environmental Centre The King’s Bay Environmental Centre (EC) is a wastewater treatment lagoon owned by City of Kawartha Lakes and operated by Ontario Clean Water Agency (OCWA). The King’s Bay EC is operated under the Ministry of Environment, Conservation, and Parks (MECP) amended Environmental Compliance Approval (ECA) 7037-A77JLP (Issued in Feb 2016). The rated average flow capacity of the plant is 170 m3/d. The plant consists of an influent pumping station, two separate sewage treatment trains, phosphorus removal system and subsurface disposal system. A pump house containing one wet well equipped with four submersible pumps discharging treated effluent from the lagoons to the subsurface disposal system. Table 3-15 King’s Bay EC Capacity Summary Treatment Process
Capacity
Process Equipment
Rated Plant Capacity
170 m3/d1
N/A
Sewage Treatment
170 m3/d1
Two trains
Meets Rated Capacity?
Yes 3
1
Each rated at 85 m /d 1. Amended Environmental Compliance Approval: 7037-A77JLP
Review of Effluent Quality The 2017-2021 performance report indicated a few TSS exceedance each year. The TSS issues were solved by adjusting alum addition. Review of Annual Flows Plant flow data from 2019 to 2023 annual reports were reviewed to determine historical wastewater flows in King’s Bay. Based on the average day flow of 46 m3/d in 2020, the plant is operating at approximately 27% of its rated capacity. Operational and Facility Capacity Constraints TYLin met with facility operators on February 26th, 2024. The facility runs two Rotating Biological Contactors, typically at about 40% capacity. There is no standby unit, as both processes need to be kept active in order to preserve the biological process. This facility experiences a combination of low hydraulic loading, but at a high BOD concentration. If one of the RBCs is not available, the resulting loading to the remaining RBC will exceed its design value, resulting in a compromised effluent quality.
Project Number 10599 January 2025
Page | 90
Technical Memorandum #4 Kawartha Lakes Water-Wastewater Master Plan Capacity Assessment
Table 3-16 King’s Bay EC Historical Wastewater Flow Data ADF
MDF
(m3/d)
(m3/d)
2023
44
83
26%
2022
42
68
25%
2021
43
46
25%
2020
46
60
27%
2019
44
62
26%
Year
% ADF Capacity
Figure 3-6 King’s Bay WPCP Historical Wastewater Flow
Project Number 10599 January 2025
Page | 91
WATER AND WASTEWATER SERVICING AND CAPACITY MASTER PLAN UPDATE CITY OF KAWARTHA LAKES | 2022-13-CP | Jan 2023 Facility Capacity Assessment Template
Facility Name: Lindsay Water Treatment Plant 33 Mary St E, Lindsay, ON K9V 1V3
Address:
Water Demand in the Past Five Years 22,730
20,000
15,000 13,213
12,933
m3/d
12,050 11,206 10,000
10,571 8,041
7,140
DWS Number Permit to Take Water Capacity Process Intake/Well Processes Aeration Process Capacity Flocculation GAC
7204
7,219
7,298
2019
2020
2021
5,000
#: 8160-B3MP6L 30,685 m3/d 22,730 m3/d Capacity 44,050 m3/d 29,600 m3/d \ \
0 2017
2018
Year Max Daily Demand
Plant Design Capacity
Average Daily Demand
Annual Reports Capacity 2021 2020 2019 2018 2017
ADF 22,730 7,298 7,219 7204 8,041 7,140
% of Capacity 100% 32% 32% 32% 35% 31%
Max Day 22,730 12,050 13,213 10,571 12,933 11,206
% of Capacity 100% 53% 58% 47% 57% 49%
Unit
m3/d m3/d m3/d m3/d m3/d
Treatment Chemical Sodium Hypochloride Aluminum Sulphate (Alum) Carbon Dioxide Sodium Hydroxide PAC Magna Floc Polymer
Use Disinfection Coagulant Flocculation PH Adjustment Coagulant Coagulant
Concentration Exceedance (Limit) 2021 2020 2019 2018 2017
Incidents THMs and HAA slightly over Max Allowable in distribution system THMs and HAA slightly over Max Allowable in distribution system N/A THMs and HAA slightly over Max Allowable in distribution system THMs slightly over Max Allowable
Comments THMs and HAA are disinfection Side-Product, caused by the using of Clorine THMs and HAA are disinfection Side-Product, caused by the using of Clorine
THMs and HAA are disinfection Side-Product, caused by the using of Clorine THMs and HAA are disinfection Side-Product, caused by the using of Clorine
WATER AND WASTEWATER SERVICING AND CAPACITY MASTER PLAN UPDATE CITY OF KAWARTHA LAKES | 2022-13-CP | Jan 2023 Facility Capacity Assessment Template
Facility Name:
Bobcaygeon Water Treatment Plant
Address:
7 Canal St W, Bobcaygeon, ON K0M 1A0
Water Demand in the Past Five Years 5,184
5,000
4,000 3,575
3,481
2,355
2,425
2,463
2019
2020
2021
3,386
3,304
3,304
2,233
2,309
2017
2018
m3/d
3,000
2,000
1,000
0
WTP Number Permit to Take Water Capacity
#: 7640-AQJHCV 5,184 m3/d 5,184 m3/d
Year Max Daily Demand
Plant Design Capacity
Average Daily Demand
Annual Reports ADF Capacity 2021 2020 2019 2018 2017
2,463 2,425 2,355 2,309 2,233
Factor 1.45 1.41 1.47 1.40 1.43 1.52
Max Day 5,184 3,481 3,575 3,304 3,304 3,386
% of Capacity
67% 69% 64% 64% 65%
Unit Treatment Chemical Sodium Hypochloride StermPAC Ammonium Sulphate
m3/d m3/d m3/d m3/d m3/d
Concentration Exceedance (Limit) Comments
Incidents 2021 2020 2019 2018 2017
There were exceedances in instantaneous peak flow rate
Caused during maintenance of the clarifiers.
Use
Disinfection Coagulant Chloramination
WATER AND WASTEWATER SERVICING AND CAPACITY MASTER PLAN UPDATE CITY OF KAWARTHA LAKES | 2022-13-CP | Jan 2023 Facility Capacity Assessment Template
Facility Name:
Fenelon Falls Water Treatment Plant
Address:
99 Francis St W, Fenelon Falls, ON K0M 1N0
Water Demand in the Past Five Years 4,100 4,000
3,500
3,000
m3/d
2,500
2,000 1,693
1,619 1,376
1,500
1,000
DWS Number Permit to Take Water Capacity UV Max Flow Rate
#: 5830-AQFGZR 4,100 m3/d 4,100 m3/d (47.45 L/s) 47.45 L/s
1,225 771
709
2017
2018
798
728
2019
2020
1,267 823
500
0 2021
Year
Annual Reports ADF Capacity 2021 2020 2019 2018 2017
823 728 798 709 771
1.88 1.54 1.68 2.12 1.94 2.10
Max Day 4,100 1,267 1,225 1,693 1,376 1,619
% of Capacity 100% 31% 30% 41% 34% 39%
Unit
m3/d m3/d m3/d m3/d m3/d
Max Daily Demand
Treatment Chemical Sodium Hypochloride Polyalumunium
Plant Design Capacity
Average Daily Demand
Use Disinfection Flocculation
Concentration Exceedance (Limit) 2021 2020 2019 2018 2017
Incidents There were exceedances in instantaneous peak flow rate (L/s). THMs and HAA over limit slightly THMs and HAA over limit THMs over limit THMs over limit
Comments Spikes were< 1minute and occurred when filters were being filled after inspection/cleaning. The use of Chlorine The use of Chlorine The use of Chlorine The use of Chlorine
WATER AND WASTEWATER SERVICING AND CAPACITY MASTER PLAN UPDATE CITY OF KAWARTHA LAKES | 2022-13-CP | Jan 2023 Facility Capacity Assessment Template
Facility Name:
Manorview Water Treatment Plant
Plant Flow in the Past Five Years
DWS PTTW Number PTTW Expire Date DWS Number DWS Renewal Date Permit to Take Water Capacity
1163-AYRJ36 31-May-28 141-218 10-May-26 300.96 m3/d 302 m3/d
350 302 300
250
Annual Reports ADF Capacity 2021 2020 2019 2018 2017
19 19 19 19 17
2.64 2.13 3.62 2.55 2.42 2.48
Max Day 302 40 67 49 47 43
% of Capacity
Unit
13% 22% 16% 16% 14%
m3/d m3/d m3/d m3/d m3/d
m3/d
200
150
100 67 50
0
Treatment Chemical Sodium Hypochloride
Use Disinfection
43
47
49
17
19
19
19
19
2017
2018
2019
2020
2021
Year Average Daily Demand
2021 2020 2019 2018 2017
40
Incidents N/A N/A N/A N/A N/A
Plant Design Capacity
Comments
Max Daily Demand
WATER AND WASTEWATER SERVICING AND CAPACITY MASTER PLAN UPDATE CITY OF KAWARTHA LAKES | 2022-13-CP | Jan 2023 Facility Capacity Assessment Template
Facility Name:
Woodfield Water Treatment Plant
Plant Flow in the Past Five Years
DWS PTTW Number PTTW Expire Date DWS Number DWS Renewal Date Permit to Take Water Capacity
1207-AHKRXV
588
600 550
141-115
500
589.1 m3/d 588 m3/d
450
Annual Reports Capacity 2021 2020 2019 2018 2017
ADF 588 161 155 182 174 191
Max Day Factor 1.90 1.93 2.08 1.75 1.91 1.82
Max Day
% of Capacity
Unit
311 322 319 333 349
53% 55% 54% 57% 59%
m3/d m3/d m3/d m3/d m3/d
m3/d
400 349 350
333
319
322
311
300 250 200
191 174
182 155
161
2020
2021
150 100
Treatment Chemical Sodium Hypochloride
2017
Use Disinfection
2019
Year Max Daily Demand
2021 2020 2019 2018 2017
2018
Incidents N/A N/A N/A N/A N/A
Plant Design Capacity
Comments
Average Daily Demand
WATER AND WASTEWATER SERVICING AND CAPACITY MASTER PLAN UPDATE CITY OF KAWARTHA LAKES | 2022-13-CP |Jan 2023 Facility Capacity Assessment Template
Facility Name:
DWS Number Permit to Take Water Capacity
7147-9Y7HWV 491 m3/d 360 m3/d
Birch Point Water Treatment Plant
Water Demand in the Past Five Years 360
350
Annual Reports Capacity 2021 2020 2019 2018 2017
83 82 61 60 94
1.75 1.61 1.85 1.63 1.97 1.70
Max Day 360 133 152 100 119 159
% of Capacity 100% 51% 58% 38% 46% 61%
Unit
300
m3/d m3/d m3/d m3/d m3/d
250
m3/d
ADF
200 159
152 133
150 119
Comments Rated capacity in MDWL doesn't match with the capacity in annual report
100
100
94 60
61
2018
2019
82
83
2020
2021
50
0 2017
Year Average Daily Demand
Plant Design Capacity
Concentration Exceedance (Limit) 2021 2020 2019 2018 2017
Incidents N/A N/A N/A N/A N/A
Comments
Max Daily Demand
WATER AND WASTEWATER SERVICING AND CAPACITY MASTER PLAN UPDATE CITY OF KAWARTHA LAKES | 2022-13-CP | Jan 2023 Facility Capacity Assessment Template
Facility Name:
Western Trent Palmina Water Treatment Plant
Plant Flow in the Past Five Years
DWS PTTW Number PTTW Expire Date DWS Number DWS Renewal Date Permit to Take Water Capacity
2180-B4CKK3 31-Aug-28 141-202 11-Jan-26 293.76 m3/d 331 m3/d
294
300
250 206 200
Annual Reports Capacity 2021 2020 2019 2018 2017
ADF 294 71 71 66 69 62
Max Day Factor 2.35 1.97 2.41 2.19 3.00 2.19
Max Day
% of Capacity
Unit
140 170 144 206 135
48% 58% 49% 70% 46%
m3/d m3/d m3/d m3/d m3/d
m3/d
170 150
144
135
140
100 62
69
66
71
71
2018
2019
2020
2021
50
0
Treatment Chemical Sodium Hypochloride
2017
Use Disinfection
Year Max Daily Demand
2021 2020 2019 2018 2017
Incidents N/A N/A N/A N/A N/A
Plant Design Capacity
Comments
Average Daily Demand
WATER AND WASTEWATER SERVICING AND CAPACITY MASTER PLAN UPDATE CITY OF KAWARTHA LAKES | 2022-13-CP | Jan 2023 Facility Capacity Assessment Template
Facility Name:
Canadiana Shores Water Treatment Plant
Plant Flow in the Past Five Years
DWS Number Permit to Take Water Capacity
984
1452-AWDLEX 683 m3/d 984 m3/d
1,000 900 800 700
Annual Reports % of Capacity 2.03 1.74 1.78 1.88 3.11 1.63
Max Day 984 254 268 217 330 154
% of Capacity 100% 26% 27% 22% 34% 16%
Unit
m3/d m3/d m3/d m3/d m3/d
600
m3/d
Capacity 2021 2020 2019 2018 2017
ADF 984 146 151 116 106 94
500 400
330
300 200
268
254
217 154
100 94
106
116
151
146
2017
2018
2019
2020
2021
0
Year Average Daily Demand
Plant Design Capacity
Concentration Exceedance (Limit) 2021 2020 2019 2018 2017
Incidents N/A N/A N/A N/A N/A
Comments
Max Daily Demand
WATER AND WASTEWATER SERVICING AND CAPACITY MASTER PLAN UPDATE CITY OF KAWARTHA LAKES | 2022-13-CP | Jan 2023 Facility Capacity Assessment Template
Facility Name:
Janetville Water Treatment Plant
Plant Flow in the Past Five Years
DWS PTTW Number Permit to Take Water Capacity
1452-AWDLEX 449 m3/d 449 m3/d
500 449 450 400 350
Annual Reports % of Capacity 2.82 2.96 2.98 3.33 3.11 1.73
Max Day
235 223 234 207 113
% of Capacity
52% 50% 52% 46% 25%
Unit
m3/d m3/d m3/d m3/d m3/d
300
m3/d
Capacity 2021 2020 2019 2018 2017
ADF 449 79 75 70 66 65
234
250 207
223
235
200 150 100
113 65
66
70
75
79
2017
2018
2019
2020
2021
50
Treatment Chemical Sodium Hypochloride Sodium Silicate
Use Disinfection Iron Sequestering
0
Year Max Daily Demand
Plant Design Capacity
Concentration Exceedance (Limit) 2021 2020 2019 2018 2017
Incidents N/A N/A N/A N/A N/A
Comments
Average Daily Demand
WATER AND WASTEWATER SERVICING AND CAPACITY MASTER PLAN UPDATE CITY OF KAWARTHA LAKES | 2022-13-CP | Jan 2023 Facility Capacity Assessment Template
Facility Name:
King's Bay Water Treatment Plant
Plant Flow in the Past Five Years
DWS PTTW Number PTTW Expire Date PTTW Number DWS Renewal Date Permit to Take Water Capacity
1087-AYSGRN 31-May-28 141-219 10-May-26 409 m3/d 409 m3/d
500 450 409 400 350
Annual Reports Capacity 2021 2020 2019 2018 2017 Treatment Chemical Sodium Hypochloride
ADF 409 56 52 44 51 45
% of Capacity 275% 4.19 3.38 2.24 2.16 1.80
Max Day
% of Capacity
Unit
m3/d
300 235
250 200
235 175 98 111 81
Use Disinfection
57% 43% 24% 27% 20%
m3/d m3/d m3/d m3/d m3/d
175
150 111 100
98
81 45
51
44
52
56
2017
2018
2019
2020
2021
50 0
Year Max Daily Demand
Plant Design Capacity
Concentration Exceedance (Limit) 2021 2020 2019 2018 2017
Incidents N/A N/A N/A N/A N/A
Comments
Average Daily Demand
WATER AND WASTEWATER SERVICING AND CAPACITY MASTER PLAN UPDATE CITY OF KAWARTHA LAKES | 2022-13-CP | Jan 2023 Facility Capacity Assessment Template
Facility Name:
Plant Flow in the Past Five Years
DWS PTTW Number PTTW Expire Date DWS Number DWS Renewal Date Permit to Take Water Capacity
2447-AWDJEA 28-Feb-28 141-121 10-May-26 340 m3/d 340 m3/d
340
350
300
250
Annual Reports
200
ADF 340 19 19 19 27 27
% of Capacity 3.75 2.83 3.02 4.54 5.80 2.55
Max Day
54 58 88 159 70
% of Capacity
16% 17% 26% 47% 21%
Unit
m3/d m3/d m3/d m3/d m3/d
m3/d
Capacity 2021 2020 2019 2018 2017
Kinmount Water Treatment Plant
159 150
100 70 50
Treatment Chemical Sodium Hypochloride Polyalumunium Chloride Polymer Sodium Hydroxide
Use Disinfection Flocculation Flocculation PH Adjustment
88
27
27
2017
2018
58
54
19
19
19
2019
2020
2021
0
Year Max Daily Demand
Plant Design Capacity
Concentration Exceedance (Limit) 2021 2020 2019 2018 2017
Incidents HAA Exceed limit THMs & HAA Eceed limits N/A N/A N/A
Comments
Flushing Chlorine disinfection side product
Average Daily Demand
WATER AND WASTEWATER SERVICING AND CAPACITY MASTER PLAN UPDATE CITY OF KAWARTHA LAKES | 2022-13-CP | Jan 2023 Facility Capacity Assessment Template
Facility Name:
Manilla Water Treatment Plant
Plant Flow in the Past Five Years
DWS PTTW Number PTTW Expire Date DWS Number DWS Renewal Date Permit to Take Water Capacity
2660-C7KSBJ 12-Oct-31 141-106 11-Jan-26 229 m3/d 157 m3/d
157
160 140 120 100
86
Annual Reports ADF Capacity 2021 2020 2019 2018 2017
35 38 36 31 32
% of Capacity 2.14 1.82 2.27 2.07 2.71 1.84
Max Day 157 64 86 74 84 60
% of Capacity
Unit
m3/d
84 80
74 64
60 60
41% 55% 47% 54% 38%
m3/d m3/d m3/d m3/d m3/d
40
32
31
2017
2018
36
38
35
2019
2020
2021
20 0
Treatment Chemical Sodium Hypochloride
Use Disinfection
Year Max Daily Demand
Plant Design Capacity
Concentration Exceedance (Limit) 2021 2020 2019 2018 2017
Incidents N/A N/A N/A N/A N/A
Comments
Average Daily Demand
WATER AND WASTEWATER SERVICING AND CAPACITY MASTER PLAN UPDATE CITY OF KAWARTHA LAKES | 2022-13-CP | Jan 2023 Facility Capacity Assessment Template
Facility Name:
Mariposa Water Treatment Plant
Plant Flow in the Past Five Years
DWS PTTW Number PTTW Expire Date DWS Number DWS Renewal Date Permit to Take Water Capacity
8473-AZUGSX 30-Jun-28 141-117 10-May-26 72 m3/d 72 m3/d
80
78
72
70 67 60 55
53
52
Annual Reports Capacity 2021 2020 2019 2018 2017
ADF 72 29 28 25 24 38
% of Capacity 2.12 1.90 2.40 2.04 2.22 2.04
Max Day
% of Capacity
Unit
m3/d
50 40 30
55 67 52 53 78
76% 93% 72% 74% 108%
m3/d m3/d m3/d m3/d m3/d
20
38
10
24
25
28
29
2018
2019
2020
2021
0
Treatment Chemical Sodium Hypochloride
2017
Use Disinfection
Year Average Daily Demand
2021 2020 2019 2018 2017
Incidents N/A N/A N/A N/A N/A
Plant Design Capacity
Comments
Max Daily Demand
WATER AND WASTEWATER SERVICING AND CAPACITY MASTER PLAN UPDATE CITY OF KAWARTHA LAKES | 2022-13-CP | Jan 2023 Facility Capacity Assessment Template
Facility Name:
Norland Water Treatment Plant
Plant Flow in the Past Five Years
DWS PTTW Number PTTW Expire Date DWS Number DWS Renewal Date Permit to Take Water Capacity
6033-AQ5HFW 31-Aug-27 141-103 11-Jan-26 300 m3/d 264 m3/d
300 264 250
200
182
186
185
Annual Reports ADF Capacity 2021 2020 2019 2018 2017
69 107 96 85 76
Treatment Chemical Sodium Hypochloride Polyalumunium Chloride Polymer Sodium Hydroxide
2021 2020 2019 2018 2017
Max Day Factor 2.00 2.33 1.73 1.93 2.14 1.87
Max Day 264 160 185 186 182 142
Use Disinfection Flocculation Flocculation PH Adjustment
% of Capacity
Unit
m3/d
160 150
142 107
61% 70% 70% 69% 54%
m3/d m3/d m3/d m3/d m3/d
96 100
76
85 69
50
0 2017
2018
2019
2020
Year Max Daily Demand
Incidents N/A N/A N/A N/A N/A
Plant Design Capacity
Comments
Average Daily Demand
2021
WATER AND WASTEWATER SERVICING AND CAPACITY MASTER PLAN UPDATE CITY OF KAWARTHA LAKES | 2022-13-CP | Jan 2023 Facility Capacity Assessment Template
Facility Name:
Omemee Water Treatment Plant
Address:
16 Shawn Ave, Omemee, ON K0L 2W0
Plant Flow in the Past Five Years 461 450 400 350
m3/d
300 250 200 150
DWS Number Permit to Take Water Capacity
100
#: 8160-B3MP6L 461 m3/d 461 m3/d
50
82
76
37
33
34
35
34
2017
2018
2019
2020
2021
Year
ADF 461 34 35 34 33 37
Max Day
2.33 2.24 2.62 2.25 2.46 2.10
76 92 76 82 78
% of Capacity
16% 20% 16% 18% 17%
Unit
m3/d m3/d m3/d m3/d m3/d
Max Daily Demand
Plant Design Capacity
Treatment Chemical Sodium Hypochloride Sodium Silicate
Use Disinfection Iron Sequestering
Concentration Exceedance (Limit) 2021 2020 2019 2018 2017
Incidents N/A March Intake more than Max Allowable (3.99L/s vs 3.03L/s ) N/A N/A N/A
76
0
Annual Reports Capacity 2021 2020 2019 2018 2017
92
78
Comments
Average Daily Demand
WATER AND WASTEWATER SERVICING AND CAPACITY MASTER PLAN UPDATE CITY OF KAWARTHA LAKES | 2022-13-CP | Jan 2023 Facility Capacity Assessment Template
Facility Name:
Pleasant Point Water Treatment Plant
Plant Flow in the Past Five Years
DWS PTTW Number PTTW Expire Date DWS Number DWS Renewal Date Permit to Take Water Capacity
5087-9ZQJJU 31-Jul-25 141-113 21-Mar-26 454.6 m3/d 490 m3/d
490
500 450 400 350
m3/d
300
Annual Reports ADF Capacity 2021 2020 2019 2018 2017 Treatment Chemical Sodium Hypochloride
49 47 42 46 45
2.13 2.32 3.10 1.75 1.78 1.72
Max Day 490 113 145 74 81 77
% of Capacity
23% 30% 15% 17% 16%
Unit
m3/d m3/d m3/d m3/d m3/d
250 200 145
150 100
113 77 45
81 46
74 42
47
49
2017
2018
2019
2020
2021
50 0
Year
Use Disinfection Max Daily Demand
2021 2020 2019 2018 2017
Incidents N/A N/A N/A N/A N/A
Plant Design Capacity
Comments
Average Daily Demand
WATER AND WASTEWATER SERVICING AND CAPACITY MASTER PLAN UPDATE CITY OF KAWARTHA LAKES | 2022-13-CP | Jan 2023 Facility Capacity Assessment Template
Facility Name:
Plant Flow in the Past Five Years
DWS PTTW Number PTTW Expire Date DWS Number DWS Renewal Date Permit to Take Water Capacity
590
7473-BBTPTY 3-May-29 141-110 21-Mar-26 587.52 m3/d 590 m3/d
600
500
m3/d
400
Annual Reports ADF Capacity 2021 2020 2019 2018 2017
Pinewood Water Treatment Plant
159 137 138 111 124
Max Day Factor 1.72 1.72 1.54 1.64 1.75 1.93
Max Day 590 274 211 227 195 239
% of Capacity
300
274 239
Unit
195
200
46% 36% 38% 33% 41%
m3/d m3/d m3/d m3/d m3/d
124
159
138
137
2019
2020
111
0 2018
Year
Use Disinfection Max Daily Demand
2021 2020 2019 2018 2017
211
100
2017
Treatment Chemical Sodium Hypochloride
227
Incidents N/A N/A N/A N/A N/A
Plant Design Capacity
Comments
Average Daily Demand
2021
WATER AND WASTEWATER SERVICING AND CAPACITY MASTER PLAN UPDATE CITY OF KAWARTHA LAKES | 2022-13-CP | Jan 2023 Facility Capacity Assessment Template
Facility Name:
Sonya Water Treatment Plant
Plant Flow in the Past Five Years
DWS PTTW Number PTTW Expire Date DWS Number DWS Renewal Date Permit to Take Water Capacity
170
1246-AWTJXZ 31-Mar-28 141-107 11-Jan-26 170 m3/d 170 m3/d
160 140 120
m3/d
100
Annual Reports ADF Capacity 2021 2020 2019 2018 2017 Treatment Chemical Sodium Hypochloride Sodium Silicate
2021 2020 2019 2018 2017
26 28 22 28 26
Max Day Factor 2.47 2.68 2.83 2.14 2.79 1.91
Max Day 170 69 78 48 77 50
% of Capacity
69
Unit 60
40% 46% 28% 45% 29%
78
77
80
m3/d m3/d m3/d m3/d m3/d
40
50
48
26
28
2017
2018
22
28
26
2020
2021
20 0 2019
Year
Use Disinfection Iron Sequestering
Max Daily Demand
Incidents N/A N/A N/A N/A N/A
Plant Design Capacity
Comments
Average Daily Demand
WATER AND WASTEWATER SERVICING AND CAPACITY MASTER PLAN UPDATE CITY OF KAWARTHA LAKES | 2022-13-CP | Jan 2023 Facility Capacity Assessment Template
Facility Name:
Southview Water Treatment Plant
Plant Flow in the Past Five Years
DWS PTTW Number PTTW Expire Date DWS Number DWS Renewal Date Permit to Take Water Capacity
8118-AW2NZT 28-Feb-28 141-101 11-Jan-26 483.84 m3/d 484 m3/d
484
500 450 400 350
Annual Reports Capacity 2021 2020 2019 2018 2017
ADF 484 48 49 43 47 44
Max Day Factor 2.43 2.36 2.91 2.11 2.45 2.32
Max Day
% of Capacity
Unit
113 143 91 116 103
23% 30% 19% 24% 21%
m3/d m3/d m3/d m3/d m3/d
m3/d
300 250 200 143
150 103
116
113 91
100 44
47
43
49
48
2017
2018
2019
2020
2021
50 0
Treatment Chemical Sodium Hypochloride StermPAC Magnafloc
2021 2020 2019 2018 2017
Use Disinfection Coagulant Coagulant Aid
Incidents EC and TC exceed Limits, THMs exceed limit N/A THMs exceed limit N/A N/A
Year Max Daily Demand
Plant Design Capacity
Comments
Average Daily Demand
WATER AND WASTEWATER SERVICING AND CAPACITY MASTER PLAN UPDATE CITY OF KAWARTHA LAKES | 2022-13-CP | Jan 2023 Facility Capacity Assessment Template
Facility Name:
Victoria Place Water Treatment Plant
Plant Flow in the Past Five Years
DWS PTTW Number PTTW Expire Date DWS Number DWS Renewal Date Permit to Take Water Capacity
5275-AY5Q6S 22-Apr-28 141-214 21-Mar-26 331.2 m3/d 331 m3/d
350
331 298
300
274
250
222 210 198
Annual Reports Capacity 2021 2020 2019 2018 2017
1.32 1.34 1.27 1.43 1.34 1.22
Max Day
% of Capacity
Unit
298 266 274 198 153
90% 80% 83% 60% 46%
m3/d m3/d m3/d m3/d m3/d
m3/d
200
ADF 331 222 210 191 148 126
266
153 150
191
148
126
100
50
0
Treatment Chemical Sodium Hypochloride
2017
Use Disinfection
2019
2020
Year Max Daily Demand
2021 2020 2019 2018 2017
2018
Incidents N/A N/A N/A N/A N/A
Plant Design Capacity
Comments
Average Daily Demand
2021
WATER AND WASTEWATER SERVICING AND CAPACITY MASTER PLAN UPDATE CITY OF KAWARTHA LAKES | 2022-13-CP | Jan 2023 Facility Capacity Assessment Template
Facility Name:
Woodville Water Treatment Plant
Plant Flow in the Past Five Years
DWS PTTW Number PTTW Expire Date DWS Number DWS Renewal Date Permit to Take Water Capacity
1207-AHKRXV
600
141-115 30-Apr-21 598.2 m3/d 588 m3/d
588
500
400
Annual Reports Capacity 2021 2020 2019 2018 2017
ADF 588 161 155 182 174 191
1.93 2.08 1.75 1.91 1.83
Max Day
% of Capacity
Unit
311 322 319 333 349
53% 55% 54% 57% 59%
m3/d m3/d m3/d m3/d m3/d
m3/d
349
333
322
319
311
300
200
191
174
182 155
161
100
0
Treatment Chemical Sodium Hypochloride Sodium Silicate
2017
Use Disinfection Iron Sequestering
2018
2020
Year Max Day Demand
2021 2020 2019 2018 2017
2019
Incidents N/A N/A N/A N/A N/A
Plant Design Capacity
Comments
Average Daily Flow
2021
WATER AND WASTEWATER SERVICING AND CAPACITY MASTER PLAN UPDATE CITY OF KAWARTHA LAKES | 2022-13-CP | Jan 2023 Facility Capacity Assessment Template
Facility Name:
Lindsay Wastewater Treatment Plant
Address:
48 Lagoon Street, Lindsay City of Kawartha Lakes, Ontario K9V 4R3
Plant Flow in the Past Five Years 26,000 24,500
Process Headworks ECA Aeration Process Processes Secondary Clarifiers Capacity Actiflo Tertiary UV
#: 1696-BPLL4R 24,500 m3/d Capacity 24,500 m3/d 24,500 m3/d 24,500 m3/d 24,500 m3/d 24,500 m3/d
24,000
22,000
20,000
m3/d
ECA Number Rated Capacity
18,000 16,140 16,000 14,644
Phase 1 Capacity 2021 2020 2019 2018 2017
13,646
14,000
Annual Reports Average 24,500 12,110 13,576 13,646 14,644 16,140
% of Capacity 100% 49% 55% 56% 60% 66%
Max Day 30,100 25,604 30,364 26,346 31,542 30,842
Design Basis Loadings Parameter Average Maximum Average 2306.96 BOD5 (kg/d) 3292 10535 3534.91 TSS (kg/d) 5826 24549 224.04 TKN (kg/d) 507 943 TP (kg/d) 60 116 43.84 Note: 1. The loading capacity is caculated based on Average Loading.
Peak Inst. 30,100 \ \ \ \ \
Unit m3/d m3/d m3/d m3/d m3/d m3/d
2021 Maximum 5074.09 6079.22 501.35 124.73
Bypasses [Yes/No] No No No No No
Overflow [Yes/No] No No No No No
Average 2013.32 3632.94 250.88 38.01
2020 Maximum 3787.70 5715.50 433.07 67.88
13,576 12,110
12,000
10,000 2017
2018
2019
2020
2021
Year Average Plant Flow
Capacity 61% 62% 49% 63%
Average 2328.01 3807.23 321.23 47.76
2019 Maximum 5567.57 15419.98 608.61 146.01
Capacity 71% 65% 63% 80%
Plant Design Capacity
2018 Average Maximum Capacity 2164.38 6004.04 66% 3324.19 8932.84 57% 286.14 528.65 56% 33.83 89.33 56%
2017 Average Maximum Capacity 2548.51 N/A 77% 3723.50 N/A 64% 305.05 N/A 60% 37.77 N/A 63%
Concentration Exceedance (Limit) 2021 2020 2019 2018 2017
2021
April - 133% Feb - 192% Sep - 932% May - 260% June - 176%
May - 539% Sep - 139%
June - 1314%
TAN Exceedance July - 667% Aug - 1004% Sep - 1035% Oct - 1396%
June - 775% July - 198%
July - 725% Sep - 805%
Aug - 468% Sep - 608% Nov - 178%
June - 215%
TP Exceedance May - 539%
Oct - 325%
Oct - 122%
Nov - 362%
2021 2020 2019 2018 2017
TSS Exceedance June - 215% All Year Over Limit All Year Over Limit Aug - 140% No
PH Exceedance No No No No No
E.coli Exceedance No No No No No
TAN Objective 2022 2021 2020 2019 2018 2017
Jan 3 1.7 1.1 0.98 0.64 2.12 0.14
Feb 3 3.25 2.58 5.75 0.62 2.45 0.25
Mar 3 5.13 1.9 1.08 1.95 1.38 0.1
Apr 3 9.28 4 1.63 0.8 1.2 0.22
May 1.5 11.76 8.08 0.82 0.46 3.9 0.48
Jun 1.5 14.23 19.74 1.38 0.88 11.62 2.65
Jul Aug Sep Oct Nov Dec Comments 1.5 1.5 1.5 3 3 3 1.16 1.1 0.1 18 17.42 11.43 Repeated of mechanical aerators caused 10 failures15.06 15.52 14.9 significant 10.86 impediments 0.82 to TAN removal. The loss of aerators affected the dissolved oxygen levels i Aerator Failure 0.99 1 2.08 1.64 0.92 1.28 An aerator cable failure 1.3 0.44 13.98 1.29 0.25 0.4 10.88 7.02 9.12 3.66 0.28 0.62 2.97 1.22 12.07 3.03 5.35 2.08
TP Objective 2022 2021 2020 2019 2018 2017
Jan 0.2 0.12 0.1 0.05 0.07 0.04 0.05
Feb 0.2 0.11 0.1 0.08 0.07 0.06 0.07
Mar 0.2 0.07 0.08 0.05 0.12 0.05 0.08
Apr 0.2 0.05 0.07 0.07 0.11 0.06 0.05
May 0.2 0.07 0.07 0.07 0.06 0.09 0.06
Jun 0.2 0.06 0.42 0.07 0.08 0.1 0.06
Jul 0.2 0.04 0.13 0.11 0.04 0.07 0.06
Aug 0.2 0.05 0.38 0.08 0.07 0.12 0.07
Sep 0.2 0.05 0.11 0.13 0.2 0.12 0.09
Oct 0.2 0.04 0.66 0.12 0.09 0.05 0.06
Nov 0.2 0.13 0.17 0.05 0.08 0.04 0.08
Dec 0.2 0.06 0.11 0.06 0.1 0.06 0.06
TSS Objective 2022 2021 2020 2019 2018 2017
Jan 7.4 11.6 12 9.2 8.4 3.2 5.2
Feb 7.4 10 10.8 8.8 8.5 4.3 7
Mar 7.4 7 9.4 9.8 10.3 8.4 6.25
Apr 7.4 8.75 11.8 8.1 10.3 4.8 5
May 7.4 8.2 13.3 7.5 11.6 9.4 4.4
Jun 7.4 6.5 33.2 6.4 12 10 5.5
Jul 7.4 6.75 10.4 10.1 7.9 10.2 4.43
Aug 7.4 5.6 45.6 9.6 7.8 15.5 3.08
Sep 7.4 7.5 16 9.3 13.5 9 5.43
Oct 7.4 5.6 43 11.9 9.9 6.6 5
Nov 7.4 10 11 7.8 8.5 7.5 6
Dec 7.4 8.25 9.2 10.4 12 9.3 3.5
Comments
failures of mechanical aerators
Comments
failures of mechanical aerators failures of mechanical aerators failures of mechanical aerators Actiflo Failure
WATER AND WASTEWATER SERVICING AND CAPACITY MASTER PLAN UPDATE CITY OF KAWARTHA LAKES | 2022-13-CP | Jan 2023 Facility Capacity Assessment Template
Facility Name:
Bobcaygeon Wastewater Treatment Plant
Address:
127 Boyd St, Bobcaygeon, ON K0M 1A0 ECA Number Rated Capacity
#: 3028-AEUKDQ 3,055 m3/d
Process ECA Processes Headworks Capacity Aeration Process Secondary Clarifiers UV
Capacity
Plant Flow in the Past Five Years 3,170 3,055 2,900
3,000
2,548 2,500
2,340
2,327
2020
2021
m3/d
2,000
Annual Reports Capacity 2021 2020 2019 2018 2017
Average 3,055 2,327 2,340 2,548 2,900 3,170
Capacity 100% 76% 77% 83% 95% 104%
Max Day
4,594 6,055 5,137 5,542 6,270
Peak Inst. 10,440 \ \ \ \ \
Unit m3/d m3/d m3/d m3/d m3/d m3/d
Bypasses [Yes/No] No Yes No No No
Overflow [Yes/No] No No No No No
Concentration Exceedance (Limit) 2021 2020 2019 2018 2017
Sludge Production 9,380 8,179 6,733 6,795 4,603
Unit m3 m3 m3 m3 m3 m3
1,500
1,000
500
0 2017
COD5 Over Limit, 112% (27.9 vs 25) in December, Odour issue Excess I&I flow is coming into the collection system TSS Exceedance 329% in January, TP Exceedance in January, E.coli Exceedance 309% in April TSS Exceedance 112% in March, TP Exceedance 151% in March, E.coli Exceedance 309% in April
2018
2019
Year Average Plant Flow
Plant Design Capacity
WATER AND WASTEWATER SERVICING AND CAPACITY MASTER PLAN UPDATE CITY OF KAWARTHA LAKES | 2022-13-CP | Jan 2023 Facility Capacity Assessment Template
Facility Name:
Fenelon Falls Wastewater Treatment Plant
Address:
174 Ellice St, Fenelon Falls, ON K0M 1N0
Plant Flow in the Past Five Years 2,000 1,800 1,800
ECA Processes Capacity
Process Headworks Aeration Process Secondary Clarifiers Sand Filter UV
1,600
: 3688-BW3RGB 1,800 m3/d Capacity
1,400
1,297 1,119
1,200
m3/d
ECA Number Rated Capacity
1,137 1,060
1,084
2020
2021
1,000 800 600 400
Annual Reports Capacity 2021 2020 2019 2018 2017
Average 1,800 1,084 1,060 1,137 1,119 1,297
Capacity 100% 60% 59% 63% 62% 72%
Max Day
Peak Inst.
4,149 4,072
\ \ \ \ \
Design Basis Loadings 2021 Parameter Average Maximum Average Maximum 325.21 682.93 BOD5 (kg/d) 246.07 453.12 TSS (kg/d) 32.52 69.38 TKN (kg/d) TP (kg/d) 5.84 14.85 Note: 1. The loading capacity is caculated based on Average Loading.
2021 2020 2019 2018 2017
Unit m3/d m3/d m3/d m3/d m3/d m3/d
Capacity #DIV/0! #DIV/0! #DIV/0! #DIV/0!
Bypasses [Yes/No] Yes Yes No Yes No
Overflow [Yes/No] No Yes No No No
Average 140.93 123.97 18.44 2.19
2020 Maximum 208.74 161.06 23.52 4.14
Concentration Exceedance (Limit) TP Exceedance in September - 130%, wet weather bypasses Sewer backup, toilet explode, wet weather bypasses Sewer backup, Sewer odour Tertiary Filter Bypassing Tertiary Filter Bypassing
200 0 2017
2018
2019
Year Average Plant Flow
Capacity #DIV/0! #DIV/0! #DIV/0! #DIV/0!
Average 155.77 155.77 21.49 2.24
2019 Maximum
Capacity #DIV/0! #DIV/0! #DIV/0! #DIV/0!
Average 133.11 140.94 20.47 2.30
2018 Maximum
Plant Design Capacity
Capacity #DIV/0! #DIV/0! #DIV/0! #DIV/0!
2017 Average Maximum Capacity 67.44 #DIV/0! 204.80 #DIV/0! 12.19 #DIV/0! 2.59 #DIV/0!
WATER AND WASTEWATER SERVICING AND CAPACITY MASTER PLAN UPDATE CITY OF KAWARTHA LAKES | 2022-13-CP | Jan 2023 Facility Capacity Assessment Template
Facility Name:
Omemee Wastewater Treatment Plant
Address:
267 Beaver Rd, Harcourt, ON K0L 2W0
Plant Flow in the Past Five Years 1,353
1,400 1,300 1,200 1,100
m3/d
1,000 900 788 800 700 600
533
543
560
2020
2021
497 500
ECA Number Rated Capacity ECA Processes Capacity
400
Process Lagoon Capacity
#: 2737-B4DH46 1,353 m3/d Capacity 1,353 m3/d
2017
2018
2019
Year Average Plant Flow
Plant Design Capacity
Annual Reports Phase 1 Capacity 2021 2020 2019 2018 2017
Average 1,353 560 543 497 533 788
% of Capacity 100% 41% 40% 37% 39% 58%
Max Day
Unit
2,580 2,629 1,748 4,773 5,012
m3/d m3/d m3/d m3/d m3/d
Design Basis Loadings 2021 Average Maximum Parameter Average Capacity 72.96 #DIV/0! BOD5 (kg/d) 109.46 #DIV/0! TSS (kg/d) 14.12 #DIV/0! TKN (kg/d) TP (kg/d) 1.65 #DIV/0! Note: 1. The loading capacity is caculated based on Average Loading.
Bypasses [Yes/No] No No No No No
Overflow [Yes/No] No No No No No
Concentration Exceedance (Limit) 2021 TSS Exceedance slightly 2020 2019 Nitrite and Nitrate as Nitrogen Exceedance in November 2018 2017
2020
Average 66.47 66.97 11.48 1.69
2019
Capacity #DIV/0! #DIV/0! #DIV/0! #DIV/0!
Average 58.36 69.04 10.53 1.11
2018
Capacity #DIV/0! #DIV/0! #DIV/0! #DIV/0!
Average 83.78 142.55 14.98 1.86
2017
Capacity #DIV/0! #DIV/0! #DIV/0! #DIV/0!
Average 92.26 132.98 14.30 1.65
Capacity #DIV/0! #DIV/0! #DIV/0! #DIV/0!
WATER AND WASTEWATER SERVICING AND CAPACITY MASTER PLAN UPDATE CITY OF KAWARTHA LAKES | 2022-13-CP | Jan 2023 Facility Capacity Assessment Template
Facility Name:
King's Bay Wastewater Treatment Plant
ECA Number Rated Capacity
ECA Processes Capacity
Process Influent SPS Rotating Biological Secondary Clarifier Effluent SPS
Plant Flow in the Past Five Years
#: 7037-A77JLP 170 m3/d Capacity \ \ \ \
200 180
170
160 140
Annual Reports Average 170 43 46 44 48 50
% of Capacity 100% 3% 3% 3% 4% 4%
Max Day 666 46 60 62 65 \
Unit m3/d m3/d m3/d m3/d m3/d m3/d
Bypasses [Yes/No] No No No No No
Overflow [Yes/No] No No No No No
m3/d
Phase 1 Capacity 2021 2020 2019 2018 2017
120 100 80 60
50
48
44
46
43
2019
2020
2021
40 20
Concentration Exceedance (Limit) TSS Exceedance (20%) 2021 TSS Exceedance (33%) 2020 TSS Exceedance (33%) 2019 TSS Exceedance (127%), CBOD5 Exceedance (53%) 2018 TSS Exceedance (20%), CBOD5 Exceedance (12%) 2017
0 2017
2018
Year Average Plant Flow
Plant Design Capacity
WATER AND WASTEWATER SERVICING AND CAPACITY MASTER PLAN UPDATE CITY OF KAWARTHA LAKES | 2022-13-CP | Jan 2023 Facility Capacity Assessment Template
Facility Name:
Coboconk Wastewater Treatment Plant
Discharge Window Spring Discharge April 1st - May 31st Fall Discharge November 1st - December 31st
Plant Flow in the Past Five Years 500
450
ECA Number Rated Capacity ECA Processes Capacity
Process Lagoon Capacity
421
400
#: 9527-AHVRDY 421 m3/d Capacity 421 m3/d
350
m3/d
300
Annual Reports Capacity 2021 2020 2019 2018 2017
Average 421 210 251 275 219 227
% of Capacity 100% 50% 60% 65% 52% 54%
Max Day
369 645 \ 729 750
Unit m3/d m3/d m3/d m3/d m3/d m3/d
Bypasses [Yes/No] No No No No No
Overflow [Yes/No] No No No YES No
275 251
250
227
219
210
200
150
100
50
Incident/Complaint Odour - City responsed and reacted 2021 Odour - By site activities, city responsed and reacted 2020 2019 Overflow - SPS leaking 2018 2017
0 2017
2018
2019
2020
Year Average Plant Flow
Plant Design Capacity
2021
Technical Memorandum 5
Kawartha Lakes Water-Wastewater Master Plan Servicing Needs Assessment by Community January 2025 | CKL Contract 2022-13-CP | TYLin Project 10599 City of Kawartha Lakes
Technical Memorandum 5 Kawartha Lakes Water-Wastewater Master Plan Capacity Assessment
TABLE OF CONTENTS 1 INTRODUCTION ........................................................................................................... 1 2 BASIS FOR SERVICING NEEDS ASSESSMENT ............................................................ 2 2.1 Planning Data .................................................................................................... 2 2.2 Water and Wastewater Design Criteria .......................................................... 2 2.2.1 Peaking Factors – Water............................................................................................3 2.2.2 Peaking Factors – Wastewater ................................................................................3 2.3 Water Treatment............................................................................................... 3 2.4 Water Storage ................................................................................................... 4 2.5
Wastewater Treatment..................................................................................... 5 2.5.1 Average Flow .................................................................................................................5 2.5.2 Maximum Day Flow.....................................................................................................5
3 LINDSAY ........................................................................................................................ 7 3.1 Planning Forecast.............................................................................................. 7 3.1.1 Lindsay .............................................................................................................................7 3.1.2 Oakwood.........................................................................................................................9 3.2 Water Treatment............................................................................................. 11 3.3 Water Storage ................................................................................................. 12 3.3.1 Lindsay .......................................................................................................................... 12 3.3.2 Oakwood...................................................................................................................... 14 3.4 Wastewater Treatment................................................................................... 16 3.4.1 Average Flow .............................................................................................................. 16 3.4.2 Maximum Day Flow.................................................................................................. 18 3.5 Facilities Capacity Analysis Summary ........................................................... 20 3.5.1 Lindsay .......................................................................................................................... 20 3.5.2 Oakwood...................................................................................................................... 21 4 BOBCAYGEON............................................................................................................. 23 4.1 Planning Forecast............................................................................................ 23 4.2 Water Treatment............................................................................................. 24 4.3 Water Storage and Pumping ......................................................................... 26 4.4 Wastewater Treatment................................................................................... 27 4.4.1 Average Flow .............................................................................................................. 27 4.4.2 Maximum Day Flow.................................................................................................. 29 4.5 Facilities Capacity Analysis Summary ........................................................... 31 Project Number 10599 January 2025
Page ii
Technical Memorandum 5 Kawartha Lakes Water-Wastewater Master Plan Capacity Assessment
5 FENELON FALLS .......................................................................................................... 32 5.1 Planning Forecast............................................................................................ 32 5.2 Water Treatment............................................................................................. 33 5.3 Water Storage and Pumping ......................................................................... 34 5.4 Wastewater Treatment................................................................................... 38 5.4.1 Average Flow .............................................................................................................. 38 5.4.2 Maximum Day Flow.................................................................................................. 40 5.5 Facilities Capacity Analysis Summary ........................................................... 41 6 OMEMEE ...................................................................................................................... 43 6.1 6.2 6.3 6.4 6.5
Planning Forecast............................................................................................ 43 Water Treatment............................................................................................. 44 Water Storage ................................................................................................. 46 Wastewater Treatment................................................................................... 46 6.4.1 Average Flow .............................................................................................................. 46 Facilities Capacity Analysis Summary ........................................................... 49
7 WOODVILLE ................................................................................................................ 50 7.1 Planning Data .................................................................................................. 50 7.2 Water Treatment............................................................................................. 51 7.3 Water Storage and Pumping ......................................................................... 52 7.4
Facilities Capacity Analysis Summary ........................................................... 54
8 SMALL WATER SYSTEMS........................................................................................... 56 8.1 Growth Projections ......................................................................................... 56 8.1.1 Janetville....................................................................................................................... 57 8.1.2 Kinmount...................................................................................................................... 57 8.1.3 Manilla........................................................................................................................... 57 8.1.4 Pinewood ..................................................................................................................... 57 9 SMALL WASTEWATER SYSTEMS .............................................................................. 59 9.1 Growth Projections ......................................................................................... 59 9.1.1 Coboconk..................................................................................................................... 59 9.1.2 King’s Bay..................................................................................................................... 59
APPENDICES APPENDIX A - DEVELOPMENT PLANNING LIST APPENDIX B – COMMUNITY PLANNING INFORMATION MAPS Project Number 10599 January 2025
Page iii
Technical Memorandum 5 Kawartha Lakes Water-Wastewater Master Plan Capacity Assessment
APPENDIX C – COMMUNITY PHASING INFORMATION MAPS
LIST OF FIGURES Figure 3-1: Lindsay Projected Development ........................................................................................9 Figure 3-2: Oakwood Projected Development................................................................................. 10 Figure 3-3: Lindsay WTP Demand Projections ................................................................................. 12 Figure 3-4: Lindsay Water Storage Projections ................................................................................ 14 Figure 3-5: Oakwood Water Storage Projections............................................................................ 16 Figure 3-6: Lindsay WPCP Flow Projections ...................................................................................... 18 Figure 3-7: Lindsay Maximum Day Flow Projections...................................................................... 20 Figure 4-1: Bobcaygeon Development Map ..................................................................................... 24 Figure 4-2: Bobcaygeon WTP Demand Projections........................................................................ 25 Figure 4-3: Bobcaygeon Water Storage Projections ...................................................................... 27 Figure 4-4: Bobcaygeon WPCP Flow Projections ............................................................................ 29 Figure 4-5: Bobcaygeon Maximum Day Flow Projections .............................................................. 30 Figure 5-1: Fenelon Falls Projected Development .......................................................................... 33 Figure 5-2: Fenelon Falls WTP Demand Projections....................................................................... 34 Figure 5-3: Fenelon Falls Water Storage Projections ..................................................................... 37 Figure 5-4: Fenelon Falls Water Storage Projections with Booster Pumping Station ........ 38 Figure 5-5: Fenelon Falls WPCP Flow Projections ........................................................................... 39 Figure 5-6: Fenelon Falls Maximum Day Flow Projections.............................................................. 41 Figure 6-1: Omemee Projected Development.................................................................................. 44 Figure 6-2: Omemee Water Flow Projections................................................................................... 45 Figure 6-3: Omemee WPCP Flow Projections................................................................................... 47 Figure 7-1: Woodville Projected Development ................................................................................ 51 Figure 7-2: Woodville WTP Demand Projections ............................................................................ 52 Figure 7-3: Woodville Water Storage Projections........................................................................... 54
LIST OF TABLES Table 1-1: Data Sources ...............................................................................................................................1 Table 2-1: City of Kawartha Lakes Water and Wastewater Design Criteria...............................2 Table 2-2: City of Kawartha Lakes Water Design Criteria ................................................................3 Table 3-1: Lindsay Planning Forecast Details.......................................................................................7 Table 3-2: Lindsay Water Treatment Needs ...................................................................................... 11 Table 3-3: Lindsay Water Servicing Needs – Storage Capacity .................................................. 13 Table 3-4: Oakwood Water Servicing Needs – Pumping Capacity ........................................... 15 Table 3-5: Oakwood Water Servicing Needs – Storage Capacity.............................................. 15 Project Number 10599 January 2025
Page iv
Technical Memorandum 5 Kawartha Lakes Water-Wastewater Master Plan Capacity Assessment
Table 3-6: Lindsay Wastewater Servicing Needs – ADF ................................................................ 17 Table 3-7: Lindsay Wastewater Servicing Needs – Maximum Day ........................................... 19 Table 3-8: Lindsay Facilities Capacity Analysis Summary ............................................................. 21 Table 3-9: Oakwood Facilities Capacity Analysis Summary ......................................................... 22 Table 4-1: Bobcaygeon Planning Forecast Details .......................................................................... 23 Table 4-2: Bobcaygeon Water Servicing Needs – WTP Capacity .............................................. 24 Table 4-3: Bobcaygeon Water Servicing Needs – Storage Capacity ........................................ 26 Table 4-4: Bobcaygeon Wastewater Servicing Needs – ADF ...................................................... 28 Table 4-5 Bobcaygeon Wastewater Servicing Needs - Maximum Day ................................... 30 Table 4-6: Bobcaygeon Facilities Capacity Analysis Summary ................................................... 31 Table 5-1: Fenelon Falls Planning Forecast Details ......................................................................... 32 Table 5-2: Fenelon Falls Water Servicing Needs – WTP Capacity ............................................. 33 Table 5-3: Fenelon Falls Water Servicing Needs – Storage Capacity ....................................... 35 Table 5-4: Fenelon Falls Water Servicing Needs – Storage Capacity with Booster Pumping Station............................................................................................................... 36 Table 5-5: Fenelon Falls Wastewater Servicing Needs - ADF...................................................... 39 Table 5-6: Fenelon Falls Wastewater Servicing Needs – Maximum Day .................................... 40 Table 5-7: Fenelon Falls Facilities Capacity Analysis Summary................................................... 41 Table 6-1: Omemee Planning Forecast Details ................................................................................ 43 Table 6-2: Omemee WTP Servicing Needs - MDD ......................................................................... 45 Table 6-3: Omemee Water Servicing Needs – Storage Capacity............................................... 46 Table 6-4: Omemee Wastewater Servicing Needs.......................................................................... 47 Table 6-5: Omemee Capacity Analysis Summary ............................................................................ 49 Table 7-1: Woodville Planning Information....................................................................................... 50 Table 7-2: Woodville Water Servicing Needs ................................................................................... 51 Table 7-3: Woodville Water Storage Requirements ....................................................................... 53 Table 7-4: Woodville Capacity Analysis Summary .......................................................................... 55 Table 8-1: Small Water System Servicing Needs ............................................................................. 56 Table 9-1: Small Wastewater System Servicing Needs.................................................................. 59
Project Number 10599 January 2025
Page v
Technical Memorandum 5 Kawartha Lakes Water-Wastewater Master Plan Capacity Assessment
1 INTRODUCTION T.Y. Lin International Canada (TYLin) has been contracted by the City of Kawartha Lakes for completion of a Water and Wastewater Master Plan Update. As part of this study, this memorandum summarizes the long-range planning information for different communities in the City, and forecasts the increase in servicing requirements (and potential facility capacity restrictions) at the existing water treatment plants (WTP), water pollution control plants (WPCP) and water storage tanks/reservoirs. The City provided various sources of planning information, which was utilized to create the tables and mapping illustrated in the appendix of the memo. The data used is outlined in Table 1-1. Table 1-1: Data Sources Data
Type
City of Kawartha Lakes Report Growth Management Strategy (GMS) (May 2011)
Information Contains mapping of developments for Linday, Bobcaygeon, Fenlon Falls, and the various communities around Kawartha Lakes as of May 2011. This formed the basis for 2011 GMS Developments
City of Kawartha Lakes Servicing Assessment (February 2012)
Report
20230321 List of Developments Under Review + MZO Lands – with GMS NWT SEDC
Excel
Contains list of current developments along with Development Status and Potential Buildout time which formed the basis of Scenario Development as of March 21, 2023
20211107 – Key Map of Current Developments Under Review – Lindsay, Bobcaygeon, Fenlon - DW
PDF Map
Supplemental Map denoting locations for the list of current developments under review
Drawings from Development Engineering
Site Plans
Referenced drawings to determine location for GIS shapefiles.
Project Number 10599 January 2025
Page 1
Technical Memorandum 5 Kawartha Lakes Water-Wastewater Master Plan Capacity Assessment
Data
Type
Various Zoning Shapefiles
Information Utilized to isolate future developments
Feature Class
2 BASIS FOR SERVICING NEEDS ASSESSMENT 2.1 Planning Data The City of Kawartha Lakes Growth Management Strategy (GMS, May 2011) was reviewed and compared with the List of Current Developments Under Review (Nov 7, 2022). The List of Current Developments included development statistics for Lindsay, Bobcaygeon and Fenelon Falls. For the remaining communities, the GMS was utilized to characterize growth on a community-wide basis. These statistics were categorized as build out conditions. For additional information please refer to Appendix A for the full development list and Appendix B and C for mapping involving development information and the phasing of the developments for years 2031, 2041 and 2051.
2.2 Water and Wastewater Design Criteria The Design Criteria considered for the Master Plan Update are based on the City of Kawartha Lakes Infrastructure Guidelines (2023). Table 2-1 shows the design criteria used to determine the water and wastewater servicing needs. Table 2-1: City of Kawartha Lakes Water and Wastewater Design Criteria Water – Water – Wastewater Wastewater Average Day Maximum Zoning – Average – Peaking Demand Day Peaking Flow Factor (ADD) Factor
Wastewater – I&I Allowance
Residential
450 Lpcd
(see below)
450 Lpcd
Harmon
0.26 L/ha/s
Industrial, Commercial
0.40 L/ha/s
1.0
0.40 L/ha/s
1.0
0.26 L/ha/s
Project Number 10599 January 2025
Page 2
Technical Memorandum 5 Kawartha Lakes Water-Wastewater Master Plan Capacity Assessment
Zoning
Water – Average Day Demand (ADD)
Water – Maximum Day Peaking Factor
Wastewater – Average Flow
Wastewater – Peaking Factor
Wastewater – I&I Allowance
Institutional
0.40 L/ha/s
1.0
0.32 L/ha/s
1.0
0.26 L/ha/s
2.2.1 Peaking Factors – Water Table 2-2 of the Ministry of the Environment, Conservation and Parks (MECP) Design Guidelines identify Maximum Day Peaking Factors based on the size of a community. The factors applicable to Kawartha Lakes communities are as follows: Table 2-2: City of Kawartha Lakes Water Design Criteria
Population
Maximum Day Factor
Peak Hour Factor
500 -1000
2.75
4.13
1001 - 2000
2.50
3.75
2001- 3000
2.25
3.38
3001 - 10000
2.00
3.00
10001 - 25000
1.90
2.85
25001 - 50000
1.80
2.70
50001 - 75000
1.75
2.62
2.2.2 Peaking Factors – Wastewater Peaking factors for residential wastewater design flows are calculated based on the Harmon Formula as follows: H = 1 + (14 ⁄ (4 + P0.5)) H being the Harmon peaking factor and P the design population in thousands, noting that the minimum permissible peaking factor is 2.0.
2.3 Water Treatment For communities with water supplies, the water treatment needs assessment was established using the following process:
Project Number 10599 January 2025
Page 3
Technical Memorandum 5 Kawartha Lakes Water-Wastewater Master Plan Capacity Assessment
► Review the Maximum Day Demand (MDD) data from the past five Annual Reports (20182022, inclusively); ► Identify the highest MDD from the past five years, and compare this with the plant’s rated capacity to establish an existing plant utilization (Percentage of Capacity); ► Determine the water supply needs for future time/development horizons by adding the design MDD for the projected growth (using the Design Criteria from Table 2-1) to the existing MDD for the existing developments; ► Graphs of system-wide water demands versus residential population were prepared to show how water demands are forecasted to increase with residential population, also identifying the total serviced population that will result in the plant reaching 80% and 100% capacity; o
The calculated system-wide water demands include the demands associated with employment lands;
o
Establishing the approximate residential population at which point the plants will achieve 80% and 100% capacity will allow the dates of those milestones to be approximated based on the assumed rate of residential population growth.
2.4 Water Storage The MECP provides guidance on water storage requirements for municipalities. Water storage calculations include the following considerations: ► [A] Fire Storage: Typically based on a Fire Flow and Duration; ► [B] Equalization Storage: 25% of the Maximum Daily Demand; and, ► [C] Emergency Storage: 25% of the sum of [A] + [B]. The physical configuration of the water containing portion of the storage facility should be such that the equalization volume (B) is located between the top water level (TWL) of the storage facility and that elevation necessary to produce a minimum pressure of 275 kPa (40 psi) in the majority of the system under peak hourly flow. The fire (A) and emergency (C) component volumes (i.e., A + C) should be located between that elevation necessary to produce 275 kPa (40 psi) under peak hourly flow conditions and that elevation necessary to produce a minimum 140 kPa (20 psi) under the maximum day plus fire flow condition. Should a standpipe with a booster pumping station at the base be proposed, the equalization volume (B) would normally be located between the TWL and that elevation necessary to produce 275 kPa (40 psi) in the majority of the system under peak hourly flow. The fire (A) and emergency (C) components can be below this 275 kPa (40 psi) elevation provided the booster pump is designed/sized to increase system pressures to a minimum 140 kPa (20 psi) under the maximum day plus fire flow condition.
Project Number 10599 January 2025
Page 4
Technical Memorandum 5 Kawartha Lakes Water-Wastewater Master Plan Capacity Assessment
2.5 Wastewater Treatment 2.5.1 Average Flow As wastewater plants have a rated capacity based on Average Daily Flow (ADF), this will be used to establish the wastewater flows from the existing community, and the reserve capacity available to service future development. For communities with wastewater systems, the wastewater treatment needs assessment was established using the following process: ► Review the Average Daily Flows (ADF) data from the past five Annual Reports (20182022, inclusively); ► Identify the highest ADF from the past five years, and compare this with the plant’s rated ADF capacity to establish an existing plant utilization (Percentage of Capacity); ► Determine the wastewater treatment needs for future time/development horizons by adding the design ADF for the projected growth (using the Design Criteria from Table 2-1) to the existing ADF for the existing developments; ► Graphs of system-wide flow projections versus residential population were prepared to show how water demands are forecasted to increase with residential population, also identifying the total serviced population that will result in the plant reaching 80% and 100% capacity; ► The calculated system-wide wastewater flows include the demands associated with employment lands; ► Establishing the approximate residential population at which point the plants will achieve 80% and 100% capacity will allow the dates of those milestones to be approximated based on the assumed rate of residential population growth.
2.5.2 Maximum Day Flow While the MECP specifies the capacities of wastewater treatment plants based on Average Day Flow, there are also individual process limitations which result in a maximum day treatment capacity. Therefore, for communities with wastewater systems, an additional wastewater treatment needs assessment was established based on Maximum Day Flows (MDF), using the following process: ► Review the MDF data from the past five Annual Reports (2018-2022, inclusively); ► Identify the highest MDF from the past five years, and compare this with the plant’s rated MDF capacity to establish an existing plant utilization (Percentage of Capacity); ► Determine the wastewater treatment needs for future time/development horizons by adding the design MDF for the projected growth (using the Design Criteria from Table 2-1) to the existing MDF for the existing developments; ► The calculated system-wide peak wastewater flows include the demands associated with employment lands and I&I allowance from future developments using the Design Criteria from Table 2-1); Project Number 10599 January 2025
Page 5
Technical Memorandum 5 Kawartha Lakes Water-Wastewater Master Plan Capacity Assessment
It is worth noting that while some plants have a rated MDF capacity (in addition to the rated ADF capacity) through an additional activated process capacity or an equalization storage capacity, other plants (especially in smaller communities) solely rely on the ADF capacity. As such, the MDF assessment of WWTPs in the different Kawartha Lakes communities will be a case-by-case analysis, based on the available facilities within the plant.
Project Number 10599 January 2025
Page 6
Technical Memorandum 5 Kawartha Lakes Water-Wastewater Master Plan Capacity Assessment
3 LINDSAY 3.1 Planning Forecast The Lindsay water distribution system provide water to the Oakwood. As such, the following section includes the capacity assessment for both Lindsay and Oakwood. The Oakwood capacity assessment will be limited to the Oakwood Reservoir and Booster Pumping Station.
3.1.1 Lindsay The planning priorities in Lindsay have been subdivided into six individual categories, as identified in Table 3-1. These categories are generic, and there is no guarantee nor stipulation that development in one category must be completed before development in other categories can commence. The categories are broadly described as follows: ► P1: Committed - Existing (Agreement+Buildout started prior to 2024) ► P2A: Northwest Trunk, Southeast Development Charge By-Law ► P2B: Other 2011 Growth Management Strategy ► P3: Bromont Residential (Angeline) - GMS+Municipal Zoning Order (MZO), Flato Residential & Commercial (inside Settlement boundary) ► P4: Bromont MZO (Callaghan); Flato MZO ► P5: Other Employment Table 3-1: Lindsay Planning Forecast Details Planning Category
Description
Existing
P1
Committed Existing (Agreement +Buildout started prior to 2024)
Residential Units
Residential Population
I/C/I Lot Area [ha]
10,210
23,046
153.0
1,135
2,611
5.6
11,345
25,657
158.6
Project Number 10599 January 2025
Page 7
Technical Memorandum 5 Kawartha Lakes Water-Wastewater Master Plan Capacity Assessment
Planning Category
Description
Residential Units
Residential Population
I/C/I Lot Area [ha]
P2A
North West Trunk, South East Development Charges By-Law
8,792
20,222
24.9
20,137
45,878
183.6
2,266
5,212
2.4
22,403
51,090
186.0
1,462
3,363
4.4
23,865
54,453
190.4
9,846
22,646
0.0
33,711
77,098
190.4
0
0
128.7
P2B
P3
P4
P5
Other 2011 Growth Management Strategy
Bromont (Angeline) MZO, Flato Res. & Com. (Inside Settlement Boundary) & others
Bromont MZO (Callaghan); Flato MZO
Other Employment
Project Number 10599 January 2025
Page 8
Technical Memorandum 5 Kawartha Lakes Water-Wastewater Master Plan Capacity Assessment
Planning Category
Description
Residential Units
Residential Population
I/C/I Lot Area [ha]
33,711
77,098
319.0
3.1.2 Oakwood The planning priorities in Oakwood has been identified in the 2011 GMS as shown in the Figure 3-2 below that identifies an additional 93 units, that equates to approximately 214 persons. A map of the anticipated development parcels is provided in Figure 3-2. Figure 3-1: Lindsay Projected Development
Project Number 10599 January 2025
Page 9
Technical Memorandum 5 Kawartha Lakes Water-Wastewater Master Plan Capacity Assessment
Figure 3-2: Oakwood Projected Development
Project Number 10599 January 2025
Page 10
Technical Memorandum 5 Kawartha Lakes Water-Wastewater Master Plan Capacity Assessment
3.2 Water Treatment The Lindsay Water Treatment Plant has a rated maximum day capacity of 22,730 m3/d. Based on the forecasted growth in the community the cumulative future system-wide water demands, along with their percentage of existing plant capacity, are as follows. Table 3-2: Lindsay Water Treatment Needs Planning Category
Additional Residential MDD [m3/d]
Additional I/C/I MDD [m3/day]
Total Additional MDD [m3/day]
Existing
Cumulative MDD [m3/day]
% of Plant Capacity
13,213
58%
P1
2,115
194
2,308
15,521
68%
P2A
16,379
862
17,242
32,763
144%
P2B
4,104
83
4,187
36,950
163%
P3
2,648
152
2,800
39,750
175%
P4
17,834
0
17,834
57,584
253%
P5
0
4,447
4,447
62,031
273%
Project Number 10599 January 2025
Page 11
Technical Memorandum 5 Kawartha Lakes Water-Wastewater Master Plan Capacity Assessment
Based on the anticipated demand projections shown in Figure 3-3, the WTP will reach 80% of its rated capacity when the population of Lindsay reaches approximately 28,000 residents, and 100% capacity at 34,000 residents. Based on an existing serviced population of 23,500 residents and 2.3 persons per unit, these estimates equate to 1,900 and 4,500 additional residential units respectively. Figure 3-3: Lindsay WTP Demand Projections
3.3 Water Storage 3.3.1 Lindsay There is currently 11,650 m3 of storage available in Lindsay, split between the Thornhill Road Reservoir (9,000 m3) and the Verulam Road Elevated Tank (2,650 m3). Based on the forecasted growth in the community the cumulative future system-wide MDD water demands, required storage and percentage of existing storage are as follows.
Project Number 10599 January 2025
Page 12
Technical Memorandum 5 Kawartha Lakes Water-Wastewater Master Plan Capacity Assessment
Table 3-3: Lindsay Water Servicing Needs – Storage Capacity Planning Category
Cumulativ e MDD [m3/day]
Required Fire Storage [m3]
Required Equal. Storage [m3]
Required Emerg. Storage [m3]
Total Storage Needed [m3]
% of Existing Storage
Existing
13,213
4,500
3,303
1,951
9,754
84%
P1
15,521
4,500
3,880
2,095
10,475
90%
P2A
32,763
8,165
8,191
4,089
20,444
175%
P2B
36,950
8,165
9,238
4,351
21,753
187%
P3
39,750
8,165
9,938
4,526
22,628
194%
P4
57,584
8,165
14,396
5,640
28,201
242%
P5
62,031
8,165
15,508
5,918
29,591
254%
Project Number 10599 January 2025
Page 13
Technical Memorandum 5 Kawartha Lakes Water-Wastewater Master Plan Capacity Assessment
Figure 3-4: Lindsay Water Storage Projections
Lindsay Water Storage Projections 35,000
Storage volume (m3)
P5
Plan for Plant Upgrade
30,000
25,000
P4 P3
20,000
P2A
P2B
15,000 10,000 5,000
P1 Existing
20,000
30,000
40,000
50,000
60,000
70,000
80,000
Population Water Storage Required
Existing Capacity
80% Capacity
Based on the anticipated demand projections and storage requirements shown in Table 3-3 and Table 3-4, the existing required water storage in Lindsay already exceeds 80% of its total capacity. It will reach 100% of its total storage capacity at approximately 28,000 residents. Based on an existing serviced population of 23,500 residents and 2.3 persons per unit, these estimates equate to 1,950 additional residential units. Additional water storage will be required via a new Northwest Elevated Tank and expansion of Thornhill Road Reservoir to address the remaining planning categories (P2A to P5) storage deficit.
3.3.2 Oakwood 3.3.2.1 Booster Pumping Station The Oakwood water demand projections would require an additional 265 m3/day of maximum day demands to support the projected residential growth, when using a 2.75 maximum day demand factor. Based on the anticipated demand projections shown in Table 3-4, the pumping capacity exceeds the Buildout planning category and can accommodated the forecasted residential growth.
Project Number 10599 January 2025
Page 14
Technical Memorandum 5 Kawartha Lakes Water-Wastewater Master Plan Capacity Assessment
Table 3-4: Oakwood Water Servicing Needs – Pumping Capacity Planning Category
Additional Residential MDD [m3/d]
Additional I/C/I MDD [m3/day]
Total Additional MDD [m3/day]
Existing
Buildout
265
0
265
Cumulative MDD [m3/day]
% of BPS Firm Capacity
808
58%
1073
77%
Based on the anticipated demand projections the BPS will reach 80% of its rated capacity when the population of Oakwood reaches approximately 850 residents, and 100% capacity at 1,100 residents. Based on an existing serviced population of approximately 650 residents and 2.3 persons per unit, these estimates equate to 85 and 195 additional residential units respectively.
3.3.2.2 Water Storage There is currently 232 m3 of storage available at the Oakwood Reservoir which is not capable to provide fire protection. Based on the forecasted growth in the community the cumulative future system-wide MDD water demands, required storage and percentage of existing storage are as shown in Table 3-5. Table 3-5: Oakwood Water Servicing Needs – Storage Capacity Planning Category
Cumulativ e MDD [m3/day]
Required Fire Storage [m3]
Required Equal. Storage [m3]
Required Emerg. Storage [m3]
Total Storage Needed [m3]
% of Existing Storage
Existing
808
0
202
118
320
138%
Buildout
1,073
0
268
156
424
183%
Project Number 10599 January 2025
Page 15
Technical Memorandum 5 Kawartha Lakes Water-Wastewater Master Plan Capacity Assessment
Figure 3-5: Oakwood Water Storage Projections
Oakwood Water Storage Projections 450 400
Storage volume (m3)
Buildout
Existing
350
300
Plan for Plant Upgrade
250 200 150 100
50 600
650
700
750
800
850
900
Population Water Storage Required
Existing Capacity
80% Capacity
The Oakwood Reservoir is deficient in the existing planning category and as such cannot support any additional residential units at this time. A reservoir expansion will be required to address the existing and buildout planning category.
3.4 Wastewater Treatment 3.4.1 Average Flow The Lindsay WPCP has recently been expanded to a rated Average Day Flow (ADF) capacity of 24,500 m3/d. Based on the forecasted growth in the community, the future system-wide wastewater flows and percentages of existing plant capacity are as shown in Table 3-6.
Project Number 10599 January 2025
Page 16
Technical Memorandum 5 Kawartha Lakes Water-Wastewater Master Plan Capacity Assessment
Table 3-6: Lindsay Wastewater Servicing Needs – ADF Planning Category
Additional Residential ADF [m3/d]
Additional I/C/I ADF [m3/day]
Total Additional ADF [m3/day]
Existing
Cumulative ADF [m3/day]
% of Plant Capacity
14,178
58%
P1
1,328
194
1,522
15,700
64%
P2A
9,100
862
9,962
25,662
105%
P2B
2,345
83
2,428
28,090
115%
P3
1,513
152
1,665
29,755
121%
P4
10,191
0
10,191
39,946
163%
P5
0
4,447
4,447
44,393
181%
Project Number 10599 January 2025
Page 17
Technical Memorandum 5 Kawartha Lakes Water-Wastewater Master Plan Capacity Assessment
Figure 3-6: Lindsay WPCP Flow Projections
Based on the anticipated demand projections shown in Figure 3-6: , the WPCP will reach 80% of its rated capacity when the population of Lindsay reaches approximately 34,000 residents, and 100% capacity at 44,000 residents. Based on an existing serviced population of 23,500 residents and 2.3 persons per unit, these estimates equate to 4,500 and 8,900 additional residential units respectively.
3.4.2 Maximum Day Flow While the MECP specifies the capacities of wastewater treatment plants based on Average Day Flow, there are also individual process limitations which result in a maximum day treatment capacity. The current maximum day capacity of the Lindsay WPCP is 30,100 m3/d. Recently, there have been annual exceedances of the maximum day flow to the plant under significant wet weather events. The inlet to the WPCP is configured in a manner in which excessive flows can be diverted into equalization storage lagoons, where they are stored temporarily until the plant has additional reserve capacity. The Flow Equalization Lagoons (Lagoons 5 and 6) have a combined capacity of 206,500 m3, which is over 8 times the plant’s rated Average Day Flow Capacity. At the time of the writing of this memo, it is not clear what reserve equalization storage is available in the lagoons, but the projected additional wet-weather flows resulting from the planned development are as follows (based on the wet-weather flow allowance of 0.26 L/s/ha for all land uses):
Project Number 10599 January 2025
Page 18
Technical Memorandum 5 Kawartha Lakes Water-Wastewater Master Plan Capacity Assessment
Table 3-7: Lindsay Wastewater Servicing Needs – Maximum Day Planning Category
Total Additional DWF [m3/d]
Additional Land Area [ha]
Additional WWF [m3/day]
Existing
Cumulative MDF [m3/day]
% of Plant Capacity
35,938
P1
2,990
102
2,282
41,210
137%
P2A
20,925
405
9,106
71,242
237%
P2B
5,290
88
1,986
78,518
261%
P3
3,374
66
1,482
83,373
277%
P4
21,354
573
12,863
117,591
391%
P5
0.00
507
11,387
128,978
428%
As such, the total maximum day flows to the Lindsay WPCP could increase to 428% of the existing maximum day plant capacity, as per the information presented in Table 3-7 upon full buildout of the available lands. This could exceed the Maximum Day Capacity of the WPCP by 93,040 m3/day, which is approximately 45 percent of the combined volume of the two equalization storage lagoons. Given that the plant’s Maximum Day capacity is approximately 25% greater than the Average Day, the additional 93,040 m3 of wet weather flows could potentially be process through the plant within approximately one week of the flows to the plant subsiding back to the average. As upgrades to the WPCP are implemented, there will be additional capacity to process wet-weather flow, and the required detention time in the equalization lagoons will likely decrease. The City Project Number 10599 January 2025
Page 19
Technical Memorandum 5 Kawartha Lakes Water-Wastewater Master Plan Capacity Assessment
has recently installed additional flow monitoring at the WPCP, and will be able to better record the volumes bypassed to the Equalization Lagoons, and also the volumes drained from the Lagoons following wet-weather events Figure 3-7: Lindsay Maximum Day Flow Projections
Lindsay MDD Flow Projections 140,000
P5 Maximum Day Flow (m3/d)
120,000
P4
100,000
P3
80,000
P2B 60,000 40,000
P2A
Existing P1
20,000 20,000
30,000
40,000
50,000
60,000
70,000
80,000
Population Cumulative MDF
Existing Capacity
80% Capacity
3.5 Facilities Capacity Analysis Summary 3.5.1 Lindsay The below table summarizes the capacity analysis of the different facilities in the wake of the forecasted growth in Lindsay.
Project Number 10599 January 2025
Page 20
Technical Memorandum 5 Kawartha Lakes Water-Wastewater Master Plan Capacity Assessment
Table 3-8: Lindsay Facilities Capacity Analysis Summary Additional Units at 80% Capacity
Additional Units at 100% Capacity
Facility
Current Capacity
Current Utilization
Required Buildout Capacity
WTP
22,730 m3/day (MDD)
58%
62,031 m3/day (MDD)
1,900
4,500
Water Storage
11,650 m3
84%
29,591 m3
0
1,950
WPCP
24,500 m /day (ADF)
58%
44,239 m /day (ADF)
4,500
8,900
3
3
The Lindsay WTP capacity, the available water storage and the WPCP capacity will all need to be upgraded to accommodate the required buildout capacity of Lindsay. These projects will trigger EA studies that should be initiated before the facilities reach 80% of their current rated capacities. For Lindsay, the water storage Class EA should be commenced as soon as possible. The water storage deficit can be resolved with the construction of a new Northwest elevated tank and expansion of the Thornhill Reservoir. For the Lindsay WPCP, the maximum day flows will need to continue to be bypassed using the equalization lagoons, as the current plant cannot handle the maximum day flows. The treatment capacity upgrades for both the WTP and WPCP will require Schedule ‘C’ Class EA studies to be completed, and the water storage will require a Schedule ‘B’ Class EA study.
3.5.2 Oakwood The below table summarizes the capacity analysis of the Oakwood Reservoir and Booster Pumping Station in the wake of the forecasted growth in Oakwood.
Project Number 10599 January 2025
Page 21
Technical Memorandum 5 Kawartha Lakes Water-Wastewater Master Plan Capacity Assessment
Table 3-9: Oakwood Facilities Capacity Analysis Summary Additional Units at 80% Capacity
Additional Units at 100% Capacity
Facility
Current Capacity
Current Utilization
Required Buildout Capacity
Booster Pumping Station
1,390 m3
58%
1,073 m3
85
195
Water Storage
232 m3
138%
424 m3
0
0
The Oakwood Reservoir will need to be expanded to accommodate the existing and required buildout capacity of Oakwood. This EA studies for the water storage Class EA will be classified as a Schedule ‘B’ Class EA and should be commenced as soon as possible.
Project Number 10599 January 2025
Page 22
Technical Memorandum 5 Kawartha Lakes Water-Wastewater Master Plan Capacity Assessment
4 BOBCAYGEON 4.1 Planning Forecast The planning priorities in Bobcaygeon have been divided into 3 categories as identified in Table 4-1. This table provides a summary of the existing and planned development statistics for Bobcaygeon. The map of planned development in Fenelon Falls is provided in Figure 4-1. Table 4-1: Bobcaygeon Planning Forecast Details Planning Category
Description
Existing
P1
P2
P3
Committed Existing
Committed Future
Other 2011 Growth Management Strategy
Residential Units
Residential Population
I/C/I Lot Area [ha]
1,513
3,595
4.0
103
237
0.0
1,616
3,832
4.0
366
842
2.2
1,982
4,674
6.2
1,766
4,063
18.0
3,748
8,736
24.2
Project Number 10599 January 2025
Page 23
Technical Memorandum 5 Kawartha Lakes Water-Wastewater Master Plan Capacity Assessment
Figure 4-1: Bobcaygeon Development Map
4.2 Water Treatment The Water Treatment Plant has a rated maximum day capacity of 5,184 m3/d. Based on the forecasted growth in the community the cumulative future system-wide water demands and percentages of plant capacity are as follows. Table 4-2: Bobcaygeon Water Servicing Needs – WTP Capacity Planning Category
Additional Residential MDD [m3/d]
Additional I/C/I MDD [m3/day]
Total Additional MDD [m3/day]
Existing
Project Number 10599 January 2025
Cumulative MDD [m3/day]
% of Plant Capacity
3,575
69%
Page 24
Technical Memorandum 5 Kawartha Lakes Water-Wastewater Master Plan Capacity Assessment
Planning Category
Additional Residential MDD [m3/d]
Additional I/C/I MDD [m3/day]
Total Additional MDD [m3/day]
Cumulative MDD [m3/day]
% of Plant Capacity
P1
213
0
213
3,788
73%
P2
758
76
833
4,622
89%
P3
3,656
622
4,278
8,900
172%
Figure 4-2: Bobcaygeon WTP Demand Projections
Bobcaygeon WTP Demand Projections 10,000
Max Day Demand (m3/d)
9,000
Plan for Plant Upgrade P3
8,000 7,000 6,000 5,000 4,000 3,000
P1
2,000
P2
Existing
1,000 3,000
4,000
5,000
6,000
7,000
8,000
9,000
10,000
Population Projected MDD
Existing Capacity
80% Capacity
Based on the anticipated demand projections shown in Figure 4-2, the WTP will reach 80% of its rated capacity when the population of Bobcaygeon reaches approximately 4,100 residents, and 100% capacity at 5,150 residents. Based on an existing serviced population of 3,500 residents and 2.3 persons per unit, these estimates equate to approximately 260 and 700 additional residential units respectively. Project Number 10599 January 2025
Page 25
Technical Memorandum 5 Kawartha Lakes Water-Wastewater Master Plan Capacity Assessment
4.3 Water Storage and Pumping The storage in the water distribution system in Bobcaygeon is provided by the Dunn Street Elevated Tank located at 85 Dunn Street. The elevated tank has a storage volume of 4,400 m3. Based on the forecasted growth in the community the cumulative future system-wide MDD water demands, required storage and percentage of existing storage are as follows. Table 4-3: Bobcaygeon Water Servicing Needs – Storage Capacity Planning Category
Cumulativ e MDD [m3/day]
Required Fire Storage [m3]
Required Equal. Storage [m3]
Required Emerg. Storage [m3]
Total Storage Needed [m3]
% of Existing Storage
Existing
3,575
792
894
421
2,107
48%
P1
3,788
792
947
435
2,174
49%
P2
4,622
900
1,155
514
2,569
58%
P3
8,900
1,717
2,225
986
4,928
112%
Project Number 10599 January 2025
Page 26
Technical Memorandum 5 Kawartha Lakes Water-Wastewater Master Plan Capacity Assessment
Figure 4-3: Bobcaygeon Water Storage Projections
Bobcaygeon Water Storage Projections 6,000
Storage volume (m3)
5,000
P3
4,000 3,000
P2
2,000
Plan for Plant Upgrade
P1 Existing
1,000 3,000
4,000
5,000
6,000
7,000
8,000
9,000
10,000
Population Water Storage Required
Existing Capacity
80% Capacity
Based on the anticipated demand projections and storage requirements shown in Table 4-3, the existing water storage in Bobcaygeon is sufficient up to planning horizon P2. Required storage will reach 80% of its total storage capacity at approximately 6,200 residents and 100% of its capacity at approximately 7,800 residents. Based on an existing serviced population of 3,500 residents and 2.3 persons per unit, these estimates equate to respectively 1,150 and 1,850 additional residential units
4.4 Wastewater Treatment 4.4.1 Average Flow The Bobcaygeon Water Pollution Control Plant has an average day rated capacity of 3,055 m3/d. Based on the forecasted growth in the community the cumulative future system-wide wastewater flows and percentage of plant capacity are as follows.
Project Number 10599 January 2025
Page 27
Technical Memorandum 5 Kawartha Lakes Water-Wastewater Master Plan Capacity Assessment
Table 4-4: Bobcaygeon Wastewater Servicing Needs – ADF Planning Category
Additional Residential ADF [m3/d]
Additional I/C/I ADF [m3/day]
Total Additional ADF [m3/day]
Existing
Cumulative ADF [m3/day]
% of Plant Capacity
2,583
85%
P1
107
0
107
2,690
88%
P2
379
76
454
3,144
103%
P3
1,828
622
2,450
5,594
183%
Project Number 10599 January 2025
Page 28
Technical Memorandum 5 Kawartha Lakes Water-Wastewater Master Plan Capacity Assessment
Figure 4-4: Bobcaygeon WPCP Flow Projections
Based on the anticipated demand projections shown in Figure 4-4, the WPCP has already reached 80% of its average day rated capacity, and planning for a facility upgrade should be initiated. The Bobcaygeon WPCP is forecasted to reach 100% capacity at approximately 4,600 residents. Based on an existing serviced population of 3,500 residents and 2.3 persons per unit, this estimate equates to 475 additional residential units.
4.4.2 Maximum Day Flow While the MECP specifies the capacities of wastewater treatment plants based on Average Day Flow, there are also individual process limitations which result in a maximum day treatment capacity. The current maximum day capacity of the Bobcaygeon WPCP is 10,440 m3/d. Based on the forecasted growth in the community the cumulative future system-wide wastewater maximum day flows and percentage of plant capacity are as follows.
Project Number 10599 January 2025
Page 29
Technical Memorandum 5 Kawartha Lakes Water-Wastewater Master Plan Capacity Assessment
Table 4-5 Bobcaygeon Wastewater Servicing Needs - Maximum Day Planning Category
Total Additional ADF [m3/d]
Additional Land Area [ha]
Additional WWF [m3/day]
Cumulative MDF [m3/day]
Existing
% of Plant Capacity
6,270
P1
357
6
135
6,762
65%
P2
1,487
21
472
8,721
84%
P3
7,382
234
5,257
21,359
205%
Figure 4-5: Bobcaygeon Maximum Day Flow Projections
Bobcaygeon MDD Flow Projections
Maximum Day Flow (m3/d)
25,000
Plan for Plant Upgrade
20,000
P3 15,000
10,000
P2
P1
5,000
Existing 3,000
4,000
5,000
6,000
7,000
8,000
9,000
Population Cumulative MDF
Existing Capacity
Project Number 10599 January 2025
80% Capacity
Page 30
Technical Memorandum 5 Kawartha Lakes Water-Wastewater Master Plan Capacity Assessment
Based on the anticipated demand projections shown in Table 4-5, the WPCP will reach 80% of its maximum day rated capacity when the population of Bobcaygeon reaches approximately 4,500 residents, and 100% capacity at 5,200 residents. Based on an existing serviced population of 3,500 residents and 2.3 persons per unit, these estimates equate to 425 and 725 additional residential units respectively.
4.5 Facilities Capacity Analysis Summary The below table summarizes the capacity analysis of the different facilities in the wake of the forecasted growth in Bobcaygeon. Table 4-6: Bobcaygeon Facilities Capacity Analysis Summary Additional Units at 80% Capacity
Additional Units at 100% Capacity
Facility
Current Capacity
Current Utilization
Required Buildout Capacity
WTP
5,184 m3/day (MDD)
69%
8,900 m3/day (MDD)
260
700
Water Storage
4,400 m3
48%
4,928 m3
1,150
1,850
WPCP
3,055 m3/day (ADF)
85%
5,594 m3/day (ADF)
0
475
The Bobcaygeon WTP capacity, the available water storage and the WPCP capacity will all need to be upgraded to accommodate the full forecasted buildout. The treatment capacity upgrades will require Schedule ‘C’ Class EA studies to be completed, and the water storage will require a Schedule ‘B’ Class EA study. These should all be initiated before the facilities reach 80% of their current rated capacities. The Bobcaygeon WPCP is already operating at greater than 80% of its rated capacity. Planning for upgrades to this facility should be initiated as soon as possible.
Project Number 10599 January 2025
Page 31
Technical Memorandum 5 Kawartha Lakes Water-Wastewater Master Plan Capacity Assessment
5 FENELON FALLS 5.1 Planning Forecast The planning priorities in Fenelon Falls have been divided into 2 categories as identified in Table 5-1. This table provides a summary of the existing and planned development statistics for Fenelon Falls. The map of planned development in Fenelon Falls is provided in Figure 5-1. Table 5-1: Fenelon Falls Planning Forecast Details Planning Category
Description
Existing
P1
P2
Committed Existing
2011 Growth Management Strategy
Residential Units
Residential Population
I/C/I Lot Area [ha]
903
2,502
11
178
409
0.0
1,081
2,911
11
1,320
3,036
0.0
2,401
5,947
11
Project Number 10599 January 2025
Page 32
Technical Memorandum 5 Kawartha Lakes Water-Wastewater Master Plan Capacity Assessment
Figure 5-1: Fenelon Falls Projected Development
5.2 Water Treatment The Fenelon Falls Water Treatment Plant has a rated maximum day capacity of 4,100 m3/d. Based on the forecasted growth in the community the cumulative future system-wide water demands and WTP capacity percentages are as follows. Table 5-2: Fenelon Falls Water Servicing Needs – WTP Capacity Planning Category
Additional Residential MDD [m3/d]
Additional I/C/I MDD [m3/day]
Total Additional MDD [m3/day]
Existing
Project Number 10599 January 2025
Cumulative MDD [m3/day]
% of Plant Capacity
1,693
41%
Page 33
Technical Memorandum 5 Kawartha Lakes Water-Wastewater Master Plan Capacity Assessment
Planning Category
Additional Residential MDD [m3/d]
Additional I/C/I MDD [m3/day]
Total Additional MDD [m3/day]
Cumulative MDD [m3/day]
% of Plant Capacity
P1
415
0
415
2,108
51%
P2
2,732
0
2,732
4,840
118%
Figure 5-2: Fenelon Falls WTP Demand Projections
Fenelon Falls WTP Demand Projections 6,000
Max Day Demand (m3/d)
5,000
P2
4,000 3,000
P1
Plan for Plant Upgrade
2,000 1,000
Existing
2,000
2,500
3,000
3,500
4,000
4,500
5,000
5,500
6,000
6,500
Population Projected MDD
Existing Capacity
80% Capacity
Based on the anticipated demand projections shown in Figure 5-2, the WTP will reach 80% of its rated capacity when the population of Fenelon Falls reaches approximately 4,300 residents, and 100% capacity at 5,300 residents. Based on an existing serviced population of 2,100 residents and 2.3 persons per unit, these estimates equate to 940 and 1,400 additional residential units respectively.
5.3 Water Storage and Pumping Project Number 10599 January 2025
Page 34
Technical Memorandum 5 Kawartha Lakes Water-Wastewater Master Plan Capacity Assessment
There is currently 2,450 m3 of storage available in Fenelon Falls standpipe located at 18 Church Street. The standpipe has a total height of 31 m and a diameter of 10 m. The facility is not equipped with a booster pumping station at the base. For a storage to be considered ‘usable’ according to the MECP Design Guidelines for Drinking Water systems, the equalization volume should be at an elevation necessary to produce a minimum pressure of 275 kPa (40 psi) in the system under peak hour demand and the fire and emergency volumes should be at an elevation to produce a minimum pressure of 140 kPa (20 psi) under the maximum day demand plus fire flow condition. To produce minimum pressures of 275 kPa and 140 kPa, only the top 3 and 16 meters respectively of the standpipe should be considered, which equates to available equalization volume of 235 m3 and emergency and fire volume of 1,015 m3, for a total ‘usable’ volume of 1,250 m3. Based on the forecasted growth in the community the cumulative future system-wide MDD water demands, required storage and percentage of existing storage are as follows. Table 5-3: Fenelon Falls Water Servicing Needs – Storage Capacity Planning Category
Cumulativ e MDD [m3/day]
Required Fire Storage [m3]
Required Equal. Storage [m3]
Required Emerg. Storage [m3]
Total Storage Needed [m3]
% of Existing Storage
Existing
1,693
684
423
277
1,384
111%
P1
2,108
684
527
303
1,514
121%
P2
4,840
1,037
1,210
562
2,808
225%
Based on the anticipated demand projections and storage requirements shown in above table, Fenelon Falls is presently deficient in storage based on the useable storage volume in the existing condition. This deficiency can be mitigated if pumps are installed in an emergency situation to provide additional system pressure for maximum day demands and fire flows for planning category P1. The storage capacity needs based on anticipated demands projections and storage requirements with the addition of a booster pumping station are shown in
Project Number 10599 January 2025
Page 35
Technical Memorandum 5 Kawartha Lakes Water-Wastewater Master Plan Capacity Assessment
Table 5-4. However, additional storage capacity will be required to accommodate full forecasted buildout for planning category 2. Table 5-4: Fenelon Falls Water Servicing Needs – Storage Capacity with Booster Pumping Station Planning Category
Cumulativ e MDD [m3/day]
Required Fire Storage [m3]
Required Equal. Storage [m3]
Required Emerg. Storage [m3]
Total Storage Needed [m3]
% of Existing Storage
Existing
1,693
684
423
277
1,384
56%
P1
2,108
684
527
303
1,514
62%
P2
4,840
1,037
1,210
562
2,808
115%
Project Number 10599 January 2025
Page 36
Technical Memorandum 5 Kawartha Lakes Water-Wastewater Master Plan Capacity Assessment
Figure 5-3: Fenelon Falls Water Storage Projections
Fenelon Falls Water Storage Projections 3,000
P2
Storage volume (m3)
2,500 2,000
1,500
P1
1,000
Existing
Plan for Plant Upgrade
500 2,000
2,500
3,000
3,500
4,000
4,500
5,000
5,500
6,000
6,500
Population Water Storage Required
Existing Capacity
80% Capacity
Based on the anticipated demand projections and storage requirements shown in Table 5-3 and Figure 5-4 the existing water storage in Fenelon Falls is insufficient to service the existing condition and P1 without construction of a booster pumping station at the base. With the booster pumping station, required storage will reach 80% of its total storage capacity at approximately 3,950 residents and 100% of its capacity at approximately 5,050 residents. Based on an existing serviced population of 2,502 residents and 2.3 persons per unit, these estimates equate to respectively 600 and 1,100 additional residential units.
Project Number 10599 January 2025
Page 37
Technical Memorandum 5 Kawartha Lakes Water-Wastewater Master Plan Capacity Assessment
Figure 5-4: Fenelon Falls Water Storage Projections with Booster Pumping Station
Fenelon Falls Water Storage Projections 3,000
P2
Storage volume (m3)
2,500
2,000
1,500
Plan for Plant Upgrade
P1
1,000
Existing
500
2,000
2,500
3,000
3,500
4,000
4,500
5,000
5,500
6,000
6,500
Population Water Storage Required
Existing Capacity
80% Capacity
5.4 Wastewater Treatment 5.4.1 Average Flow The Fenelon Falls Water Pollution Control Plant has a rated average day flow capacity of 1,800 m3/d. Based on the forecasted growth in the community the cumulative future system-wide wastewater flows and WPCP capacity percentages are as follows.
Project Number 10599 January 2025
Page 38
Technical Memorandum 5 Kawartha Lakes Water-Wastewater Master Plan Capacity Assessment
Table 5-5: Fenelon Falls Wastewater Servicing Needs - ADF Planning Category
Additional Residential ADF [m3/d]
Additional I/C/I ADF [m3/day]
Total Additional ADF [m3/day]
Existing
Cumulative ADF [m3/day]
% of Plant Capacity
1,158
64%
P1
184
0
184
1,342
75%
P2
1,366
0
1,366
2,708
150%
Figure 5-5: Fenelon Falls WPCP Flow Projections
Fenelon Falls WPCP Flow Projections 3,000
Plan for Plant Upgrade
Average Day Flow (m3/d)
2,500
P2
2,000 1,500
P1
1,000
Existing
500 2,000
2,500
3,000
3,500
4,000
4,500
5,000
5,500
6,000
6,500
Population Projected ADF
Existing Capacity
Project Number 10599 January 2025
80% Capacity
Page 39
Technical Memorandum 5 Kawartha Lakes Water-Wastewater Master Plan Capacity Assessment
Based on the anticipated demand projections shown in Figure 5-5, the WPCP will reach 80% of its average day rated capacity when the population of Fenelon Falls reaches approximately 3,200 residents, and 100% capacity at 3,900 residents. Based on an existing serviced population of 2,500 residents and 2.3 persons per unit, these estimates equate to 300 and 800 additional residential units respectively.
5.4.2 Maximum Day Flow While the MECP specifies the capacities of wastewater treatment plants based on Average Day Flow, there are also individual process limitations which result in a maximum day treatment capacity. The Fenelon Falls Wastewater Treatment Plant has a rated peak day flow capacity of 6,120 m3/d. However, OCWA has reported that the operational peak flow is 4,838 m3/day that stems from the WPCP filters. Any excess flows above the operational peak flow requires OCWA to start bypassing flows meaning that the OCWA’s Annual report are under-reported. Based on the forecasted growth in the community the cumulative future system-wide wastewater maximum day flows and percentage of plant capacity are as follows.
Table 5-6: Fenelon Falls Wastewater Servicing Needs – Maximum Day Planning Category
Total Additional ADF [m3/d]
Additional Land Area [ha]
Additional WWF [m3/day]
Existing
Cumulative MDF [m3/day]
% of Plant Capacity
4,360
P1
636
5
112
5,109
49%
P2
4,337
284
6,380
15,825
152%
Project Number 10599 January 2025
Page 40
Technical Memorandum 5 Kawartha Lakes Water-Wastewater Master Plan Capacity Assessment
Figure 5-6: Fenelon Falls Maximum Day Flow Projections
Fenelon Falls MDD Flow Projections 18,000
Maximum Day Flow (m3/d)
16,000
P2
Plan for Plant Upgrade
14,000 12,000 10,000 8,000
6,000 4,000
Existing
2,000
P1
-
2,000
2,500
3,000
3,500
4,000
4,500
5,000
5,500
6,000
6,500
Population Cumulative MDF
Existing Capacity
80% Capacity
As per available flow records, it is observed that the maximum day flow recorded in the last 5 years is equal to 71% of the rated peak flow plant capacity. However, it was also reported that Fenelon Falls wastewater system continued bypassing flows for the last several years during peak flow events. Based on the anticipated demand projections shown above, and the officially recorded existing flows, the WPCP would reach 80% of its peak day flow rated capacity when the population of Fenelon Falls reaches approximately 2,900 residents, and 100% capacity at 3,200 residents. Based on an existing serviced population of 2,500 residents and 2.3 persons per unit, these estimates would equate to 150 and 300 additional residential units respectively. In reality, the most recent peak flows at the plant are in exceedance of the plant rated peak flow capacity. Unlike Lindsay, there aren’t any temporary storage infrastructure or lagoons for bypassed flows. Therefore, the Fenelon Falls WPCP doesn’t have capacity to accommodate additional developments in the community.
5.5 Facilities Capacity Analysis Summary The below table summarizes the capacity analysis of the different facilities in the wake of the forecasted growth in Fenelon Falls. Table 5-7: Fenelon Falls Facilities Capacity Analysis Summary
Project Number 10599 January 2025
Page 41
Technical Memorandum 5 Kawartha Lakes Water-Wastewater Master Plan Capacity Assessment
Additional Units at 80% Capacity
Additional Units at 100% Capacity
Facility
Current Capacity
Current Utilization
Required Buildout Capacity
WTP
4,100 m3/day (MDD)
41%
4,840 m3/day (MDD)
940
1,400
Water Storage
1,250 m3
111%
2,808 m3
600
1,100
WPCP
1,800 m3/day (ADF)
64%
2,708 m3/day (ADF)
300
600
The Fenelon Falls WTP capacity, the available water storage and the WPCP capacity will need to be upgraded to accommodate the required buildout capacity. The treatment capacity upgrades will require Schedule ‘C’ Class EA studies to be completed, and the water storage will require a Schedule ‘B’ Class EA study. These studies should be initiated before the facilities reach 80% of their current rated capacities. The available water storage in the Fenelon Falls standpipe is currently deficient, because the majority of the total volume stored is below 16 m of water elevation (above grade), and therefore not available at the required residual system pressure. If a booster pumping station can be installed at the base of the standpipe, then the full storage volume would be available, and the deficiency mitigated, addressing the immediate need to upgrade the Fenelon Falls standpipe. Additional water storage capacity is still required to accommodate the required buildout capacity. This storage capacity volume can also be accommodated at the WTP to offset upgrades or replacement of the existing standpipe, contingent that the sizing of the water supply can meet future maximum day demands, and the high lift pumping station can provided maximum day demands and fire flows. Lastly, due to some of the operational and historical records of overflows at the Fenelon Falls WPCP, there is not sufficient capacity at the WPCP to handle peak flow events that may arise during major storms, with no means of equalization storage as discussed at the Lindsay WPCP.
Project Number 10599 January 2025
Page 42
Technical Memorandum 5 Kawartha Lakes Water-Wastewater Master Plan Capacity Assessment
6 OMEMEE While Omemee is one of the larger communities within the City of Kawartha Lakes, the Omemee drinking water system services only a single neighbourhood in the western limits of the community that was intended to service 71 lots. Of the forecasted development in Omemee, only the developments immediately to the north of the existing service area appear to be feasible for connecting to the existing water supply.
6.1 Planning Forecast The planning priorities in Omemee have been divided into 2 categories as identified in Table 6-1. This table provides a summary of the existing and planned development statistics for Omemee. Table 6-1: Omemee Planning Forecast Details Planning Category
Description
Existing
P1
P2
Committed Existing
2011 Growth Management Strategy
Residential Units
Residential Population
I/C/I Lot Area [ha]
0
1,035
7
30
69
0.0
30
1,104
7
427
982
0.0
457
2,086
7
Project Number 10599 January 2025
Page 43
Technical Memorandum 5 Kawartha Lakes Water-Wastewater Master Plan Capacity Assessment
Figure 6-1: Omemee Projected Development
6.2 Water Treatment The Omemee Water Treatment Plant has a rated maximum day capacity of 461 m3/d. Based on the forecasted growth in the community the cumulative future system-wide water demands and WTP capacity percentages are as follows.
Project Number 10599 January 2025
Page 44
Technical Memorandum 5 Kawartha Lakes Water-Wastewater Master Plan Capacity Assessment
Table 6-2: Omemee WTP Servicing Needs - MDD Planning Category
Additional Residential MDD [m3/d]
Additional I/C/I MDD [m3/day]
Total Additional MDD [m3/day]
Cumulative MDD [m3/day]
% of Plant Capacity
0
92
20%
Existing
P1
78
0
78
170
37%
P2
994
0
994
1,164
252%
Figure 6-2: Omemee Water Flow Projections
Omemee Demand Projections 1,400
Max Day Demand (m3/d)
1,200
P2
Plan for Plant Upgrade 1,000 800 600 400 200
P1 Existing
1,000
1,200
1,400
1,600
1,800
2,000
2,200
Population Projected MDD
Existing Capacity
Project Number 10599 January 2025
80% Capacity
Page 45
Technical Memorandum 5 Kawartha Lakes Water-Wastewater Master Plan Capacity Assessment
Based on the anticipated demand projections shown in Table 6-2 the WTP will reach 80% of its rated capacity when the population of Omemee reaches approximately 1,300 residents, and 100% capacity at 1,400 residents. Based on an existing serviced population of 1,035 residents and 2.3 persons per unit, these estimates equate to 100 and 150 additional residential units respectively.
6.3 Water Storage There is currently a water storage available within the Omemee water system that consists of a 16 m3 underground clearwell used for chlorine contact time and treated water storage. Based on the forecasted growth in the community the cumulative future system-wide maximum day demands, required storage and percentage of existing storage are as follows. Table 6-3: Omemee Water Servicing Needs – Storage Capacity Required Equal. Storage [m3]
Required Emerg. Storage [m3]
Total Storage Needed [m3]
% of Existing Storage
92
23
29
52
327%
P1
170
42
42
84
526%
P2
1,164
291
206
497
949%
Planning Category
Cumulativ e MDD [m3/day]
Existing
Required Fire Storage [m3]
Based on the anticipated demand projections and storage requirements shown in Table 6-3, there is not sufficient capacity in the existing condition to satisfy the MECP required storage for equalization and emergency storage.
6.4 Wastewater Treatment 6.4.1 Average Flow The Omemee Wastewater Treatment Plant has a rated average day flow capacity of 1,353 m3/d. Based on the forecasted growth in the community, the cumulative future system-wide wastewater flows and WWTP capacity percentages are as follows:
Project Number 10599 January 2025
Page 46
Technical Memorandum 5 Kawartha Lakes Water-Wastewater Master Plan Capacity Assessment
Table 6-4: Omemee Wastewater Servicing Needs Planning Category
Additional Residential ADF [m3/d]
Additional I/C/I ADF [m3/day]
Total Additional ADF [m3/day]
Existing
Cumulative ADF [m3/day]
% of Plant Capacity
590
44%
P1
31
0
31
621
46%
P2
442
0
442
1,063
79%
Figure 6-3: Omemee WPCP Flow Projections
Based on Figure 6-3, there is sufficient capacity at the WPCP for the full buildout population of Omemee. Treatment plant capacity upgrades should be considered when 80% of its rated capacity Project Number 10599 January 2025
Page 47
Technical Memorandum 5 Kawartha Lakes Water-Wastewater Master Plan Capacity Assessment
reaches is met which is at approximately 2,100 residents. Based on an existing serviced population of 1,035 residents and 2.3 persons per unit, these estimates equate to 450 additional residential units.
Project Number 10599 January 2025
Page 48
Technical Memorandum 5 Kawartha Lakes Water-Wastewater Master Plan Capacity Assessment
6.5 Facilities Capacity Analysis Summary The below table summarizes the capacity analysis of the different facilities in the wake of the forecasted growth in Omemee. Table 6-5: Omemee Capacity Analysis Summary
Facility
Current Capacity
Current Utilization
Required Buildout Capacity
Additional Units at 80% Capacity
Additional Units at 100% Capacity
WTP
461 m3/day (MDD)
20%
1,164 m3/day (MDD)
100
150
Water Storage
16 m3
327%
497 m3
0
0
450
Satisfies Projected Planned Growth
WPCP
3
1,353 m /day (ADF)
44%
3
1,063 m /day (ADF)
The Omemee WTP capacity and the available water storage will need to be upgraded to accommodate the required buildout capacity. A Class EA Schedule B study was completed by AECOM in 2015 that evaluated upgrading/expanding the Omemee water system to maintain compliance with applicable regulations and accommodate future growth. Several alternatives were formulated and evaluated during this study and the “Do Nothing” alternative emerged as the preferred solution. The other alternatives suggest that a sustainable community water system will not be financially viable at the existing level of development charges and user fees, requiring additional funding. As such, recommendation at this time is to not upgrade the water infrastructure related to the WTP and Reservoir and to utilize the existing WTP capacity for the first phase of growth.
Project Number 10599 January 2025
Page 49
Technical Memorandum 5 Kawartha Lakes Water-Wastewater Master Plan Capacity Assessment
7 WOODVILLE 7.1 Planning Data The planning priorities in Woodville are identified in Table 7-1. This table provides a summary of the existing and planned development statistics for Woodville. Table 7-1: Woodville Planning Information Planning Category
Description
Existing
Buildout
2011 Growth Management Strategy
Residential Units
Residential Population
I/C/I Lot Area [ha]
0
619
0
148
363
0.0
148
982
0
Project Number 10599 January 2025
Page 50
Technical Memorandum 5 Kawartha Lakes Water-Wastewater Master Plan Capacity Assessment
Figure 7-1: Woodville Projected Development
7.2 Water Treatment The Woodville Water Treatment Plant has a rated maximum day capacity of 588 m3/d. Based on the forecasted growth in the community the cumulative future system-wide water demands are as follows. Table 7-2: Woodville Water Servicing Needs Planning Category
Additional Residential MDD [m3/d]
Additional I/C/I MDD [m3/day]
Total Additional MDD [m3/day]
Existing
Project Number 10599 January 2025
Cumulative MDD [m3/day]
% of Plant Capacity
349
59%
Page 51
Technical Memorandum 5 Kawartha Lakes Water-Wastewater Master Plan Capacity Assessment
Buildout
450
0
450
799
136%
Figure 7-2: Woodville WTP Demand Projections
Woodville WTP Demand Projections 900
Buildout
Max Day Demand (m3/d)
800 700
600 500 400 300
Plan for Plant Upgrade
Existing
200 100 600
650
700
750
800
850
900
950
1,000
1,050
Population Projected MDD
Existing Capacity
80% Capacity
Based on the anticipated demand projections shown in Figure 7-2, the WTP will reach 80% of its rated capacity when the population of Woodville reaches approximately 720 residents and 100% capacity at 815 residents. Based on an existing serviced population of 619 residents and 2.3 persons per unit, these estimates equate to 40 and 80 additional residential units respectively.
7.3 Water Storage and Pumping The storage requirements for the existing and buildout conditions based on forecasted growth for Woodville are outlined in Table 7-3.
Project Number 10599 January 2025
Page 52
Technical Memorandum 5 Kawartha Lakes Water-Wastewater Master Plan Capacity Assessment
Table 7-3: Woodville Water Storage Requirements Planning Category
Cumulativ e MDD [m3/day]
Required Fire Storage [m3]
Required Equal. Storage [m3]
Required Emerg. Storage [m3]
Total Storage Needed [m3]
% of Existing Storage
Existing
349
-
87
76
164
14%
Buildout
799
-
200
142
341
29%
Project Number 10599 January 2025
Page 53
Technical Memorandum 5 Kawartha Lakes Water-Wastewater Master Plan Capacity Assessment
Figure 7-3: Woodville Water Storage Projections
Woodville Water Storage Projections 1,400
Storage volume (m3)
1,200 1,000 800 600 400 200 600
650
700
750
800
850
900
950
1,000
1,050
Population Water Storage Required
Existing Capacity
80% Capacity
The Woodville standpipe is capable to supply fire storage, and has sufficient storage capacity for the forecasted buildout population.
7.4 Facilities Capacity Analysis Summary The below table summarizes the capacity analysis of the different facilities in the wake of the forecasted growth in Woodville.
Project Number 10599 January 2025
Page 54
Technical Memorandum 5 Kawartha Lakes Water-Wastewater Master Plan Capacity Assessment
Table 7-4: Woodville Capacity Analysis Summary Additional Units at 80% Capacity
Additional Units at 100% Capacity
Facility
Current Capacity
Current Utilization
Required Buildout Capacity
WTP
588 m3/day (MDD)
59%
799 m3/day (MDD)
40
80
Water Storage
1,160 m3
14%
341 m3
N/A
N/A
The Woodville WTP capacity will need to be upgraded to accommodate the required buildout capacity. The treatment capacity upgrades will require Schedule ‘C’ Class EA studies to be completed. This study should be initiated before the facilities reach 80% of their current rated capacities.
Project Number 10599 January 2025
Page 55
Technical Memorandum 5 Kawartha Lakes Water-Wastewater Master Plan Capacity Assessment
8 SMALL WATER SYSTEMS 8.1 Growth Projections The growth projections for the Small Water Systems are presented in Table 8-1. In many of these communities, there are no formal significant development applications that have been identified at this time, and servicing approvals will have to be considered as planning considerations evolve. For others, though, there are known development opportunities, and the servicing needs associated with those potential developments are identified. The information presented in Table 8-1 also assumes that all new development will be connected to the drinking water system, which is not necessarily the case. The individual systems where treatment capacity may not be available are discussed further in the following sections. Table 8-1: Small Water System Servicing Needs Additional Forecasted MDD Water Water System Population Servicing Need Growth [m3/d]
Reserve Treatment Capacity [m3/day]
Treatment Capacity Available?
Birch Point
0
0
162
Yes
Canadiana Shores
0
0
716
Yes
Janetville
186
209
207
No (8.1.1)
Kings Bay
106
119
174
Yes
Kinmount
329
370
252
No (8.1.2)
Manilla
150
169
71
No (8.1.3)
Manorview
0
0
235
Yes
Mariposa
0
0
5
Yes
Norland
12
14
78
Yes
Pinewood
366
412
316
No (8.1.4)
Pleasant Point
0
0
345
Yes
Sonya
0
0
92
Yes
Southview Estates
0
0
341
Yes
Victoria Place
0
0
33
Yes
Western Trent/Palmina
23
26
54
Yes
Project Number 10599 January 2025
Page 56
Technical Memorandum 5 Kawartha Lakes Water-Wastewater Master Plan Capacity Assessment
Water System
Forecasted Population Growth
Additional MDD Water Servicing Need [m3/d]
Reserve Treatment Capacity [m3/day]
Treatment Capacity Available?
Woodfield
21
24
212
Yes
8.1.1 Janetville Presently, the entire community of Janetville is connected to the water distribution system via groundwater wells, and the identified development blocks are adjacent to already-serviced areas. While the forecasted water servicing need is only slightly above the reserve treatment plant capacity, the maximum day demands at Janetville WTP have been fairly consistent over the past five years. It is assumed that a plant expansion would be warranted to service the proposed growth, and that planning for this expansion should be considered.
8.1.2 Kinmount Presently, the Kinmount water distribution network is located primarily in the southeast, servicing small areas on either side of the river. The contemplated development is primarily located to the west of the community. The contemplated development is located near the wells, so it may be feasible to connect the new developments to the water supply. There is sufficient space at the Kinmount WTP site to consider a facility expansion. It is therefore assumed that a plant expansion would be warranted to service the proposed growth, and that planning for this expansion should be considered.
8.1.3 Manilla Presently, the Manilla drinking water system supplies a single neighbourhood along Robmar Crescent and John Street. The contemplated development is situated immediately to the east of the existing distribution system, and immediately adjacent to Well #2. It is therefore assumed that a plant expansion would be warranted to service the proposed growth, and that planning for this expansion should be considered.
8.1.4 Pinewood
Project Number 10599 January 2025
Page 57
Technical Memorandum 5 Kawartha Lakes Water-Wastewater Master Plan Capacity Assessment
Presently, the Pinewood drinking water system supplies only the northern portion of the community. While servicing all of the contemplated growth would require a treatment capacity increase, not all of the forecasted development lands are adjacent to the existing service area. If not all of the development lands are to be connected to the drinking water system, then a facility expansion might not be needed. A detailed water servicing review for Pinewood is recommended to assess the potential expansion to the existing service area, but an expansion to the water treatment plant capacity is not anticipated to be required at this time.
Project Number 10599 January 2025
Page 58
Technical Memorandum 5 Kawartha Lakes Water-Wastewater Master Plan Capacity Assessment
9 SMALL WASTEWATER SYSTEMS 9.1 Growth Projections The growth projections for the Small Wastewater Systems are presented in Table 9-1. In many of these communities, there are no formal significant development applications that have been identified at this time, and servicing approvals will have to be considered as planning considerations evolve. For others, though, there are known development opportunities, and the servicing needs associated with those potential developments are identified. Table 9-1: Small Wastewater System Servicing Needs Additional ADF Forecasted Wastewater Wastewater Population System Servicing Need Growth [m3/d]
Reserve Treatment Capacity [m3/day]
Treatment Capacity Available?
Coboconk
16
7
10
Limited (9.1.1)
King’s Bay
106
48
87
Yes (9.1.2)
The information presented in Table 9-1 also assumes that all new development will be connected to the wastewater collection system, which is not necessarily the case. The individual systems where treatment capacity may not be available are discussed further in the following sections.
9.1.1 Coboconk Presently, the portion of Coboconk that has sanitary servicing is limited to the central area of the community, centred on Water Street and Cameron Street. While there is some available servicing capacity, this is very limited. In 2019, the annual average flows to the Coboconk lagoons reached 98% of the facility capacity. Given that there is no land available to accommodate an expansion to the existing lagoon system and that the contemplated developments are in the western portion of the community and not adjacent to the existing service area, and expansion to the existing facility is likely not warranted.
9.1.2 King’s Bay Presently, the entire community of King’s Bay is connected to the sanitary collection system, and it will likely be proposed to service the contemplated development to the King’s Bay Environmental Centre. While the current facility is receiving fairly low flows, overall, the loadings to the facility are relatively high. Given that there is no redundancy to the two Rotating Biological Contactors (RBCs), a detailed servicing capacity assessment is recommended.
Project Number 10599 January 2025
Page 59
Technical Memorandum 5 Kawartha Lakes Water-Wastewater Master Plan Capacity Assessment
APPENDIX A DEVELOPMENT PLANNING LIST
Planned Development Table, Woodville Category (Per CKL)
Category (Per CKL)
Index
Name of Development (limited to CKL Eng. current appl. reviews)
Location
Type of Development
No. of 2011 Lots/Units GMS # (Based on Application)
2011 GMS Allocation (No. of Units)
Area Population Commercial Institutional (ha) (ha) (ha)
2011 GMS No application
WDV-G-1
Woodville
5
12
2011 GMS No application
WDV-G-2
Woodville
22
51
2011 GMS No application
WDV-G-3
Woodville
73
168
2011 GMS No application
WDV-G-4
Woodville
48
110
WDV-G-5
Woodville
0
23
Total
73
10 83.00
-
148.00
-
363.40
-
-
Planned Development Table, Fenelon Falls Category (Per CKL)
Category for Mapping 1
Category for Mapping 2
Category (Per CKL)
Index
In-service Date
Name of Development (limited to CKL Eng. current appl. reviews)
Location
Type of Development
No. of Lots/Units (Based on Application)
2011 GMS Allocation
Area (ha)
2024 Masterplan Units
2024 Masterplan Population
Committed - Existing
Committed Existing
Committed - Existing
P1
FEN-MOOR
2031
The Moorings on Cameron- 99 Louisa
Fenelon Falls
Residential
57
55
1.72
57
131
Committed - Existing
Committed Existing
Committed - Existing
P1
FEN-MUR
2031
106 Murray Street
Fenelon Falls
Residential
35
30
0.6
35
81
Committed - Existing
Committed Existing
Committed - Existing
P1
FEN-MUSK
2031
Muskoka D&M - West Street, Fenelon
Fenelon Falls
Residential
86
1.94
86
198
2011 GMS - No Application
Committed Future Excluding MZO
Committed - Future
P2
FEN-G-4-Ph 1
2031
Various Properties South of CR 121, East Fenelon Falls of Concession Road
Residential
365
64
278
639
Committed - Future
P2
FEN-G-6
2041
Lands East of Ellice Street, North of Wychwood
Fenelon Falls
Residential
37
3.1
37
28
Committed - Future
P2
FEN-I-B
2041
13 Veterans Way
Fenelon Falls
Residential
12
0.4
12
28
Committed - Future
P2
FEN-I-E
2041
80 Ellice St + Additional lands
Fenelon Falls
Residential
106
3.7
106
244
Committed - Future
P2
FEN-I-G
2041
Jackett - Lands N/E of Fenelon Falls Francis Street East
Residential
40
3.2
40
92
Committed - Future
P2
FEN-I-H
2041
Lands south of Juniper Fenelon Falls St.
Residential
22
3.1
22
51
Committed - Future
P2
FEN-G-1
2041
Black Bear Estates Princess St. West
Fenelon Falls
Residential
48
3.4
48
110
Committed - Future
P2
FEN-G-2
2041
Lands North of CR 121, West of Northline Fenelon Falls Rd
Residential
160
11.4
160
368
2011 GMS - No Application
2011 GMS - No Application
2011 GMS - No Application
2011 GMS - No Application
2011 GMS - No Application
2011 GMS - No Application
2011 GMS - No Application
Committed Future Excluding MZO Committed Future Excluding MZO Committed Future Excluding MZO Committed Future Excluding MZO Committed Future Excluding MZO Committed Future Excluding MZO Committed Future Excluding MZO
278
2011 GMS - No Application
Committed Future Excluding MZO
Committed - Future
P2
FEN-G-4-Ph 2
2041
Various Properties South of CR 121, East Fenelon Falls of Concession Road
Residential
149
365
64
149
343
2011 GMS - No Application
Committed Future Excluding MZO
Committed - Future
P2
FEN-G-4-Ph3
2041
Various Properties South of CR 121, East Fenelon Falls of Concession Road
Residential
219
365
64
219
504
2011 GMS - No Application
Committed Future Excluding MZO
Committed - Future
P2
FEN-G-4-Ph4
Bu ldout
Various Properties South of CR 121, East Fenelon Falls of Concession Road
Residential
249
365
64
249
573
Total
1,073
1,970
289
1,498
3,388
Commercial (ha)
-
Institutional (ha)
-
Planned Development Table, Omemee Category (Per CKL)
Category (Per CKL)
Index
Commited - Existing?
P1
OME-C-1
2011 GMS - No application
P2
2011 GMS - No application
Name of Development (limited to CKL Eng. current appl. reviews)
Green Eden Condominium (40 Mary St W)
Location
Type of No. of Lots/Units Development (Based on Application)
2011 GMS #
2011 GMS Area (ha) Population Commercial Institutional (ha) (ha) Allocation (No. of Units)
Omemee
Site Plan
OME-G-1
Omemee
Residential Subdivision
1
81
186
P2
OME-G-2
Omemee
Residential Subdivision
2
3
7
2011 GMS - No application
P2
OME-G-3
Omemee
Residential Subdivision
3
50
115
2011 GMS - No application
P2
OME-G-4
Omemee
Residential Subdivision
4
24
55
2011 GMS - No application
P2
OME-G-5
Omemee
Residential Subdivision
5
24
55
2011 GMS - No application
P2
OME-G-8
Omemee
Residential Subdivision
8
134
308
2011 GMS - No application
P2
OME-G-9
Omemee
Residential Subdivision
9
111
255
Distillery land Total
30
1.51
69
Omemee 30
427
2
1,051
-
-
Planned Development Table, Bobcaygeon Category (Per CKL)
Categrory (Per CKL)
Category for Mapping
Category for Mapping 2
Index
In-Service Date
Name of Development (limited to CKL Eng. current appl. reviews)
Location
Type of Development
Type of Dev No. of Lots/Units 2011 GMS (Based on Allocation (No. of Application) Units)
Committed - Existing
P1
Commited - Existing
Commited - Existing
BOB-G-ROK-1A
2031
Rokeby Phase-1A
Bobcaygeon
Residential Subdivision
Residential
68
Committed - Existing
P1
Commited - Existing
Commited - Existing
BOB-G-ROK-1B
2031
Rokeby Phase-1B
Bobcaygeon
Residential Subdivision
Residential
35
Committed - Future
P2
Committed - Future Excluding MZO
Commited - Future
BOB-G-ARI
2031
Arizona Heights Phase-2
Bobcaygeon
Residential Subdivision
Residential
70
63
Committed - Future
P2
Committed - Future Excluding MZO
Commited - Future
BOB-G-ROK-2&3
2031
Rokeby - Remaining Draft Plan Approved Bobcaygeon
Residential Subdivision
Residential
280
383
Area (ha)
2024 Masterplan Units
2024 Masterplan Commercial (ha) Population
6
68
156
35
81
6
70
161
10
280
644
Committed - Future
P2
Committed - Future Excluding MZO
Commited - Future
BOB-G-PRI
2031
6 Prince Street East
Bobcaygeon
Residential Condominium, Site Plan
Residential
4
0.08
4
9
Committed - Future
P2
Committed - Future Excluding MZO
Commited - Future
BOB-G-COT
2031
322 Front Street West - Cottage Rentals Bobcaygeon
Residential Condominium, Site Plan, Commercial
Residential
12
0.47
12
28
Committed - Future
P2
Committed - Future Excluding MZO
Commited - Future
BOB-C-KAW
2031
Kawartha Dairy Expansion - Prince St.
Commercial, Site Plan
Employment
-
2.19
0
0
Projected Future
BOB-G-RIV
2031
Riverside Heights- Apex
Bobcaygeon
Residential Subdivision
Residential
63
141
5.6
63
145
Projected Future
BOB-G-5
2041
Bobcaygeon Creeks Inc (Jackett
Bobcaygeon
Residential Subdivision & Condominium, Site Plan?
Residential
214
15.3
214
492
Projected Future
BOB-G-1
2041
Lands East of Oliver's Rd, South of Bick St.
Bobcaygeon
Residential Subdivision?
Residential
80
5.7
80
184
Projected Future
BOB-G-6A
2041
Bobcaygeon Shores / County Rd 36 A
Bobcaygeon
Residential Subdivision
Residential
-33
36.1
-33
-76
Committed - Future
P3
Projected Future Excluding MZO
2011 GMS - No Application
P3
Projected Future Excluding MZO
2011 GMS - No Application
P3
2011 GMS - No Application
P3
2011 GMS - No Application
P3
2011 GMS - No Application
P3
2011 GMS - No Application
P3
2011 GMS - No Application
P3
2011 GMS - No Application
P3
2011 GMS - No Application
P3 P3
No Application Total
P3
Projected Future Excluding MZO Projected Future Excluding MZO Projected Future Excluding MZO Projected Future Excluding MZO Projected Future Excluding MZO Projected Future Excluding MZO Projected Future Excluding MZO Projected Future Excluding MZO Projected Future Excluding MZO Projected Future Excluding MZO
Bobcaygeon
2.19
Projected Future
BOB-G-7
2041
Biglieri Group
Bobcaygeon
Residential Subdivision & Condominium, Site Plan?
Residential
304
10.2
304
699
Projected Future
BOB-I-A
2041
Lands East of West Street, North CR.8
Bobcaygeon
Residential Subdivision?
Residential
53
3.8
53
122
Projected Future
BOB-I-B
2041
Lands North of CR. 8, West of West St.
Bobcaygeon
Residential Subdivision?
Residential
63
4.5
63
145
Projected Future
BOB-I-C
2041
Lands East/West of Bond St.
Bobcaygeon
Residential Subdivision?
Residential
63
4.5
63
145
Projected Future
BOB-G-3
Buildout
Rokeby - Future Phases
Bobcaygeon
Residential Subdivision
Residential
690
49.3
690
1587
Projected Future
BOB-G-6B
Buildout
Bobcaygeon Shores / County Rd 36 B
Bobcaygeon
Residential Subdivision
Residential
142
Projected Future
BOB-G-8
Buildout
Bobcaygeon Expansion - Site A
Bobcaygeon
Projected Future
BOB-I-WAR
Buildout
3332 County Rd. 36 - Kawartha Dairy Warehouse Expansion (Extend Water/Sanitary)
Bobcaygeon
Industrial Site Plan
54.3
142
327
Residential
127
8.75
127
293
Employment
-
18
0
0
591
2,163
241
2,235
Institutional (ha)
18 5,141
20
-
Planned Development Table, Lindsay
Category for Mapping 2
Category for Planning
Committed - Existing
Index
InService Date
P1
LIN-G-2
2023
Committed - Existing
P1
LIN-G-24
Committed - Existing Committed - Existing
P1 P1
Committed - Existing
P1
Committed - Existing
P1
Committed - Existing
Source
SEDC 1-12
Name of Development (limited to CKL Eng. current appl. reviews)
Type of Development1
Type of Dev2
ID
Location
Ravines of Lindsay
2
Lindsay
Residential Subdivision
Residential
2023
Springdale Gardens Phase-3/4
24
Lindsay
Residential Subdivision
Residential
LIN-G-4-Ph 1-2 LIN-G-14
2023 2031
Sugarwood - Craft Ph 1&2 Morningside Phase-2
14
Lindsay Lindsay
Residential Subdivision Residential Subdivision
LIN-G-16
2031
Morningside Phase 2
16
Lindsay
Residential
Fernbrook Homes - Lindsay Street N
20
Lindsay
Residential Condominium
P1
LIN-I-HAM
2031
25 Hamilton Street - Kawartha Housing
HAM
Lindsay
Residential Housing, Site Plan Residential
Committed - Existing
P1
LIN-I-Y
2031
Bloom Reitrement - Fieldgate - 12 Thornhill Rd
Y
Lindsay
Residential Condominium
Residential
Committed - Future Committed - Future
P2A P2A
LIN-G-1 LIN-G-15
2031 2031
Tribute North multiple properties, Dobson, CKL Rd 36 (13 properties) includes Morningside Phase 2 842004 Ontario Inc. (?? Not Pat Murphy) -former springdale lagoons (165106000215100) Woods of Jennings Creek Phase-2/3
1 15
Lindsay Lindsay
Residential Subdivision
Mixed use Residential
P2A
LIN-G-21
2031
Committed - Future
P2A
LIN-G-22
2031
21
Lindsay
22
Lindsay
2024 Masterplan Units
2024 Masterplan Population
Serviced Area (ha)
146
141
146
336
12.58
71
188
5.58
P2A
LIN-G-27
2031
77-83 William Street
27
Lindsay
Committed - Future Committed - Future
P2A P2A P2A
LIN-G-3 LIN-I-EE LIN-SPA-1-07
2031 2031 2031
Tribute South Denfield Property, CKL (165102000104200) Ph1 18 Logie st
3 EE 1-07
Lindsay Lindsay Lindsay
SEDC 1-07
163 775
55
114
55
127
6.69
32
51
32
74
4.12
Residential
155
134
155
357
5.72
46
106
0.86
46 221
87
221
508
1.37
1884
1832
1884
4333
126.20
202
149
202
465
9.70
15
15
35
1.00
235
169
389
6.78
110
253
0.28
839 180
1032 50
2374 115
73.10 0.48
3.90
94
94
216
12.53
1.18
45
45
104
1.40
223
223
513
2.90
0
0
3.05
80
184
0.47
Residential Residential Subdivision
Residential Condominium, Site Plan Residential Subdivision Mixed Use
2.80
Residential Mixed use Residential Mixed use
110 1032
Committed - Future
Committed - Future
P2A
SEDC 1-08
LIN-SPA-1-08
2031
P2A
SEDC 1-09
LIN-SPA-1-09
2031
Lepha Development - 331 Logie Street 165104000217300 18 Logie St (165104000217301; 165104000114400)
1-08
Lindsay
Residential Condominium
Residential
1-09
Lindsay
Residential
Residential
Bromont Melody Gardens - Commercial - 368 Angeline St South Best Western Hotel - 140 Angeline Street South Riverwalk, Riverview Estates (165100600600200; 165103000245605) North of 68 Lindsay St N (Housing Pledge)
MEL
Lindsay
Commercial (Angeline/Hwy 7) Employment
10 19
Lindsay Lindsay
Hotel Residential , Condminium?
32 1-23 D E Q
Lindsay Lindsay Lindsay Lindsay Lindsay
Committed - Future
Projected Future - Employment Only
P2B
LIN-E-MEL
2031
Projected Future
P2B P2B
LIN-G-10 LIN-G-19
2031 2031
LIN-G-32 LIN-I-1-23 LIN-I-D LIN-I-E LIN-I-Q
2031 2031 2031 2031 2031
Projected Future
Projected Future Projected Future Projected Future Projected Future Projected Future
P3 P3 P2B P2B P2B
Housing pledge SEDC 1-23
Arbour Village, 20 Green Arbour Way, MVW MVW - Adelaide St. South (165102000142799) multiple properties, 30 Logie St (Womens Resources), Eastview Rd
Institutional (ha)
Residential 169
Committed - Future
71 337
Commercial (ha)
Residential
2031
Committed - Future
2011 GMS Allocation (No of Units)
337
LIN-G-20
SEDC 1-13
No. of Lots/Units (Based on Application)
multi-res multi-res Women's Resources, 6 apartments
-
Residential Residential
80
36
71
119
71
163
8.25
Residential Residential Residential Residential Residential
50 45 53 147
45 50 135
50 45 53 147
115 104 122 338
2.96 2.50 0.90
6
30
6
14
3.90
2.40
1.56
Committed - Future
P2A
Committed - Future
P2A
Committed - Future
P2A
Committed - Future
P2A
MZO MZO Projected Future - Employment Only
P3 P3 P3
SEDC 1-01; 1-02(i); 104(3); 1-05(i)(2) SEDC 1-01; 1-02(i); 104(3); 1-05(i)(2) SEDC 1-01; 1-02(i); 104(3); 1-05(i)(2) SEDC 1-01; 1-02(i); 104(3); 1-05(i)(2)
LIN-I-3
2031
Bromont (Gateway)
Bromont-4
Lindsay
Residential
LIN-I-4
2031
Bromont (Gateway)
Bromont-5
Lindsay
Residential
LIN-I-5
2031
Bromont (Gateway)
Bromont-6
Lindsay
Residential
LIN-I-6
2031
Bromont (Gateway)
Bromont-7
Lindsay
Mixed use
LIN-FLATO-6 LIN-FLATO-8 LIN-G-28
2031 2031 2031
Flato Flato 0 Angeline St N (Block 16, 57M 782)
Flato-6 Flato-8 28
Lindsay Lindsay Lindsay
Projected Future
P2B
LIN-I-A
2031
100 Chadwin Drive - Colborn Street West - Condo
Committed - Future Committed - Existing
P2A P1
LIN-I-WEL LIN-G-4 Ph 3-7
2031 2031
Wellings of Lindsay – 400 Kent St W Sugarwood - Craft Ph 3-7
Committed - Future Committed - Existing
P2A P1
LIN-I-EE Ph2 LIN-I-SKY
2041
Committed - Future Committed - Future
P2A P2A
2041
SEDC 1-02(2)
LIN-G-6 LIN-SPA-1-02
Committed - Future Committed - Future
P2A P2A
SEDC 1-03 SEDC 1-04 (1&2)
LIN-SPA-1-03 LIN-SPA-1-04
2041
Projected Future
P2B P4 P3 P4 P4 P4 P5 P5 P5 P5 P5 P5 P5 P5
GMS memo (fig 9)
LIN-G-11 LIN-BRO-1 LIN-BRO-8 LIN-FLATO-2 LIN-FLATO-5 LIN-FLATO-7 LIN-E-1-1 LIN-E-1-10 LIN-E-1-11 LIN-E-1-12 LIN-E-1-13 LIN-E-1-14 LIN-E-1-15 LIN-E-1-17
Denfield Property, CKL (165102000104200) Ph2 Skyline Apartments (165104000217469, 57M 799, Block 39) Pearson Phase 5+, Stollar (165102000150005) 282 Lindsay St S (lindsay golf club) 165100600030304900 1-03 (364 Lindsay St. S) 165100600304300 344 & 354 Lindsay St S (1651006000304600; 165100600304500) 238 Angeline St S (Fleming college) Bromont (Callaghan) MZO Bromont (Angeline) Flato Flato Flato E-1-1 E-1-10 E-1-11 E-1-12 E-1-13 E-1-14 E-1-15 E-1-17
MZO MZO MZO MZO MZO Projected Future - Employment Only Projected Future - Employment Only Projected Future - Employment Only Projected Future - Employment Only Projected Future - Employment Only Projected Future - Employment Only Projected Future - Employment Only Projected Future - Employment Only
2041
2041
2041 2041 2041 2041 2041 2041 2041 2041 2041 2041 2041 2041 2041 2041 2041
A
Lindsay
4
Lindsay Lindsay
EE
Lindsay Lindsay
6 1-02
Lindsay Lindsay
1-03 1-04
Lindsay Lindsay
11 Bromont-1 Bromont-8 Flato-2 Flato-5 Flato-7 E-1-1 E-1-10 E-1-11 E-1-12 E-1-13 E-1-14 E-1-15 E-1-17
Lindsay Lindsay Lindsay Lindsay Lindsay Lindsay Lindsay Lindsay Lindsay Lindsay Lindsay Lindsay Lindsay Lindsay
Residential Commercial Commercial site plan (Hotel & Employment retail building
Residential Condominium, Site Plan
Residential
Residential Subdivision
Residential Mixed use
Residential Condominium
Residential Residential
72
0
72
166
4.71
-
-
4
0
4
9
0.24
-
-
15
0
15
35
1.01
-
-
458
0
458
1053
29.86
1.40
1.63
113 0
0 0
113 0
260 0
3.26 7.26
3.64
-
0
0
0.75
0.75
128
294
1.12
127
292
2.26
765
399
918
57.48
180
130
299
0.48
158
363
1.58
830
830
1909
18.10
104
399
158
Residential Employment Existing Gas Station Commercial
Employment Employment
Vacant Employment Land Vacant Employment Land Vacant Employment Land Vacant Employment Land Vacant Employment Land Vacant Employment Land Vacant Employment Land Vacant Employment Land
Residential Residential Residential Residential Residential Residential Employment Employment Employment Employment Employment Employment Employment Employment
418
127
1119 591 1127 350 507
308 0 0 0 0 0
5.61
0
0
3.00
3.00
0
0
1.24
1.24
0
0
4.09
4.09
308 1119 591 1127 350 507 0 0 0 0 0 0 0
708 2574 1359 2592 805 1166 0 0 0 0 0 0 0
20.00 65.57 35.62 69.18 19.74 24.07 0.45 2.66 3.33 3.56 4.53 8.39 14.23
0.45 2.66 3.33 3.56 4.53 8.39 14.23
0
0
139.63
20.50
-
Projected Future - Employment Only
P5
GMS memo (fig 9)
LIN-E-1-18
Projected Future - Employment Only
P5
GMS memo (fig 9)
LIN-E-1-19
Projected Future - Employment Only Projected Future - Employment Only
P5 P5
2041
GMS memo (fig 9)
LIN-E-1-2 LIN-E-1-20
Projected Future - Employment Only Projected Future - Employment Only Projected Future - Employment Only Projected Future - Employment Only Projected Future - Employment Only Projected Future - Employment Only
P5 P5 P5 P5 P5 P5
LIN-E-1-3 LIN-E-1-4 LIN-E-1-5 LIN-E-1-6 LIN-E-1-7 LIN-E-1-8
2041 2041 2041 2041 2041
Projected Future - Employment Only Projected Future - Employment Only Committed - Future Committed - Future Committed - Future
P5 P5 P2A P2A P2A
LIN-E-1-9 LIN-E-2-1 LIN-I-AA LIN-E-AIR LIN-G-25
Committed - Future Committed - Future
P2A P2A
LIN-I-BB LIN-I-C
Committed - Future
P2A
SEDC 1-22
LIN-I-FF
Committed - Future
P2A
SEDC 1-15
LIN-I-GG
Committed - Future
P2A
SEDC 1-16
LIN-I-HH
Committed - Future
P2A
SEDC 1-22
LIN-I-II
Committed - Future
P2A
SEDC 1-22
LIN-I-JJ
Committed - Future
P2A
SEDC 1-10
LIN-I-P
Committed - Future
P2A
SEDC 1-11
LIN-I-SCH
Committed - Future
P2A
LIN-I-Z1
Committed - Future Committed - Future
P2A P2A
LIN-I-Z2 LIN-I-Z3
2041 2041
2041
2041
E-1-18
E-1-18
Lindsay
Vacant Employment Land
Employment
E-1-19
E-1-19
Lindsay
Vacant Employment Land
Employment
E-1-2 E-1-20
E-1-2 E-1-20
Lindsay Lindsay
Vacant Employment Land Vacant Employment Land
Employment Employment
0
E-1-3 E-1-4 E-1-5 E-1-6 E-1-7 E-1-8
E-1-3 E-1-4 E-1-5 E-1-6 E-1-7 E-1-8
Lindsay Lindsay Lindsay Lindsay Lindsay Lindsay
Vacant Employment Land Vacant Employment Land Vacant Employment Land Vacant Employment Land Vacant Employment Land Vacant Employment Land
Employment Employment Employment Employment Employment Employment
0 0 0 0 0 0
0
1.34
1.34
E-1-9 E-2-1 AA Airport 25
Lindsay Lindsay Lindsay Lindsay Lindsay
Vacant Employment Land Vacant Employment Land
Employment Employment Residential Employment Residential
0 0 67 0
1.76 0.70 0.72 0.96
1.76 0.70
29 0
0 0 29 0
29
29
67
1.90
BB C
Lindsay Lindsay
Residential Residential
75 Logie St (formerly Kinrys) 165104000114100
FF
Lindsay
Residential
Logie St (165104000114120)
GG
Lindsay
Residential
Logie St, (Staples) (165104000114500)
HH
Lindsay
Residential
53 Logie St
II
Lindsay
Residential
61 Logie St (165104000113700)
JJ
Lindsay
Residential
P
Lindsay
Residential
SCH
Lindsay
Employment
Z1
Lindsay
Residential
Z2 Z3
Lindsay Lindsay
Residential Residential
2041 E-1-9 2041 E-2-1 Buildout 236 Angeline St N (Tahiliani) Buildout Airport Church Block, corner of Connolly & Angeline St N Buildout (165101000387800) Buildout 21 David Dr (Kennedy, formerly Mackey) Lafarge, Broad St, Angeline St S (165102000152300) Buildout Buildout Buildout Buildout Buildout Buildout
Bromont, formerly Rowat, Logie Buildout St.(165104000217200) School Block, Dobson & Logie (165104000114200) Buildout Buildout
Stollar, east side St. Joseph Rd (165101000102910)
Buildout Stollar, 35 Angeline St N Buildout Province of Ontario, 322 Kent St W
GMS showed Stollar
0
0
0 0 0 0 0
77.98
20.50
38.81
20.50
0.49
0.49
75.13
20.50
0.80 0.86 1.04 1.23 1.31
0.80 0.86 1.04 1.23 1.31
84
84
193
2.10
211
211
485
13.70
19
19
44
0.45
18
18
41
1.00
40
40
92
0.42
18
18
41
0.45
17
17
39
0.42
240
240
552
3.01
0
0
664
664
1527
8.30
53 128
53 128
122 294
0.85 1.60
0.96
-
2.58
Committed - Future Committed - Future
P2A P2A
Projected Future
P3
LIN-G-30
Projected Future
P4
LIN-G-31
Projected Future
Projected Future
Projected Future
P3
P3
P3
Projected Future
P2B
Projected Future
P2B
Projected Future
P2B
Projected Future
P2B
SEDC 1-06 SEDC 1-21 (1,2,3)
Employment conversion (Fig 6 of GMS memo) Employment conversion (Fig 6 of GMS memo) Employment conversion (Fig 6 of GMS memo)
LIN-SPA-1-06 LIN-SPA-1-21
LIN-I-1EC
LIN-I-4EC
Employment Residential
30
Lindsay
Residential
31
Lindsay
Residential
1EC
Lindsay
Residential
55 Mary St
4EC
Lindsay
Residential
LIN-I-H1
Seniors Residence - Old Fairgrounds Buildout (165101000138420) 100 Albert St,Terrasan, old Trent Rubber Buildout 45 James St,
LIN-I-H2
0
0
0.61
57
57
131
1.45
207
207
476
0.31
500
1150
42.24
56
56
129
1.40
80
80
184
2.00
320
320
736
8.00
418
176
405
1.00
309
309
711
23.70
92
92
212
2.30
192
192
442
4.80
84 80 8 120 70
84 80 8 104 70
193 184 18 239 161
2.10 2.00 0.20 0.96 0.80
200
200
460
0.80
48
48
110
1.20
110
110
253
1.45
1725
0
1725
3968
725 1470 406 420 903 765 754 800
0 0 0 0 0 0 0 0
725 1470 406 420 903 765 754 800
1668 3381 934 966 2077 1760 1734 1840
69
69
159
4.50
500
6EC
Lindsay
B
Lindsay
H1
Lindsay
Residential
H2
Lindsay
Residential
0
Residential Condominium, Site Plan
Residential
176
Buildout LIN-I-H3
Projected Future Projected Future
P2B P2B
LIN-I-W LIN-I-X
Committed - Future
P2A
MZO MZO MZO MZO MZO MZO MZO MZO
P4 P4 P4 P4 P4 P4 P4 P4 P2B
LIN-I-2 LIN-FLATO-1 LIN-FLATO-10 LIN-FLATO-11 LIN-FLATO-12 LIN-FLATO-13 LIN-FLATO-3 LIN-FLATO-4 LIN-FLATO-9 LIN-G-26
multiple properties, Mary St, Hamilton St, George St, Buildout James St
H3
Buildout Rexton, between Albert & Hamilton, Durham St Buildout 1 Fleetwood Road, Brooklin Concrete Buildout multiple properties, 44 Victoria Ave, Durham St Buildout Victoria Station - 33 Victoria Ave South Buildout Rivermill, Kawartha Gates, Blocks AA & U 1 Needham, 2 Needham, 4 Needham, 103 St. Paul, 89 Buildout St. Paul, 87 St. Paul Buildout Paul Tunstell Estate, 181 St. Patrick St Stollar, along Scugog River, between Pottinger & Buildout Regent St (165101000329300) Bromont remaining SEDC Buildout
J KK M N U V
Lindsay Lindsay Lindsay Lindsay Lindsay Lindsay
W X
Lindsay Lindsay
Buildout Buildout Buildout Buildout Buildout Buildout Buildout Buildout
Flato Flato Flato Flato Flato Flato Flato Flato Ibrans (formerly Pyle) - 197 St. Peter Buildout (165103000143900, 165103000143800
0.61
-
-
43.13
-
-
40.49 80.66 20.60 21.33 62.44 43.17 42.52 40.58
-
-
160.26
5.77
Residential
Buildout
LIN-I-J LIN-I-KK LIN-I-M LIN-I-N LIN-I-U LIN-I-V
Total
Commercial Residential
197 St. Peter St.
Commerce Rd (South of Lindsay Mall)
LIN-I-6EC
P2B P2B P2B P2B P2B P2B
Projected Future
Lindsay Lindsay
Buildout
Projected Future Projected Future Projected Future Projected Future Projected Future Projected Future
SEDC background study (AECOM)
1-06 1-21
Buildout
LIN-I-B Employment conversion (Fig 6 of GMS memo) Employment conversion (Fig 6 of GMS memo) Employment conversion (Fig 6 of GMS memo)
Buildout 256 Lindsay St S (165100600305300) 257,279&281 Lindsay St S (1651006000301300, Buildout 1651006000301301, 1651006000301400 46-64 &66 Williiam St N (Based on D06 - 2020 -23 Buildout Application) East lindsay donut hole Buildout
Lindsay
Residential
Residential Condominium
Residential Residential Residential Residential Residential Residential
104
Residential Residential
I-2
Lindsay
Residential
Flato-1 Flato-10 Flato-11 Flato-12 Flato-13 Flato-3 Flato-4 Flato-9 26
Lindsay Lindsay Lindsay Lindsay Lindsay Lindsay Lindsay Lindsay Lindsay
Residential Residential Residential Residential Residential Residential Residential Residential Residential
19,886
10,162
23,986
55168
1570.31
Technical Memorandum 5 Kawartha Lakes Water-Wastewater Master Plan Capacity Assessment
APPENDIX B COMMUNITY PLANNING INFORMATION MAPS
¯ LIN-E-1-20 LIN-G-24 LIN-G-1
Legend
LIN-G-21
LIN-G-22
LIN-E-1-17
LIN-G-2 LIN-E-AIR
LIN-G-19
LIN-G-25
Landuse_Type
LIN-I-1EC LIN-E-1-2 LIN-E-1-3 LIN-E-1-14 LIN-G-26
LIN-I-BB
LIN-I-W LIN-I-V
Vacant/ Unserviced
LIN-E-1-4 LIN-E-1-7
LIN-E-1-10
LIN-G-3
Settlement Boundary
LIN-G-20
LIN-I-AA
LIN-E-1-12
LIN-I-KK
LIN-E-1-9
Committed - Existing
LIN-E-1-15 LIN-FLATO-3
Committed - Future MZO
LIN-E-1-5 LIN-E-1-13
Projected Future
LIN-I-U
LIN-G-4
LIN-FLATO-7
LIN-I-X LIN-E-1-11
LIN-E-1-1
LIN-E-1-8 LIN-FLATO-8
LIN-E-1-6
LIN-G-32 LIN-I-Y
LIN-I-Z1
LIN-I-Z2
LIN-I-Z3
LIN-I-WEL
LIN-I-A
LIN-FLATO-1
LIN-G-30
LIN-G-28
LIN-I-6EC
LIN-E-1-19
LIN-I-M
LIN-I-C LIN-E-1-18
LIN-I-E LIN-I-D
LIN-I-FF LIN-I-1-23
LIN-E-2-1 LIN-I-H3
LIN-I-GG LIN-I-HH
LIN-I-H2
LIN-G-6
LIN-I-P
LIN-I-H1
LIN-G-10
LIN-G-16 LIN-G-14
LIN-I-SCH
LIN-I-2
LIN-SPA-1-09
LIN-SPA-1-08
LIN-FLATO-13
LIN-FLATO-12
LIN-FLATO-11
LIN-I-2
LIN-SPA-1-06
LIN-SPA-1-21
LIN-I-3 LIN-I-4 LIN-I-5
LIN-SPA-1-02
Kawartha Lakes W-WW Master Plan
LIN-I-2
LIN-SPA-1-04 LIN-SPA-1-03
LIN-I-6
Lindsay Developments
LIN-E-MEL
0
0.375 0.75
1.5
2.25
3 Kilometers
TY Lin Project #: 10599
LIN-BRO-1
LIN-SPA-1-07
LIN-BRO-8
LIN-FLATO-10
LIN-G-31 LIN-G-15
LIN-I-SKY
LIN-G-11
LIN-FLATO-9
LIN-I-II
LIN-I-4EC LIN-G-6
LIN-FLATO-2
LIN-I-JJ
LIN-I-J LIN-I-HAM
LIN-FLATO-6
LIN-I-Q
LIN-I-N
LIN-I-EE
LIN-G-6
LIN-FLATO-5
LIN-G-27
LIN-I-B
Projected Future - Employment Only
LIN-FLATO-4
DRAWN BY: JA Sources: Esri, HERE, Garmin, Intermap, increment P Corp.,
DATE: January 2025
¯ Legend
OWD-G-1
Oakwood_developments Settlement Boundary
OWD-G-2 OWD-G-4
OWD-G-3
TY Lin Project #: 10599
OWD-G-5 Kawartha Lakes W-WW Master Plan Oakwood Developments
0
0.125 0.25
0.5
0.75
1 Kilometers
DRAWN BY: JA Sources: Esri, HERE, Garmin, Intermap, increment P Corp.,
DATE: January 2025
¯ Legend Settlement Boundary
BOB-G-ARI
Category
BOB-G-8 BOB-G-RIV
Commited - Existing Commited - Future Projected Future
BOB-G-1 BOB-I-A
BOB-I-B
BOB-G-ROK-2&3
BOB-C-KAW
BOB-G-PRI
BOB-I-C BOB-G-5
BOB-G-ROK-1B BOB-G-ROK-1A BOB-G-3
BOB-G-COT
BOB-G-6A BOB-G-7
BOB-G-6B
Kawartha Lakes W-WW Master Plan
BOB-I-WAR
Bobcaygeon Planning Information 0
500
1,000
1,500
2,000 Meters
SCALE:1:20,000
Sources: Esri, HERE, Garmin, Intermap, increment P Corp.,
TY Lin Project #: DATE: January 2025 10599
1 12 D RO A
T
CO UN TY
TR EE AL BE RT S
PR IN
S DD DO
CE
ST
FEN-G-2
S
S
EE TR
RE
ET
T
WE
ST
STRE
T SH OR
RO
T
BO RN ES
T ST RE E
NE DY DR IV E
FEN-G-4
G KIN
T
TR EE
T
TR EE MU RR AY S
L IN DS AY S
ER AN SW AY
FEN-I-G
FEN-I-H
PE
R
ST RE
D OA
T
JU NI
TR O IN
VE T
NP
TR EE
AD RO
FEN-I-B
OT S
IV E DR
IO N
8
EL LI
DA L IS JAN
ET TRE
SS NCE CO
ET
N
AD RO
EET ST R
E STR
ST WE
E IOL OR
O AD TY R COUN
EET ST R
EO RG STU
KE N
T
Committed - Future
IN S EL G
N HELE
Urban Settlement Boundary Committed - Existing
CL IFT ON
RE E
8
Category
CO L ST
AD
TR EE T
JO HN ST RE E
T
Y
OA K
Legend
NT
ST RE E
ET
U CO
QU EE N
FEN-MOOR
FEN-MUSK
¯
REET
STREET
FEN-G-1
ET
FEN-I-E FEN-MUR HW
T
S ICE EL L
E RIV R IV RD
L RIA UST IND
FEN-G-6
ET TR E
C WY
EN SC RE DC O O
E
K PAR
AD 121
VE DRI
N FRA
CIS
EE STR
TE
AST
COUNTY RO
Kawartha Lakes W-WW Master Plan B RA YS
1.2
Kilometers 1.6
T
0.8
TH SO U
0.4
EET ST R
0.2
EE TR
ST WE
0
Fenelon Falls SCALE:1:11,852
Sources: Esri, HERE, Garmin, Intermap, increment P Corp.,
TY Lin Project #: DATE: January 2025 10599
¯ OME-G-2
OME-G-1
Legend Urban Settlement Boundary
OME-G-3
OME-G-4
Category
OME-G-5
2011 Growth Management Strategy Active development application
OME-C-1 OME-G-8
TY Lin Project #: 10599
OME-G-9
Kawartha Lakes W-WW Master Plan Omemee Planning Information 0
125
250
500
750
1,000 Meters
SCALE:1:10,000
Sources: Esri, HERE, Garmin, Intermap, increment P Corp.,
DRAWN BY: JA
DATE: January 2025
¯ Legend Settlement boundary Woodville Developments
WDV-G-4
WDV-G-3
WDV-G-2
WDV-G-1
TY Lin Project #: 10599
Kawartha Lakes W-WW Master Plan Woodville Planning information
0
125
250
500
750
1,000 Meters
SCALE:1:10,000
Sources: Esri, HERE, Garmin, Intermap, increment P Corp.,
DRAWN BY: JA
DATE: January 2025
Technical Memorandum 5 Kawartha Lakes Water-Wastewater Master Plan Capacity Assessment
APPENDIX C COMMUNITY PHASING INFORMATION MAPS
¯ LIN-E-1-20 LIN-G-24 LIN-G-1
Legend
LIN-G-21
LIN-G-22
LIN-E-1-17
LIN-G-2 LIN-E-AIR
LIN-G-19
LIN-G-25
2041_phasing_Developments
LIN-I-1EC LIN-E-1-2 LIN-E-1-3 LIN-E-1-14 LIN-G-26
LIN-I-BB
LIN-I-W LIN-I-V
2031_phasing_Developments
LIN-E-1-4 LIN-E-1-7
LIN-E-1-10
LIN-G-3
Settlement Boundary
LIN-G-20
LIN-I-AA
LIN-E-1-12
LIN-I-KK
LIN-E-1-9
2051_phasing_Developments
LIN-E-1-15 LIN-FLATO-3 LIN-E-1-5 LIN-E-1-13
LIN-I-U
LIN-G-4
LIN-FLATO-7
LIN-I-X LIN-E-1-11
LIN-E-1-1
LIN-E-1-8
LIN-E-1-6
LIN-FLATO-8
LIN-G-32 LIN-I-Y
LIN-I-Z1
LIN-I-Z2
LIN-I-Z3
LIN-I-WEL
LIN-I-A
LIN-FLATO-1
LIN-G-30
LIN-G-28
LIN-I-6EC
LIN-E-1-19
LIN-I-M
LIN-I-C LIN-E-1-18
LIN-I-E LIN-I-D
LIN-I-FF LIN-I-1-23
LIN-E-2-1
LIN-I-GG LIN-I-HH
LIN-I-4EC LIN-I-H2
LIN-G-6
LIN-I-P
LIN-I-H1
LIN-G-10
LIN-G-16 LIN-G-14
LIN-I-SCH
LIN-I-2
LIN-SPA-1-09
LIN-SPA-1-08
LIN-FLATO-13
LIN-FLATO-12
LIN-FLATO-11
LIN-I-2
LIN-SPA-1-06
LIN-SPA-1-21
LIN-I-3 LIN-I-4 LIN-I-5
LIN-SPA-1-02
Kawartha Lakes W-WW Master Plan
LIN-I-2
LIN-SPA-1-04 LIN-SPA-1-03
LIN-I-6
Lindsay Phasing Time Horizon 2031 to 2051
LIN-E-MEL
0
0.375 0.75
1.5
2.25
3 Kilometers
TY Lin Project #: 10599
LIN-BRO-1
LIN-SPA-1-07 LIN-G-11
LIN-FLATO-10
LIN-G-31 LIN-G-15
LIN-I-SKY
LIN-BRO-8
LIN-FLATO-9
LIN-I-II
LIN-I-H3
LIN-G-6
LIN-FLATO-2
LIN-I-JJ
LIN-I-J LIN-I-HAM
LIN-FLATO-6
LIN-I-Q
LIN-I-N
LIN-I-EE
LIN-G-6
LIN-FLATO-5
LIN-G-27
LIN-I-B
LIN-FLATO-4
DRAWN BY: JA Sources: Esri, HERE, Garmin, Intermap, increment P Corp.,
DATE: January 2025
¯ BOB-G-8 BOB-G-ARI
BOB-G-RIV
Legend Settlement Boundary
BOB-G-1
2031_Phasing 2041_Phasing 2051_Phasing
BOB-I-A
BOB-G-PRI
BOB-I-B
BOB-C-KAW
BOB-I-C BOB-G-ROK-2&3
BOB-G-5
BOB-G-ROK-1B
BOB-G-ROK-1A
BOB-G-3 BOB-G-COT
BOB-G-6A
BOB-G-7
BOB-G-6B
Kawartha Lakes W-WW Master Plan Bobcaygeon Phasing Time Horizon 2031 to 2051
0
375
750
1,125
1,500 Meters
BOB-I-WAR
SCALE:1:15,000
Sources: Esri, HERE, Garmin, Intermap, increment P Corp.,
TY Lin Project #: DATE: January 2025 10599
1 12 D RO A
T
CO UN TY
TR EE AL BE RT S
PR IN
S DD DO
CE
ST
FEN-G-2
S
S
EE TR
RE
ET
T
WE
ST
STRE
T SH OR
RO
T
BO RN ES
T ST RE E
NE DY DR IV E
FEN-G-4 FEN-G-4
G KIN
T
TR EE
T
TR EE MU RR AY S
L IN DS AY S
ER AN SW AY
FEN-I-G
FEN-I-H
PE
R
ST RE
D OA
T
JU NI
TR O IN
VE T
NP
TR EE
AD RO
FEN-I-B
OT S
IV E DR
IO N
8
EL LI
DA L IS JAN
ET TRE
SS NCE CO
ET
N
AD RO
EET ST R
E STR
ST WE
E IOL OR
O AD TY R COUN
EET ST R
EO RG STU
KE N
T
IN S EL G
N HELE
Urban Settlement Boundary 2041_Phasing
CL IFT ON
RE E
8
2031_Phasing
CO L ST
AD
TR EE T
JO HN ST RE E
T
Y
OA K
Legend
NT
ST RE E
ET
U CO
QU EE N
FEN-MOOR
FEN-MUSK
¯
REET
STREET
FEN-G-1
ET
FEN-I-E FEN-MUR HW
T
S ICE EL L
E RIV R IV RD
L RIA UST IND
FEN-G-6
ET TR E
C WY
EN SC RE DC O O
E
K PAR
AD 121
VE DRI
N FRA
CIS
EE STR
TE
AST
COUNTY RO
Kawartha Lakes W-WW Master Plan B RA YS
Fenelon Falls Phasing Time Horizon 2031 to 2051
1.2
Kilometers 1.6
T
0.8
TH SO U
0.4
EET ST R
0.2
EE TR
ST WE
0
SCALE:1:11,852
Sources: Esri, HERE, Garmin, Intermap, increment P Corp.,
TY Lin Project #: DATE: January 2025 10599
Project File Report Kawartha Lakes Water-Wastewater Master Plan Capacity Assessment
APPENDIX D NATURAL HERITAGE CONSTRAINTS STUDY
Docusign Envelope ID: 3BB3DE27-AB4C-4FB5-8872-CE98205F5E40
Natural Heritage Constraints Study – City of Kawartha Lakes Water and Wastewater Master Plan January 22, 2025 Prepared for: TY Lin International
Cambium Reference: 15069-001
CAMBIUM INC. 866.217.7900 cambium-inc.com
Docusign Envelope ID: 3BB3DE27-AB4C-4FB5-8872-CE98205F5E40
Natural Heritage Constraints Study – City of Kawartha Lakes Water and Wastewater Master Plan TY Lin International Cambium Reference: 15069-001 January 22, 2025
Table of Contents 1.0
Introduction.......................................................................................................1
1.1
Study Area................................................................................................................... 1
2.0
Natural Heritage Policy Context ......................................................................2
2.1
Provincial Planning Statement, 2024........................................................................... 2
2.2
Endangered Species Act, 2007 ................................................................................... 3
2.3
City of Kawartha Lakes Official Plans.......................................................................... 4
2.4
Conservation Authorities Act ....................................................................................... 4
2.5
Species at Risk Act ..................................................................................................... 5
2.6
Fisheries Act................................................................................................................ 5
2.7
Migratory Birds Convention Act, 1994 ......................................................................... 6
3.0
Technical Approach and Data Collection Methods.......................................7
3.1
Background Information Review.................................................................................. 7
3.2
Species at Risk Screening........................................................................................... 7
4.0
Natural Heritage Features and Functions ......................................................9
4.1
Wetlands ..................................................................................................................... 9
4.1.1
Significant Wetlands .................................................................................................... 9
4.1.2
Unevaluated Wetlands .............................................................................................. 10
4.2
Significant Woodlands ............................................................................................... 10
4.3
Significant Valleylands .............................................................................................. 11
4.4
Significant Wildlife Habitat ......................................................................................... 11
4.5
Significant Areas of Natural and Scientific Interest .................................................... 13
4.6
Fish Habitat ............................................................................................................... 14
4.7
Habitat of Endangered and Threatened Species....................................................... 14
5.0
Closing ........................................................................................................... 17
6.0
References ..................................................................................................... 18
7.0
Glossary of Terms ......................................................................................... 20
Cambium Inc.
Page i
Docusign Envelope ID: 3BB3DE27-AB4C-4FB5-8872-CE98205F5E40
Natural Heritage Constraints Study – City of Kawartha Lakes Water and Wastewater Master Plan TY Lin International Cambium Reference: 15069-001 January 22, 2025
List of Appended Figures Figure 1
Bobcaygeon Natural Heritage Features
Figure 2
Fenelon Falls Natural Heritage Features
Figure 3
Lindsay Natural Heritage Features
Figure 4
Omemee Natural Heritage Features
List of Appendices Appendix A Species at Risk Screening Appendix B Significant Wildlife Habitat Assessment
Cambium Inc.
Page ii
Docusign Envelope ID: 3BB3DE27-AB4C-4FB5-8872-CE98205F5E40
Natural Heritage Constraints Study – City of Kawartha Lakes Water and Wastewater Master Plan TY Lin International Cambium Reference: 15069-001 January 22, 2025
1.0
Introduction
Cambium Inc. (Cambium) was retained by TY Lin International (the Client) to conduct a desktop-based Natural Heritage Constraints Study (the Study) for the Kawartha Lakes Water and Wastewater Master Plan (the Project). Cambium understands that the Client is conducting a Master Plan Update on behalf of The City of Kawartha Lakes (The City) to evaluate and inform future growth planning for Water and Wastewater Servicing. The purpose of the subject Study is to identify natural heritage features documented within the Study Area (as identified in Figure 1 to Figure 4), that should be considered during the development of future water and wastewater improvement planning. We note that the Study does not evaluate potential impacts to natural heritage features, or provided recommended mitigation measures for potential works, as no proposed alternatives were provided at the time of reporting. As directed, the Study is intended to serve as a desktop inventory of documented natural heritage features within the respective study limits.
1.1 Study Area The Study Area for the Study includes the Settlement Areas of Bobcaygeon, Fenlon Falls, Lindsay, and Omemee and a 3 km buffer surrounding each settlement areas as shown on Figure 1, Figure 2, Figure 3, and Figure 4.
Cambium Inc.
Page 1
Docusign Envelope ID: 3BB3DE27-AB4C-4FB5-8872-CE98205F5E40
Natural Heritage Constraints Study – City of Kawartha Lakes Water and Wastewater Master Plan TY Lin International Cambium Reference: 15069-001 January 22, 2025
2.0
Natural Heritage Policy Context
The evaluation of the natural heritage features present within the Study Area was undertaken to meet the requirements of the following legislation, plans and policies: •
Provincial Planning Statement (PPS), 2024
•
Endangered Species Act (ESA), 2007
•
Fisheries Act, 2019
•
Species at Risk Act (SARA), 2002
•
Migratory Birds Convention Act (MBCA), 1994
•
Conservation Authorities Act, 1990
•
City of Kawartha Lakes Official Plan, 2012
2.1 Provincial Planning Statement, 2024 The PPS provides direction on matters of provincial interest related to land use planning and development. Section 4.1 of the PPS (Ministry of Municipal Affairs and Housing, 2024) protects the form and function of eight types of significant natural heritage features, which include: •
significant wetlands in Ecoregions 5E, 6E, and 7E
•
significant coastal wetlands
•
significant woodlands in Ecoregions 6E and 7E
•
significant valleylands in Ecoregions 6E and 7E
•
significant wildlife habitat (SWH)
•
significant areas of natural and scientific interest (ANSI)
•
fish habitat
•
habitat of endangered and threatened species
•
coastal wetlands in Ecoregions 5E, 6E, and 7E
Cambium Inc.
Page 2
Docusign Envelope ID: 3BB3DE27-AB4C-4FB5-8872-CE98205F5E40
Natural Heritage Constraints Study – City of Kawartha Lakes Water and Wastewater Master Plan TY Lin International Cambium Reference: 15069-001 January 22, 2025
Given their significance, development and site alteration are prohibited within provincially significant wetlands (PSW) in Ecoregions 5E, 6E, and 7E and within significant coastal wetlands. Development and site alteration in fish habitat and the habitat of endangered and threatened species shall only be permitted in accordance with provincial and federal requirements. Development and site alteration within other natural heritage features and on lands adjacent to all natural heritage features may be permitted if it is demonstrated that there will be no negative impacts on the feature or its ecological function. The PPS defines “development” as the creation of a new lot, a change in land use, or the construction of buildings and structures requiring approval under the Planning Act. “Site alteration” means activities, such as grading, excavation and the placement of fill that would change the landform and natural vegetative characteristics of a site. Section 4.2 of the PPS protects the quality and quantity of water, including the form and hydrologic function of sensitive surface water features and sensitive ground water features. Focus is given to maintaining hydrologic linkages and functions at the watershed scale to minimize potential negative impacts, including cross-jurisdictional and cross-watershed impacts of development. Mitigative measures and/or alternative development approaches should be considered for development near water features.
2.2 Endangered Species Act, 2007 Species listed as endangered or threatened on the Species at Risk in Ontario (SARO) list, and their habitats, are protected under the provincial Endangered Species Act, 2007 (ESA) (Government of Ontario, 2007). Section 9(1) of the ESA prohibits a person from killing, harming, harassing, capturing or taking a member of a species listed as endangered, threatened, or extirpated. Section 10(1) of the ESA prohibits the damage or destruction of habitat of species listed as endangered or threatened. Habitat for special concern species is afforded protection as significant wildlife habitat (SWH) in the PPS. Species at risk (SAR) are discussed throughout this report, as applicable.
Cambium Inc.
Page 3
Docusign Envelope ID: 3BB3DE27-AB4C-4FB5-8872-CE98205F5E40
Natural Heritage Constraints Study – City of Kawartha Lakes Water and Wastewater Master Plan TY Lin International Cambium Reference: 15069-001 January 22, 2025
2.3 City of Kawartha Lakes Official Plans As outlined in Section 3.5.2 of the City of Kawartha Lakes Official Plan, the Natural Heritage System is comprised of the following natural heritage features: Wetlands, Fish Habitat, Significant Woodlands, Significant Valleylands, Habitat of Threatened Species and Endangered Species, Significant Wildlife Habitat, and Areas of Natural and Scientific Interest (City of Kawartha Lakes, 2012). These features are identified on Schedule B of the Official Plan. These natural heritage features are not mapped or defined within Settlement Areas; however, Schedule B does identify multiple natural heritage features within the 3 km boundary surrounding each Settlement Area (i.e., within the Study Area). It should be noted that multiple sections of the City of Kawartha Lakes Official Plan, including Section 3.5.2 referenced above are currently under appeal. The City of Kawartha Lakes Official Plan outlines the intent to establish Secondary Plans for the four Settlement Areas identified within the Study Area; the only Secondary Plans currently in effect are Lindsay and Fenelon Falls. The Secondary Plans for Bobcaygeon and Omemee remain under appeal and are currently not in effect. Environmental constraints within the Settlement Area of Linsday are identified within Schedule G-1 of the Lindsay Secondary Plan. These constraints include unevaluated wetlands, Significant Woodlands, Provincially Significant Wetlands, waterbodies, and watercourses. Similarly, Schedule G-3 of the Fenelon Falls Secondary Plan outlines environmental constraints within the Settlement Area which include, unevaluated wetlands, Significant Woodlands, waterbodies, and watercourses.
2.4 Conservation Authorities Act Ontario’s Conservation Authorities are “community-based watershed management agencies, whose mandate is to undertake watershed-based programs to protect people and property from flooding, and other natural hazards, and to conserve natural resources for economic, social and environmental benefits” (Conservation Ontario, 2022).
Cambium Inc.
Page 4
Docusign Envelope ID: 3BB3DE27-AB4C-4FB5-8872-CE98205F5E40
Natural Heritage Constraints Study – City of Kawartha Lakes Water and Wastewater Master Plan TY Lin International Cambium Reference: 15069-001 January 22, 2025
The Site is within the jurisdiction of the Kawartha Conservation and their regulated area overlaps the Study Area. The regulated area is associated with the presence of wetlands, watercourses, and natural hazard areas. Kawartha Conservation regulates these features under Ontario Regulation 41/24: Prohibited Activities, Exemptions and Permits under the Conservation Authorities Act.
2.5 Species at Risk Act The federal Species at Risk Act (SARA) was adopted in 2002 to prevent endangered or threatened species from becoming extinct or extirpated, to help in the recovery of endangered, threatened, and extirpated species, and to manage species of special concern to help prevent them from becoming endangered or threatened. Habitat which is deemed necessary for the survival/recovery of a listed wildlife species, referred to as Critical Habitat, is protected under Section 56 of the SARA. The SARA applies to all federal lands in Canada; however, at-risk aquatic and migratory bird species located on private property in Ontario also receive protection under the Act. Known aquatic SAR populations and associated critical habitats are mapped by DFO. Critical habitat for aquatic SAR may include areas used for spawning, rearing young, feeding, overwintering, and migration.
2.6 Fisheries Act Fisheries and Oceans Canada (DFO) administers the federal Fisheries Act which defines fish habitat as “spawning grounds and other areas, including nursery, rearing, food supply and migration areas, on which fish depend directly or indirectly in order to carry out their life processes” (Subsection 2(1)). Works within and adjacent to lakes, watercourses, and other bodies of water containing fish have the potential to impact fish and/or fish habitat. The Fisheries Act prohibits the harmful alteration, disruption, or destruction (HADD) of fish habitat (Subsection 35(1)), which is defined as “any temporary or permanent change to fish habitat that directly or indirectly impairs the habitat’s capacity to support one or more life processes”.
Cambium Inc.
Page 5
Docusign Envelope ID: 3BB3DE27-AB4C-4FB5-8872-CE98205F5E40
Natural Heritage Constraints Study – City of Kawartha Lakes Water and Wastewater Master Plan TY Lin International Cambium Reference: 15069-001 January 22, 2025
Furthermore, any work, undertaking, or activity other than fishing that results in the death of fish is considered an offence. As a result of amendments to the Fisheries Act in 2019, projects near water that could potentially impact fish or fish habitat may require DFO review. The primary purpose of the review is to determine whether the death of fish and/or HADD of fish habitat, as defined by the Act, can be avoided. The DFO Fisheries Protection Program provides a Decision Framework and guidance material applicable to these reviews (available on-line at www.dfompo.gc.ca/pnw-ppe/index-eng.html).
2.7 Migratory Birds Convention Act, 1994 The federal Migratory Birds Convention Act, 1994 (MBCA) prohibits killing, capturing, injuring, taking or disturbing of the listed migratory birds. Including damaging, destroying, removing, or disturbing of nests of all migratory bird species that contain a live birds or viable eggs. In 2022, new Migratory Birds Regulations (MBR) were adopted that afford year-round protection to the nests of 18 migratory species, until the nest is deemed to be abandoned. Nest abandonment must be reported through the Abandoned Nest Registry, administered by Environment and Climate Change Canada (ECCC), if there is a need to damage, disturb, destroy, or remove a nest of a species listed in Schedule 1 of the MBR. The time period to confirm nest abandonment varies by species, and ranges from 12 to 36 months.
Cambium Inc.
Page 6
Docusign Envelope ID: 3BB3DE27-AB4C-4FB5-8872-CE98205F5E40
Natural Heritage Constraints Study – City of Kawartha Lakes Water and Wastewater Master Plan TY Lin International Cambium Reference: 15069-001 January 22, 2025
3.0
Technical Approach and Data Collection Methods
3.1 Background Information Review Supporting background information pertaining to the Study Areas was compiled and reviewed, as part of a comprehensive desktop exercise, to better understand local biophysical conditions. Data was obtained from provincial, municipal, and other online resources. The comprehensive desktop review for the Study Area included the following resources: •
Land Information Ontario (LIO) database via the online Natural Heritage Areas: Make-aMap tool (Ministry of Natural Resources and Forestry, 2024)
•
Natural Heritage Information Center (NHIC) database: species at risk (SAR) occurrence records
•
Online Atlas Data: •
Ontario Reptile and Amphibian Atlas (ORAA) (Ontario Nature, 2020)
•
Ontario Breeding Birds Atlas (OBBA) (2001-2005) (Bird Studies Canada, 2005)
•
Aquatic Species at Risk distribution maps (Fisheries and Oceans Canada, 2024)
•
Aquatic Resource Area Summary Data (Government of Ontario, 2024)
3.2 Species at Risk Screening A list of species at risk (SAR), with potential to occur in the general vicinity of the Study Area has been compiled based on known species’ ranges, habitat requirements, and review of background information sources (as listed in Section 3.1). The potential for a species to occur was determined based on the desktop study and a review of aerial imagery to assess habitats within the Study Area. We note that no field surveys were completed to inform or update this assessment at a site-specific level. Given the large geographic area that the Study Area occupies, there are a wide range of habitats represented, including: agricultural lands, meadows, thickets, woodlands, wetlands, watercourses and anthropogenic structures. Species habitat preferences were used to divide these species into five general habitat groupings
Cambium Inc.
Page 7
Docusign Envelope ID: 3BB3DE27-AB4C-4FB5-8872-CE98205F5E40
Natural Heritage Constraints Study – City of Kawartha Lakes Water and Wastewater Master Plan TY Lin International Cambium Reference: 15069-001 January 22, 2025
(general, open, woodland, wetland, watercourse corridors/aquatic). Further details regarding each species are provided in Section 4.7 and Appendix A.
Cambium Inc.
Page 8
Docusign Envelope ID: 3BB3DE27-AB4C-4FB5-8872-CE98205F5E40
Natural Heritage Constraints Study – City of Kawartha Lakes Water and Wastewater Master Plan TY Lin International Cambium Reference: 15069-001 January 22, 2025
4.0
Natural Heritage Features and Functions
This section summarizes the natural features and functions identified within the Study Area based on existing designations and definitions provided by relevant agencies as well as through the application of applicable provincial guidelines including the Natural Heritage Reference Manual (Ministry of Natural Resources, 2010).
4.1 Wetlands 4.1.1 Significant Wetlands In Ontario, wetlands are mapped and evaluated under the Ontario Wetland Evaluation System (OWES). Mapped evaluated wetlands have undergone extensive study and been assessed based on their form and function under four categories: Biological, Social, Hydrological, and Special Features (Ministry of Natural Resources, 2022). Evaluated wetlands that score high enough are deemed Provincially Significant Wetlands (PSW). Evaluated wetlands that do not score high enough to be a PSW are classified as Locally Significant Wetlands (LSW) or nonsignificant. Provincial mapping shows multiple Provincially and Locally Significant Wetlands within the Study Area. These mapped features are shown on Figure 1, Figure 2, Figure 3, and Figure 4. Provincially Significant Wetlands identified within the Study Area include: •
Emily Creek No. 2
•
Ellery Bay
•
Sturgeon Lake No. 26
•
Sturgeon Lake No. 27
•
Stoney Creek Headwaters
•
Emily Creek No.8
•
Emily Park Wetland
Cambium Inc.
Page 9
Docusign Envelope ID: 3BB3DE27-AB4C-4FB5-8872-CE98205F5E40
Natural Heritage Constraints Study – City of Kawartha Lakes Water and Wastewater Master Plan TY Lin International Cambium Reference: 15069-001 January 22, 2025
•
Potash Creek Complex
•
Pigeon River No. 23 Complex
Locally Significant Wetland identified within the Study Area include: •
Sturgeon Lake No.7
•
Bobcaygeon West
•
Rutherford Creek Complex
•
Verulam Park North Complex
•
Sturgeon Lake No.14
•
Lindsay Airport
4.1.2 Unevaluated Wetlands The Province also maps unevaluated wetlands. These mapped wetlands are approximate; as such, they require field verification in order to confirm their presence and determine their boundaries. The Study was limited to a desktop review; therefore the presence and delineations of these features was not confirmed. Presence of these features has been assumed as mapped on Figure 1, Figure 2, Figure 3, and Figure 4.
4.2 Significant Woodlands Sections 3.5.13-22 of the City of Kawartha Lakes Official Plan (City of Kawartha Lakes, 2012) provides the policies with respect to significant woodlands. Significant woodlands are mapped on Schedule B. Significant woodlands are not mapped or defined within Settlement Areas; however significant woodlands are identified within the 3km buffer boundary surrounding each Settlement Area. Schedule G-3 of the Secondary Plan for Fenelon Falls identifies significant woodlands within the Settlement Area boundaries of Fenelon Falls.
Cambium Inc.
Page 10
Docusign Envelope ID: 3BB3DE27-AB4C-4FB5-8872-CE98205F5E40
Natural Heritage Constraints Study – City of Kawartha Lakes Water and Wastewater Master Plan TY Lin International Cambium Reference: 15069-001 January 22, 2025
Similarly, Schedule G-1 of Lindsay’s Secondary Plan maps significant woodlands within the Settlement Area boundaries. These mapped woodlands are shown on Figure 1, Figure 2, Figure 3, and Figure 4.
4.3 Significant Valleylands Sections 3.5.23-24 of the City of Kawartha Lakes Official Plan (City of Kawartha Lakes, 2012) provides policies with respect to significant valleylands. Based on these policies, significant valleylands outside of the Oak Ridges Moraine are not currently identified. The OP states that these features will be identified as needed through the development approval process.
4.4 Significant Wildlife Habitat The NHRM includes high level guidance for identifying SWH, which is further refined in the Significant Wildlife Habitat Technical Guide (SWHTG) (MNRF, 2000) and the Significant Wildlife Habitat Criteria Schedules (SWHCS) (Ministry of Natural Resources and Forestry, 2015). These documents are the basis for identifying areas and features that are considered SWH by the province, and were used in this study to determine candidate SWH within the Study Area. Information gathered during the background review were compared to SWH criteria to evaluate the Study Area for SWH (Appendix B). Based on this assessment the following potential Significant Wildlife Habitat functions may be present within the Study Area. Seasonal Concentration Areas •
Waterfowl stopover and staging areas (aquatic and/or terrestrial)
•
Shorebird migratory stopover areas
•
Raptor wintering areas
•
Bat hibernacula
•
Bat maternity roost colonies
•
Turtle wintering areas
Cambium Inc.
Page 11
Docusign Envelope ID: 3BB3DE27-AB4C-4FB5-8872-CE98205F5E40
Natural Heritage Constraints Study – City of Kawartha Lakes Water and Wastewater Master Plan TY Lin International Cambium Reference: 15069-001 January 22, 2025
•
Reptile hibernaculum
•
Colonially nesting bird breeding habitat (bank / cliff)
•
Colonially nesting bird breeding habitat (tree / shrub)
•
Colonially nesting bird breeding habitat (ground)
•
Deer yarding and winter congregation areas (Confirmed SWH: Mapped Deer Wintering Stratum 1 and 2)
Rare Vegetation Communities or Specialized Habitats for Wildlife Rare Vegetation Communities •
Cliffs and talus slopes
•
Sand barren
•
Alvar
•
Savannah
•
Tallgrass prairie
•
Other communities considered provincially rare
•
Old growth forests
Specialized Habitats for Wildlife •
Waterfowl nesting areas
•
Bald eagle (Haliaeetus leucocephalus) and osprey (Pandion haliaetus) nesting, foraging and perching habitat
•
Woodland raptor nesting habitat
•
Turtle nesting areas
•
Seeps and springs
•
Amphibian breeding habitat (woodland / wetland)
Cambium Inc.
Page 12
Docusign Envelope ID: 3BB3DE27-AB4C-4FB5-8872-CE98205F5E40
Natural Heritage Constraints Study – City of Kawartha Lakes Water and Wastewater Master Plan TY Lin International Cambium Reference: 15069-001 January 22, 2025
•
Woodland area sensitive bird breeding habitat
Habitat for Species of Conservation Concern •
Marsh bird breeding habitat
•
Open country bird breeding habitat
•
Shrub / early successional bird breeding habitat
•
Terrestrial crayfish
•
Special concern or rare wildlife species, including:
•
Species that are ranked S1-S3 by the NHIC and/or are provincially tracked
•
Species with populations that are significantly declining or have a high percentage of their global population in Ontario •
Species listed as special concern under the ESA (refer to Appendix A)
•
Species listed as threatened or endangered under SARA only (refer to Appendix A)
•
Regionally or locally rare species, where lists are available
Animal Movement Corridors •
Amphibian movement corridors
•
Deer movement corridors
4.5 Significant Areas of Natural and Scientific Interest Areas of Natural and Scientific Interest (ANSI) are natural heritage features identified by the MNRF. There are two types of ANSIs: Life Science and Earth Science. ANSIs represent important natural features that are not found in protected areas. The Natural Heritage Reference Manual provides the following definitions for ANSIs (Ministry of Natural Resources, 2010): Life science ANSIs are significant representative segments of Ontario’s biodiversity and natural landscapes, including specific types of forests, valleys, prairies, savannahs, alvars
Cambium Inc.
Page 13
Docusign Envelope ID: 3BB3DE27-AB4C-4FB5-8872-CE98205F5E40
Natural Heritage Constraints Study – City of Kawartha Lakes Water and Wastewater Master Plan TY Lin International Cambium Reference: 15069-001 January 22, 2025
and wetlands, their native plants and animals, and their supporting environments. They contain relatively undisturbed vegetation and landforms, and their associated species and communities. Provincially significant life science ANSIs include the most significant and best examples of the natural heritage features in the province, and many will correspond to other significant features and areas such as wetlands, valleylands and woodlands. Earth science ANSIs are geological in nature, consist of some of the most significant representative examples of the bedrock, fossils and landforms in Ontario, and include examples of ongoing geological processes. There are three ANSIs located within the Study Area. A provincially significant Earth Science ANSI (Omemee Esker South), overlapping the southern boundary of Omemee Settlement Area 3 km buffer (Figure 4) and two regionally significant Life Science ANSIs; Martin Creek Swamp overlapping the southwest portion of the 3 km boundary around Fenelon Falls (Figure 2) and Big Island located entirely within the 3 km boundary around Bobcaygeon (Figure 1).
4.6 Fish Habitat The Study Area is located within the Kawartha Conservation Watershed which is composed of 27 sub watersheds. Due to the high-level nature of this Study, all mapped watercourses and waterbodies identified within the Study Area should be considered potential fish habitat. Field verification would be required to further classify aquatic features and confirm utilization by fish.
4.7 Habitat of Endangered and Threatened Species Based on the habitats present, and the results of the desktop assessment, the following endangered or threatened species have potential to be present within the Study Area (refer to Appendix A for additional information relating to each species). Given the large geographic area that the Study Area occupies, there are a wide range of habitats represented. Species habitat preferences were used to divide these species into five general habitat groupings (general, open, woodlands, wetland, watercourses, stream corridors and aquatic habitat) as summarized below.
Cambium Inc.
Page 14
Docusign Envelope ID: 3BB3DE27-AB4C-4FB5-8872-CE98205F5E40
Natural Heritage Constraints Study – City of Kawartha Lakes Water and Wastewater Master Plan TY Lin International Cambium Reference: 15069-001 January 22, 2025
General (including Anthropogenic Structures) •
Little Brown Myotis (Myotis lucifugus) – Endangered
•
Chimney Swift (Chaetura pelagica) – Threatened
•
Red-headed Woodpecker (Melanerpes erythrocephalus) - Endangered
Woodlands •
Eastern Small-footed Myotis (Myotis leibii) – Endangered
•
Northern Myotis (Myotis septentrionalis) – Endangered
•
Tri-colored Bat (Perimyotis subflavus) – Endangered
•
Eastern Whip-poor-will (Antrostomus vociferus) – Threatened
•
American Ginseng (Panax quinquefolius) – Threatened
•
Butternut (Juglans cinerea) - Endnagered
Open •
Bobolink (Dolichonyx oryzivorus) - Threatened
•
Eastern Meadowlark (Sturnella magna) – Threatened
•
Loggerhead Shrike (Lanius ludovicianus) – Endangered
•
Eastern Hog-nosed Snake (Heterodon platirhinos) - Threatened
Wetland •
Blanding’s Turtle (Emydoidea blandingii) – Threatened
•
Least Bittern (Ixobrychus exilis) – Threatened
•
Spotted Turtle (Clemmys guttata) – Endangered
•
Black Ash (Fraxinus nigra) – Endangered
Cambium Inc.
Page 15
Docusign Envelope ID: 3BB3DE27-AB4C-4FB5-8872-CE98205F5E40
Natural Heritage Constraints Study – City of Kawartha Lakes Water and Wastewater Master Plan TY Lin International Cambium Reference: 15069-001 January 22, 2025
Watercourses, Stream Corridors, and Aquatic Habitat •
American Eel (Anguilla rostrata) – Endangered
•
Lake Sturgeon (Acipenser fulvescens) – Endangered
•
Bank Swallow (Riparia riparia) – Threatened
•
Wood Turtle (Glyptemys insculpta) - Endangered
Cambium Inc.
Page 16
Docusign Envelope ID: 3BB3DE27-AB4C-4FB5-8872-CE98205F5E40
Natural Heritage Constraints Study – City of Kawartha Lakes Water and Wastewater Master Plan TY Lin International Cambium Reference: 15069-001 January 22, 2025
5.0
Closing
We trust this information meets your current needs. If you require anything further or would like to discuss the contents of this Study, please contact the undersigned. Respectfully submitted, Cambium Inc.
Camden Jermey, B.Sc., Can-CISEC Senior Ecologist / Team Lead
Danielle Leal, B.Sc. Coordinator / Ecologist
P:\15000 to 15999\15069-001 TY Lin International Canada Inc - Natural Environment Investigation - Kawartha Lakes Master Plan\Deliverables\REPORT - NH Constraints\Final\2025-01-22 RPT - NH Assessment - Kawartha Lakes Master Plan.docx
Cambium Inc.
Page 17
Docusign Envelope ID: 3BB3DE27-AB4C-4FB5-8872-CE98205F5E40
Natural Heritage Constraints Study – City of Kawartha Lakes Water and Wastewater Master Plan TY Lin International Cambium Reference: 15069-001 January 22, 2025
6.0
References
Bird Studies Canada. (2005). Atlas of the Breeding Birds of Ontario. City of Kawartha Lakes. (2012). City of Kawatha Lakes Official Plan. Conservation Ontario. (2022). Conservation Ontario. Retrieved from About Conservation Ontario: https://conservationontario.ca/about-us/conservation-ontario Fisheries and Oceans Canada. (2024). Aquatic Species at Risk Map. Retrieved from Fisheries and Oceans Canada: http://www.dfo-mpo.gc.ca/species-especes/sara-lep/mapcarte/index-eng.html Government of Ontario. (2007, August). O.Reg 230/08: Species at Risk in Ontario List under Endangered Species Act, 2007, S.O. 2007, c.6. Retrieved from e-Laws: https://www.ontario.ca/laws/regulation/080230 Government of Ontario. (2024). Aquatic Resource Area Summary. Retrieved from Land Information Ontario: https://www.ontario.ca/data/aquatic-resource-area-survey-point Ministry of Municipal Affairs and Housing. (2024). Provincial Planning Statement. Ministry of Natural Resources. (2010). Natural Heritage Reference Manual from the Natural Heritage Policies of the Provincial Policy Statement, 2005 - Second Ed. Ministry of Natural Resources. (2022). Ontario Wetland Evaluation System Southern Manual, 4th Ed. Ontario. Ministry of Natural Resources and Forestry. (2015). Significant Wildlife Habitat Criteria Schedules For Ecoregion 6E. Ministry of Natural Resources and Forestry. (2024). Retrieved from Make a Map: Natural Heritage Areas: http://www.gisapplication.lrc.gov.on.ca/mamnh/Index.html?site=MNR_NHLUPS_Natural Heritage&viewer=NaturalHeritage&locale=en-US MNRF. (2000). Significant Wildlife Habitat Technical Guide. Ministry of Natural Resources and Forestry.
Cambium Inc.
Page 18
Docusign Envelope ID: 3BB3DE27-AB4C-4FB5-8872-CE98205F5E40
Natural Heritage Constraints Study – City of Kawartha Lakes Water and Wastewater Master Plan TY Lin International Cambium Reference: 15069-001 January 22, 2025
Ontario Nature. (2020). Ontario Reptile and Amphibian Atlas. Retrieved from Ontario Nature: https://www.ontarioinsects.org/herp
Cambium Inc.
Page 19
Docusign Envelope ID: 3BB3DE27-AB4C-4FB5-8872-CE98205F5E40
Natural Heritage Constraints Study – City of Kawartha Lakes Water and Wastewater Master Plan TY Lin International Cambium Reference: 15069-001 January 22, 2025
7.0
Glossary of Terms
ANSI: Area of Natural and Scientific Interest ARA: Aquatic Resources Area ARA: Aggregate Resources Act AS: Agricultural System ATK: Aboriginal Traditional Knowledge BMA: Bear Management Area BMP: Best Management Practice CA: Conservation Authority CEAA: Canadian Environmental Assessment Act/Agency CFA: Canadian Forestry Association CFIP: Community Fisheries Involvement Program CFS: Canadian Forestry Service CHU: Critical Habitat Unit CH: Cultural Heritage CLI: Canada Land Inventory CLU: Crown Land Use COSSARO: Committee on the Status of Species at Risk in Ontario CR: Conservation Reserve CWIP: Community Wildlife Involvement Program CWS: Canadian Wildlife Service DFO: Fisheries and Oceans Canada EA: Environmental Assessment EAA: Environmental Assessment Act EAB: Emerald Ash Borer EBR: Environmental Bill of Rights EIA: Environmental Impact Assessment EIS: Environmental Impact Study/Statement ELC: Ecological Land Classification ELUP: Ecological Land Use Plan END: Endangered Species EPA: Environmental Protection Act ER: Environmental Registry ESA: Endangered Species Act, 2007 ESA: Environmentally Sensitive Area ESC: Erosion and Sediment Control F&W: Fish and Wildlife FA: Fisheries Act
Cambium Inc.
GPGGH: Growth Plan for the Greater Golden Horseshoe, 2020 GPS: Global Positioning System HSA: Habitat Suitability Analysis HIS: Habitat Suitability Index KHA: Key Hydrologic Area(s) KHF: Key Hydrologic Feature(s) KNHF: Key Natural Heritage Feature(s) LCFSP: Licence to Collect Fish for Scientific Purposes LIO: Land Information Ontario LRIA: Lakes and Rivers Improvement Act LUP: Land Use Permit or Plan MA: Management Area MAFA: Moose Aquatic Feeding Area MCEA: Municipal Class Environmental Assessment MECP: Ontario Ministry of Environment, Conservation and Parks MNRF: Ontario Ministry of Natural Resources and Forestry NER: Natural Environment Report NHIC: Natural Heritage Information Centre NHIS: Natural Heritage Information System NHS: Natural Heritage System OBM: Ontario Base Map OFIS: Ontario Fisheries Information System OLI: Ontario Land Inventory OMAFRA: Ontario Ministry of Agriculture, Food and Rural Affairs OWES: Ontario Wetland Evaluation System PPS: Provincial Planning Statement, 2024 PSW: Provincially Significant Wetland RLUP: Regional Land Use Plan RMP: Regional Management Plan RPF: Registered Professional Forester SAR: Species at Risk SARO: Species at Risk in Ontario SC: Special Concern species SWH: Significant Wildlife Habitat
Page 20
Docusign Envelope ID: 3BB3DE27-AB4C-4FB5-8872-CE98205F5E40
Natural Heritage Constraints Study – City of Kawartha Lakes Water and Wastewater Master Plan TY Lin International Cambium Reference: 15069-001 January 22, 2025
FEC: Forest Ecosystem Classification FMP: Forest Management Plan FRI: Forest Resources Inventory FWCA: Fish and Wildlife Conservation Act GGH: Greater Golden Horseshoe GHP: General Habitat Protection GIS: Geographic Information System GLSL: Great Lakes – St. Lawrence
Cambium Inc.
SWM: Stormwater Management THR: Threatened species TOR: Terms of Reference TPP: Tree Preservation Plan WIA: Woodlands Improvement Act WMU: Wildlife Management Unit WSCA: Wildlife Scientific Collector’s Authorization
Page 21
Docusign Envelope ID: 3BB3DE27-AB4C-4FB5-8872-CE98205F5E40
Natural Heritage Constraints Study – City of Kawartha Lakes Water and Wastewater Master Plan TY Lin International Cambium Reference: 15069-001 January 22, 2025
Appended Figures
Cambium Inc.
e e ee e ee e ee e e e e eee ee ee e e e eeee ee e e e eee e e e e Envelope ID: 3BB3DE27-AB4C-4FB5-8872-CE98205F5E40 e ee ee ee e eee e e e eeeeeee eDocusign eeeee ee e ee e ee ee ee s ee e e e ee s e e ess se eee ss s ese eeee e eeeees e ee es e ees ee e ees e e e e e e e e e e s e s e e e e e e s s es s s s e s s s s s e s s s e s e e e e e e s e e s e s eee e s e s s s e s s e e s s e s e e e s e s e ee e s e e s s s s s e e e ss s s e s s e s s s e e s s e s e e se e s e s e s s e e e s e s e e e e e s e e s s s e e s e s se s s sse s s ess see e se e e e ses eeeee se se s eses s es s esess ee eess s s s ss s REGIONAL see e s sess sses e e e e e e e e e e e e e e e e ee e e e s s s s e e e e e e e e e e e s e e s ss s e e e e LOCATION e s e s e e s s e s e s s e s e s e s e e s s s s e s e s s s s es e ese s sese e esees e s es eess s e seess sese se ss es esss eeses ss s e ss es es es ess es s s ee eee ees e s s ees e es es ee es es eeses ses s ees e es seess s sese s see NATURAL HERITAGE ss s s ses s s e eesee e e es eee e e e e e e e e e e e e e e e e e ee e e ees e s s s s s e s es e ee e s e e ss e e e e s e e s s s e s s s e es s e e e s s s e s s s e s e e s e e s s s e s s s e e s ee e e s e e s e e s e s e e e e e s es e s ss s e e s e s e ss s s e s s s e s e e e s e s e s e e s e ss es ss e es ss es s e s e es ses ss es5E-11 e s e esese s s ese ss s ASSESSMENT s s ses s ses s ses ess es e e s esss ee e es ee es eeeees ee e eees ee es e e ee e eeees es ee eses s es e s s s ee ses e sess s es es s ee e ses s e ees ees s ees s ee ees se ees e e se s e TT e s ee ee e es es e es ee eee se eeee s ee se es esee ss es s s es eeee es s s esee sPs TY LIN INTERNATIONAL s eeses e ss s s ees s e s Sturgeon s ese s see s s s ss s s s s s s s s s s s s s s ESCO R e e e e e e e e e e ees e e e e e e e e e e e e e s s s e ses s es s ss s ess ee s ses sees es s esse s ss esesees es e e e City of Kawartha Lakes, Ontario esee ss ees e ss s e e ss e ses ses es s ss ess ees ee es e es ss ee e ess ese ss ee ese e e es ees e ee eses e ese s ee s e ss s es eees es es Lake se ee e es s es s e s ee e s ees s s s sees s ee e es e e eee es ese e ss es es ee ees eees ees ess e e ee eee e es es ees eNo. s s s ses e e e e es esee esee es esesesees s es s es e e e s e s s e e s s s e ee s e s s e e s s e s e e e e s e e s s s e s e s s s s e e e es s e e e s s e 2 s s e e s s s e e s s s e e e e e ee s e s e s e s s e e e s s s s s s s s s s s sDeeeee ss es s ss ssss s se e e s s e ese e ee e e s e es es ee es es e ees ese Ie ee es es e s es e se es es NR e es e seeses ee ees es ee e e s s eees s ees ss s ss es e s es ee es es s ees se sss es es ss ee eses s s ss ess SOe s eses se s ee se s e s ss e ee e s s s eees s s s s se ss s s s s ses s see s LEGEND ARR e e e e e ese e e e e e e e e e e es e e e e e H e e e e e e s s s e s eee e e s e e s s e e e s s s s e e e s s e s e s s e e e s e e s s e s s s e e s s s s ee e e ee e ss s e e e e s e s s e e s s e ss e e s s e e e e s s e e e s e s s s s s e e s e s e e s e s 6 s e s s e s s e s s e s e e s e e e s e s s e e s s s 3 e s e s s s s s s s s s s s s s s es s se e ee s es s D s s Major Road ee es es e ees eeses ee s e e e eeses es e e e e e e e eeee TY R e e e e e e s e s s e eeees s e e e s e e s s s Ns s s e s e e e e s s e e e s s e s e e e e e e s s e s U e s s s e ee s s e s s s e s s e s e s e s e e e e s e s s s s e e s s s e ee O e e s e s s s e e e e e s s s s s s e s s s s e e s e s e C e s s e eD s e ess s es ss s ss e ess es se se s e ss sese s ss ses s s se s s s ee ssee e ss s s s se e es eees eee es ee ee e e e ees R e es ee s ees es e s ees e ses eees ees es es s s eIs s s es e eee e e s es e s e eese e s e s s ee s s es s s e es es ees s eee es eeses e e ess es e es s es ses s s s e ee s ee ess ess NS e s e sesses s eees s s s ses ss ses ee ss es s es es e ee Minor Road s s s s es e ee e s es ee e e e s es ees e s e e s e se s We ses s s s s s s s s ss s s s s Rs I Bobcaygeon e e e e e e e e e e e e e e e e e e ee s e e e e e e e e e e e e s e s s e e e s e e s e s e e s e e s e e e Fenelon Falls e e s s s s e e e ee s e s s s e e s e s e e s s e e e s e ss e e e s e e e e e e ee s e e s e s e e es e e e e s s s e s s s e e e e e s s e e s e s e s e s e s s e e s e e s e s ss e s e e e e s ee s e e s e e s e e e e s s e e s e e eees s s s s s e e s s s s s s ss ss s s s ss ss s s s s s s ss s s s s s s s e es eNogie's e ee es eee es eese es ee s ee es Watercourse e es e e es ee e ee ee s e ee eee e s se s s s e e ese ees s ee S e e se s e es es ss e s s s ee e e ees s s s es ss s e TEe ee ees e s sesee e ee s eees s es As see e s s ee ese es e e es e ees es ss s s ss e es e es s e s es s e ess e ese see ee e e sees es s ss s s s s s s ss ss s ss ss se e es ee es eeCreek eee es es ee ee e eRe esesee es e e ee e ee e e ee e e e e e e e e e e e e e e e e e e e e e ee s e s e s e e e e e e e e e s s e s e e e s ee s e e e e e ee e s e e s e s e s s e e e e e e e e s s e s e s e e s s e e e ss e s e s e s s s s e e e s e e e s e e e e e s e s e s e s e s es e e es es es s e s e es s ss e ese es ee ee Unevaluated Wetland s sseeesee s s s s s se e sss sses ee ee Mouth s seese ss ese s es ees ee ee e es e s ese ees ee e es e s s ss es ees ee es se ees e ese ee e e ses s s eees s es es s e e e es s s s s eee e ssss eee eess es ess seees es es e s D es e e ee esss ee e e es ees ee s es ee e s es ee Rs s s e s s e s e e e e e e e e e e e e e e e e e ee e eee s es s e s ee e e e Locally Significant Wetland eses ees ees e e e ees ee e ee e ee s ees ess es es ees es s ee s e ee e se es es s e se ee s es ses s s ss e e eee s eees s ss s s e s ss e ss s eees e e ses es s s Te s s s se s s se s ses s es e ee s eRes es A es ee eee e ee eees ees Ds ss ss sesse es s ee e e s s s se ee s s ee eee ss e ees ees e Ee e es ese e s e s s s s e e s e s e e e e e s Ce e s e s e e e e s e e s s e e s s e s e e e Eels s s e e e e e s e e e e e e s e e e s e e e s e e s s s s s s s s ss ss s s e e e e e e e e se ee es s e ee esee e e eeee e eeese e e es ee es eess es e eeee e e e Provincially Significant Wetland e e s es s es s ee e s se Lake) es ee se es ee s 6E-9 sees s ss se ees es s e eess Creek (Pigeon s ess s ee ee s e e s s s e e s e e e e s e e e ees s s e s s s s s s s s s s s s ee e ee e es ees eeee e e es eee e ee es e s e se es e s e ses sss seeee e ess s ss e s s e es ees e es es ee es es s ee s e Fish Spawning Area s eee e es ee e ees s e ee ees es e s s eseses es s e es ss s ee s e s se eee s s s s s s s ss e e e e e e e e e e e e e e e e e e e es ess e es eeeee ee e e e ess s e ess es s eee ss ees esee ee ses e ees seeeeee ese se ses e e sesees e e s e s e e e e s s s s Sturgeon ANSI, Earth Science es e e ee e ee es e s esee ees e e e ese e ses e e ee sses s ees ss ss s e eee e e ee eee ees s e ees e es s se s Lake se ss eses e ss es es ee eNo. 7esees es e eee es e e e e s s s s s e ss s e s s s s s e e e s e e e s s e e e s s e e s s s s s e s s e ANSI, Life Science s ee ee e es e e ess s e ee es se e es eee s s sss s ss ese es e es e ess e seeess s se se eee e es eee e e s eee e e eeesees es e ee e s s s e e e s e e s e e e ee s e ees esss e s s e s s s s s e s s e s s s s s se e es se s e eess White-tailed Deer Wintering Area e e eeeeeee Pigeon Lake es ee eeeeesee ee s s s e see e es es e sese s se s e seee eese ee e s s e ee ee e ss s s s s s (Stratum 2) e ee e e e e e LINE e e e e e e s s e s s e s e s s s s e E e s s ees e e e e ss e e s s s ese e e IEW LIN s e ss es ess e es e ess e s s s s e e e e e e e e e e V e e e e S s e ee e eeTRe EE s Cs es s e RE e White-tailed Deer Yard (Stratum 1) se s e e ss e ee s ss s e e ss e eee se es e ss e ee e e ANDER s e e e ee ees ss ss s s s ss se s ss s es eseees e e e ee ess e ss e s e e es e es ees s s e e s e e e s e e s e s e s e s e e e ess e e e e e s s e s e s e e e e e s s s s e e esss s s s se s s sse Significant Woodlands e e ess e e e e e ses ee ee ee es s eseese es e es es es e e es s ess ee es s e es ss es es s s es ees ee s s e s ees e ee ee ee s s s s ssee e e e e e e s e e s e s s s s s e e s s s s e e e e s s e e s se se e es e ee s s s es es ee First Nations Reserve es s sss e s ees ss eee s sse e eee e es eeees s ese e es e e e e eses ee e es e se s es es s see ees ess se ss s esseeee eses eses es es s ess s sesesses s s e ses s eseses e e s s s s s s s s e Ecodistrict ee e ee se e e e es e ees es ee sse e e ee e s s es ee ese ees e es s ses s s ees ees ee s s es es e ese s Rs e eee e s ee eeses s es e s es s De se s sees s se s s ess ess ee e e ee e e e e e e e s s ss s se e e e e s s e s e s e e s e s e e e e e e s e s es s ee e s s s s e ss s e s e s e s se e e se e ss e ss ese s Water Area e e e ee e CR s ss e ss ses s s s s e eeees ES s ese e es ee E e es se e es e se s ees ee s e e es ee e s e e e ee ees ese se se s s ee ess s es s RIVs s eeess ss e e s es e s es sese s e e s s s e e e e e e e e e e e e ee s es s ee se es Wooded Area e s s s ss e Big Island eeees e seesee e ees ees e e s ees es ese s ese ese e es e e Hawker's e es s s s ISLANDS IN D8 s s s s Y Re e e ee Ts es eee e eeses e es e ees e esesees s e es es sese e e (Boyd Island) e e Creek e UNe e e s s e s e e O s e s s e e e e C THE TRENT s e e s e s e s e e s s s s Built Up Area s seee s e ees e es es sess se eeeees Complex e s e s e ee e s ss s sss T ST W e ee es es eeesee s e ee s es ses WATERS 36A ee es se s ss s ee ss es s see s s se s s s N e e e e e e e e e O e e e e s e e e s e e e ss s ss e e e s e s e e e s s s e e s ss 3km Boundary Buffer e e eeeee es es ee e sse ee es ss s s es s see eesee s es e s ee e e ee ee es s s s e es es e e ese es ee ee ee e ee s ese s e ee s ee ee s e s ee ss ess es s es s s s ees e s s eeese e s s e ss sessees e e s e eee e s s s e ss s e Little s s s s ss s Bobcaygeon Settlement Area ees es ses eese e ee e ee e eees e eese e eees s e e s s ses ee eeee es ees es e e s e e eee s e s s ess es ee e ss ses eees eeee sess es sss eees Bob Quarry s s s s Bobcaygeon s s s s e e e e e e e e e e e e e e e e e s ss s ee s e se e s s e es e ees e s s see e ee s see es s s esess ee es es es eee ss es ss s ss Notes: eees e ss es s ee s se e ee es e es e ess s ss se s s s ss sWest -e This document contains information licensed under the Open Government e ee ee e ees ee ee es LAKs e ese e ees eses es e eses ees e ss s e e ee e s s e e e e e E Le e e e e e e s e ss e e e s s s e s e e e e License - Ontario. ANDss e s e s e e e s e s e s e e e e e R s s s e e e e s e s s s e s s s s Y s s se s s s s e se s s on this plan are in metres and can be converted to feet by eDistances e e eees es es e BA e e es e ese es eeese ee e s s eee s es es ees e by 0.3048. e-dividing ee s e s s ee s es ee s eee es s e see ses s ees ee es ee s s s ee ee e ese ees ss e e s se ss s s s - Cambium Inc. makes every effort to ensure this map is free from errors but s e e e e e e e e e e e e e e e e e s e s s s e s e cannot be held for any damages due to error or omissions. This s s s e e s e e es e e ee es es es e e s e s ss ses es s ese seees ees s e map should notresponsible e es s s e ee e s be used for navigation or legal purposes. It is intended for s es e eee ee e e e es e e es e e e s e e general reference use only. s s e s e e e e e e s s s e s s e s e e e e s s e e e s s e s s ee ee e es s s s e s s e s ee es sessees s e s s sse es eese ee es DR s es eees e e ee e es es see s es eeees e ss e esee es ee e s IN s es s e s e e ss s es ss eeses eeBear ee ese se s s s s s s s s s s s e e e e e e e e e e e e e e e s s e e e e s s s e s e s s e Creek e e s e e ee e e e s e e e s s e ee s e ses ee s e s e e s e e e e ss s e s s e ee s 194 Sophia Street e e ee e es ses sseses ss s s se s ss s se s s s s e e e e ee es ee e esee ee Peterborough, Ontario, K9H 1E5 Sturgeon Lake eee e Wetland e s s s e s es s e s e eseee s ee e e s s s e ss ss e e e e se e s s ee e s e e s s ses e s e e e e s e e e s ee e e s e e e e e e e ss e e s s s Tel: (705) 742.7900 Fax: (705) 742.7907 s ss s s s s s e e e e e e e e e e e e e s se es es e see s e se Emily se e es www.cambium-inc.com es esee ee s es eeseCreek s es ees e ess eees e s 6E-8 eseses e e ee e e ss seses esY RD 24s e s e s s ss se s s eee eesss e e ee ee es e e es es e es T s e es ee No. 2e es ses e seDs e ee e es e e e e ses e s e s e eCOs ee e 36s s e UNs ses e e e e e e s e e s e s s e e e e e e s s s s s s eese s OA e e ee eese ess e e es eee e e e es ess es es es es e ee esess eeses e ees s es e L R es se eees e seese BOBCAYGEON NATURAL s CK RD s e e e e E e e e ee e s s e e s e G e s s e e e see s e ees ss e es eODse s es s ss e es s s e eeee s e e s se s HERITAGE FEATURES IM L ese L e e e e e E e s se eess s ss ees e ee eeese es ee s s e ss s eses e s ss sss s s ee s s s ee eeses s s e e e e e e e e e e e e e e e e e e s s s e e e s s s s s e e e e e e e e s ss e s e s e s e e s s Date: e No.: ess s es se ees November 2024 es s e e e Project e ee e s es ss s s s e s eee ss ss s s es ee e e ee s s ees e es e es e e e e eess e es e e es ee es es ees e s s s s s 15069-001 Rev.: ees s e eeeee es e e es se s e e ee e ee e es s e ee s e e s e e e e ee e e s e e e s s e s s sss s s s s s s s eseeeese s e e ee ee e s e e Fulton's -ee Oak eBay es e eess e e Scale: eee e s ses e es s ese s s e e e e Projection: eee ee s e e e se s ees e Ds es es ses e ees se ee Re es es e ss ee ee e s s s Ss s ss Pigeon s se s s s s s ss TYe e ee ees ee Orchard Wetland e e e e 1:65,000 NAD 1983 UTM Zone 17N e e e e e e e e 0 0.5 1e e 1.5e 2ee 2.5 e e e e EAT e e e e e s s e s s e s s s s B e e eee eeees e e e e s e e s e s e ees e e e s e s e e s e e s e s s s e s s s e e s s s s e e e s s e eese s s e ee e e ekm s e sse e eLake ss s s s ees e ss seee se ee s s s e ee e eNo.e e ee eeeees Checked by: Figure: eee ee eCreated eeee s s sees esees s ees s e s es e es ee ee by: es e eee ee eee es es s10 s eee e eee e eees es e ees e s e ee es es ee s ees e ees seee eeSouth e ee e e e ee e es s s s s s s s ses CJ DBC 1 e e e e e e e e e e e e e e e e e e e e s s s e e s e e e e e e s e e s s e e s e e e e s ee s e e s e e e e s s e e e ee e e e e e s s e e e e s e e e e e s e e e e s e e s e e e e e eee s eee e e e e ee e s eee e e e e e e e e e e e e e e e e e e e e e e e e e e e e e e e e e e e e e ee eee e ee ee e ee ee e e e e e ee ee ee e e e e e e e e eeeeee e e Q
Q
Q Q
Q
Q
Q
Q
Q
Q Q
Q Q Q Q
Q Q
Q
N
SO
E
RE
Q
Q
E RD
Q Q
Q
Q Q
Q QQ Q
Q
Q Q
Q
Q
Q Q
Q QQ
Q Q
Q Q Q Q Q Q Q
Q
Q Q
Q Q
Q
Q
Q
Q
Q
Q
Q
Q
Q Q Q Q
Q Q Q
Q Q Q
Q Q Q Q
Q QQ Q Q
Q Q
Q Q
Q
NS
Q
Q
Q
Q
Q Q
SO
Q Q
Q
Q
Q Q
Q Q Q
IN S T
Q Q
Q
STI N
Q
Q Q Q Q
M EA CH
Q
Q Q
Q
Q Q Q
Q
Q
Q
Q
Q
Q
Q
Q Q
Q
Q
Q Q
Q Q Q Q Q Q Q Q Q Q Q Q Q Q Q Q
Q
Q
Q
Q Q
Q Q
Q
Q
Q
Q Q
Q
Q
Q Q
Q
Q
Q Q
Q
Q
Q
Q
Q
Q Q Q
Q
Q
Q
Q
Q
Q
Q
Q
Q
Q Q Q Q Q
Q Q
Q Q
Q
Q
Q
Q
Q
Q
Q Q
Q Q
Q Q Q
Q
Q Q
Q
Q
Q
Q
Q
Q
Q
Q
Q
Q
Q
Q
Q
Q
Q Q
Q
Q
Q
Q
Q Q Q
Q Q
Q
Q
Q
Q
QQ Q
Q
Q Q Q Q Q
Q Q Q Q
Q
Q
Q Q
Q
Q
Q Q
QQ Q Q Q Q Q Q Q Q
Q
Q
Q Q Q Q Q Q Q
Q
Q Q Q Q Q Q Q
Q
Q
Q
Q
Q
Q
Q
Q
Q
Q
Q Q Q
Q
Q
Q
Q
Q
Q
Q
Q
Q
Q Q Q Q Q Q Q Q Q Q Q Q Q Q Q Q Q
Q
Q
Q
Q
Q
Q
Q Q QQ Q
Q Q
Q Q
Q
Q
Q Q
Q Q Q
Q
Q
Q Q QQ
Q Q
Q
Q Q Q
Q QQ
Q
QQ Q Q Q Q Q QQ Q Q Q Q
Q Q
Q
Q
Q Q Q Q Q Q Q QQ Q Q Q QQ Q Q
Q
E RD
Q
Q Q Q
Q Q
Q
Q
Q
Q
D
Q
Q
Q
Q Q Q
Q Q
Q
Q
Q
Q
Q
Q
Q Q
Q
CH R
Q Q
Q Q Q Q
Q
Q
Q
Q
Q
Q
RD
Q
Q
Q
Q
Q
Q
Q
Q
Q
Q
Q Q Q Q
Q
Q
Q
CH BEA
Q
Q Q
Q Q
Q
RAN
Q
Q
Q
Q Q
Q
Q Q
Q
Q
Q
Q
Q Q
NE STO
Q
Q
Q
Q
QQ Q Q Q QQ Q
Q
Q
Q
Q
Q
Q
Q
KEN
Q
Q
Q Q Q
Q
Q
Q
Q Q
Q
Q
Q
Q Q Q Q Q Q Q Q
Q
Q
Q
Q
Q
Q Q Q
Q
Q
Q
Q
Q Q
Q Q Q QQ QQ QQ QQ
Q
Q
Q
Q Q
Q
T RD
Q Q
Q
Q
Q
Q
Q
Q
Q
Q Q
Q
Q
Q
Q
Q
Q
Q
Q Q
Q
Q Q
Q
Q
Q
Q Q
Q Q
Q
Q Q Q Q Q
Q
Q
Q Q Q
Q
Q
Q Q Q Q Q
Q
Q
Q
Q Q
Q
QQ Q
Q
Q
Q
Q Q Q Q Q
Q
Q
Q
Q Q
Q Q
Q
Q Q
Q
Q
Q Q Q Q Q
Q
Q
Q Q Q
OIN
Q Q QQ
Q Q
Q
Q Q Q Q
Q
Q Q Q Q
Q Q
Q Q
Q
HP
Q
Q
Q Q Q Q
Q Q Q QQ Q Q Q
Q
Q Q
Q
Q
Q Q
Q Q Q Q Q
Q
Q
Q
Q Q Q QQ
Q QQ
LAK
BIRC
Q
Q
Q
Q
QQ Q
Q
Q
Q
Q
Q
Q Q
Q
Q
Q
Q
Q
Q
Q
Q
Q Q
Q
Q Q
Q
Q
Q Q
Q QQ
Q
Q Q
Q
RD
Q Q Q Q Q Q
Q
Q
Q
Q
Q
ON PIGE
Q
QQ Q
Q
Q
Q Q
Q Q
Q
EEK R CR
Q Q Q Q Q
Q
Q Q Q
Q
Q
Q QQ QQ Q Q Q Q Q Q
QQ Q Q Q Q Q Q Q
Q Q
Q
Q Q Q Q Q Q Q
Q Q
Q
QQ Q
Q Q Q Q Q Q Q Q
BEA
Q
Q Q Q Q Q Q Q Q Q Q Q Q
Q Q Q
Q
Q
Q
Q Q
QQ Q Q Q
Q
Q
Q
Q
I DE
RS
Q Q
Q
Q
Q
Q
Q
Q
Q
Q
Q
Q
Q
Q
Q
Q
Q
Q
Q
Q
Q
Q
Q
Q
Q
Q
Q
Q
Q
Q Q Q Q Q QQ Q
Q
Q
Q Q Q
Q QQ
Q
Q Q Q Q Q Q Q Q Q Q Q Q Q Q
Q Q Q
Q
Q Q
Q
Q Q
Q
Q
Q
Q Q QQ Q Q
Q Q
Q
Q
Q Q
Q
Q
Q
Q
Q
Q Q Q
Q Q
Q Q Q Q
Q Q
Q Q
Q Q
Q
Q
Q Q Q Q Q
Q
Q
Q
Q
Q
Q QQ Q Q Q
D
Q Q Q Q Q
Q
Q
Q
Q Q Q QQ Q Q
Q
Q
Q
Q
Q Q
Q Q Q Q
Q QQ Q
Q
Q
Q Q
Q
Q
Q
Q
Q
Q
Q
Q
Q
Q
Q Q QQ Q Q Q Q Q
Q
Q Q Q
MA
Q Q
Q Q Q Q
Q
RD
Q
Q
QQ Q
Q
Q
FR
Q Q
Q
Q
Q Q Q
Q
Q
EL
Q
Q Q
Q
Q
Q
Q
Q Q
Q Q Q Q
Q
Q
Q
Q
Q
Q
Q Q
Q Q
Q Q
Q
Q
Q
Q Q
Q
Q
Q
RD
Q
Q
Q
Q
Q
Q
Q
Q
Q
Q
Q Q
Q
Q
Q
T ROF
Q
Q Q Q Q
Q
Q
Q
Q
Q
Q
ST S
ENC VID PRO
Q Q Q Q Q
Q
Q
Q
Q Q
Q
Q
Q Q
Q Q
Q
Q Q
Q
Q
Q Q
Q
Q
Q
Q
Q
Q Q
Q Q Q Q Q Q
Q
Q Q
Q
Q
Q Q
Q
Q
Q Q
Q
Q
Q Q Q Q Q Q Q Q
Q
Q
Q
Q
C BAR
Q
Q
Q
Q
Q Q Q Q Q Q Q
Q
Q Q
T EAS
Q
Q
Q Q
Q
Q Q
Q
Q Q
Q
Q
Q Q
Q
Q Q Q QQ
Q
Q
Q Q QQ
Q Q Q
Q
Q
Q
Q Q
Q
SUGA R B US H
QQ Q Q Q Q
Q Q
Q
Q Q QQ Q QQ Q
Q Q Q Q Q Q
Q
Q Q
Q
Q Q
Q Q
Q
Q
Q
Q Q QQ Q
Q
Q
Q
Q Q
Q
Q
Q
Q
Q
Q Q Q
Q
Q
Q Q Q Q Q Q Q Q Q
Q
Q
Q
RD
RD
QQ Q Q Q Q
Q
Q Q
Q
Q
Q
Q
Q QQ
Q
Q
Q
Q Q
Q
Q
Q
Q Q Q Q Q Q
Q
Q
Q
Q
Q
Q Q Q Q Q
Q
Q
Q
Q
Q
Q Q Q Q QQ Q
ERS
Q
Q
Q Q
Q
Q
OLIV
Q
Q Q
Q Q
Q Q Q QQ
Q Q
Q Q
Q
Q
Q
Q
Q
Q
Q
Q Q
Q
Q
Q
Q
Q
Q Q
Q Q Q Q
Q
Q
Q
Q Q
Q
IRN
Q Q Q
Q
QQ Q Q Q
Q
Q Q
Q Q Q
Q
Q
Q
Q
Q
Q
Q Q
Q
QQ Q
Q Q QQ Q Q Q Q
Q
Q
Q
QQ Q Q
Q
Q
Q Q
Q QQ Q
Q
Q
Q
QQ Q
Q
Q
Q
Q
Q Q
Q
Q
Q Q Q Q
Q
Q
Q
Q Q
Q
Q
Q
Q
Q
Q
Q Q
Q Q Q Q
Q
Q
Q
Q Q Q
Q
Q
Q
Q Q
Q
Q
Q
Q
Q
Q
Q
Q Q
Q
Q
Q
Q
Q Q Q Q Q
Q
Q
Q
Q
Q Q
Q
Q
Q
QQ Q
Q
Q Q
Q Q
Q
Q
Q
Q Q
Q
Q Q Q
Q
E RD
Q
Q Q
BA FAIR
Q Q Q Q Q
Q Q
Q
Q
L W OO D
Q
Q
Q Q Q
Q Q Q Q Q QQ Q Q
Q
Q
Q
S RD
Q
Q
Q
Q
Q QQ Q
Q
Q
Q
Q
Q
Q QQ
Q Q Q Q Q Q Q Q Q Q Q Q Q Q Q Q Q
Q
Q Q QQ
Q
Q
Q
Q
Q
Q
Q Q Q Q
Q
Q
Q
Q
Q
Q
Q
Q Q
Q
Q
Q
Q Q
Q
H COS
Q Q Q Q
Q Q
Q
Q Q Q
Q
Q
Q
Q
Q
Q
Q
QQ Q Q Q Q
Q
Q
Q
Q
Q Q Q
Q
Q Q
Q
Q
Q
Q
Q Q Q Q
Q
Q
Q
Q
Q
Q Q Q
Q Q Q Q Q Q QQ Q
Q
Q
Q Q
Q
Q
Q
Q Q Q
Q
Q
Q
Q
Q
Q
Q
Q
Q Q
Q
Q
Q
Q
Q
Q Q Q
Q Q Q Q Q Q Q Q Q
Q
Q
Q
Q Q Q Q Q Q Q Q
Q
Q Q
Q Q Q Q
Q
Q Q
Q
Q
Q Q Q Q Q
Q
Q Q
Q
Q Q
Q
Q Q
Q
Q Q
Q Q Q
Q
Q
Q
Q
Q
Q
Q Q
Q Q Q Q QQ Q Q
Q
Q
Q
Q Q Q Q Q
Q Q
Q
Q QQ Q
Q
Q
Q
Q Q Q Q
Q
Q
Q
Q Q Q Q
L LIN
Q
Q
Q Q
Q
Q
Q Q Q Q
Q
Q
Q Q Q Q
Q
Q Q
Q
Q
Q
Q Q
Q
Q
Q Q
Q Q Q
Q
Q Q Q Q Q
Q Q Q Q
Q
Q
MIL
Q
Q
Q
Q
Q
Q
Q
Q
Q Q Q Q Q Q
Q
Q
Q
Q
Q
Q Q
N
Q
RD
Q
Q
Q Q
Q Q
Q Q Q Q Q Q
Q
Q
Q Q
RD
Q
Q
Q QQ
Q
Q
Q
Q Q
Q Q Q
Q
Q
Q
Q QQ Q
Q Q Q Q Q Q Q Q Q Q Q
Q Q
Q
Q Q
Q Q Q Q Q Q Q Q Q
Q
º
Q
Q Q
Q QQ
Q Q
QQ Q Q
Q
Q
Q Q QQ Q Q Q Q QQ Q Q Q Q Q Q Q Q Q Q
Q
Q
Q QQ
Q Q QQ Q Q Q Q Q Q
Q
Q Q Q Q
Q
Q
Q QQ
Q Q Q
Q Q
Q
Q Q Q
Q Q Q
Q
Q
Q
Q Q Q
Q QQ
Q
Q Q Q
Q
Q Q
Q
Q QQ Q Q Q Q Q Q
Q QQ Q Q
Q Q Q
Q
Q
Q
Q
Q Q Q Q
Q Q Q Q
Q
Q Q Q QQ Q QQ QQ Q Q Q Q Q Q Q Q Q Q
Q Q Q Q Q Q Q Q Q Q Q Q
Q Q Q
Q Q
LINE
Q
Q
Q Q Q Q
Q Q Q Q
Q
Q
Q
Q Q Q Q
Q
S BAN
Q Q
O:\GIS\MXDs\15000-15099\15069-001 TY Lin International Canada Inc - Natural Environment Investigation - Kawartha Lakes Master Plan\2024-10-10 EIS.aprx
Q
Q Q Q Q Q Q Q QQ Q QQ
Q
RD
Q
Q
Q
Q Q Q Q Q Q Q Q Q
ON
Q
Q
Q
Q
Q Q Q Q Q
MO
Q
Q
QQ Q
Q Q
Q
Q Q
Q Q Q Q
Q Q Q
Q
Q
Q Q Q
Q Q
Q
Q
Q
Q
L ST A
Q Q
Q
Q
Q
Q
Q Q Q
QQ Q Q Q QQ Q Q QQ Q Q Q Q
Q
Q
Q Q
Q
Q
Q
Q Q
Q
Q Q Q Q Q Q Q Q Q Q Q Q Q Q Q Q Q Q Q Q Q Q Q Q
Q Q
Q Q
Q Q Q
Q Q Q
Q
Q Q
Q Q Q Q
Q Q Q Q Q Q Q Q
D 49
Q Q Q
QQ Q
Q
Q Q Q Q Q
Q
Q Q Q Q QQ
Q
Q Q
Q Q
TY R
Q Q QQ Q Q
Q
QQ Q
Q QQ Q Q
Q
Q
Q
Q QQ Q Q Q Q Q
Q
Q
Q Q Q
Q Q Q
Q Q Q Q Q QQ Q Q Q Q
QQ Q Q Q
Q
Q Q Q Q Q QQ Q Q Q QQ Q QQ Q Q Q Q Q Q Q
Q
Q Q
Q Q
Q Q
Q Q Q QQ Q Q Q
Q Q
Q Q QQ Q Q Q Q Q Q Q Q
Q
Q
Q
Q Q
Q
N COU
Q Q Q Q
Q
Q QQ
Q Q QQ Q Q Q
Q Q Q Q Q Q Q Q
Q Q Q QQ Q Q Q Q Q Q Q Q Q Q Q Q Q Q Q Q Q Q Q Q Q Q Q Q
Q
Q
Q
Q Q Q
Q Q
Q
Q
Q
Q
Q
Q
Q Q
Q
LINE
Q
Q
Q Q
Q Q Q Q Q
Q Q Q
Q
Q
Q Q Q
Q Q Q QQ
Q Q
Q Q
Q
QQ Q
Q
QQ Q Q Q
Q Q Q
Q
Q Q
Q
Q
QQ Q Q Q QQ Q
GLEN DR
Q Q Q Q Q Q Q Q
Q Q Q Q Q
Q
Q
Q QQ Q Q Q Q Q Q Q
Q Q
Q
Q
Q
Q Q
Q
Q Q Q Q QQ Q Q Q Q Q Q Q Q Q Q QQ Q Q
Q QQ
Q QQ
Q
Q Q
RD BAY
Q
Q
Q Q Q Q
Q
Q Q
Q Q
Q
Q
Q Q
Q
Q
Q Q
Q
Q Q Q Q Q Q Q Q Q Q Q Q Q Q Q
Q Q Q Q Q Q Q Q Q Q Q Q Q
Q Q Q Q Q
Q
Q
Q
Q
Q
Q
Q Q
Q
Q Q
Q Q Q Q Q Q QQ Q Q Q
Q Q
Q
Q
Q Q Q Q
Q
Q Q
Q
Q Q
Q Q QQ
Q
Q
Q Q
Q Q Q
Q Q Q Q Q Q Q Q Q
Q QQ Q Q
Q Q Q Q QQ
Q
QQ Q
Q
Q Q Q QQ Q Q Q Q Q Q
Q Q Q Q
Q
Q Q
Q Q
Q Q Q Q QQ Q QQ Q Q
Q Q Q Q Q Q Q Q
Q
WES CRO
Q Q Q
Q Q Q Q Q Q QQ Q Q
Q
Q
Q Q
Q Q Q Q Q
Q
Q
Q
Q Q
Q
Q
Q
Q
Q
Q Q
Q Q
Q
Q
Q Q QQ Q Q
Q
Q
Q
Q
Q
Q
Q Q
Q
Q Q Q QQ Q Q Q
Q
Q Q Q Q
Q
Q
Q
Q
Q Q
Q Q
Q
Q Q Q
Q
Q Q
S TATE
Q Q Q QQ Q Q
Q
Q Q
Q Q
Q Q
Q Q Q Q Q Q Q Q QQ Q Q QQ
Q
Q Q
Q
Q
Q
Q Q
Q Q Q QQ Q Q Q Q Q Q Q
Q Q
Q QQ Q Q Q Q Q
Q Q Q Q Q
Q
Q
Q Q Q Q Q QQ Q Q Q Q
E RD
Q
QQ Q
Q
RD
Q Q
Q
Q
Q
Q
Q
Q
Q
Q Q
LAK
Q
Q
Q
Q
Q Q Q
Q Q
Q Q Q Q Q Q Q Q Q Q Q Q Q
Q
Q
Q
Q Q Q Q
Q
Q
ITTS
Q Q
Q Q
DEV
Q
Q
Q
Q Q
Q Q Q Q Q Q Q Q Q Q Q QQ Q Q
Q Q Q
Q Q Q
Q Q
Q
Q
Q
Q Q Q
Q Q
Q
Q
Q
Q Q
Q Q
Q
Q Q Q Q
Q Q
Q Q Q Q Q Q
Q Q
Q
Q
Q Q QQ Q Q
Q
Q
Q
Q
Q
Q
Q
S BAS
Q Q Q QQ
Q
Q
Q
Q
Q
Q
Q
Q
Q
Q
Q QQ Q Q Q Q Q Q
Q
Q
Q Q Q QQ Q
Q
Q
Q Q Q Q
Q
Q
Q Q
Q
Q
Q
Q Q
Q Q
Q
Q Q
Q
Q Q
Q Q
Q Q
Q
Q Q
Q
Q
Q
Q QQ Q Q QQ Q Q Q Q QQ Q Q QQ Q Q Q Q Q
Q
Q
Q
Q Q Q QQ Q Q Q Q Q Q
Q
Q
Q
Q
Q
Q
RD
Q
Q Q Q Q Q Q Q Q
Q Q
Q
Q QQ Q
Q
Q
Q
Q
Q
Q Q Q Q Q Q
Q
Q
Q Q
Q
Q
RD LYS
Q Q Q
Q Q
Q
Q Q Q Q QQ Q
Q
Q
TUL
Q
Q Q
Q
Q
Q Q Q Q
Q
Q
Q
Q Q
Q Q Q Q Q
Q Q
Q
Q
Q Q
Q
Q
Q
Q Q
Q
Q
Q
PI
Q
Q Q
Q
Q
FR 72
Q
Q
Q
Q
Q
Q
e e e ee eeee e e ee e e e e ee e e e e e e e e e eeee e ees e e e e e e eee e e e ees e see s s s e s seee s e e e ee e e e e e e es e e e e e e s s s e s e s s e e e e e e s s e s s e e s s e s e ee e s e e e e s e e e e s e e s e s ees es es ss es ee s eesse e ss s es s s ss s e s ss e e ee e ss s se s s s s s s s s e e e e ee e e e e e e e e Bury's Green e e e e s REGIONAL LOCATION e s e e s e s s s e ss e s e se e s ee e s ssss es ee s ee es e e ses e s eee ee eee e ee es ee ee es ees e NATURAL HERITAGE ees e e ess s e s s e s s s s s s e e e e e e e North e e e ee eeee es e e e ess es es s ss sse s s e e s ee s e ss s e ees sss es s es e es s s ese es ss es ss e e e e s e s s e s e e s e ASSESSMENT e s e e e s e s s s s s sss s s s s s ss s e e e ses ees ee ss e es es es s s s e ee es e e ee eeee e eess s es ess es es eess eeee ee ees es s s es ees s s esee eee e s e s s see s s s e ss s e s TY LIN INTERNATIONAL s s ess es e eee e ees e ss s s e e s s s s s s e e e e e e e e e e e e e e e e e e ees ese s ese e e ese e se es ses ees ss e ses s ee s es City of Kawartha Lakes, Ontario s eesee ee s s se e e eeee e ss s Balsam Lake e s ese e es s e ee ese s ees e sseses es e ssee e s s se se s s s s s e e ee e eeeee es e eee e es es ee e s e es e e e ese se es es eee s e s e s e s e s e ee s s s s s s ss s e e s e e e s s e e eee s e e s ee s sse eseee s e es ee e e e s s s e s e e e e ss s se e s s ss s see ee Ds ee ee e e ees eess es es s se se se e e es s es es eee es s e esse e e eee eeee ee ss e s Re ess e s se eee eeeee s e ees s se s e esees s Ms e s s s e se s LEGEND LSO es e e e e e e e e e e e U e ses e e ee e e G s e e ees e e e e e e O e e e e e s s e s e e e s e s s P ese ee ee s e ses s s e e s s s e ee s ses s e s s e s ss ee e e Goose s e es ss s e s ss s e s s e s e s e s s e s e e s e e s s s s s s s s Highway e e e e e e e e e e e e e e e e e e e e e e e s e ee e e e e e e e e s e D e s s s s s s e e e e e e Lake e s e e e s e e e e e e ess e e e s e e s e s e e e ee e e e e e e e e e e e e e e s e e s s e ss s es ee ees s ee ss ee s ss see e e e e e ee e e e e e ees ss s se e e ee seseeFalls eeeee ee eeee s eMouth s e s e es eee es ee s ees e e ses Burnt River es sFenelon eee Major Road es e ee e es s ee ese e e eeess e eeeeeBobcaygeon ese eses ss ss ee s e s esee s s s e e e e e e e ees e e e e e e e s e e e e s e e e e e e s e s s s e e s s e e e M e s s S s s Wetlands e O s s e e e s e e e e e e s e e e e e s s s Oe e e e ee s e e e s e s e s se e e R Ie e e e N G se s s s s s s e e e e e eee e e e e Minor Road ee e e es e e e es e s ess ee e e ese s s e se es see ee e e se ee esees e e ee e s s e ss ee ee eesess es s eeseseses s s e e e e e e e ss e e e e e e s s s s s ee ss e s e e e e s s e s e s s s e e s e s e e e e s s e e s e e e e s e e ss e e s e e e e s s ese s e es eee ss Watercourse es e s s s s eee s s s e ss ees s ees es e ee s s EAe ee es eSe Re e ess s e eOLDs Ts eeee ee es e s ese s e es se s es es s s e e e s ss sees eM e ess eee e e e e ees es s es eees Ce es e e es e ees ss ss e e De s e e s s s s s s s s s N s Balsam e e e e e e e e e ess es e eee e eses Unevaluated Wetland seeD eseYSs ee ese s e s e e eeeee s e e ee es LA ee ee e e s ses e esese e ss ee ee es s s e e ee ees es s E W E I Sess s ss s seeRee ss ses s Lake 15 eees e es es es De e e e e 6E-9 e e e e es e s s s ee s s e s s e s s s e Lindsay e s e e Ee ses e eTRENe e e e e e s s e s E e e s s e s s e e e e e se e e s R s T CANALs s e e e ee e e s ss e T s s s s s e s s Rutherford ss e Locally Significant Wetland R see Ds e ee ee EDAs eee s e eee e e ee ee e ees eee e seeRs ss ese se ee ee e s sss es ee e ee eees eess e es ee ese s eess s e e Cs esees e s e e e eess es s ses s s ss Creek s e e e e e e e e e e e e e e e e e s s e e e s e s e e e e e e s s s s s s es e ssss ss e eComplex e sses ses es e e e e e e Provincially Significant Wetland ess e sses s e eee e e e ee ee esess s e s ee e se e es e es eese ee eee s ee e e es s e es se es s s es e see es es ss s ese e es ess e e s e es ess s s s e s s e s s s s s s s s s s s s s s s s e e e Fish Spawning Area ee e e es e De es esese s es s es es e s s es ee e s ses es s es s ess e ee e ee e e s s ses e ee e e e se s se es e e es ss se e VEN e e e R e ee s e e ee s s s s s s e e e e e e es ee e ee esee e eRENH A es ee es ss e ss eees e ees es ees ees s ss ee es s e e s ss es ses es ss eess e ess ANSI, Earth Science s ees ee se ee e es s ss es W s s se s s es s s s e e e e e e e e e e e e e e e s e e s s s e e e s s s e e s e e e e s e es s e e e ss e e s e e e ss e e e s s s e e e s e s s e s s s s e e e e s e s s s s e e s e s e ese e e s s e e s s se e s es s s s e es ssss ee s es ANSI, Life Science es e ee s ss ese ee es ees es eees e ee ee e eeeseee es s s es eses e ess s eese s e ees s ese s ees es es es e e e se ee ss e s s s se s e e e ee e e e e e e e e e s e s e e s e s e s e s s s s e e ss ee e ee ss s s e ee s e es ss e White-tailed Deer Wintering Area ssees s e ee ee see s ss e ese ese ees s s sessess s s s e e e es ee e e ee s se s e ss s s s es es s e ee s ee es ee s es es eses (Stratum 2) ese es se s se eee e s e e s ee e e es se e e s es s e s e ss s e e s s s s ss ss s s es e ses e ee e e esee eeess es ees e e es ses s sssss s e s s s s e e s s s ee e e s es e e e e e e ee ee e e s e s es s s e s e s e s s s s s e e s s s ss s e s e s s e s e s s s se s s ss ss Significant Woodlands RDs eee es e es e ees e eHELLSs e e e eees e es ee e e eees eees eee e s s s s s e es s es ees ee s s e e eses ss e e eee e es eses s ess s eee s eees s e s s s sss e se eee s s e es ss C se e e s seesMITs ee s s ss ee s s e e e e e e e e e e e e e e e e e e e e e e e e s e e s e e s e s s s s e e e sss e es sse e es es s s eses e es e s ses e e es se e Ecodistrict s s ess ss se s s es e es ss es es ee ess s s ss es es s s eess s s s s s s s s s ss es s s s e ee ee ese e e es eee ee ee ee e e es e e es s s s s es s e eeeess s e eese ee s e es es es es es s sees e s e ee e esee see ees s s e e ss eeee ee e s es es s e e e e es s e s ee s ee s s e e e s e e e s s s e e e s e s s s s s s s s s s s s s s s Water Area eeeee e e ess e ee ee eeeeeeeee es s eses s e e see ees e ees e s e e eeeee s es ss e e e ees ees Cameron Lake e s ees e ees e s s s e es ee e e ee ese e Creek ees ee e sse e e ee es s se s Pearns s seees s se s e eess ee e e e e e e e e e e e e s e s e e e s e e e e e e s e e s e s e e e e e e e e e e s s e e ss e e e e e e e e e e s e s e s s se s se s ses e es e s eee ee ee Wooded Area s ee e sCOUeNeTs e se see esee s ss eese s ee ese e eeee e ee es ee eeee s e Re ee ss e es s e ese e ee e ee ee e ee eses D 8e es e s ss e es s esee e s ee s s eee e s s ee eeYs s s s es e ee e Dee s e e s e s s s s Rs s s s S e e e e N e e e e e e e e e e e e e e e es e ee Re Built Up Area Verulam e s es s e e se e s Ae ses s es ees e see ee eee e ee e e eee Ee s ee es s es e e ss se ee eeeeees Pe es ess s es s e ee s e ees ee s es se se s ees e eees e e ee es Park e ee es eeeee ee ee es ee e e s ss e e s e e s s s e e ese e ee e e ee s eeseeseee e s e e ss s es s eee e s ss ese s e s e ss s 3km Boundary Buffer s e s s s North Complex e eee eeeee e ees eee ess e ss s ss ee es ss s e see es e s e e es e ees es e eese e s es e eees ee e e eees e eee e ese ses eeee s s s s e e e e e e e es e s s e e e e ee s e e e e e Fenelon Falls Settlement Area se s se e see esse eee ees es es e es s RA sss see ss s e s sse s s sse s s eeesee e e s s s s NC es eee eees e e es es es ee e s e ee e s s e es ee ese e s IS e se ee e es ee e s ss se es s esee esesses se s e s e s ee s s s ss e e s e s e ee s s s s s s s s s s O s s E W ee e ees e se ee ses eese s see e eDee eeeeeee e e es e s ss eees s e ee e eeAILe s es e eee eeee ss e es R e ses ees s s sWYCH e e ess es ees ess ss s s s se ss s ss Te e e e e e e e e e e e ee e ee e e e ITEee e e e s s s s s s e s s e e s s s s e s e H s e s e e s s s e e s e e s e s s s e e e s s Notes: e s W e e e s e e s s e es ss se se se e e ss e ee ee e s s s se es e ess s s s e e e ese s s ss s s s s - This document contains information licensed under the Open Government e e e e e e e e e e e e e e e e e e e e e e e e e s e ee e e s e e s s e e e s s e e e s e e es e e s s e s s s e eee s e s s e License - Ontario. s s e s e e s e e s e e e es e s ees s s s e ses e s e e e s s e s e ss e s e e e s s e se s s s e s e ee s s s e s s s s s s s s s s s s s s s - Distances on this plan are in metres and can be converted to feet by s e e e e e e e e e e e e e e e e dividing by 0.3048. es esee e 6E-8 ese e s eee es s se e e esee see es ese s e e ee es ee s eees e ee ee e e ss ses e ss e s eesee s e eeees ese ee e es ee e e es es e e e eee es ee ee es s s sseses esee s e eee - Cambium Inc. makes every effort to ensure this map is free from errors but s ses see e s ee e e ee ee ee e e e e e e es e e es e e ee e e se s A e s ee ee eees s cannot be held responsible for any damages due to error or omissions. This es e s ee ee s s e s s e ee e e e s e e e s s e e e e e e e e s s s s s s s ss e e s s e e s e e eee e s e s s e e e e ee e e e s s s e e s s s s s e e e map should not be used for navigation or legal purposes. It is intended for s s s s s s Gs s s s s s s e e e e e E e e e e e e ee e ee e e e e e e e e e e e s e e e e e e e s e e e e e e s O e s s e e e s e e s e s e s s e e s e s s e e e s e s e e s e s e e N e s e e e ee e s s e e es e s general reference use only. es s ese s es e esese s e ee e s e s e s D s e e e e s s s ss s s s s s s s R s s eee eeeAe ee e ee e e e es eee e eeee e s s ee se ee esss es s s e s es s ee s s s RMe e ss eese e ee s ee e eses see ee e ees e ee ee e se eee e s e e ee eee ee e s ese e e ss e ess e e ss se ses s EN e eee eeGeLee e ees e e e e e e e e e e ese e e e e e e s s s e e s e e e e s s e e e e s es s s e e s e e s e s s s s s s e s s e e e s e e s s s e e e e e ess ss s se s ess 194 Sophia Street e e s s s se e e e e e e e s e e s s s s s ss s eee ess e e s esesss e es e e ee e ee e ee e es e Peterborough, Ontario, K9H 1E5 es ee eee ee e e e e e ee ee e e eee s s seee s e ee e es eeeee es s e es es e es ee e s ees e e ee e e e e s e ee e es s eseRD e e es es s sses s e e s e Cameron Tel: (705) 742.7900 Fax: (705) 742.7907 s s s s s s s s s s ss s s Sturgeon Lake e e e e e e e e e e e ee es e s s e ee eNe s www.cambium-inc.com eees eee s es ee eeee ON s eee s s e es s ee es e e e e e e e e e eeLake ee ee e e e e e es eseee STe es es es sss ee ee e se s eeNo. e e ses s es ee s sses s es s ss ss 14 e es e eee e ee es s e e ee ee es e s JOHs s se s e ee eee eeee e s e e s ss ee eeeee e s e e e6 ee e e e s ese e e e ee e e e No. s s eees e s eeses e e s s e e s e e e eses e ee e e e e e s s e e e e e s s s s s e e s ess e es e ee es e eee es es e eeee e e es se e e ee e e see e ee e s ee e e es ee es s see e eeesee e e e e e e e e ee es ese s e e e e e e ees e s ee e ee e e ee esee ee esesee s e sss see FENELON FALLS NATURAL e se se s s s e e e ees e e e e e e e e e e e e e e e e 0 e e ee e e e e s e e e e e e e e e s 3 e s ss s s es es e Y RD s e s e ee ee sse sses es ee e ees s s e e e e ee e e e e es es e es s es sess eses e s e e eee s s e e e s s s OUNT ee e eeee ee e ee e e es eee es e e eeese ese e es ee e ese esess es see HERITAGE FEATURES eee ee ee e ee es C ee e e eese e ee ee e e e e eee sess es eses e e e e e e e e e e e e e e e s s s s s s eeee es e e ee e e e ees e e e s e ss eeEllery s es s eeeeee e e Date: s s November 2024 e e ee se e ssesesMartin e ee eeeese e e ee se e Project se e es e ee e eSturgeon e e eLake ee No.: e es e s s Powles e e e eee e e e eee e s e es e e e ee e ee ee eeee ese ees e Bay e ee e e s e e s e e e e e 15069-001 Rev.: e e e e s e e e s e e s s s e e s e Creek ss e s ee e s e e e e s s e s s e s e e s s s s s s Corners s ss s s Anstonia s ee ee e e e es ee ee eeeSwamp e s ssss e ee e ses ee ess s Projection: eeee es s eScale: ee ees e ees ees ees s esesees es ee ee s eand e es s s es s e s e e e s e s e ese s e Complex e e eess ee ess s s ee s s Sandy s e 1:60,000 NAD 1983 UTM Zone 17N e e e 0 0.5 e e 1 e 1.5e e 2ee 2.5 ee se e e e e ee e e e s s s s s e s e s e e e s s s s ee s e s e e e e e e e e e s s e e e e s s s e s s e e s s s s e s s e e e s e e e e s e e e ee ese es esse eess ee es e es s sse Point ee s ss e s e e s eCreated by: es ee s kmes ee es Checked by: Figure: e ess ess ee e s es ee s ee es eee es s ee ese e e e e e eee s e es e ee e e e e e e e ese es e ee es s ees s es e ee s e e e eseese es eCut s s e eee e e s Zion Road e ess es ss ses e ees eee es s e eees e e e s e e e s e e s se s s s CJ DBC 2 e e e e e e e e ee e e e ee e e e e e e e e e e e e e e s e s e e e e e e e s s e e ee e s e e e s s e s e e e e e s e e e e ee s e e e s s e s e s e e e e e e e e e e e ee e e e e e eee e e ee ese eeeee e e e e e e e e e e e e e e e e e e e e e e e e e e e e e ee e e e e e ee ee e e e ee ee ee ee e e ee e e ee e e e eee e eeee Docusign Envelope ID: 3BB3DE27-AB4C-4FB5-8872-CE98205F5E40 Indian e ses es Point e s ee
ee
Q
Q
Q
Q
Q Q Q Q
Q
Q Q
Q
Q Q Q
Q
Q
Q
Q Q
Q
Q Q
Q
Q
Q Q
Q
Q
Q
Q
Q Q
Q
Q
Q
Q Q Q Q
Q
Q
Q
Q QQ Q
Q Q
Q
Q
Q
Q
Q QQ
Q
Q Q Q
Q Q Q Q
Q
Q
Q Q
Q Q Q Q
Q
Q
Q
Q
Q
QQ Q Q Q Q QQ Q Q
Q Q
Q Q QQ Q
Q
Q
Q
Q
Q
Q
Q Q
Q
Q Q
Q
Q
Q
Q Q Q Q Q
Q
Q
Q Q
Q
Q
Q Q
Q Q
Q
Q
Q Q
Q
EZE RD
Q
Q
Q
Q
Q
Q
Q
Q
Q
Q
Q Q
Q
Q QQ
N COU
Q
Q Q
Q
LAN
Q
Q Q Q Q Q
Q Q Q Q Q Q Q Q Q QQ Q
Q Q
QQ Q Q
Q
Q QQ Q QQ Q Q
Q
Q
Q
Q
Q
Q
Q Q Q Q Q Q
Q
Q
Q
Q
Q
Q
Q
Q Q Q
Q
Q
Q
Q
Q
Q
Q Q Q
Q
Q
Q
Q
Q
Q Q Q QQ Q Q Q
Q
Q
Q
Q
Q Q Q Q
Q
Q
Q
Q Q Q QQ Q QQ
Q
Q
Q
Q
Q
Q
Q Q Q
Q
Q
Q
Q
Q Q
Q
Q
Q
Q
Q QQ
Q Q
Q
Q
Q
Q Q
Q
Q
Q Q QQ Q
Q
Q
Q
Q Q Q Q
Q
Q
Q
Q Q
Q
Q
Q
Q Q
Q
Q
Q
Q Q
Q
Q
Q
Q Q Q Q Q Q Q Q
Q
Q
Q
Q Q Q Q
Q
Q
Q
Q Q
Q
Q
Q
Q Q
Q
Q
Q
Q
Q Q
Q
Q
Q
Q
Q
Q
Q
Q
Q
Q
Q
Q Q Q Q
Q
Q
Q Q
Q
Q
Q Q
Q
Q
Q
Q
Q
Q
Q
Q
Q
Q
Q Q
Q
Q
Q
Q Q
Q
Q
Q
Q
Q Q Q
Q Q Q
Q
Q Q
Q
Q Q
Q
Q
Q
Q
Q
Q
Q
Q
Q
Q
Q Q Q Q Q Q Q Q Q
Q Q Q Q
Q
Q
Q Q
Q
Q
QQ Q Q
Q
Q
Q Q
Q
Q
Q
Q
Q
Q
Q
RD
Q
Q Q
Q Q
Q
Q Q
Q
Q
Q QQ QQ
N ERO
Q
Q
Q
Q
Q
Q
Q
Q
Q
Q Q
Q Q
Q
Q
Q
Q
Q
Q
Q
Q
Q Q Q Q Q
Q Q Q Q Q
Q
Q
Q Q
Q
Q
Q Q Q Q Q Q Q Q Q
Q
Q
Q Q
Q Q Q
Q Q
Q
Q
Q
Q
Q
Q
E
Q
Q
CAM
Q
Q
Q
Q
Q
Q Q
RD SETT RUS
Q
Q
Q Q
Q Q
Q QQ
Q
Q
Q
Q Q
Q
Q
Q
Q
Q
Q
Q
Q
Q
Q
Q
Q
Q Q
Q
Q
Q Q QQ Q Q Q
Q
Q
Q Q
Q Q QQ
Q Q
Q Q
Q
Q Q Q
Q
Q
Q
Q Q
Q
Q Q
Q
Q
Q
Q Q Q
Q
TRY
Q
Q
Q Q Q
Q Q
Q Q Q Q Q Q Q
Q
Q Q
Q
Q
Q Q Q
Q
Q
Q
Q
Q Q
Q
Q
Q
Q
Q
RD
Q
Q
Q
Q Q Q Q
Q Q Q
Q
Q
D GLEN R
Q Q Q Q Q
Q Q
Q
Q
Q Q
Q Q
Q
Q
Q
Q Q
Q
Q
Q Q
Q
Q Q Q Q
Q
Q
Q
Q
Q
Q
Q
Q
Q Q Q Q
Q
Q
Q
Q
Q
Q
Q
Q
Q
Q Q
Q
Q
Q
Q Q Q Q Q Q Q
Q
Q
Q
Q Q Q
Q Q Q Q Q Q
RD
Q
Q
Q Q
Q
Q
Q Q
Q
Q
Q
Q Q
Q
Q Q
Q
RD
Q
Q
Q
Q
Q
Q
Q
Q Q Q Q Q Q
Q
Q
Q Q Q Q Q
Q Q
Q
Q
Q Q Q Q Q Q Q QQ Q Q Q
Q
Q Q
NT
Q
Q
Q
Q Q Q
Q
Q
POI
Q Q
Q Q
Q
Q
Q
Q
Q
Q Q
Q
Q
Q
Q
Q
Q
Q
Q
Q Q
Q Q Q
N RSO
Q
Q
Q
Q Q Q
Q Q
S
Q
Q
Q
Q Q Q Q Q QQ Q
Q Q
TE PAT
Q Q
Q Q
Q
Q
Q
Q
Q
Q Q Q
Q
Q
Q
Q Q Q Q Q Q Q Q Q Q Q Q
Q
STU R
Q
Q Q Q
Q
Q
Q
Q
HO BYS S RE DR
Q Q Q
Q
Q
Q Q Q Q Q
Q Q
Q
Q Q Q Q Q Q Q
Q Q
Q
Q QQ Q
Q
Q Q Q Q
Q
Q
Q
Q
Q Q Q Q QQ Q Q Q
Q
Q
Q Q Q QQ Q Q Q
Q Q Q Q Q Q Q Q Q
Q
Q
R
Q Q
Q
Q
CH BEA
Q
Q
Q
Q
Q
Q
Q Q Q Q Q
T ST WES
Q
Q Q
Q Q Q Q
Q
Q
Q
Q
Q Q
Q Q QQ
Q
Q Q
Q Q
Q
QQ QQ Q Q Q Q Q Q Q
Q
Y KOR
Q
Q
Q Q Q Q
Q
Q
Q Q Q Q Q Q Q Q
Q Q Q Q QQ Q
Q
Q
HIC
Q
Q
Q
Q
Q
Q Q
Q Q
Q
Q Q Q
Q Q
Q Q
Q Q
Q
Q Q
Q
Q
Q Q Q
Q Q QQ
QQ QQ Q Q QQ
Q Q Q
Q Q
Q
Q
Q
QQ Q Q
Q
Q Q Q
Q Q Q Q
Q Q
Q
Q
Q
Q
Q
Q
Q Q
Q Q
Q
Q
Q Q Q
Q Q QQ
Q Q Q
Q
Q
Q Q
Q
Q
Q Q
Q
Q Q Q Q
Q
Q Q
Q Q Q Q Q Q Q Q
Q Q
Q
Q
Q
ON RGE STU
Q
Q
Q Q
Q
Q
Q Q Q
Q
Q
C RES
Q
Q
Q
Q
Q
Q Q Q
Q Q QQ Q Q
Q Q
QQ Q Q
QQ Q Q
Q Q
Q
Q Q Q
Q Q Q
Q Q
OD
Q
Q
Q Q
Q
Q
Q
Q
Q
QQ Q
Q Q Q Q
Q Q Q Q Q Q Q QQ QQ Q
Q Q Q Q
Q
Q
Q
Q
Q
Q
Q
Q
Q QQ Q
Q
Q
Q
Q Q
Q
Q
Q Q Q Q Q Q Q
Q
Q
Q
Q Q
Q Q Q
Q
Q
QQ Q
Q Q
Q
Q
Q
Q
Q
ST
Q
Q
Q
Q
Q Q Q
Q Q
Q
Q
Q
Q
Q
Q
Q
Q
Q Q Q Q Q Q Q Q Q Q Q
Q
Q
Q
Q Q QQ Q
Q
Q Q
Q
Q Q Q Q
Q Q Q Q Q Q Q QQ Q Q Q
Q
Q
Q
Q Q Q Q Q Q Q Q
Q Q Q Q QQ Q Q Q Q Q
Q
Q Q
Q
QQ Q Q
Q
Q
Q
Q
D
Q
Q
Q
QQ Q Q
Q
Q Q
F
RD
Q Q Q
Q
Q
Q
Q Q
Q
Q Q
Q Q
Q Q
Q
Q
QQ Q
Q
Q
Q Q
Q
Q
Q
Q
Q Q Q Q QQ Q Q Q Q Q
Q
Q
Q
Q
Q
Q
Q
Q QQ Q
Q Q
Q
Q Q Q
Q
Q Q
Q
Q Q Q
Q Q Q
Q
Q
Q Q Q
Q
Q Q
Q
Q Q
Q
Q
Q
Q
Q Q Q QQ
Q
Q Q
Q
Q
Q
Q
Q Q
Q
Q
Q
Q
Q Q Q Q
Q Q
Q
Q
Q Q Q Q
Q
Q
Q
Q
OVE R
Q
Q
Q
Q
GR
ONG AW
Q Q Q
Q Q
Q Q
Q
Q
Q QQ
Q
Q Q Q Q Q Q Q Q Q Q Q
Q
Q Q Q Q Q
Q Q
Q Q Q
Q
Q
Q
Q
Q
Q
Q
Q
Q
Q
Q Q
Q
Q
Q
Q Q Q
Q
Q Q Q
Q Q Q Q Q Q Q Q Q Q Q
QQ Q Q Q
Q
Q Q
Q Q
Q
Q
Q Q Q Q Q Q
Q Q Q
Q Q Q
Q
QQ Q Q Q Q Q
Q
Q Q Q Q
Q Q Q Q Q
Q
Q
Q
Q
Q
Q
Q
Q
Q
Q
Q Q
Q
Q
Q
Q Q Q Q
Q
Q
Q
QQ Q
Q
Q Q
Q
Q
Q
Q Q Q Q
Q
Q Q
Q
Q
Q
Q
Q
Q
Q Q Q
Q
Q
Q
Q
Q Q Q Q
Q
Q
Q
Q
Q
Q Q
Q
Q Q
QQ Q
Q
Q
Q
Q
Q
Q
Q
Q
Q Q
QQ Q Q
Q
Q
Q Q Q Q Q QQ Q Q
Q
Q
Q
Q
Q Q Q Q Q
Q
KAG
O:\GIS\MXDs\15000-15099\15069-001 TY Lin International Canada Inc - Natural Environment Investigation - Kawartha Lakes Master Plan\2024-10-10 EIS.aprx
Q
Q
Q QQ
QQ Q Q Q Q
Q
Q Q
Q Q Q Q Q
Q Q
Q Q
Q
Q
Q
Q
QQ Q QQ Q Q Q
Q Q
Q
Q Q Q Q Q
Q
Q
Q
Q Q
Q
LOUISA ST
Q
Q
Q
Q
Q
Q
Q
QQ Q Q
Q Q Q Q Q Q Q Q
LA K
Q
Q
Y 35
Q
Q Q
Q
Q
Q Q
Q
Q Q Q Q
Q
Q Q Q Q
Q
EB
Q
Q Q Q
Q
Q
Q
Q
RE
HW
Q
Q
Q Q
Q Q
Q
Q
Q
Q Q
Q
Q
Q
Q
Q
Q
Q Q
Q
Q
Q
Q Q Q QQ
Q
Q QQ
Q
E RD
Q
Q
Q Q
Q
Q
Q Q QQ
Q
Q Q
Q
Q
Q
Q
Q
QQ Q
Q
Q Q
Q Q
Q
Q
Q Q
Q
Q
Q
Q Q
Q Q Q
Q
Q
Q
Q
Q
Q Q
Q
Q Q Q Q
Q
Q Q
Q
Q Q
Q
Q Q Q Q
Q
Q Q
Q Q
Q Q
Q
Q Q Q
Q
Q
Q
Q
Q
Q
Q
Q
Q
Q
Q
Q
Q
Q
Q Q
Q
Q
Q
Q
Q
Q
Q
Q
Q
Q
Q
Q
QQ Q Q Q
THLIN NOR
Q
Q
Q Q
Q
Q Q
Q
Q
Q
Q
Q Q Q Q
Q
Q
Q
Q Q
Q
Q
Q
Q
Q
Q
Q
121
Q
Q
Q
Q
Q
QQ Q Q Q Q
Q Q
Q
Q
Q Q Q QQ Q Q Q Q
Q Q
Q
Q
Q
Q
Q
Q
Q
Q QQ Q
Q
Q
QQ Q Q
Q
Q
Q
Q
Q
Q
Q
Q Q
Q
Q
Q
Q
Q Q
Q
Q
Q
Q
Q
Q
Q
Q Q Q Q Q Q
Q
Q
Q
Q
Q
Q Q
Q Q
Q
Q
Q QQ
Q
Q Q
Q
Q Q Q Q
Q
Y RD
Q Q Q Q Q Q
Q Q
Q
Q Q
Q
Q Q
Q
Q
Q
Q
Q
Q Q
Q
Q
Q
Q
Q
NT COU
Q Q Q
QQ Q
RD
Q
Q
Q Q
Q
QQ Q Q
Q Q Q
Q
Q
Q
Q
Q
Q Q Q Q
Q
Q
Q
Q
Q Q
Q
FE LL S
Q
Q Q
Q
Q
Q
Q
º
Q
Q
Q Q QQ Q Q Q
Q
Q
Q
Q
Q
Q QQ Q Q
Q
Q
Q
Q
Q
Q
Q Q Q
Q
Q Q Q Q
Q
Q Q Q Q
Q Q Q Q Q Q
Q
Q
Q
Q QQ Q Q Q Q Q
Q Q Q Q
Q
Q
Q
Q
Q
Q
Q
Q
Q
Q
Q Q Q Q Q
Q Q
Q
Q
Q
Q Q Q Q Q
Q
Q
Q
Q Q Q Q QQ Q Q
Q
DR P OINT RD
ISLA N D
Q Q
Q
Q
Q Q Q Q Q Q
Q
Q
S RD
Q
Q Q
Q
Q QQ Q Q Q QQQ QQ Q Q Q
Q Q
Q
Q Q Q Q Q Q Q Q Q
Q
Q
Q Q
Q
Q
Q QQ Q
S RD MER BUL
N RA
Q
Q
Q
Q Q
Q
QQ Q Q Q Q Q Q Q
Q Q QQ Q
Q Q
Q
Q
Q Q Q Q Q
Q Q Q
Q
Q Q Q
Q Q Q
Q Q Q Q Q Q Q Q QQ Q Q
Q Q Q Q Q Q Q Q Q Q Q Q Q QQ Q Q Q
Q Q
Q Q Q
Q
Q Q
Q Q Q Q Q Q Q
Q Q
Q
Q
Q
QQ Q
Q Q
Q
Q Q
Q
Q
Q Q
Q Q
Q
Q Q
Q
Q
Q Q Q
RTIN
Q Q
Q
Q
Q
Q
Q
Q Q
Q
Q
Q Q Q Q Q Q Q Q Q Q
Q
Q
Q Q Q Q Q Q Q Q
MA
Q QQ Q Q Q
Q
Q
Q
Q
Q
Q Q
Q
Q
Q
Q
Q Q Q Q Q
Q Q Q Q Q Q Q Q Q Q
Q Q
Q Q
Q
QQ Q Q Q Q Q Q Q QQ Q Q Q Q Q Q Q Q Q
Q Q
Q
Q QQ Q Q Q QQ
Q Q Q Q
Q
Q
Q
Q
Q
Q Q
Q
Q
Q
Q
QQ Q Q Q Q
Q
Q Q
Q
Q
Q Q QQ
Q
Q Q
Q QQ Q Q
Q
Q Q
Q
Q
Q
Q Q Q QQ Q Q
Q
Q Q
Q
Q
Q Q
Q
Q Q Q
Q
e ee e DocusigneEnvelope ID: 3BB3DE27-AB4C-4FB5-8872-CE98205F5E40 ee e e ee e e e e e e
e e e e e eeeee ee e e esese e e es e e ee e es ee e eeese e s s e e ee ss e ss s s s ses s e e e e e e e e e e e e e e e e e e e e s ss e e ee s s s e e s s e e e s s se ses s e e e s s s s s es s es es s e s Cameron ees s s s es es e es e e eRD e s s e es e e se s e es s s s es ese s e e es s s s ees e es ee s es H ss s s s s e e esee e Goose e REGIONAL LOCATION e es e e BEAC De e e e ees e e e ee e e e e e e e Re s ess e e e e eLake e Gs e s e s e s s s e e e see e e e e e s e e e s e S s e N ee e s s e s e e e e e e NATURAL HERITAGE s s s s e R ee O s s s e e e e e s eee sees L es s e e s e s s e es e-es eee eHAMBE ee e ee se e s s se s s Lake Esker e e e e e e e e e e e e eNo. e e e e e e e e s e e e e e e e e 6 s C s s e e e e s e e e s s e s e e e s e e e s e s e e e e sesses ASSESSMENT e e e e e e Sturgeon Lake s e e ee e s e s s e e s s s e e e s s e e e e s e s e s s s s s ss s s s ss s e Kame Complex eess e eese ee e e es es es eesees ee e ee ees e sees s eeseCameron e s e eeBobcaygeon eese e ss ees es e ee e se eFenelon ees s TY LIN INTERNATIONAL eses Falls ss ees s e e e e e ee e e s e s s s e e e e e e e e e e ss s s s s s s s e e ee eee e ee s e ee e eee e ee e eeeeeee e e ees s s e ee City of Kawartha Lakes, Ontario ee eee e e se e s eeee e e e ese seses s e e ee e e e s Rock e e se s es e e e e e see s ss RD e e s s seeeeseseese ee e e e e es e e e e Sturgeon e e ee e LOR s e e s e s s e s e s s e ee Y e s e e s e s e e A e e e e s e e s e e s e s s s e e e s N e s s e sLake e es es s se ee e eeeee e s s s ss e e ee s e Drumlin e e es ee e e ee ese e e s ss eees s se es e Sturgeon ee eseeeeeee e e ee ee sTeS RDs s es e eess s ee es ee s ees s s e ee ee es es s ses eee e s e s ee e OIN ss s LEGEND ss s s Pe No. 18 e e 4e e e ees ee e es es e e e e e e e e e e ee e e e e e e ee e e ss e ee s e e s e s s ss s e e e e e s s s s e e Lake No. 26 e s e s e e e e s s ee e e e s e e e e e e s e s e s e e e e e e e e s e e e e s e s s s s Highway s s s s s s s Cameron Site e e e e e e e e e e e e e e e e ee e e e e e s e e e e e e Goose e s s e e s ee e e e e e e s e s e e e e s e ses s ee sseeee ee e s ss e e e e e e eee e e s ese s e se es ees e s e s ee e e s s s ss s s es ee e ee e eee e e e es e e e e e eLake ees es eeeee eee ee ee s e e s e s s Lindsay e Major Road e ee ee s eeeee s ee s e es eeee e ss e ee e e e e es e e e s e e s e e e e e e e s e e e s s s s s s s e e e e ee e e e es eee ee ee ee e ee ese e ee e es ee es e eee eeD eses ee eeee e ee e ee ee e ee e s e s e e s s e s e s e e e e e e e e e eWetland e e e s ss s s s s R s see Minor Road e eeeese e e e eee e s Dunsford ee e e eees e eess esOmemee e e eeee eAYee e e e e e e ee sees e e eses es s ee e ss s ss e MBR e es e e eee e e eee e e eee e e es s ee es CAe s s s s e eeeses Swamp e e e e e e e e e e e e e e eee ee e e e e e s e e e s e e s e e e e ee s e e s e e e s s Sturgeon e e e s s s e s s s e ee e es s ee e e e esee e ee e s ss e ee Watercourse e es e e es ss ss s s e ee es ese ee s s se Complex es eee ee eseee eee e ee es ee ee e s ss e e es e ee s s e se e ee ee se e e eee eeese e ee s es ses s s es ee es e es e eee es ee ss s eee e s s es eLake s s e e e s e s e e e e ee e e e e e s s s s s e eeeeese e No. es ee e se e eINT RD e e 19 e ese e ee e e e se s e e Unevaluated Wetland ee s e e e s eee es e e eesee e eee s e ees e s e eee ee s s ee s s see se s eeeee e ee s ee e eeee eee e O es se e e e es e e e e s e es s s s s s s s ss s Ds EL P ss s e e ee e e e e e e e e e ER Y Re e e e e e e s e s s Ke ee e e s e e e e e s R s e e s s e e s e e e e s C e e e e e e e e e e I O e s s e e e e e e e e e e e s e T s e e s P e ee s s e e e e s s esse e es e es e e es s e se esess eESE FAC eee e es e s s s ss e e Locally Significant Wetland es eeee es s s e eee e ese s ee ee s e eseses ee e es ess e ees eee eeee eee e ese ee eeeee ee e e ee eee e es es ss ss esCHE e e eee s ess ees ss ees es es e e e ee e e s ss e ee e s s e e e e e e e e e e e e e e e e e e e e e e e es e e Sturgeon e e Provincially Significant Wetland e s ss e es se eeee es s e e eee eees s e e ee s e e e e e ee es e eee e e ese s e e ss s ess ese eeeee e e e e e s e s e ee s e s s e e e e s s s e e ee ee es e eee e es e e eee e eLake eeee eeeeeee e ee e e ee e s e s e e ee s eee e e ee s eee ee s e e e e e e e e e e e e e e e e e s s e e e e e e e e s s s Fish Spawning Area s e s e s s North No. e 27 ee eStoney ee eese ee es es e eees ss eeees eLindsay ee eee es s s eeee s ee s e e e s s e es s s ss s s ee e ee e ee eesesee eRoad e ee es ees s se s es e s e e e e e e e e e e e e e e e e e e e e e e e e s e e s e e e s e s e ss e s e e e e s ANSI, Earth Science e e ee e e ee e ese e ese e ee e ese e e es ee Creek s ee ess se ee s e ee e s ee s s se s Cut e e ee e e e e e e es e e e e e e e e e e s e s e s e s s e e s e e Headwaters s s Cambray Creek s e e e e e e e s e e s e s e e e e e e s es e es es ss se ee es ss e e se s s se s ANSI, Life Science e es ees e es es see ess ee ee es seee ee ese e e ee e Wetland s ee s s se s eseses e e ee sesee e e ee e e s s e e ses eeee e es ee s e e s s s s s e e e e e e e e e e e e e es e eeese eesese e ee ss e s ees ees ee s ee e es White-tailed Deer Wintering Area se s ees e e ses ee ss eee ee eee eee esee es s e ee ee ss s s s se s se e e s eese eeee e es es e e e es eee e ee ees es esee (Stratum 2) s e esee ee e s ese s e s e s e e e s e s s s e e e e 6E-8 e e s e e s e e s D s e e e e s s R s se s s s s s L se e es ee se e e e s es e es e e e ee NIEs e e e e e s e e s s e e s s e PEs e e e e e s e e e e e s s e s s s e s e ee e ee e s e es ee ss e eeee se e ses es s Significant Woodlands seee e Ds ee e e e ee e Re e ee e e ee s e eee es e e eeess se sss ss es e ess e KE s s sss ees e e s s eses e As sees RD ee Le s s ees es es s s s Ne s se ss O E e e e E e e e e e G e e I e e e e e ss es e s s Ecodistrict es s ee e eee e e eeee e Pe ss ee ee s s es ses s e s DeER BRIDG s e e se e e es ss e s s se ees es e ees e ess ees es e ee e e e eeeee e e ss s e e e e ses es e s s e e ee e s s s s HUN s s e e e s Ts e e ss s e s s s e e e e e s s see e s Water Area RD e e ee ese s es e e e e eeese e es e e e e es s es es KER es e ss ees e ees se e e ee e e es e ee e s QUA s e e e e e e e e e e e e e e e ss e Wooded Area se eses es e e e s sse e e ee ee ss RD es ss es e e e s ss es ee IEW s s s s V K O Built Up Area e e s s s e se s BRO esees s eesee e e es se e s e ses see s s s Lindsay es eee e e e e e W s e e s e e e e s s e es s s e T e e s e s e S s s s e e e s ss eAirport 3km Boundary Buffer ees s ses sss see s RNE s es e es e ee e e eee ee e es e e e s e s ee es s e s ee s e es s es COLBOs ee s ee s e es es s ee ese s s s s s e e e e e e e e e e Lindsay Settlement Area es s e ss ese e e ss ees ee e es ss eee eee es es s e s ee es e ese s s s s ss ST W ee es e e es e e ees e eeee e e s es eeeee s es ee ees eeee ses HILL RD e es s es KENT e eee es e s e e e e e YS s e e eTRe eeeeP INN RDe ee s s e s se e ss e ee s e ees ACE ee s RO e e e D e e e s e e s e e s s e e s e s es Notes: ss ees e Reaboro e s DEW - This document contains information licensed under the Open Government e e e ee es e e s s - Ontario. e e e e e e s s e sLicense e e s NE Complex s ss - Distances on this plan are in metres and can be converted to feet by s s ees e e dividing by 0.3048. e e s s e e s e es s e s e e e e - Cambium Inc. makes every effort to ensure this map is free from errors but e s es s be held responsible for any damages due to error or omissions. This e s e eess cannot s sss ees map should not be used for navigation or legal purposes. It is intended for e e ee s ss s general reference use only. e e D e e e e R s s s e s s se s STEAD s s ss e ss s es es es s s s ss s es s ss s M ee es ees e e es s e s s FAR eses e ss e e ess ss es s sses s e sess se e ss se eess ee s se es s s s s s s ss s s s s s s s s es eDs e e s e es ess e ee e ees eD Re eSLAeNTE e e ee es ee e e es ee s s s 194 Sophia Street e e e e e e e s s s e s s ess ss s e e ss e e seee e s e s ese s s s s s s s s s es see e s se s s s Peterborough, Ontario, K9H 1E5 e e e s s s s e s e e s e e s s e e e s e ss s e s s s e e eses esss e e e e s s e Tel: (705) 742.7900 Fax: (705) 742.7907 e e e s s e e e s e e ss e e e ss e s e e s s s s s s s s s s s e ee e e s www.cambium-inc.com e ees e ses e ee eses es e s s ess ese e eees s s eses es eses se s es e ee e e s e ses es s e e es s ss s s es s ss s ses s e es ee e e e e e e e e s s s s e s e e s e s s e e e e e s e e e s s e s s s s s e s e s s s s e s s e e e s s s s ee e ss s es ee ese s e e es ee e s s eeess ss ss s s s s s s es e e e e ese es ees s ees ee es s ee ees s s s es s es e s ees s ee ses ses s ee s e e es s ss es s ee es es ses ee s es s ee s se e sesees es e e es ss e s es e LINDSAY NATURAL e e e e s s s s s s s D R e e e es eee e e e e L e e e e e e e e e e e e e s s e s s e s e e EL se s e ss s s e e e e e e e s s e s e s e s s s e ee s s s e s e s e e W e s s s s e e e e e s e e e s S s e e s e s e O'Donnell es e e e e e sss ss e e HERITAGE FEATURES e D ss s s s ES s s s s s R s s s s s s CRs R ee E e ee e e e e ee e ee es ee ee ee IVs es ees e e ee e ss e e ees s ee se es e e eeLanding s s s Re s es s ee es ees s s s s s e s ss e ee e N RD es e s s e es e e s ee e ss e es s e e es s es ee s s s s s s s s s s s ITAI s s s s s s s s R B e e e e e eeee e e e e e e e e Date: e eees eeComplex s es s see e November 2024 e s eee s s e s es s e eee s ss e e eee s e ssss s s eeProject No.: es s ees s s e s e se LITTLE ss s se ess ee e esee e e s s es s s ees s e s se s s sss ses s e eee ee eees es e eee 15069-001 Rev.: ese es ees es es e ee eees eScugog ss e e s es s e e s e e s e s s e e s e e River and e e e e e es e e s e ee ses e s e e s e esees ee e e s s s s s sss s ees s e e ee ee ee eee ee Scale: e Projection: e eee e eess s e Ms s e Mariposa e sesessss s e ee s Mariposa eses s es s e RD ese e e ss s e s e e es ess s s se s s s se s 1:85,000 NAD 1983 UTM Zone 17N 0 s0.5 1 1.5 2 ee 2.5 e s e e SALEe e e e e e e e e e e s s e e s s s e ss s s s e e Brook s Brook e e e s s e e e s s es s s e ss Cross s e s ees s e s e se s e s e s es s e s s es es s ee e ees s es s ees see es es eEast es e ss s s s s s s s s km s by: Checked by: Figure: e e ees e ee e esee e47 es e ess ese e e ee e e eeCreek eee e ees ee eesee eeses e s e sNo. e s ss e ee e e s s e s e ee es e e ee ee e ee No.15 se e ss esCreated esee e s eee s es es e e s es ee es e s es e s s es e e s es e s e s e s s s s ss e e e e s s s s s s s s CJ s s s DBC s 3 s s s e e e e e e e e e e e e e e e e e e e ee e e e e e e s s e e s s s e e e e e e e e s e ee ee eses e s s e sse ee e s e e s s s e e e e e ss eeeeee eee ee e eee s e eee e e e ee e es e e eee eee ee ese e e e e ee ee ee e e e e e e e e ee ee e e e e e e e eee e e ee e e e e e e e e e eeeeee e eee eee e ee e e e e e ee ee e e eeee e e e e e ee ee eee e e e e e Q
Q Q
Q Q Q Q Q Q Q Q Q Q
Q Q
Q
QQ Q
Q Q Q
Q
Q
Q
Q
Q
Q
Q
Q
Q
Q
Q
Q
Q
Q Q
Q
Q Q
Q
Q
Q
Q
Q
Q
Q Q Q
Q
Q Q
Q Q
Q
Q
Q
Q
Q Q
Q
Q
Q
Q
Q Q
Q
Q
Q Q
QQ Q
Q
Q
Q
Q
Q
Q
RD
Q
Q
Q
Q
Q
Q
Q
Q Q Q
Q Q
Q
Q Q
Q Q Q Q
Q Q
Q
Q
Q
Q
Q
Q
Q
Q Q
Q Q Q
Q Q
Q
Q
Q
Q
Q Q Q Q Q Q Q
Q
Q
Q
Q
Q Q
Q
Q
Q
Q
Q
Q
Q
Q
Q
Q
Q Q
Q Q Q
Q
Q
Q
Q
Q
Q Q Q Q Q
Q
Q Q
Q Q Q Q Q Q Q Q Q Q
Q Q Q Q Q QQ Q Q Q Q Q QQ QQ Q Q
Q
Q
Q
Q Q Q Q Q
Q Q Q Q Q Q Q Q QQ
Q
Q
Q
Q
Q
Q Q
Q Q
Q Q Q
Q
Q QQ
Q Q Q
Q Q Q
Q
Q Q Q
Q Q
Q Q
Q
Q
Q
Q
Q
Q Q Q
Q
Q Q Q Q Q
QQ Q Q Q Q Q Q Q
Q
Q Q Q Q
Q
Q
Q
Q
Q
Q
Q
Q
Q Q Q
Q Q Q Q Q
Q
Q Q
Q
Q QQ Q Q
Q
Q Q Q QQ Q Q
Q Q Q
Q
Q Q
Q Q Q Q
Q QQ Q Q Q Q Q Q Q Q Q QQ QQ Q Q Q
Q
QQ Q Q Q
Q
Q
Q
Q Q
Q
Q
Q Q Q
Q
Q Q
Q
Q
Q
QQ Q Q Q
Q Q Q Q
Q
Q Q
Q
Q Q Q
QQ Q
Q
Q
Q
Q
Q Q Q Q
Q QQ Q Q Q Q Q QQ Q Q
Q
Q
Q
Q
Q Q
Q
Q
Q
Q Q Q Q Q Q Q Q Q QQ Q
Q
Q Q
Q
Q Q
Q
Q
Q
Q QQ Q
Q
Q
Q
Q Q
Q
Q
Q
Q
Q
Q
Q
Q
Q
Q Q
Q
Q Q Q
Q Q Q
Q
Q Q
Q
Q
Q
Q
Q
Q
Q Q Q Q
Q Q
Q
Q
Q Q Q Q Q Q Q
Q
Q Q Q Q Q Q Q
Q
Q
Q Q Q
Q
Q
Q
Q
Q
Q Q
Q
Q
Q Q Q Q
Q
Q
Q
Q
Q
Q Q Q Q Q Q
Q
Q
D RD
Q
Q
Q
Q
Q
Q Q Q
Q Q Q
Q
Q Q Q Q Q
Q
Q
Q
Q Q Q Q
Q
HEA
Q
Q
Q
Q
Q Q
Q Q
Q
Q
Q
Q
Q
Q
Q
Q Q Q Q
Q
Q
Q
Q
Q Q
Q
Q Q
Q Q
Q
Q
Q
HILL
Q
Q Q Q Q
Q
Q
Q Q Q Q Q Q Q Q Q
Q
T RD POS
Q Q
Q Q Q Q Q QQ Q
Q
D LE R
Q
Q Q Q
Q
Q
BRID
Q Q Q
Q
QQ Q
Q Q Q Q Q Q Q Q Q Q Q Q
QQ Q
Q QQ Q
Q Q Q Q Q Q QQ Q Q Q QQ Q Q Q Q Q Q Q Q Q Q Q Q
Q
Q
Q Q Q Q Q Q QQ Q Q Q QQ Q Q QQ Q Q Q Q
Q Q Q Q Q Q
Q
Q Q
Q
Q
Q
Q Q Q Q Q Q Q Q Q
Q
Q Q
Q
Y7 HW
Q
Q QQ Q
Q
Q Q
Q Q Q
Q Q
Q Q
RD
D RS R
Q Q Q Q Q Q
Q
Q Q
Q Q Q Q Q Q QQ
Q
Q
Q
Q
Q
Q
Q
Q Q
Q
Q
Q
Q
Q
Q
Q Q Q Q Q Q
TER HAL
Q
Q Q Q
Q Q
Q
S
Q
Q
Q
Q
Q Q
Q Q
Q
Q
S
Q Q Q
Q
Q
Q
Q
E ST
Q
Q
Q
Q
Q
Q
Q
Q
Q
Q
Q Q Q
Q Q
Q
Q
ELIN
Q
Q Q
Q
Q
Q Q Q
Q Q Q
Q
Q
Q
ANG
Q
Q
5
Q
Q Q
&3
Q Q
Q
Q
Q
Y7
Q
Q
Q
Q Q
Q Q
ST SAY LIND
HW
Q
Q
Q
QQ Q
Q Q
Q
Q
Q
Q
Q
Q
Q
Q
Q Q
Q Q Q
Q
Q
Q
Q
Q Q Q Q
Q
Q
Q
Q Q
QQ Q QQ Q Q
Q Q
Q
Q Q
Q
Q
Q
Q
Q Q
Q Q
Q
Q
Q
Q
Q
Q
Q
Q
Q Q
Q
Q
Q
Q
Q
Q
Q
Q
Q
Q
Q
Q
Q
Q Q
Q
Q
Q
Q
Q
Q
Q
Q
Q
Q
Q Q QQ Q Q Q Q
Q
Q
Q Q Q
Q
Q
Q
Q
Q
Q Q
Q
Q Q
Q
Q
Q
Q
Q
Q
Q
Q
Q
Q
Q Q Q
Q
Q Q Q
Q
Q
Q Q Q
Q
Q
LOGIE ST
QQ Q Q Q QQ Q
Q Q Q
Q
Q Q
RD
Q
Q
Q
QQ Q
RD
Q
Q
Q Q Q Q
Q
Q Q Q Q
Q
Q Q
Q
Q
LERS
Q Q
Q
Q QQ
Q Q Q QQ
Q
Q
Q
Q
Q
Q
Q
Q
Q
Q
Q
Q
Q
Q
Q
Q
Q
Q Q Q
Q
Q
Q
Q
Q
Q Q Q
Q Q Q Q
Q Q Q
QQ Q
Q
Q
Q
Q
Q
Q
SETT
Q Q Q Q
Q
Q
Q
Q
Q
Q
Q
Q
Q
Q
Q
Q
Q Q Q
Q Q Q
Q
Q
Q
Q
Q
Q QQ Q
Q
Q Q
Q Q
Q
Q Q
Q Q QQ Q
Q
O TAYL
O:\GIS\MXDs\15000-15099\15069-001 TY Lin International Canada Inc - Natural Environment Investigation - Kawartha Lakes Master Plan\2024-10-10 EIS.aprx
Q
Q
Q
Q
Q
Q Q
Q
Q
Q
Q
Q
QQ Q Q Q
Q
Q Q Q
Q
C LILA
Q
Q
Q
Q Q Q
E RD DSID
R RD
Q
Q
RD
Q
Q
Q
Q
Q Q
Q
Q Q
Q Q
Q
Q
TREE
A OPM
Q
Q
Q
Q
Q Q
Q
Q
Q
Q
Q
Q Q Q
Q Q Q
Q
Q
Q Q Q Q Q Q
Q
Q
Q Q Q
Q
Q Q
Q
Q Q Q Q
FIEL
Q
Q
H RD
ELM
Q Q
Q Q Q
Q
Q Q Q
Q Q Q
Q
Q
Q Q
Q
Q
Q Q Q Q Q
Q
Q
Q
Q Q Q Q Q Q
Q
Q
N
Q
Y 35
Q
Q
HW
Q
Q
Q
Q
Q
Q
Q Q Q Q Q Q Q Q
Q
E ST ELIN
Q
Q
Q
ARC MON
Q
Q
Q
Q
Q Q Q Q Q Q
Q
Q
Q
Q
Q
Q
Q
Q Q
Q
Q
Q
Q
Q
Q QQ
Q
Q Q
Q
Q Q
Q
Q
Q
Q
ANG
Q
Q
Q
Q Q Q Q
Q
Q
Q
Q
Q Q Q Q
Q
Q
QQ Q Q
Q
Q
Q Q
Q
Q
Q
Q Q Q
Q
Q
Q
Q
36
Q
Q
Q
Q Q Q Q Q Q
Q Q
Q Q Q
Q
Q Q Q Q Q QQ Q Q
Q
Q
Q
Q Q
Q
Q
Q
D ROA
IRD
Q
Q
Q Q
Q
Q
Q Q
Q
Q
Q
Q Q
Q
Q
Q
Q
Q Q
Q Q
Q Q Q Q
Q
Q Q Q
Q
Q
Q
Q
Q
Q
Q
Q
Q
Q QQ Q
Q
Q
Q
Q
Q Q Q
Q
Q
Q
Q QQ Q Q Q
Q
Q
Q
Q Q
Q
Q
Q
Q
Q
Q
Q
Q
Q
Q Q
Q
Q
RD
Q
QQ Q QQ
Q
Q
Q
Q
Q
HTS
Q
Q Q
Q
Q Q Q Q Q
HEIG
Q Q
Q
Q
Q
Q
Q
Q Q
Q
CKL
Q Q Q
Q Q Q Q Q Q Q
Q
Q
Q
Q
Q Q Q Q Q Q Q Q Q Q Q
Q
Q Q
CKB BLA
Q
QQ Q
Q
Q
Q Q
Q
Q
Q
Q
Q Q
Q
Q
Q
Q
Q
Q Q Q
Q
Q
Q
Q
Q
Q
Q
Q Q
Q
Q
Q
Q
Q
Q Q
Q Q
Q
Q
Q
Q
Q
Q
Q
Q
Q Q
Q
Q
Q
Q
Q
Q
Q
Q
Q
Q Q Q Q Q
Q
Q
Q Q
Q Q Q Q Q Q
Q
Q Q
Q
Q
Q
Q
Q
Q Q Q Q Q Q Q Q Q Q Q Q Q
Q QQ
Q
Q
Q Q Q
Q
Q
Q
Q
Q
Q
Q
Q
Q Q
Q
Q
Q Q Q Q
Q Q Q Q Q Q Q Q Q Q
Q
Q
Q
Q
Q
Q
Q Q
Q
Q
Q
Q
Q
Q Q
Q
Q
Q
Q Q
Q
Q
Q
Q QQ Q
Q
Q Q
Q Q Q
Q
Q
Q Q
Q Q
Q
Q
Q Q QQ Q
Q
Q
Q
Q
Q
Q
Q
Q
Q
Q Q
Q
Q
Q
Q
Q
Q Q
Q
Q
Q Q
Q Q Q Q
Q
Q Q
Q
Q
Q
Q Q
Q
Q Q Q Q
Q
Q
QQ Q
Q
Q Q Q
Q
Q
Q
Q
Q
Q
Q
Q
Q
Q
Q
Q
Q
Q Q Q
Q Q
º
Q
Q
Q
Q Q
RD
Q
Q
Q
Q
Q Q Q
Q Q Q
Q
Q
Q Q
URE
Q
Q
Q
Q Q Q
Q
T PAS
Q
Q
Q Q
Q
D LS R HAL
Q Q
Q
Q
QQ Q Q
Q
Q Q
Q
Q
Q
Q Q
Q
Q
Q
Q
Q
Q
Q
Q
Q
Q Q Q
Q
Q Q
Q Q
Q
Q
Q
Q Q
Q Q
Q
Q
Q
Q
D AY R EY B
Q Q
Q
Q
Q
Q
Q
Q Q Q Q Q
Q
ARN KILL
Q
Q
Q
Q Q
Q Q
Q Q Q Q
Q Q Q
Q
Q Q
Q Q Q
Q Q Q Q Q Q Q Q QQ QQ Q Q
Q
Q
Q
Q
Q Q Q Q Q Q Q Q Q Q Q Q
Q Q
Q
Q
SNU G HA RBO UR R D
Q
Q
Q
Q Q Q Q QQ Q Q Q Q Q Q Q
Q
Q
Q
Q
Q Q QQ Q Q
Q
Q Q Q Q
Q
Q Q
Q
e e e ee e eee e e ee ee e ee e ee ee e es e e ee e e e e e ee e e esese e es ee s ee ee e e s e s e ese ee e e s s s ss eseesee eee ese eRiver ee e e e eses e e e e e e e e s s s e e e e e e e s e s e e e e e Pigeon No. 29 s s e e e e e e s e e e e s s Lancaster e ss e ss e s e s s e e se e ee s ePigeon Lake Marsh ss s ee e e ses ss s s s REGIONAL LOCATION RD e e ees eees eeee ss LLe es s s seIs ee s e e CeHeAeRLOeRE PeAR K e s e es eesees s ses ese see NATURAL HERITAGE ee es e ee ees ee s s ee sess e Complex s se ess ee ee e e e e eee e ees e ees YS Hs e eBay DR s Ee s s s ACe e e e e e e e e R e e e e e e e e T e e s e s e e s e s e ss es e e s e e e e e s ASSESSMENT e s e s s e e es s e e e s ee e s s e s e s s s e e s e s s ss e s s s s e s s e s e e s e se e ee Creek ePotash s e s ese e ss s s s ee s ss ese eses s es RD s eeee ese e ee es es e ee esRe ee ee s s seee s s e s s TY LIN INTERNATIONAL e e e s e ees e ee s e es s es ee e s OCK es s s e s ese ese e s e s s s e s s s eee Complex e e s s s e s ss e e e e e e s ee s s s e e s s M s s s s s A e es e e s s e sses eees SHe ee ee ee ee City of Kawartha Lakes, Ontario e ee ees eeee ee s s e ee eees es esesse ee ee ss e e s s s s s s e es ees es es s e s se eseesee s s s eeeee sss s sees s es eses s eee s s s es see se e e e e LINE e s e e e e e e e e e e e s e s s e eee s s e s s e E s s e s e e e e e s s e e e s E e e s e e e e e ee ss ess es se eees e ses e ee s sss s ssYANK e se s e es se e es e e ee sssee s s s s eee ee ee eees e es ee ee e e e e e e e e e s e e e s e s s e e e e s e e e s e s e e e e e s s e s e s s s ee e s e e e e s s e e e e se s e LEGEND ee ss s s s ss s s s se e s s ssesee e ees e s es s seees s Lindsay e e ee es s ee eee s e esee ess e es s e e e ee e es ee e e ess ss e e e e e ee Highway e e ee e e e s s s e e e e e e e e e e e e ee e e e e e ees es es ese e eee ess ese es e e se ee sss sses ees s e s s ese s e se s sees ee ee e ee e ees ese e e e e Major Road esse s s ee es eee Omemee ese eee s es e eees es ess s s s e ees ee s ese es es ese e s e e eesee es ee s s ee eses ee e eees ee eee e ee ee e ee e ee e e e e e e s e e e RDe e s s e e e e e e e e s Cowan's e s s e e e Y e e e e e e e e e s e e ss E e e e s e s e s L e e e s e e ee e s ese s e Minor Road s ess s se s D EMILY VAL es ees eees eeEmily ee ees ee es eses e ee ee CE R ees Bay e ee e es s e ee eeee ses s e ee es s e ee ses eee e ees PEA es e e ees s ee e sesee s ees e ss s s s s s s Creeke s s s e e e e e e e e e e e e e e e e e e e e s e s e e e e e s ese s ee s e ses e Watercourse s e ee ee es see eeee e s es ee e e ee es e es es sssese s es e eees eeee es es s es e es s ee es ee ses s se s s s s ee e e e ees es es ee eee ees e es eeee eNo.ee8 ee es e eeeee e s es s es e ee s s s s ee ees e ss ss s ee eeees eeeee s es ess ee es s e es e s eeee s e s eee e s e e s s s s e s e e e s s s s s s ss s s Unevaluated Wetland ese e es e e ee e ees e ee ese e es eeee es e e s s es e s see ses es ee s es e s eees ee e ee e s eeeee eseese s s s eeee e e ee ee e ses ees e ss e es s ee ee s s e seee s ee s s e e e e e e e e e e e e e e e e e e e e e e e s e e e e e s e e e s e e e e e e e s e e s ee s s e e e e e e e e e s e e e s e s e s s s e ee es e s e Locally Significant Wetland s ss e ees ss ss esee e e es eee s ees ee s ss ee se e ee e ess s eee eeeee ee e ees e NE eeee e ee e e eee eeeeee e e ees es s ee es ees ee e e ss s eee se eeee s s e ee eReaboro eee s eeese ee s e e es e s e s e e e s s e e s ss s s ss s s s s e e e ee ee es eess e es eee ee ee e eeeee eese e ee ee e s ee ss es s eeeee eeeeeeee e e ee e e Provincially Significant Wetland s ese es ee ese ese es e ss e e eeeee e e eComplex ees eses ese s ses e e es ee e s s es ss s ses se ee e e ee e es ees e e e e es e e e ee ee e ee e e e e e e e s e e e e s e e e s e e e e e s s ees s e e e e s e e e s s e e s s e se e e e s es e s e e e e e e e s e e e e s e e e Fish Spawning Area e es e ee seee sss e s s s s ss s eeee ees ee e e e ee e eee e e ee e ee eesees e e e s e e ee e es es e ees e e e e s s s ss e es e s s e es s es ee s eese e e ee ss ss es e s s e e eese ee ee ee s ee s s s s s s s s e e e e e e e e e e e e e s e e e ANSI, Earth Science e e e e e e eeee ee s ee e ese e X RD eees ss ee ss eses es eees e ee ee ees e e ees s se s s s ese eeess ees e e eess s see es ss e s s see e s se s se Emily Park FO e e ee e e e e e e e e e e e e e e D e e s s e e e s e e e s s s e s e e e s e e s R e e s e e e s e e e e e e e e e e e e e s s s s s e e e e e e e e es e es es s e ees ee RASSYs ss ee ess e e ee e s s sse e e es ese e s ss ss ANSI, Life Science Wetland es ee e e e se e e e ee e eG esee eses e ee ese s ee es ees eeeee ee eee e es eses eees e e se es ee ee ee ee s sss e es ee eeees eeeee e eee s e sse eess e ees ees e s e e e e e e e e e ee e e ss s s s ss s s e e e e e e ees e e ee e es es esee es e e e e e se s s ee e ee e e eeee ee es White-tailed Deer Wintering Area ee ss eese ess ese es e ee eeee ese6E-8 e eee es e esee e eee e eses eees ee eee ee s s ses ee s s ss e ese es es e e ee s ee s eee ee es s es es ee (Stratum 2) e s e s e e e e e s ee e s s e e e e e s s e e e s e e e e e s e e s e e e s s s e e s e s e e es es e es e e se e e s s e s s s se e e e e e e e e e e e e e e e e e s e s s s e s s e s e e s e s e s s e s s e s s e e e e se ee e e e es e Significant Woodlands s ee e es e sse es sees s ee es s es esee ess es e ee e ss es ee seeese e e s ee ee e sss s ess eeeeeee e s es e e see ee s e e e e s s s s RD s s R E e es ee ee eees e e e se e Provincial Park es es e eses es ee s see esee e e EAV s sese ee ees Be e ss s e es s eses ss ss s se s ee ee ees es e ess e s e e e ses s es e s e e e s se s e s e e e e e e s e s e e s e e s s e s e e e e e e ss e e e es s se Ecodistrict seeeese e esee e e s e es ee es e ees es e e ss s e s ee e ee s ee ss ess e s s ess e s s e e e ss e ess s ss ee ee s s s s s s s e e e e e e ee e e e e e e e s s e e s s s s ee eses es s Water Area ese s e es ees ee es ss se es s s s HW es s eees se e e ee es s eeee e s s ss s ee ee e Y7 e es ee eese s es ee eee ees es ee es e s eeese s e s ss e es ee eese s s e ee s e s se ee s e e e s e s e e s e e s e e e s s s s s s s s s Wooded Area e e eee e e ee e es e es ee s s eses e ee ee East es ses s ees e s ees s eessess ee es e ee e e eseses s s es ee e es e e ss Cross s e s s e e e e e e e e e e e e s e e s e e e s s e e e e e e e s e e e e s e e s Built Up Area e s e s ss s se es s es s ss e eees e Creek se esese s RD ee e e e e ee e see sees e We e Chemong eesee e HAMs s se e ses ese esese s e No.15 eTINGs ee e e s s se es s e e s s e e e G ST s s s s N s s I T D K e 3km Boundary Buffer e es R ee e e CO Lake 25e es eee eses eeses eesees e ss e ee e e eeeee e ss WI ND e ee e ee eeee ee e ees ee s ss s OSS ee e ee e e e e ee e ees es es e e e e ee e ee s sss s eesee s e s es CR s s s e s s s e s e s e e e s ee s e e Omemee Settlement Area sse e se ss se se se e ese e esse eses es e e e e e eee e e es esse s es eees e e s es ees ee s s e ss e e e e e s s e e e ee s e s e s s s e e e s s s s s s s s s e s ee e ee e e e e ee se ees ee e ees e ess s s eese s eees ese es s ee s e ee e e s es s e ee ss eNotes: e ees - This document contains information licensed under the Open Government es eee s e eeess eeses ss ss s e eees e e e ees e - Ontario. e e e e e s e s e e e s s e e e e e e s s e e e s s e s s s e e e ses e e s ee eess ee - Distances on this plan are in metres and can be converted to feet by eLicense es s ees ese se e e ses ss s sse ss s e e s s s ee dividing e by 0.3048. e e e e e e e e ee e s e e s e e e s s e s e e s s s s e e s e s s s e ee e e e s s Cambium Inc. makes every effort to ensure this map is free from errors but s e e s s s e e e e e s s e s e e e s s e e e e e s es es s se es s e ss ss cannot be held s s s RD for any damages due to error or omissions. This ees eses e e eeee e s e eses e ses ees ess emapeeshould notresponsible es e es es s e ee ee s VIEW be used for navigation or legal purposes. It is intended for e eese ePigeon e ee s e e es s ss s eeess e es e s e e s e e e e s s e s s W s e e e s s s e e s s e O s s s s s s D general reference use only. A e e es River No. E e e e e ee e e e e s s ss M se ess e e s ss s e ss es ee es ses e s ese e ee e es e ees se e s e e e e se e e s es e ee ees esees es e e e ee ss see se s e e es e e ee e ee eee e e e es e Complex s ese s esee ee ee e s s s e s e eeee23 es s es e ee e es s e s s s s e s e e e e s e e e e s s s s s s s ss s e eses e eeee e e eses s e ee ee es ss 194 Sophia Street ee ees eee e eees e s es s e es s e eeee e e e e eese see ss s e eesess e ee e s s s ss seese Peterborough, Ontario, K9H 1E5 s e e e e e e e e e e e s e s s e e e e e e ee ees s ee e e e e e e s Pigeon e e Tel: (705) 742.7900 Fax: (705) 742.7907 e s e e e e es s s s s s ssses s e e sseseses s es s s e e e s e e ee s s e ee ees s e s s s s s s s s www.cambium-inc.com e eess e se e e e s es ee e eRiver ee eses ss eee e e ee eeeee see Omemee s ees e s sese ee s sse es e eee e e e eeses e e eeee s e e s eeee e e ees ee ses es s e seess e es s sesNo. s s e e e e e e e e e e e e ee e e e e e e e e e e e e e s e e e e 20 e e s s ee e e e e e e s s s s s e s s ss e Esker e e e s s e s s e e e e s e se es e e e seee s es se s e ee e sss e e e ee ee es es se e ese es ss AYES LINE ee se e s e e ee ee es eeese eees e es ee eeeee e ee ee e e eee e ese e s ee ees e ee e ee es e e es e sH esee ssss e s s e s eees es eee eeSouth ee ss e ess e ee e ee OMEMEE NATURAL e ss s e e e e es e e s e eeee e e e e s e s s s s s s s s s e e eee e eeeeesees e Jackson ee HERITAGE FEATURES eee e e e eess es esees e eCreek ee ee e eeese es e eese eHeadwaters s es eeeee s ees e e es s ee eeeee eeses e e e ee ese ees ee ees eees s e e seee e s eeses ee e s s ee e s e e e ees s e ee s e e e s e e s e e e e s e s ss s s s se s se e es e e ee es e e e e eee s ees eeeee e eses e se ee e s eeee e es e ee ees e e e e seses eeee e seeeee e e ees s e ee ss ee see eeeeee e Ree eee eee es ee e ee es seees eees ss ees ee e s se e eee e eee e e esee Ds ss sss s se see s e seee B e e e e e e Date: e e Es e e November 2024 e e eee e e e e e R ee No.: e ss e e e e e e s s e e eProject es e e e s s s e e e O e eNeT e s e s e s ee e e e e s e e e e e e e e s s e e e e H e e e s e s e s e e e s e e s e e e e e e e s e s e s s e e e e e e e e e e e s s s ss s s s s s s seee ee es OU e eee e e seeee ees ees 15069-001 Rev.: e ee e ee e ese e ees e ess ee eee e e e e e e eee e eMee ss e s Cavan s s e s e s e s e e e s e s s e s e e e ee ees s e ee s e e s e s e e e s ee e e s e e e s e e s s e e es s s s s se BogeeWetland s s Scale: Projection: es ee eeeee e eeeee es eeee e E e ee e e e s s e e eee e se e e e eesees ees ee e eeeee eeseses LINe eee es ees ss s eseesee se e ee e e ee ee s e e e e 0eeLe e es e e s s s 1:60,000 NAD 1983 UTM Zone 17N se 0.5 1 e e 1.5 2e 2.5e ANDe e e ee eee e e e e e e e e B e Complex e e e e e e e e ee s e s e e eee e e ess s e e esees ekmeeeee e ees ss e e esees s s es eeee e e ee e s eee e s s e ssesess esee e s e ee s Created Checked by: Figure: eee e eeee e e eee e by: e ee es ee eese e ese se ees ee s s e sees es e e ess eees s e s ses e e e e e es ese ee ee ee s s s s e e e s s s s e e e e e s e e e e ee e e CJ s e e e e DBC s e e s 4 s s s s s e e e e e e e e e e e e e e e e e e e s e e e s e e s e ee see e e ee ee e e ee e e e e ee ee e e ee eee ee ee e e es eee ee e ee e e ee e ee e e eee e e e e e e e e e ee eee e e eee ee e e ee e ee eeee ee e ee e ee ee e e e ee ee ee e eeeee e e e eee ee e e ee ee e ee e ee eee eee Docusign Envelope ID: 3BB3DE27-AB4C-4FB5-8872-CE98205F5E40 Q
Q
Q Q Q Q
Q
Q
Q
Q
Q Q Q Q QQ Q Q
Q
Q
Q Q Q Q Q Q
Q
Q
Q
Q Q
Q Q Q Q Q Q
Q
Q
Q
Q Q
Q
Q Q
Q Q QQ
Q Q
Q Q Q
Q Q
Q Q Q
Q
Q
Q
Q
Q
Q
Q Q
RD HTS HEIG
Q
Q
Q
Q
Q
Q
Q
Q
Q
Q
Q
C RD LILA
Q
Q
Q
Q
Q
Q
Q
Q
Q Q
Q Q Q
Q Q Q
Q
Q
Q
Q
Q
Q
Q
Q
Q
Q Q
Q
Q
Q
Q
Q
Q
Q
Q
Q
Q Q
Q
Q
Q
Q
Q
Q Q
Q Q
Q
Q Q Q Q Q Q Q
Q
Q
Q
Q
Q
Q
Q
Q Q
Q QQ
Q Q
Q
Q
Q
Q
Q
Q
Q
Q
Q
Q
Q
Q
Q
Q
Q
Q Q
Q
Q Q
Q
Q
Q
Q Q
Q
Q Q
Q
Q
Q
Q
Q Q
Q
Q
Q
Q
Q
Q
Q
Q
Q
Q
Q
Q Q
Q
Q
QQ Q
Q Q
Q
Q
Q Q
Q
Q
Q
Q
Q
Q
Q
Q
Q
Q
Q
Q
Q Q
Q
Q
Q
Q
Q
Q
Q
Q
Q
Q
Q
Q
Q Q
Q
Q
Q
Q
Q
Q
Q Q
Q
Q
Q Q
Q
Q
Q Q
Q
Q
Q
Q
Q
Q
Q Q
Q
Q Q Q Q
Q
Q
Q
Q
Q Q
Q Q Q Q
Q
Q
Q
Q
Q Q
Q
Q
Q
Q
Q
Q
Q
Q Q QQ
Q
Q
Q
Q Q Q
Q Q
Q
Q
Q
Q
Q Q
Q Q Q Q
Q
Q
Q Q
Q
Q
Q Q Q Q Q
Q Q Q Q
Q
Q
Q
Q
Q
Q
Q
Q
Q
Q
Q
Q
Q Q Q Q Q Q Q Q Q Q Q Q
Q
Q Q Q Q
Q
Q
Q
Q Q Q
Q
Q
Q Q Q
Q
Q
Q
Q Q
Q
Q
Q Q Q
Q
Q
Q
Q
Q
Q Q
Q
Q Q
Q
Q
Q
Q
Q
Q
Q Q Q Q Q Q
Q
Q
Q
Q Q
Q
Q
Q Q
Q Q
Q
Q
Q
Q
Q
Q
Q
Q
Q Q
Q
Q
Q
Q
Q
Q
Q
Q Q Q Q
Q
Q
Q
Q
Q
Q
Q
Q
Q
Q
Q
Q
Q
Q Q
Q
Q
Q
Q
Q
Q
Q Q
Q Q
Q
Q
Q
Q
Q
Q Q
Q
Q
Q Q
Q
Q
Q
Q
Q
Q
Q
Q
Q
Q
Q
Q
Q
Q
Q
Q Q
Q
Q
Q
Q
Q
Q Q Q
Q
Q Q
Q Q Q
Q
Q Q
Q
Q
Q Q QQ Q Q Q
Q
Q
Q Q
Q
Q
Q QQ Q
Q
Q
Q
Q
Q Q
Q Q Q Q
Q
Q
Q
Q
Q
Q
Q Q Q
Q
Q
Q Q
Q Q Q Q
Q
Q
Q Q
Q
Q
Q
D
Q Q
Q
Q
OR
Q
Q
Q Q
Q
Q
Q
Q
QQ Q Q
Q
Q
Q Q
Q
Q
Q
Q
Q
Q Q
Q
Q Q Q Q Q
Q
Q
NEB
Q
Q
Q
Q Q
Q
Q
UNT
Q
Q
Q Q Q
Q
Q
Q Q Q Q
Q
Q
Q
D CK R SBA
Q
Q
Q
Q
Q
Q
Q Q
QQ Q
Q
Q Q Q
Q Q Q
Q
Q
Q
Q
Q
Q
Q
Q
Q
Q
Q
Q
Q Q
Q
Q
Q
Q
Q
Q Q
Q
Q Q
Q
Q
Q
Q
Q Q
Q
Q Q Q Q Q Q Q
Q
Q
Q
Q
Q Q
Q
Q
Q Q
Q Q Q
Q
Q
Q
Q
Q
Q
Q
Q Q Q
Q Q
Q QQ
Q
Q
Q Q Q
Q
Q
Q
Q Q Q
Q
Q Q
Q
Q Q
MO
Q
Q
Q Q
Q Q
HOG
Q Q
Q
Q
Q
Q Q Q Q Q
Q
Q
RD BEST
Q
Q Q
Q
L RD
Q
Q
Q Q
Q
Q
Q
Q
Q
Q
MIL
Q
Q Q
Q
Q
Q
Q Q
Q
Q
Q Q
Q
OLD
Q Q Q Q Q Q
Q
Q
Q Q
Q
Q
Q
Q
Q
Q
Q
Q
Q Q Q
Q
Q
Q
QQ Q Q
Q
HI LL R
Q Q
Q
Q Q
SK I
Q Q
Q
Q
Q
Q
Q Q Q
Q
Q
Q
Q Q QQ
Q
Q
Q
Q Q
Q Q Q
Q
Q
Q
Q
Q
Q
Q
Q
Q
D
Q
Q
Q
Q Q
Q
Q
Q
D
Q Q Q
Q
Q
Q
Q Q
Q
Q Q Q Q
Q
Q
RK R
Q
Q
Q
Q Q Q Q Q Q
Q Q Q Q Q
Q
Q
Q
Q
Q
Q
A LY P
Q
Q Q
Q Q
EMI
Q Q Q Q
Q Q
Q QQ Q Q
Q
Q
Q Q
Q
Q
Q Q
Q
Q
Q Q
Q
Q
Q
Q
Q
Q
Q
Q
Q
Q
Q
Q
Q
Q
Q
Q
Q
Q
Q
Q Q
Q
Q
Q Q Q
Q Q
Q
Q
Q
Q
Q Q
Q
Q
Q
Q
Q
Q Q
Q
Q
Q
Q
Q
Q
Q
Q
Q
Q
Q Q
Q
Q
Q
Q
Q
Q
Q
Q
Q
Q
Q
Q
Q
Q
Q
Q
Q
Q
Q
Q
Q
Q
Q
Q
Q
Q
Q
Q
Q Q
Q Q
Q
Q
Q
Q
Q
Q Q
Q
Q
Q
Q
Q
Q
Q
Q
Q
Q
Q Q Q Q Q Q
Q
Q
Q
Q
Q Q QQ Q Q Q
Q
Q Q
Q Q Q
Q
Q
Q QQ
VE EY A
Q Q
Q
Q Q
Q
Q
Q
Q
Q Q Q
Q
Q Q Q
Q
Q
Q
Q
Q
Q Q
Q
Q
Q
Q
Q
Q
Q
Q
Q
Q
Q
Q
Q
Q
Q
Q
Q
Q Q
Q
QQ Q
Q
Q Q
Q
Q
Q
Q
Q
Q
Q
SIBL
O:\GIS\MXDs\15000-15099\15069-001 TY Lin International Canada Inc - Natural Environment Investigation - Kawartha Lakes Master Plan\2024-10-10 EIS.aprx
Q QQ
Q
Q
Q
Q
Q Q
Q
Q
Q
Q
Q
Q
Q
Q
Q
Q
Q
Q
Q
Q
Q Q
Q
Q
Q Q Q
Q
Q
Q
Q
Q
Q
Q
Q
Q
Q
Q
Q
Q Q
Q
Q
Q
Q
Q Q Q Q
Q
Q
Q
Q
Q
Q
Q
Q
Q
Q
Q Q
Q
Q
Q Q Q
Q
Q
Q
RD
Q Q Q
Q
Q Q
Q
Q
Q Q
Q
Q
Q Q
Q
Q
Q
Q
Q
Q
Q
Q
Q Q Q
Q
Q
Q
Q
Q
Q
Q Q Q Q
Q
Q
Q
Q
Q
Q
Q Q
Q Q
Q
Q
Q Q Q
Q
Q Q Q
Q Q Q
Q
Q
Q
Q
Q Q
Q
Q Q
Q
E VAL
Q
QQ Q
Q
Q
Q
Q Q Q Q Q Q Q Q Q Q Q Q Q QQ
Q Q Q Q Q
Q
Q
Q
Q Q Q
QQ Q Q
Q
Q
Q
Q Q Q
Q
Q
Q
Q Q Q Q
Q
Q
Q
Q Q Q
Q
Q
Q
Q
Q Q Q Q
Q Q Q
Q
Q Q Q
Q
Q
Q
E ACR
Q
Q
Q
Q
Q Q
Q
Q
Q
Q
Q Q QQ
Q
Q
Q
Q
Q
QQ Q
Q
Q Q Q Q
Q Q
Q
Q
Q Q
Q
Q Q Q Q Q Q QQ
Q
Q
Q
Q Q
Q
Q
Q
Q
Q
Q
Q
Q
Q
Q
Q
Q
Q Q
Q Q
Q
Q
Q
Q Q
Q
Q Q
Q
Q
Q
Q
Q
Q Q
Q
Q Q
Q
Q
Q
Q
Q
Q Q
Q
Q
Q
Q
Q
Q
Q
Q
Q
Q
Q
QQ Q
Q
Q
Q
Q
Q
Q
Q
Q
Q
Q
Q
Q
Q
Q
Q
Q
Q Q
Q Q
Q Q
Q
Q Q
Q
Q Q
Q
Q
Q
Q
Q Q Q Q
Q
Q
Q
Q
Q
Q
Q
Q
Q Q Q Q Q Q Q
Q
Q
Q
Q
Q
Q
Q
Q Q Q Q Q Q
Q
Q
Q
Q
Q Q Q
Q
Q
Q
Q Q Q
Q
Q QQ
Q
Q Q Q
Q Q Q
Q
Q
Q
Q
Q Q
Q Q Q Q
Q
N RD
Q
Q
Q Q Q
Q QQ Q
Q
Q
Q
Q
Q Q QQ Q Q
Q Q Q Q Q Q
Q Q
Q
Q Q Q
Q
Q Q Q Q Q Q Q Q
Q
Q Q Q Q
Q
Q
Q
Q Q
Q Q Q
Q Q
Q
Q
Q Q Q
Q
Q
Q
O RGE STU
Q Q
Q
Q
Q
Q
Q
Q
Q
Q
Q
Q
R RD
Q Q
Q
Q Q
Q Q
Q
Q
Q
Q
Q
Q Q
Q
Q
Q
Q Q
Q
Q
Q
Q
Q
Q
Q Q
Q
Q
Q
Q
Q
Q
Q Q
Q Q QQ Q Q Q Q Q
Q
Q Q Q Q
Q
Q
Q Q
Q
Q
Q
Q
Q
Q Q Q Q
Q
Q
Q
Q
Q
Q Q
Q
Q
Q
E ESK
Q
Q
Q
Q
Q
Q
Q
Q
Q
Q
Q
Q
Q
Q
Q
Q
Q Q
º
Q
Q
Q
Q
Q Q
Q
Q
Q Q
Q
Q
Q
Q
Q
QQ Q
Q
Q Q Q
Q
Q
Q
Q Q
Q
Q
Q Q
Q Q
Q
Q
Q
Q Q Q Q Q Q
Q
Q Q
Q
Q Q
Q
Q
Q
Q
Q
Q
Q
Q
Q
Q
Q
Q Q Q Q
Q Q Q Q Q
Q
Q
Q Q Q Q Q
Q
Q
Q
Q
Q Q Q
Q
Q Q Q Q Q Q
Q
Q Q Q
Q
Q
Q Q
Q QQ
Q
Q
Q Q Q
Q
Q
Q
Q
Q
Q
Q
Q
Q
Q Q
Q
RD
Q
Q
Q
Q Q
Q Q
Q Q Q
Q QQ
Q
Q
Q
Q Q
Q Q
Q Q
Q
HEL BET
Q
Q
Q
Q
Q Q Q QQ
Q Q Q
Q
Q
Q
Q Q Q Q Q Q Q Q Q Q
Q
Q Q Q Q
Q
Q
Q Q Q Q Q
Q
Q
Q
Q Q
Q
Q
Q
Q Q Q
Q
Q
Q
Q
Q Q
Q Q
Q
Q
Q
Q
Q
Q
Q
Q
Q
Q
Q
Q
Q Q
Q Q Q Q Q
Q Q Q Q
QQ Q Q QQ
Q
Q
Q
Q Q Q
Q Q
Q Q Q Q Q Q Q QQ Q
Q
Q Q Q
Q
Q Q Q
Q Q
Q
Q
Q
Q
Q
Q Q
Q
Q Q
Q
Q Q
CEN TRE LINE RD
Q
Q
Q
Q Q
QQ Q Q
Q
Q Q Q
Q
Q
Docusign Envelope ID: 3BB3DE27-AB4C-4FB5-8872-CE98205F5E40
Natural Heritage Constraints Study – City of Kawartha Lakes Water and Wastewater Master Plan TY Lin International Cambium Reference: 15069-001 January 22, 2025
Appendix A Species at Risk Screening
Cambium Inc.
Docusign Envelope ID: 3BB3DE27-AB4C-4FB5-8872-CE98205F5E40 Natural Heritage Assessment – City of Kawartha Lakes Water and Wastewater Master Plan TY Lin International Cambium Reference: 15069-001
APPENDIX: Species at Risk Habitat-Based Screening - Kawartha Lakes COMMON NAME
SCIENTIFIC NAME
Federal
Provincial
SARA
SARO S-RANK
SPECIES DESCRIPTION AND HABITAT REQUIREMENTS
Birds
Bank Swallow
Riparia riparia
THR
Barn Swallow
Hirundo rustica
THR
Black Tern
Chlidonias niger No Status
S4B
The Bank Swallow is a small songbird of around 12 cm long with a distinctive dark breast band, that flies with quick and erratic wingbeats (1). It nests in burrows in natural and humanmade settings where there are vertical faces in silt and sand deposits. This can include banks of rivers and lakes, bluffs, active sand and gravel pits, road cuts and stockpiles of soils. However, they prefer sand-silt substrates for excavating their nest burrows. They often use large wetlands as communal nocturnal roosts post-breeding or during wintering periods (2).
SC
S4B
The Barn Swallow is a mid-sized songbird with steel-blue backs and wings, glossy in males, and a line of white spots across its upper tail. It lives in a variety of open habitats for foraging, such as grassy fields, pastures, certain agricultural crops, shorelines, cottage areas, wetlands, or subarctic tundra (2). They prefer to nest within human made structures such as barns, bridges, and culverts. Barn Swallow nests are cup-shaped and made of mud, typically attached to horizontal beams or vertical walls underneath an overhang (1).
SC
S3B
The Black Tern is a small waterbird with a forked tail, straight pointed bill, slender shape, and black head during breeding season. It builds floating nests in loose colonies in shallow marshes, with a preference for cattails. They breed primarily in the marshes along the edges of the Great Lakes, but may also use wetlands further north if suitable (1).
THR
Bobolink
Dolichonyx oryzivorus
THR
THR
S4B
The Bobolink is a mid-sized songbird of tan colour with black stripes, except for males during summer breeding season who are black with a white back and yellow collar. It prefers tall, grassy meadows, hayfields and some croplands, and feeds (largely on insects) on the ground in dense grasses (1). It tends to nest in forage crops: hayfields and pastures dominated by species including clover, bluegrass, and broadleaf plants (2).
Canada Warbler
Cardellina canadensis
THR
SC
S4B
The Canada Warbler is a small songbird with bright yellow underparts and bluish-grey back and tail (1). It can be found in a variety of forest types, but is most abundant in moist, mixed forests with a well-developed, dense shrub layer. Nests are usually located on or near the ground on mossy logs, and along stream banks (3).
Chimney Swift
Common Nighthawk
Eastern Meadowlark
Eastern Whip-poorwill
Chaetura pelagica
Chordeiles minor
Sturnella magna
Antrostomus vociferus
THR
SC
THR
THR
THR
SC
THR
THR
The Chimney Swift is a small bird, between 12 and 14 cm, with a brown, cigar-shaped body, slender wings, and an erratic flight pattern. Prior to settlement, the Chimney Swift would S4B,S4N mainly nest in cave walls and hollow trees. Now, it is found mostly near urban and suburban areas where the presence of chimneys or other manmade structures provide nesting and roosting habitat. They also tend to stay in habitat close to the water (1).
S4B
The Common Nighthawk is a medium-sized bird with long, pointed wings, a long tail with a notch, and and large eyes. Its plumage of dark brown with black and white specks blends with its roost site. It is typically found in open areas such as gravel beaches, rock outcrops and burned woodlands, that have little to no ground vegetation. This species can also be found in highly disturbed locations such as clear cuts, mine tailing areas, cultivated fields, urban parks, gravel roads, and orchards (1).
S4B
The Eastern Meadowlark is a medium-sized migratory songbird with a bright yellow throat and belly, a black V shape on its chest, and a pointed bill. It prefers pastures and hayfields, but is also found to breed in orchards, shrubby fields, human-use areas such as airports and roadsides, or other open areas. The Eastern Meadowlark can nest from early May to midAugust, in nests that are built on the ground and well-camouflaged with a roof woven from grasses (1).
S4B
The Eastern Whip-poor-will is a medium-sized bird with mottled brown and grey feathers to blend in with its surroundings, a large flattened head, and small bill. They are usually found in areas with a mix of open and forested areas such as patchy forests with clearings, forests that are regenerating after major disturbances, savannahs, open woodlands or openings in more mature forests. Breeding habitat is dependent on forest structure rather than composition, although common tree associations are pine and oak, and it nests directly on the forest floor (2). The species prefers to nest in semi-open or patchy forests with clearings as it forages in open areas and uses forested areas for roosting (1).
Eastern WoodPewee
Contopus virens
SC
SC
S4B
The Eastern Wood-pewee is a species of 'flycatcher', a bird that eats flying insects. It grows to approximately 15 cm, has greyish-olive upper parts and pale bars on its wings. This species lives in the mid-canopy layer of forest clearings and edges of deciduous and mixed forests. It prefers intermediate-age forest stands with little understory vegetation (1). It typically creates nests on tree branches 2-12 m in height (2).
Evening Grosbeak
Coccothraustes vespertinus
SC
SC
S4B
The Evening Grosbeak is a large songbird with a thick greenish bill. It is a social bird that is often found in flocks, particularly during the winter months. Their preferred habitat is thick coniferous forest. During their breeding season, they are generally found in open, mature mixed forests dominated by Firs, White Spruce, or Trembling Aspen (1).
Docusign Envelope ID: 3BB3DE27-AB4C-4FB5-8872-CE98205F5E40 Natural Heritage Assessment – City of Kawartha Lakes Water and Wastewater Master Plan TY Lin International Cambium Reference: 15069-001
APPENDIX: Species at Risk Habitat-Based Screening - Kawartha Lakes COMMON NAME
SCIENTIFIC NAME
Federal
Provincial
SARA
SARO S-RANK
SPECIES DESCRIPTION AND HABITAT REQUIREMENTS
Golden Winged Warbler
Vermivora chrysoptera
THR
SC
S4B
The Golden-winged Warbler is a small songbird with distinctive yellow wing patches and patches behind their eyes. It inhabits early successional habitat of old fields and favour areas where trees are spread out or forest edges to use for perching, singing, and searching for food. They seem to prefer regeneration zones with young shrub growth, surrounded by mature forest, locations that have recently been disturbed, such as field edges, hydro or utility right-ofways, or logged areas for their breeding sites; often frequenting clusters of herbaceous plants and low bushes (1).
Grasshopper Sparrow
Ammodramus savannarum
SC
SC
S4B
The Grasshopper Sparrow is a small songbird with a streaked back, a white stripe down the center of its crown, a flattish head, and a conical beak. It inhabits open grasslands and prairies with well-drained soil, preferring areas that are sparsely vegetated. It will also nest in hayfields and pastures, as well as alvars and occasionally grain crops such as barley (1).
S4B
The Least Bittern is a small member of the heron family, reaching around 30 cm in length. It has brown and beige plumage with chestnut patches on its wings (1). The species nests in marshes (> 5 ha) and swamps dominated by emergent vegetation, preferably cattails, interspersed with patches of woody vegetation and open water. Although Least Bitterns usually nest in larger marshes territorial individuals have been found in marshes as small as 0.4 ha. They require dense vegetation and open water with stable levels within 10 m for nesting, and access to clear, open water for foraging (3).
S2B
The Loggerhead Shrike is a small bird with a black, hooked bill, grey crown, and white throat and chest. This species has specific habitat requirements that are dependent on active livestock grazing, or grassland areas that have naturally short grass cover (i.e. alvar communities). They also require spiny, multi-branched shrubs, or barbed fencing, to catch prey. They prefer grassland habitats that have sporadic occurrences of low trees and shrubs; particularly hawthorn species, which are used as part of their feeding behaviour (1).
S4B
The Olive-sided Flycatcher is a medium-sized songbird with olive colouring, often seen perching on top of tall trees waiting to catch their prey. It prefers open areas along natural mature forest edges, forest edges near natural openings such as rivers or swamps, humanmade openings, or burned forest openings with numbers of dead trees. Breeding habitat usually consists of coniferous or mixed forests adjacent to rivers or wetlands, in Ontario often nesting in White and Black Spruce, Jack Pine, and Balsam Fir (1).
S4B
The Red-headed Woodpecker is a mid-sized bird, at around 20 cm long, with a vivid red head, neck and breast as well a strong bill. The species can be found in open woodland and woodland edges, often near man-made landscapes such as parks, golf courses and cemeteries. These areas must contain a large number of dead trees for perching and nesting (1).
S4B
The Rusty Blackbird, a medium-sized songbird with pale, yellow eyes and a slender black bill, has recently been listed as special concern both federally and provincially. The species breeds in habitats dominated by coniferous forest with wetlands nearby including bogs, marshes, and beaver ponds. In Ontario, their breeding range is found in the Hudson Bay Lowlands and northern Boreal Shield ecozones. During the winter, it can be found in wet woodlands, swamps, and pond edges plus often foraging in agricultural lands (1).
S4B
The Wood Thrush is a medium-sized songbird of around 20 cm with rusty brown coloured upper parts and white underparts with large dark spots. It breeds in deciduous and mixed forests with moderate understories, shade and abundant leaf litter where it forages for food, including larval and adult insects as well as plant material. They prefer moist stands of trees with well-developed undergrowth and tall trees for perches (1).
S4B
The Yellow Rail is a small, quail-like marsh bird with a short yellow or black bill, short tail, with yellowish and black streaks on its back and white wing patches. This species is mainly found in the Hudson Bay Lowlands region, and is only found in localized marshes in southern Ontario. It is a secretive bird that lives deep within the reeds, sedges, and marshes of shallow wetlands which nest on the ground in areas that have an overlying mat of dry vegetation that can be used for nest building (1).
S1?
The American Eel is a long, slender bodied fish, with one long fin extending down the back and around the tail, and two small pectoral fins. It has thick lips, and a protruding lower jaw that extends out above the upper jaw. At the juvenile stage, they swim up the St. Lawrence River to reach Lake Ontario and connected tributaries where they will remain for 8 to 23 years before migrating back to their spawning grounds. In Ontario, the American eel prefers mud, sand or gravel substrates during the juvenile stage when they reside primarily in the benthic zone of waterbodies. More mature eels are able to thrive in most environments provided there is available cover during daylight hours, and the habitat is accessible (2).
Least Bittern
Loggerhead Shrike
Ixobrychus exilis
Lanius ludovicianus
Olive-sided Flycatcher
Contopus cooperi
Red-headed Woodpecker
Melanerpes erythrocephalus
Rusty Blackbird
Euphagus carolinus
Wood Thrush
Hylocichla mustelina
Yellow Rail
Coturnicops noveboracensis
THR
END
SC
END
SC
THR
SC
THR
END
SC
END
SC
SC
SC
Fish
American Eel
Anguilla rostrata No Status
END
Docusign Envelope ID: 3BB3DE27-AB4C-4FB5-8872-CE98205F5E40 Natural Heritage Assessment – City of Kawartha Lakes Water and Wastewater Master Plan TY Lin International Cambium Reference: 15069-001
APPENDIX: Species at Risk Habitat-Based Screening - Kawartha Lakes COMMON NAME
Lake Sturgeon
SCIENTIFIC NAME
Acipenser fulvescens
Federal
Provincial
SARA
SARO S-RANK
No Status
END
SPECIES DESCRIPTION AND HABITAT REQUIREMENTS
S2
The Lake Sturgeon, a large freshwater fish, has an extended snout with four whisker-like organs hanging near the mouth and is dark to light brown or grey on its back and sides with a lighter belly. In Ontario, this fish is found in the rivers of the Hudson Bay Basin, the Great Lakes basin, and their connecting waterways. Lake Sturgeon’s live almost exclusively in freshwater lakes and rivers with soft bottoms of mud, sand or gravel and are usually found at depths of 5 to 20 m. They spawn in relatively shallow, fast-flowing water or if available deeper water habitat as well (1).
S3
Blanding’s Turtles are identifiable by their bright yellow throat and chin and domed shell. They spend the majority of their life cycle in the aquatic environment, usually in large wetlands or shallow lakes with high densities of water plants (1). These turtles prefer shallow, nutrient rich water with organic sediment and dense vegetation. They use terrestrial sites for travel between habitat patches and to lay clutches of eggs, often going hundreds of meters from their nearest water body. Blanding’s Turtles nest in dry coniferous and mixed forest habitats, as well as fields and roadsides (2). From late October until the end of April, they hibernate in the mud at the bottom of permanent water bodies (1).
S3
The Eastern Musk Turtle is small with a narrow carapace, a dark brown body and two light stripes on each side of their head (5). It is a small freshwater turtle found primarily in slow moving water bodies with abundant emergent vegetation and mucky bottoms along the southern edge of the Canadian Shield within which they burrow into overwinter. Nesting sites vary, but must be close to the water and exposed to direct sunlight (1).
Herptiles
Blanding's Turtle
Eastern Musk Turtle
Emydoidea blandingii
Sternotherus odoratus
END
SC
THR
SC
Northern Map Turtle
Graptemys geographica
SC
SC
S3
The Northern Map Turtle is a medium sized turtle identified by its carapace's map contour-like patterning. It lives in larger lakes and rivers, requiring high water quality to support their primary prey species: molluscs. This species can often be seen in large groups basking together on rocks and logs. In the winter, the Northern Map Turtle can be found hibernating on the bottom of slow-moving rivers (1).
Snapping Turtle
Chelydra serpentina
SC
SC
S3
The Snapping Turtle, with its large serrated carapace, small plastron, and spiked tail, is Canada's largest freshwater turtle (5). It spends the majority of its life in water, preferring shallow water with soft mud and leaf litter, and will travel upland to gravel or sandy embankments, roadsides, along railway lines or beaches to lay their eggs (1).
S2
The Spotted Turtle is named after the distinct yellow spots on its carapace. The species is semi-aquatic and prefers ponds, marshes, bogs and even ditches with slow-moving, unpolluted water and an abundant supply of aquatic vegetation. This species usually hibernates in wetlands or seasonally wet areas with structures such as overhanging banks, hummocks, tree roots, or aquatic animal burrows (1).
S2
The Wood Turtle has orange coloured front legs, neck and chin and a sculpted carapace with raised, pyramidal scutes (5). They prefer clear rivers and streams that have moderate current, and sandy or gravelly substrates. This species spends more time on land than other turtle species including in meadows, swamps and fields. Wooded areas are an essential habitat component, and the species uses aquatic habitats for hibernation and mating. Nesting occurs in areas with sandy soil and abundant light (1).
S3
The Eastern Hog-nosed Snake can be a variety of colours and patterns so is most easily identified by its flattened, upturned nose. They prefer sandy well-drained habitats such as beaches and dry forests because they lay their eggs, hibernate and burrow in these areas. The main diet of this snake is toads and frogs, so they usually stay close to water including marshes and swamps, where they have an increased chance of finding their preferred prey (1).
S4
The Eastern Milksnake's colouration is grey or tan with reddish alternating blotches otlines in black along its back and sides (5). It has recently been delisted from being a species at risk in Ontario (1). This species tends to use open habitats such as rocky outcrops, fields and forest edges. The preferred prey of milksnakes are mice, small rodents, and ground nesting birds which are amply found in and surrounding agricultural outbuildings. The milksnake is secretive and is not likely to be encountered during the day or at night while hunting (5).
S4
The Eastern Ribbonsnake is slender with three bright yellow stripes running down its back and sides and a white crescent in front of each eye. This snake is usually found close to water as they are strong swimmers, often fleeing predators by diving into shallow water. It prefers wetland habitats where its prey species, frogs and small fish, are abundant. Over winter, they congregate in underground burrows or rock crevices to hibernate (1).
Spotted Turtle
Wood Turtle
Eastern Hognosed Snake
Clemmys guttata
Glyptemys insculpta
Heterodon platirhinos
Eastern Milksnake
Lampropeltis triangulum
Eastern Ribbonsnake
Thamnophis sauritus
END
THR
THR
SC
SC
END
END
THR
NAR
SC
Docusign Envelope ID: 3BB3DE27-AB4C-4FB5-8872-CE98205F5E40 Natural Heritage Assessment – City of Kawartha Lakes Water and Wastewater Master Plan TY Lin International Cambium Reference: 15069-001
APPENDIX: Species at Risk Habitat-Based Screening - Kawartha Lakes COMMON NAME
Western Chorus Frog
SCIENTIFIC NAME
Federal
Provincial
SARA
SARO S-RANK
Pseudacris triseriata
THR
-
Danaus plexippus
SC
SC
S3
SPECIES DESCRIPTION AND HABITAT REQUIREMENTS The Western Chorus Frog is small with a dark stripe running through its eye and a light stripe underneath (5). It is primarily a lowland terrestrial species that requires access to terrestrial and aquatic habitats in close proximity to one another. Relying on marshes and wooded wetlands adjacent to forested habitats, this species also requires isolated, predator free pools for breeding. Temporary pools, such as vernal pools in wooded areas, are preferred. This species hibernates terrestrially in a variety of environments, including leaf litter, wood debris, and vacant animal burrows (2).
Invertebrates Monarch Butterfly
Yellow-banded Bumble Bee
Bombus terricola
SC
SC
The Monarch is an orange and black butterfly with small white spots and a wingspan of S2N,S4B around 10 cm. It relies on milkweed plants as a food source for growing caterpillars, but the adult butterflies forage in diverse habitats for nectar from wildflowers (1).
S3S5
The Yellow-banded Bumble Bee is a medium-sized bumble bee with a distinct yellow and black abdominal band pattern found on its queens, males, and workers. This species is a forage and habitat generalist, able to use a variety of nectaring plants and environmental conditions. It prefers mixed and coniferous woodlands, particularly for nesting and overwintering, as well as a variety of open habitat such as native grasslands, farmlands and urban areas. The Yellow-banded Bumble Bee ranges from the Mixedwood Plains of southern Ontario to the Hudson Bay Lowlands in the north (1). Their nest sites are often found underground in abandoned burrows or decomposing logs.
S2S3
The Eastern Small-footed Myotis has fur with black roots and shiny brown tips as well as very small feet. In the spring and summer, the Eastern Small-footed Myotis will roost in a variety of habitats, including in or under rocks, in rock outcrops, in buildings, under bridges, or in caves, mines, or hollow trees. They change their roosting locations daily and hunt at night for insects. They hibernate in winter, often in caves and abandoned mines choosing colder and drier sites than other similar bats (1).
S4
The Little Brown Myotis has glossy brown fur and a fleshy projection covering the entrance to its ears. This species roosts in trees and buildings, often selecting attics, abandoned buildings and barns for summer colonies where they can raise their young. Little Brown Bats hibernate from October/November to March/April, most often in caves or abandoned mines that are humid and remain above freezing (1).
S3
The Northern Myotis has dull yellow-brown fur with pale bellies and long, rounded ears. This species is found in forests, roosting under loose bark and in the cavities of trees. These bats hibernate from October/November to March/April, most often in caves or abandoned mines (1).
S3?
The Tri-colored Bat is small, with pale brown with orange-red forearms, muzzle, and ears. It is named for the black, yellow, and brown hairs on its back. It is considered rare in this region of Ontario which is at the northernmost limit of the natural range. These bats prefer to nest in foliage, tree cavities and woodpecker holes, but are occasionally found in buildings; though this is not their preferred habitat. Winter hibernation takes place in caves, mines and deep crevices. Tri-colored Bats prefer an open forest habitat type in proximity to water (6).
Mammals
Eastern Smallfooted Myotis
Myotis leibii
Little Brown Myotis Myotis lucifugus
Northern Myotis
Tri-colored Bat
Myotis septentrionalis
Perimyotis subflavus
No Status
END
END
END
END
END
END
END
Trees, plants, fungi and lichens
American Ginseng
Panax quinquefolius
END
THR
S2
American Ginseng is a perennial plant which grows up to 60 centimetres in height. The leaves typically have five leaflets arranged in a whorl at the end of the leaf stem. The root looks like a gnarly parsnip. The flowers are an inconspicuous green-white in colour, but the berries are bright red and arranged in a cluster. In Ontario, the American Ginseng typically grows in rich, moist, and mature deciduous woods dominated by Sugar Maple, White Ash, and American Basswood. It typically grows in deep, nutrient rich soil over limestone or marble bedrock (1).
Black Ash
Fraxinus nigra
No status
END
S4
The Black Ash is a smaller-sized tree with a narrow crown, light grey and scaly bark, and green, oval leaflets on a central stalk. It grows everywhere in Ontario except for the Far north, preferring moist climates and soils such as swampy woodlands or bogs (1).
Butternut
Juglans cinerea
END
END
S2?
The Butternut is a medium sized tree reaching 30 m in height. It has large compound leaves with 11 to 17 leaflets. The fruit is oval, fuzzy and sticky. In Ontario, the Butternut prefers moist, well-drained soil, often along streams, or occasionally well-drained gravel sites. It grows alone or in small groups in deciduous forests (1).
References 1. Ministry of Environment, Conservation and Parks. (2022). Species at Risk in Ontario. Retrieved from https://www.ontario.ca/page/species-risk-ontario 2. Government of Canada. (2021). Species at Risk Public Registry. Retrieved from https://species-registry.canada.ca/index3. Committee on the Status of Endangered Wildlife in Canada. (2008). 4. Environment Canada. (2018).
Docusign Envelope ID: 3BB3DE27-AB4C-4FB5-8872-CE98205F5E40 Natural Heritage Assessment – City of Kawartha Lakes Water and Wastewater Master Plan TY Lin International Cambium Reference: 15069-001
APPENDIX: Species at Risk Habitat-Based Screening - Kawartha Lakes COMMON NAME
SCIENTIFIC NAME
Federal
Provincial
SARA
SARO S-RANK
SPECIES DESCRIPTION AND HABITAT REQUIREMENTS
5. Ontario Nature. (2020). Reptiles and Amphibians. Retrieved from https://ontarionature.org/programs/citizen-science/reptile-amphibian-atlas/species/ 6. University of Michigan Museum of Zoology. (2004). 7. Ontario Breeding Bird Atlas. (2020). 8. Government of Canada. (2021). Aquatic Species at Risk Map. https://www.dfo-mpo.gc.ca/species-especes/sara-lep/map-carte/index-eng.html
Docusign Envelope ID: 3BB3DE27-AB4C-4FB5-8872-CE98205F5E40
Natural Heritage Constraints Study – City of Kawartha Lakes Water and Wastewater Master Plan TY Lin International Cambium Reference: 15069-001 January 22, 2025
Appendix B Significant Wildlife Habitat Assessment
Cambium Inc.
Docusign Envelope ID: 3BB3DE27-AB4C-4FB5-8872-CE98205F5E40 Natural Heritage Constraints Study – City of Kawartha Lakes Water and Wastewater Master Plan TY Lin International Cambium Reference: 15069-001
APPENDIX: Significant Wildlife Habitat Screening - 6E
SWH Type
Habitat Descriptions & Criteria for Candidate SWH
Listed Species & Defining Criteria for Confirmed SWH
Candidate SWH Present: Yes/No
Seasonal Concentration Areas of Animals American Black Duck, American Wigeon, Blue-winged Teal, Gadwall, Green-winged Meadow, Thicket, or Agricultural Field WITH Teal, Mallard, Northern Pintail, Northern Shoveler, Wood Duck Waterfowl Stopover and spring flooding/sheet water (Mar-May) AND Staging Areas size potential to support 100+ individuals AND Defining Criteria: 100+ individuals (Terrestrial) SWH: ecosite + 100-300m radius; dependent on local site conditions and adjacent potential established/recurring annual use land use Shallow Marsh, Deciduous Swamp, Shallow Aquatic, Open Aquatic, reservoires managed as wetland/ lake/ pond AND size potential to support 100+ individuals for 7+ days Waterfowl Stopover and *Rare: typically only a few locations per Staging Area (Aquatic) EcoDistrict EXCLUDES SWM and sewage treatment ponds
Shorebird Migratory Stopover Area
Beach/Bar, Sand Dune, Meadow Marsh, Shorelines of lakes, rivers and wetlands (including seasonally flooded, muddy, unvegetated shoreline habitats) WITH size potential to support 100+ Whimbrel OR 3+ species for 1000+ shorebird use days EXCLUDES SWM and sewage treatment ponds
Raptor Wintering Area (Hawks and Owls)
American Black Duck, American Wigeon, Black Scoter, Blue-winged Teal, Brant, Bufflehead, Cackling Goose, Canada Goose, Canvasback, Common Goldeneye, Common Merganser, Gadwall, Greater Scaup, Green-winged Teal, Hooded Merganser, Lesser Scaup, Long-tailed Duck, Northern Pintail, Northern Shoveler, Red-breasted Merganser, Redhead, Ring-necked duck, Ruddy Duck, Snow Goose, Surf Scoter, White-winged Scoter
Yes
Yes
Defining Criteria: 100+ individuals for 7+ days (>700 waterfowl use days) OR annual staging of Ruddy Ducks, Canvasbacks and Redheads OR wetlands and shorelines associated with sites identified in SWHTG Appendix K SWH: combined ecosites + 100m radius American Golden Plover, Baird’s Sandpiper, Black-bellied Plover, Dunlin, Greater Yellowlegs, Hudsonian Godwit, Least Sandpiper, Lesser Yellowlegs, Marbled Godwit, Pectoral Sandpiper, Purple Sandpiper, Red-necked Phalarope, Ruddy Turnstone, Sanderling, Semipalmated Plover, Short-billed Dowitcher, Solitary Sandpiper, Spotted Sandpiper, Stilt Sandpiper, Whimbrel, White-rumped Sandpiper
Yes
Defining Criteria: 3+ species and 1000+ shorebird use days (#birds x #days) OR 100+ Whimbrel for at least 3 yrs (makes brief stops of <24 hrs during migration) SWH: combined ecosites + 100m radius
Hawks: American Kestrel, Red-tailed Hawk, Rough-legged Hawk, Northern Harrier COMBINATION of Forest, Meadow, Thicket, Owls: Short-eared Owl, Snowy Owl Savannah, Woodland or lightly grazed pasture of combined 20+ha area WITH 15+ha of the area consisting of open habitat; Fields should Defining Criteria: 1+ Short-eared Owls OR 10+ individuals of 2+ listed hawk/owl be wind swept with limited snow accumulation / species; AND must be used regularly (at least 20 days during each year for at least 3 depth in 5 years) SWH: not specified in Criteria Schedules
Yes
Bald Eagle Raptor Wintering Area (Bald Eagle)
Bat Hibernacula
Forest or Treed Swamp on shoreline of large Defining Criteria: 1+ Bald Eagle AND used regularly (at least 20 days out of 3 in 5 rivers or lakes WITH large trees and snags for years) roosting SWH: shoreline forest ecosites directly adjacent to the prime hunting area (open water) Crevices, Caves, Karst Features, Abandoned Mines EXCLUDES buildings and active mines
Bat Maternity Colonies
Turtle Wintering Area (Painted and Snapping Turtles)
Turtle Wintering Area (Northern Map Turtle)
Yes
Big Brown Bat, Tri-coloured Bat Yes Defining Criteria: all sites with confirmed hibernacula are SWH SWH: entrance + 1000m radius for wind farms OR + 200m radius for other projects
Mature Deciduous or Mixed Forests and Swamps WITH 10+/ha cavity trees WITH 25+ Big Brown Bat, Silver-haired Bat cm DBH; Trees in lesser decay categories (13) preferred Defining Criteria: >10 Big Brown Bats OR >5 Adult Female Silverhaired Bats EXCLUDES Coniferous Forests and Swamps SWH: entire Ecosite or Ecoelement containing the maternity colony and buildings Swamp, Marsh, Shallow Aquatic, Open Aquatic, Open Fen, Open Bog WITH soft mud Midland Painted Turtle, Snapping Turtle substrates AND enough depth to maintain free water beneath ice AND adequate dissolved oxygen Defining Criteria: 5+ Painted Turtles OR 1+ Snapping Turtle SWH: ecosite EXCLUDES man-made ponds such as SWM and sewage treatment ponds Open Aquatic, including deeper rivers or streams and lakes WITH current AND soft mud Northern Map Turtle substrates AND enough depth to maintain free water beneath ice AND adequate dissolved oxygen Defining Criteria: 1+ Northern Map Turtle SWH: ecosite OR the pool where overwintering occurs in a stream/river EXCLUDES SWM and sewage treatment ponds
Yes
Yes
Yes
Docusign Envelope ID: 3BB3DE27-AB4C-4FB5-8872-CE98205F5E40 Natural Heritage Constraints Study – City of Kawartha Lakes Water and Wastewater Master Plan TY Lin International Cambium Reference: 15069-001
APPENDIX: Significant Wildlife Habitat Screening - 6E
SWH Type
Reptile Hibernaculum (Snakes)
Reptile Hibernaculum (Five-lined Skink)
Colonially-nesting Bird Breeding Habitat (Bank and Cliff)
Colonially-nesting Bird Breeding Habitat (Tree/Shrubs)
Habitat Descriptions & Criteria for Candidate SWH
Listed Species & Defining Criteria for Confirmed SWH
Any ecosites other than very wet ones, Eastern Gartersnake, Eastern Ribbonsnake, Milksnake, Northern Brownsnake, broken/fissured bedrock, burrows, rock piles or Northern Red-bellied Snake, Northern Ring-necked, Northern Watersnake, Smooth slopes, old stone fences, or abandoned Green Snake crumbling foundations, some wetlands (conifer or shrub swamps and swales, poor fens or depressions in bedrock terrain with sparse Defining Criteria: 5+ individuals of a species OR any number snakes of 2 or more trees or shrubs with sphagnum moss or sedge species OR presence of a Special Concern species AND observed near a potential hummock ground cover)WITH openings below hibernacula on warmy sunny days in spring and fall frost line: SWH: feature containing hibernacula +30 m radius Mixed Forests, Deciduous Forest, or Five-lined Skink (Southern Shield population) Coniferous Forest dominated by Pine/Hemlock WITH cover rocks overlaying fissured granite Defining Criteria: All sites with active Skink hibernacula are SWH bedrock SWH: feature containing hibernacula +30 m radius Eroding banks, sandy hills/piles, pits, steep slopes, cliff faces WITH size potential to support 8+ nests EXCLUDES all man-made structures (bridge abutments, silos, barns, etc.) AND recently (2 years) disturbed soil (berms, embankments, stock piles, aggregate operations)
Candidate SWH Present: Yes/No
Yes
Yes
Cliff Swallow, Northern Rough-winged Swallow (this species is not colonial but can be found in Cliff Swallow colonies) Yes Defining Criteria: 1+ nesting site with 8+ pairs SWH: peripheral nests + 50 m radius
Deciduous and Mixed Swamp (excluding those Black-crowned Night Heron, Great Blue Heron, Green Heron, Great Egret dominated by Cedar) or Treed Fen, lake shorelines/ islands/ peninsulas WITH size to support 5+ nests; Nests are typically 11-15 m above ground near top of live or dead standing Defining Critiera: 5+ active nests trees / occassionally in shrubs and emergent SWH: edge of the colony + minimum 300 m radius OR extent of the forest ecosite OR any island <15 ha with a colony vegetation
Yes
Caspian Tern, Common Tern, Great Black-backed Gull, Herring Gull, Little Gull, Ringbilled Gull Colonially-nesting Bird Breeding Habitat (Ground; Terns and Gulls)
Rocky island or peninsula (natural or artificial) in lake or large river
Defining Critiera: 25+ active Herring Gull or Ring-billed Gull nests OR 5+ active Common Tern nests OR 2+ active Caspian Tern nests OR 1+ active Little Gull or Great Black-backed Gull nest SWH: edge of the colony + 150+m radius OR the ecosites containing the colony OR any island <3 ha
Colonially-nesting Bird Breeding Habitat (Ground; Brewer's Blackbird)
Brewer's Blackbird Close proximity to watercourses in pastures, Meadows, Thickets, Savannah, Meadow Defining Criteria: 5+ pairs Marsh, Shallow Marsh AND scattered trees or SWH: edge of the colony + 150+ m radius OR the ecosites containing the colony OR shrubs any island <3 ha
Migratory Butterfly Stopover Area
Combination of Forest or Plantation AND Meadow, Thicket, or Savannah WITH size of 10+ha AND located within 5 km of Lake Ontario AND relatively undisturbed with abundance of preferred nectar plants
Landbird Migratory Stopover Areas
All migratory songbirds and raptors Forest or Treed Swamp that may be complexed with grassland or wetland AND size of 10+ ha AND located within 5 km of Lake Defining Critiera: 200+ birds/day of 35+ species AND 10+ bird species on 5+ survey Ontario dates (April/May and August/October) SWH: not indicated in Criteria Schedules
Deer Yarding Areas
Yes
Yes
Monarch, Painted Lady, Red Admiral
Defining Criteria: Monarch Use Days (MUD) of 5000+ OR 3000+ MUD and presence of Painted Ladies or Red Admirals SWH: not indicated in Criteria Schedules
Stratum I (Core): Coniferous Forest or Swamp WITH 60+% canopy cover by Pine, Hemlock, Cedar, or Spruce White-tailed Deer Stratum II (typically surrounds Stratum I): Mixed or Deciduous Forest or Swamp WITH Presence is determined by MNRF plenty of browse (esp. those dominated by Poplar or Birch); can include agricultural fields If present, consider Movement Corridors
No
No
Confirmed SWH
EXCLUDES woodlots with high densities of deer due to artificial feeding
Deer Winter Congregation Areas
Forest and Treed Swamps; Typically applies to White-tailed Deer areas of 100+ ha, but can be smaller (e.g., conifer plantations) Presence is determined by MNRF EXCLUDES woodlots with high densities of If present, consider Movement Corridors deer due to artificial feeding
No
Docusign Envelope ID: 3BB3DE27-AB4C-4FB5-8872-CE98205F5E40 Natural Heritage Constraints Study – City of Kawartha Lakes Water and Wastewater Master Plan TY Lin International Cambium Reference: 15069-001
APPENDIX: Significant Wildlife Habitat Screening - 6E
SWH Type
Habitat Descriptions & Criteria for Candidate SWH
Listed Species & Defining Criteria for Confirmed SWH
Candidate SWH Present: Yes/No
Rare Vegetation Communities Cliffs and Talus Slopes
Sand Barren
Alvar
No listed species Cliff (near vertical bedrock 3+m tall) OR Talus. In 6E, most cliffs and talus slopes are Defining Criteria: no added criteria associated with the Niagara Escarpment SWH: ecosite Sand Barren WITH size 0.5+ha AND <60% No listed species tree cover; usually located within other types of habitat; caused by lack of moisture, periodic Defining Criteria: <50% cover by exotic/invasive species fires and erosion SWH: ecosite Alvar, Coniferous Forest dominated by Pine or Indicator Species: Crawe's Sedge, Flat-stemmed Spikerush, Fluxweed, Philadelphia Cedar, Bedrock Cultural Meadow, Juniper Panicgrass, Small Skullcap Bedrock Alvar Cultural Thicket, Bedrock Cultural Savannah (CUS2), Bedrock Cultural Woodland (CUW2) WITH size 0.5+ha AND Defining Criteria: 4+ listed Alvar Indicator Species AND <50% cover by exotic / <60% tree cover; typically level mosaic of rock introduced species AND in excellent condition AND fits surrounding landscape with pavements and bedrock overlain by thin few conflicting land uses veneer of soil SWH: ecosite
Yes
Yes
Yes
No listed species Old Growth Forest
Savannah
Forest, Treed Swamp WITH size of 30+ha WITH 10+ha interior habitat (measured 100 m Defining Criteria: presence of 140+ year old trees AND no cut stumps or other signs from forest edge) of logging SWH: limited to area that meets criteria Indicator Species (SHWTG Appendix N): Dwarf Hackberry, Early-branching Tallgrass Savannah, Talgrass Woodland, Panicgrass, Illinois Tick-trefoil, Redtop Panicgrass, Side-oats Gramma, Small-leaved Cultural Savannah of any size WITH tree cover Tick-trefoil, White Prairie Gentian 25-60%; may be a natural or restored site EXCLUDES remnant sites such as railway right of ways
Tallgrass Prairie of any size WITH <25 tree cover; may be a natural or restored site
Yes
Yes
Defining Criteria: 1+ indicator species present AND <50% cover by exotic / introduced species SWH: ecosite Indicator Species (SWHTG Appendix N): Dwarf Hackberry, Early-branching Panicgrass, Illinois Tick-trefoil, Redtop Panicgrass, Side-oats Gramma, Small-leaved Tick-trefoil, White Prairie Gentian
Tallgrass Prairie
Yes EXCLUDES remnant sites such as railway right of ways
Defining Criteria: 1+ indicator species present AND <50% cover by exotic / introduced species SWH: ecosite
Other Communities ELC communities considered provincially rare Considered Provincially ELC communities considered provincially rare by the NHIC by the NHIC Rare
Yes
Specialized Habitat for Wildlife
Waterfowl Nesting Area
Bald Eagle and Osprey Nesting, Foraging, and Perching Habitat
Upland habitats 120+m wide AND adjacent shallow aquatic, shallow marsh, meadow marsh, thicket swamp, or deciduous treed American Black Duck, Blue-winged Teal, Gadwall, Green-winged Teal, Hooded swamp (i.e., all wetlands excluding coniferous Merganser, Mallard, Northern Pintail, Northern Shoveler, Wood Duck and mixed treed swamps). Wetlands must be >0.5 ha or a cluster of three or more <0.5 ha wetlands within 120 m of each other where Defining Criteria: 1+ nesting site of American Black Duck OR 10+ nesting pairs waterfowl nesting is known to occur. (including Mallards) OR 3+ nesting pairs (excluding Mallards) SWH: 120 m radius (+/- as determined by site-specific study) of upland habitat *Wood Ducks Bufflehead, Common adjacent to a wetland Goldeneye, and Hooded Mergansers utilize large diameter trees (>40 cm dbh) in woodlands for cavity nest sites
Forest, Swamp AND directly adjacent to shoreline/riparian areas of rivers, lakes, ponds, wetlands
Yes
Osprey, Bald Eagle
Defining Criteria: 1+ active nest of either species AND known to be used annually; to be excluded, nests must be known to be inactive for 3+ yrs or suspected to be EXCLUDES nests on man-made objects (e.g., inactive for 5+ yrs telephone poles, constructed platforms) SWH: Osprey: active nest +300m radius OR contiguous woodland; Bald Eagle: active nest +400-800 m radius
Yes
Docusign Envelope ID: 3BB3DE27-AB4C-4FB5-8872-CE98205F5E40 Natural Heritage Constraints Study – City of Kawartha Lakes Water and Wastewater Master Plan TY Lin International Cambium Reference: 15069-001
APPENDIX: Significant Wildlife Habitat Screening - 6E
SWH Type
Habitat Descriptions & Criteria for Candidate SWH
Listed Species & Defining Criteria for Confirmed SWH
Candidate SWH Present: Yes/No
Barred Owl, Broad-winged Hawk, Cooper's Hawk, Northern Goshawk, Redshouldered Hawk, Sharp-shinned Hawk Woodland Raptor Nesting Habitat
Turtle Nesting Areas
Forest, Treed Swamp, Coniferous Plantations of 30+ ha AND 10+ ha of interior habitat (measured 200 m from the forest edge)
Exposed mineral soil (sand and gravel) areas WITHIN 100 m of adjacent Bog, Fen, Shallow Marsh, Shallow Aquatic, or undisturbed shallow weedy areas of marshes, lakes, and rivers EXCLUDES habitat along municipal or provincial roads
Seeps and Springs
Amphibian Breeding Habitat (Woodland)
Forest in headwaters area of a stream/river system; important wildlife feeding/drinking areas, especially in the winter
Wetland, pond or breeding pool, including vernal pools WITH size of 500+m2 (~25m diameter) AND located in or within 120m of Forest or Treed Swamp *Permanent ponds or those containing water until at least mid-July are preferred
Amphibian Breeding Habitat (Wetlands)
Defining Criteria: 1+ active nest SWH: Red-shouldered Hawk, Northern Goshawk: active nest +400m radius OR 28 ha of suitable habitat; Barred Owl: active nest +200m radius; Broad-winged Hawk, Coopers Hawk: active nest +100m radius; Sharp-shinned Hawk: active nest +50m radius Midland Painted Turtle, Snapping Turtle, Northern Map Turtle
Defining Criteria: 5+ nesting Midland Painted Turtle OR 1+ nesting Northern Map Turtle or Snapping Turtle SWH: nesting area + 30-100m radius, depending on slope, riparian vegetation, adjacent land use, and consideration of travel routes to/from nest sites
Yes
Wild Turkey, Ruffed Grouse, Spruce Grouse, White-tailed Deer, Salamander spp. Defining Criteria: 2+ seeps/springs SWH: ecosite/ecoelement; protection of the recharge area considering slope, vegetation, height of trees and groundwater condition
Yes
Blue-spotted Salamander, Eastern Newt, Spotted Salamander, Gray Treefrog, Spring Peeper, Western Chorus Frog, Wood Frog
Defining Criteria: 1+ breeding salamander sp or newt OR 2+ breeding frog sp WITH 20+ individuals (adults or eggs masses) / Call Level Code 3 SWH: breeding pond/wetland +230m radius of woodland habitat
Yes
If present adjacent to woodland, travel corridor linking feature to the woodland is to be included
Swamp, Fen, Bog, Meadow Marsh, Shallow Blue-spotted Salamander, Eastern Newt, Four-toed Salamander, Spotted Marsh, Shallow Aquatic, Open Aquatic WITH Salamander, 2 size of 500+m (~25 m diameter) AND typically American Toad, Bullfrog, Gray Treefrog, Green Frog, Mink Frog, Northern Leopard Frog, Pickerel Frog, Western Chorus Frog >120 m from Forest except in the case of larger habitats containing predominantly aquatic species (e.g., Bullfrog) which may have Defining Criteria: 1+ breeding salamander sp or newt OR 2+ breeding frog/toad sp riparian Forest WITH 20+ individuals (adults or eggs masses) / Call Level Code 3 OR any number of breeding Bullfrogs *Shrubs and logs increase significance for some species because of structure for calling, SWH: wetland ecosite + adjacent shoreline foraging, escape, and concealment from If present, travel corridor SWH is to be considered predators
Forest and Treed Swamps, typically WITH Woodland Area Sensitive mature (>60 yrs old) stands AND woodlots >30 ha; consider presence of interior forest habitat Bird Breeding Habitat measured 200+m from any edge
Yes
Yes
Blackburnian Warbler, Black-throated Blue Warbler, Black-throated Green Warbler, Blue-headed Vireo, Canada Warbler, Cerulean Warbler, Northern Parula, Ovenbird, Red-breasted Nuthatch, Scarlet Tanager, Veery, Winter Wren, Yellow-bellied Sapsucker Yes Defining Criteria: nesting or breeding pairs of 3+ listed species OR any breeding Cerulean Warbler or Canada Warbler SWH: not defined in criteria schedules
Habitat of Species of Conservation Concern Wetland WITH shallow water AND emergent vegetation Marsh Bird Breeding Habitat
Open Country Bird Breeding Habitat
American Bittern, American Coot, Black Tern, Common Loon, Common Moorhen, Green Heron, Sora, Marsh Wren, Pie-billed Grebe, Sandhill Crane, Sedge Wren, Trumpeter Swan, Virginia Rail, Yellow Rail
*Green Heron prefers edge of water (sluggish streams, ponds, marshes sheltered by shrubs Defining Criteria: 1+ breeding Black Tern, Sandhill Crane, Trumpeter Swan, Green and trees), but can also be found in upland Heron or Yellow Rail OR 5+ nesting pairs of Sedge Wren or Marsh Wren OR shrubs or forest a considerable distance from breeding by 5+ other listed species water SWH: ecosite
Yes
Natural and Cultural Meadows WITH size Grasshopper Sparrow, Northern Harrier, Savannah Sparrow, Short-eared Owl, 30+ha AND should have a history of longevity; Upland Sandpiper, Vesper Sparrow present for at least 5 years Yes EXCLUDES Class 1 or 2 agricultural lands AND lands being actively used for row crops, intensive hay or pasture in the last 5 years
Defining Criteria: nesting/breeding of 2+ listed species OR 1+ breeding Short-eared Owl SWH: contiguous ecosite field habitats
Docusign Envelope ID: 3BB3DE27-AB4C-4FB5-8872-CE98205F5E40 Natural Heritage Constraints Study – City of Kawartha Lakes Water and Wastewater Master Plan TY Lin International Cambium Reference: 15069-001
APPENDIX: Significant Wildlife Habitat Screening - 6E
SWH Type
Shrub/Early Successional Bird Breeding Habitat
Terrestrial Crayfish *Canadian populations limited to SW Ontario
Special Concern and Rare Wildlife Species
Habitat Descriptions & Criteria for Candidate SWH
Listed Species & Defining Criteria for Confirmed SWH
Field habitats succeeding to Cultural Woodland, Cultural Savannah or Cultural Thicket WITH size of 10+ha AND should have a history of longevity; present for at least 5 years
Indicator Species: Brown Thrasher, Clay-coloured Sparrow Common Species: Field Sparrow, Black-billed Cuckoo, Eastern Towhee, Willow Flycatcher Special Concern: Yellow-breasted Chat, Golden-winged Warbler
EXCLUDES Class 1 or 2 agricultural lands AND lands being actively used for crops or pasture in the last 5 years
Defining Criteria: 1+ indicator species AND 2+ listed common species OR 1+ breeding Yellow-breasted Chat or Golden-winged Warbler SWH: contiguous ecosite field/thicket habitats
Candidate SWH Present: Yes/No
Yes
Chimney or Digger Crayfish (Fallicambarus fodiens ), Devil or Meadow Crayfish Meadow Marsh, Shallow Marsh, Thicket (Cambarus diogenes ) Swamp, Deciduous or Mixed Treed Swamp, or Cultural Meadow containing Meadow Marsh or Swamp inclusions Defining Criteria: 1+ individuals of a listed species OR chimneys SWH: ecosite OR ecoelement of marsh/swamp habitat within a larger ecosite Species that are ranked S1-S3 by the NHIC and/or are provincially tracked Species with populations that are significantly declining or have a high percentage of Any - varies by species; habitat needs to cover their global population in Ontario an important life stage component (e.g., Species listed as special concern under the ESA Species listed as threatened or endangered under SARA only nesting, foraging, or wintering habitat) Regionally or locally rare species, where lists are available Defining Criteria: no additional criteria SWH: finest scale that protects the habitat form and function
Yes
Yes
Docusign Envelope ID: 3BB3DE27-AB4C-4FB5-8872-CE98205F5E40 Natural Heritage Constraints Study – City of Kawartha Lakes Water and Wastewater Master Plan TY Lin International Cambium Reference: 15069-001
APPENDIX: Significant Wildlife Habitat Screening - 6E
SWH Type
Habitat Descriptions & Criteria for Candidate SWH
Listed Species & Defining Criteria for Confirmed SWH
Candidate SWH Present: Yes/No
Animal Movement Corridors
Amphibian Movement Corridors
Deer Movement Corridors
Any terrestrial habitat associated with water; shorter corridors are more significant than longer ones
American Toad, Blue-spotted Salamander, Bullfrog, Eastern Newt, Four-toed Salamander, Gray Treefrog, Green Frog, Mink Frog, Northern Leopard Frog, Pickerel Frog, Spotted Salamander, Western Chorus Frog
Defining Criteria: allowing amphibians to travel between terrestrial and breeding *potential determined based on identification of habitat; several layers of native vegetation; ideally unbroken by roads, waterways, Amphibian Breeding (Wetland) SWH (i.e., not waterbodies, and development; ideally with gaps less than 20 m Woodland) SWH: 15+m on both sides of a waterway/ecosite OR up to 200m wide in woodland habitats Any forested habitat; shorter corridors are White-tailed Deer more significant than longer ones; often associated with Stratum II Deer Wintering Areas; typically follow riparian areas, woodlots, Defining Criteria: allowing movement to and from wintering areas; MNRF-identified areas of physical geography (ravines or ridges) deer wintering habitat will have corridors used by deer during spring and fall; should be unbroken by roads and residential areas *potential determined based on identification of SWH: Corridors should be 200+m wide including canopy gaps <20m OR 15+m Deer Wintering SWH riparian vegetation cover on both sides of a waterway
Yes
Yes
Project File Report Kawartha Lakes Water-Wastewater Master Plan Capacity Assessment
APPENDIX E MAPS FOR EACH COMMUNITY IDENTIFYING HIGH ARCHAEOLOGICAL POTENTIAL
G:\2024 Projects\EA\24EA-275 Kawartha Lakes WWWMP\ArcPro_Workspace\ArcPro_Workspace.aprx
b Cam
ray
Ken Reid Conservation Area
Rd
± 36
P ig
ake
6
5
y3
y3
hwa
hwa
Hig
Hig
Pi
Kawartha Lakes Municipal Airport
Linden Valley
L eon
n geo
Lak
eR
d
36B
Stony Creek
Lindsay
Ross Memorial Hospital
Lin
St W
dsa
Kent
t S
Victoria Gardens
yS
H ig h w a y 7
Lindsay Golf and Country Club
7
Taylor Corners
Cunningham's Corners
Hig hw
ay 7
Rural Ops
7
Mariposa Brook Brita
in R
d
Hillhead Corners Hi
Hig hwa y3
AREA OF HIGH ARCHAEOLOGICAL POTENTIAL
iver
PROJECT AREA
gR go Sc u
le Lit t
5
Figure 3: Lindsay Archaeological Potential Map
Reaboro
Source: First Base Solutions Inc., Maxar, Province of Ontario, Esri Canada, Esri, TomTom, Garmin, SafeGraph, GeoTechnologies, Inc, METI/NASA, USGS, EPA, NPS, USDA, NRCan, Parks Canada Projection: NAD 1983 UTM Zone 17N Scale: 1:47,000 Page Size: 11 x 17
0
500
gh
wa
y7
Metres ASI Project No.: 24EA-275
Drawn By: jfernandez
Date: 11/18/2024 3:22 PM
File: 24EA275_Potential
Rd
3
ver
49
Co
oad
unt
yR
Oli
±
yR
unt
oad
Co
ew evi T r e G:\2024 Projects\EA\24EA-275 Kawartha Lakes WWWMP\ArcPro_Workspace\ArcPro_Workspace.aprx
sR d
Cos hs Rd
St Alb ans
Bobcaygeon Re
Rd
Kawartha Settlers' Village
id S t
Du
We
Cou nty Roa d 8
Pri
S nce
en
St 36
Stumpy Bay
t W
St
t nt S
S
Fr o
t W
Port 32
t
8
Crane Bay
dS
ad
t St
Nee
un Co
o ty R
Big
Eas
st S
Que
ke
Green Bay
Pa
rk
St
Ech
Edgewood Condominiums
oB
ay Rd
Dead Horse Island
36
r 36
M
ea
gor D r
in D
R
G re
ch
ty
24
Mc
C
n ou
d oa
PROJECT AREA AREA OF HIGH ARCHAEOLOGICAL POTENTIAL
Source: Province of Ontario, Esri Canada, Esri, TomTom, Garmin, SafeGraph, GeoTechnologies, Inc, METI/NASA, USGS, EPA, NPS, US Census Bureau, USDA, NRCan, Parks Canada, Maxar Projection: NAD 1983 UTM Zone 17N Scale: 1:19,000 Page Size: 11 x 17
Figure 1: Bobcaygeon Archaeological Potential Map
Big Bald Narrows 0
500
Metres ASI Project No.: 24EA-275
Drawn By: jfernandez
Date: 11/18/2024 3:22 PM
File: 24EA275_Potential
Rd
is a S t
G:\2024 Projects\EA\24EA-275 Kawartha Lakes WWWMP\ArcPro_Workspace\ArcPro_Workspace.aprx
±
121
tW
P
Q ui
nd
en
sS
ty Coun
tW
Roa d
12
1
St
St St
C ou nt y Roa W
d8
Cou
nt y
Roa
d8
Cli
fto
Bo
sa
ue
ce
t
Lo
rin
nS
St
es S
Q ue e n
P r in c
Deihl Point
Fenelon Falls
St ay ds
R e
Lin t yS
t
nc
a
rra
rS
ne Fe
ce S
lon
t
Mu
Rd
ov
ach
pe
Be
Gr
ry
Rd
ni
E lli
Byrnell Golf Club
int
Ju
Fr
Sackett Bay
Ri
r ve
St
Po
nelo n
E
iot
St
C
Ro ount y
E ll
ko
s
t
d
ad 8
Fe
Hic
ci
on
gS
an
rge
Fr
Stu
Kin
Gregory Point
Cameron Lake Dam
is
St
Riv e
E
r La
r
E
S
t
cis
rge
b
e
r
int
D
Po
r ho
on
sS
Rd
st S t S
oad 1 2 1
AREA OF HIGH ARCHAEOLOGICAL POTENTIAL
We
C o u n ty R
PROJECT AREA
n Fr a
Stu
Ra
y'
Dr
er D
a
c e St
ou
Ro
on go
Riv
E lli
C
y nt
d8
Source: Esri Community Maps Contributors, Province of Ontario, Esri Canada, Esri, TomTom, Garmin, SafeGraph, GeoTechnologies, Inc, METI/ NASA, USGS, EPA, NPS, US Census Bureau, USDA, NRCan, Parks Canada, Maxar Projection: NAD 1983 UTM Zone 17N Scale: 1:15,000 Page Size: 11 x 17
Figure 2: Fenelon Falls Archaeological Potential Map
0
500 Metres
ASI Project No.: 24EA-275
Drawn By: jfernandez
Date: 11/18/2024 3:22 PM
File: 24EA275_Potential
G:\2024 Projects\EA\24EA-275 Kawartha Lakes WWWMP\ArcPro_Workspace\ArcPro_Workspace.aprx
Gr a
ssy
Rd
Acr
±
eva le R
wk
Rd
e D r
ver
Hig
Rd
h Hig
Stu
wa
hw
ay
7
y7
on
ley
rge
ver
S ib
Bea
St N
Ave
Kin
gS
t E
Omemee Co
Qu
Rd
t W
S
Rd
Em
ay
am
St
ts
hw
gS
gh t t in
een
H ei gh
Kin Hig
hw
d
Ha
Bea
Hig
ily
7
Par
Dr
len He
Rd
Baldy Hill
M ou
S k i Hill R d
nt H o r
e
Rd
ham
d
b
Co
g t t in
kR
7
PROJECT AREA AREA OF HIGH ARCHAEOLOGICAL POTENTIAL
Mount Nebo Me
Source: Province of Ontario, Esri Canada, Esri, TomTom, Garmin, SafeGraph, GeoTechnologies, Inc, METI/NASA, USGS, EPA, NPS, US Census Bureau, USDA, NRCan, Parks Canada, Maxar Projection: NAD 1983 UTM Zone 17N Scale: 1:19,000 Page Size: 11 x 17
Figure 4: Omemee Archaeological Potential Map
0
a
v dow
500 Metres
ASI Project No.: 24EA-275
Drawn By: jfernandez
Date: 11/18/2024 3:22 PM
File: 24EA275_Potential
iew
Rd
Pro
G:\2024 Projects\EA\24EA-275 Kawartha Lakes WWWMP\ArcPro_Workspace\ArcPro_Workspace.aprx
spe ct R d
dm
nt y
Win
Cou
ere Rd
6
Rd
d4
ms
Roa
Far
± od Wo
gS
d
t
Duke
St
Far
low
ms
Woodville
Rd
Rd
er Riv
eR
St
ale
ion
pad
Un
Nap
Kin
vill
J
nS
t
es St
coe
g
oh
Agn
S im
Kin
St
St 46
de
Cou nt y
Rd
lish
lle
E ng
Roa
Rd
W
vi ood
Lin
d4 6
E ng
Lin
de
al nV
ley
Lin
de
al nV
ley
Rd
Rd
lish Rd
PROJECT AREA AREA OF HIGH ARCHAEOLOGICAL POTENTIAL
Source: First Base Solutions Inc., Maxar, Esri Community Maps Contributors, Province of Ontario, Esri Canada, Esri, TomTom, Garmin, SafeGraph, GeoTechnologies, Inc, METI/NASA, USGS, EPA, NPS, US Census Bureau, USDA, Projection: NAD 1983 UTM Zone 17N Scale: 1:14,000 Page Size: 11 x 17
Figure 5: Woodville Archaeological Potential Map
0
500 Metres
ASI Project No.: 24EA-275
Drawn By: jfernandez
Date: 11/18/2024 3:22 PM
File: 24EA275_Potential
al nV
ley
Rd
Project File Report Kawartha Lakes Water-Wastewater Master Plan Capacity Assessment
APPENDIX F CAPITAL IMPLEMENTATION PLAN (TECHNICAL MEMORANDUM 8)
Technical Memorandum 8
Kawartha Lakes Water-Wastewater Master Plan Capital Implementation Plan January 2025 | CKL Contract 2022-13-CP | TYLin Project 10599 City of Kawartha Lakes
Technical Memorandum 8 Kawartha Lakes Water-Wastewater Master Plan Capacity Assessment
Table of Contents 1 INTRODUCTION ........................................................................................................... 1 2 APPROACH AND METHODOLOGY ............................................................................. 2 3 COST ESTIMATION ....................................................................................................... 3 4 WATER SYSTEM ............................................................................................................ 4 4.1 Lindsay and Oakwood Water System Upgrades ........................................... 4 4.2 Bobcaygeon Water System Upgrades ............................................................ 8 4.3 Fenelon Falls Water System Upgrades ......................................................... 10 4.4 Woodville Water System Upgrades .............................................................. 11 4.5 Cost of Recommended Water Infrastructure .............................................. 12 5 WASTEWATER SYSTEM ............................................................................................. 14 5.1 Lindsay Wastewater System Upgrades......................................................... 14 5.2 Bobcaygeon Wastewater System Upgrades ................................................ 22 5.3 Fenelon Falls Wastewater System Upgrades ............................................... 24 5.4 Omemee Wastewater System Upgrades ...................................................... 26 5.5 Cost of Recommended Wastewater Infrastructure .................................... 27
LIST OF TABLES Table 4-1: Lindsay 2031 Upgrade Projects List....................................................................................4 Table 4-2: Lindsay 2041 Upgrade Projects List....................................................................................6 Table 4-3: Lindsay 2051 Upgrade Projects List....................................................................................6 Table 4-4: Oakwood Upgrade Projects List ..........................................................................................7 Table 4-5: Bobcaygeon 2031 Upgrade Projects List ..........................................................................8 Table 4-6: Bobcaygeon 2041 Upgrade Projects List ..........................................................................9 Table 4-7: Bobcaygeon 2051 Upgrade Projects List ..........................................................................9 Table 4-8: Fenelon 2031 Upgrade Projects List ................................................................................ 10 Table 4-9: Fenelon 2041 Upgrade Projects List ................................................................................ 10 Table 4-10: Woodville Upgrade Projects List .................................................................................... 11 Table 4-11: 2031 Water Infrastructure Costs – By Community .................................................. 12 Table 4-12: 2041 Water Infrastructure Costs – By Community .................................................. 12 Table 4-13: 2051 Water Infrastructure Costs – By Community .................................................. 13 Table 4-12: Water Infrastructure Costs - By Community .............................................................. 13 Table 5-1: Lindsay 2031 Upgrade Projects List................................................................................. 14 Table 5-2: Lindsay 2041 Upgrade Projects List................................................................................. 16 Project Number 10599 January 2025
Page ii
Technical Memorandum 8 Kawartha Lakes Water-Wastewater Master Plan Capacity Assessment
Table 5-3: Lindsay 2051 Upgrade Projects List................................................................................. 21 Table 5-4: Bobcaygeon 2031 Upgrade Projects List ....................................................................... 22 Table 5-5: Bobcaygeon 2041 Upgrade Projects List ....................................................................... 23 Table 5-6: Bobcaygeon 2051 Upgrade Projects List ....................................................................... 23 Table 5-7: Fenelon Falls 2031 Upgrade Projects List...................................................................... 24 Table 5-8: Fenelon Falls 2041 Upgrade Projects List...................................................................... 25 Table 5-9: Fenelon Falls 2051 Upgrade Projects List...................................................................... 26 Table 5-10: Omemee Upgrade Projects List ...................................................................................... 27 Table 5-11: 2031 Wastewater Infrastructure Costs – By Community ....................................... 27 Table 5-12: 2041 Wastewater Infrastructure Costs – By Community ....................................... 27 Table 5-13: 2051 Wastewater Infrastructure Costs – By Community ....................................... 28 Table 5-14: Wastewater Infrastructure Costs – By Community .................................................. 28
Project Number 10599 January 2025
Page iii
Technical Memorandum 8 Kawartha Lakes Water-Wastewater Master Plan Capacity Assessment
1 INTRODUCTION T.Y. Lin International Canada Inc. (TYLin) was contracted by the City of Kawartha Lakes for completion of a Water and Wastewater Master Plan Update. In this study, TYLin was tasked with identifying the water and wastewater projects necessary to support planned growth and determining an appropriate planning horizon for these projects, to be implemented in the near term, as well as by 2031, 2041, and 2051. The project list identifies an implementation plan based on the planning review conducted and approved by the City. Any changes to the planning review or timing of developments coming online will impact the recommended phasing proposed of this technical memorandum (TM) and shall be reviewed on a per case basis. This TM also documents the cost estimates for these projects which includes the planning (i.e., Class Environmental Assessment), engineering and capital costs.
Project Number 10599 January 2025
Page 1
Technical Memorandum 8 Kawartha Lakes Water-Wastewater Master Plan Capacity Assessment
2 APPROACH AND METHODOLOGY A list of water and wastewater projects has been identified to support the 2051 projected growth in four communities within the City of Kawartha Lakes. This was based on the capacity analysis completed in TM5 and the hydraulic modeling completed in TM6, which assessed the system capacity of facilities (e.g., water and wastewater treatment plants, sewage pumping stations, booster pumping stations, reservoirs), as well as water distribution and sanitary collection systems. Through coordination with the City, planning numbers for 2031 and 2041 were established and confirmed. These numbers were used to identify which 2051 projects would be needed to support growth at the 2031 and 2041 milestones and to establish a recommended timeline for completing the water and wastewater projects.
Project Number 10599 January 2025
Page 2
Technical Memorandum 8 Kawartha Lakes Water-Wastewater Master Plan Capacity Assessment
3 COST ESTIMATION The cost estimate approach categorizes various project types within the water distribution system, sewer collection system and the type of facility (i.e. reservoir, sewage pumping stations, water treatment plant or wastewater treatment plant) and the environmental assessment (EA) classification, if required. The Schedule EA classification should be further reviewed at project commencement to further assess and confirm the preferred alternative. New or upgraded projects within the water distribution and wastewater systems are based on the assumption that all work will be carried out within public rights-of-way, with no upgrades or new infrastructure planned for private property. Various unit rate costs have been applied to each of these categories. These unit rates are suggested and are based on supplier material costs, tender analysis and historical project costs for various municipalities across Ontario. In this recommended approach the unit rates are considered a starting point for each project list and should be further updated as the project details become more defined. For the purposes of this Master Plan, the cost estimates shall be considered Class D which has expected accuracy of -50/+100% for project planning. These cost estimates were developed using unit rates (internal to TYLin), and include pipe material costs, excavation, road restoration within the trench width for the watermain/sewers, and necessary valves. The cost estimate also includes a budget for Class Environmental Assessment, if required, and a 15% engineering fee and 30% contingency fee. It is important to understand that the level of accuracy is expected to increase as each project matures through the planning to design phase leading to refined cost estimates.
Project Number 10599 January 2025
Page 3
Technical Memorandum 8 Kawartha Lakes Water-Wastewater Master Plan Capacity Assessment
4 WATER SYSTEM 4.1 Lindsay and Oakwood Water System Upgrades The proposed water system upgrades consist of the following: Table 4-1: Lindsay 2031 Upgrade Projects List
Upgrade ID
Type
WAT-LIN-01
Watermain
WAT-LIN-02
Watermain
WAT-LIN-03
Watermain
Project Description
New 400mm WM from the New Tank along Angeline St to Exist. WM on Angeline St New 400mm WM along St Joseph Rd from Colborne St W and Kent St W; New 400mm along Kent St W between St Joseph Rd and Commerce Rd Upgrade WM from 250mm to 300mm along Commerce Rd
Length or Size
Class EA Status
Total Cost (2025 Dollars)
800 m
Exempt
$1,530,000
795 m
Exempt
$770,000
275 m
Exempt
$370,000
Project Number 10599 January 2025
Page 4
Technical Memorandum 8 Kawartha Lakes Water-Wastewater Master Plan Capacity Assessment
Watermain
Upgrade WM from 100/150/250 mm to 300mm along Glenelg St W
1117 m
Exempt
$1,650,000
Watermain
Upgrade WM from 250/450mm to 600mm along Mary St W
1387 m
Exempt
$3,920,000
WAT-LIN-10
Watermain
New 150mm WM along Lindsay St S, South of Logie St
1007 m
Exempt
$1,240,000
WAT-LIN-11
WTP
WTP Capacity Increase
62 MLD
Schedule C
$409,000,000
WAT-LIN-12
Storage
New Elevated Tank
10 ML
Schedule B
$15,000,000
Storage
Thornhill Road Reservoir Expansion
9 ML
Schedule B
$13,550,000
WAT-LIN-04
WAT-LIN-06
WAT-LIN-13
Project Number 10599 January 2025
Page 5
Technical Memorandum 8 Kawartha Lakes Water-Wastewater Master Plan Capacity Assessment
WAT-LIN-15
Watermain
New 300 mm WM for Tribute Lands
2085 m
Exempt
$2,570,000
Type
Project Description
Length or Size
Class EA Status
Total Cost (2025 Dollars)
Watermain
Upgrade WM from 250mm to 400mm along Angeline St S
1004 m
Exempt
$7,660,000
Length or Size
Class EA Status
Total Cost (2025 Dollars)
775 m
Exempt
$1,390,000
3258 m
Exempt
$6,110,000
Table 4-2: Lindsay 2041 Upgrade Projects List Upgrade ID
WAT-LIN-05
Table 4-3: Lindsay 2051 Upgrade Projects List
Upgrade ID
Type
WAT-LIN-07
Watermain
WAT-LIN-08
Watermain
Project Description Upgrade WM from 300mm to 400mm along Dobson St and Proposed 400mm Extension to Verulam St S Upgrade WM from 200/300mm to 400mm along Verulam Rd and Proposed
Project Number 10599 January 2025
Page 6
Technical Memorandum 8 Kawartha Lakes Water-Wastewater Master Plan Capacity Assessment
400mm Extension
WAT-LIN-09
WAT-LIN-14
Watermain
New 150mm WM along Verulam Rd St, South of Dobson St Extension
1315 m
Exempt
$1,330,000
Watermain
New 400mm WM Flato Land Trunk Loop
6940 m
Exempt
$11,070,000
Type
Project Description
Length or Size
Class EA Status
Total Cost (2025 Dollars)
Watermain
Upgrade WM from 100/150mm to 250mm along Colborne St W towards Oakwood
3258 m
Exempt
$4,390,000
Storage
Oakwood Reservoir Upgrades
0.5 ML
Schedule B
$1,590,000
Table 4-4: Oakwood Upgrade Projects List Upgrade ID
WAT-OAK-01
WAT-OAK-02
Project Number 10599 January 2025
Page 7
Technical Memorandum 8 Kawartha Lakes Water-Wastewater Master Plan Capacity Assessment
4.2 Bobcaygeon Water System Upgrades Table 4-5: Bobcaygeon 2031 Upgrade Projects List
Upgrade ID
Type
WAT-BOB-01
Watermain
WAT-BOB-03
Watermain
WAT-BOB-04
Watermain
WAT-BOB-05
Watermain
WAT-BOB-06
Watermain
Project Description Upgrade WM from 150mm to 200mm from North St to the intersection of Hillview Dr and Balaclava St Upgrade WM from 150mm to 200mm along Canal St E, Boyd St to Island Bay Dr Upgrade WM from 150mm to 200mm from Need St to East St S Upgrade WM from 150mm to 250mm running parallel to Mill St New twinned 250mm WM from WTP to Front St
Length or Size
Class EA Status
Total Cost (2025 Dollars)
1020 m
Exempt
$1,240,000
1466 m
Exempt
$1,790,000
276 m
Exempt
$340,000
294 m
Exempt
$360,000
358 m
Exempt
$400,000
Project Number 10599 January 2025
Page 8
Technical Memorandum 8 Kawartha Lakes Water-Wastewater Master Plan Capacity Assessment
WAT-BOB-08
Watermain
New 250mm WM along Balaclava St
256 m
Exempt
$290,000
WAT-BOB-10
WTP
WTP Capacity Increase
8.9 MLD
Schedule C
$68,250,000
Length or Size
Class EA Status
Total Cost (2025 Dollars)
669 m
Exempt
$810,000
274 m
Exempt
$210,000
Table 4-6: Bobcaygeon 2041 Upgrade Projects List Upgrade ID
Type
WAT-BOB-02
Watermain
WAT-BOB-07
Watermain
Project Description Upgrade WM from 150mm to 200mm along Sherwood St and Park St New 150mm from Cedartree Lane to Riverside Dr
Table 4-7: Bobcaygeon 2051 Upgrade Projects List Upgrade ID
WAT-BOB-09
Type
Project Description
Length or Size
Class EA Status
Total Cost (2025 Dollars)
Storage
Reservoir Storage Expansion
1.5 ML
Schedule B
$3,760,000
Project Number 10599 January 2025
Page 9
Technical Memorandum 8 Kawartha Lakes Water-Wastewater Master Plan Capacity Assessment
4.3 Fenelon Falls Water System Upgrades Table 4-8: Fenelon 2031 Upgrade Projects List Upgrade ID
Type
WAT-FF-01
Storage
WAT-FF-02
Watermain
WAT-FF-03
Watermain
WAT-FF-04
Watermain
WAT-FF-07
Watermain
WAT-FF-08
Storage
Project Description New 200mm WM east of Concession Rd New 200mm WM east of Concession Rd New 200mm WM east of Concession Rd New 200mm WM east of Concession Rd New 150mm WM west of Lindsay St Booster Pumping Station
Length or Size
Class EA Status
Total Cost (2025 Dollars)
693 m
Exempt
$700,000
262 m
Exempt
$270,000
790 m
Exempt
$800,000
624 m
Exempt
$630,000
739 m
Exempt
$580,000
13 MLD
Schedule B
$700,000
Length or Size
Class EA Status
Total Cost (2025 Dollars)
4.9 MLD
Schedule C
$4,850,000
2.9 ML
Schedule B
$24,750,000
Table 4-9: Fenelon 2041 Upgrade Projects List Upgrade ID
Type
WAT-FF-05
WTP
WAT-FF-06
Storage
Project Description Reservoir Storage expansion WTP Capacity Increase
All upgrades to the Fenelon Falls system is expected to be completed by 2041.
Project Number 10599 January 2025
Page 10
Technical Memorandum 8 Kawartha Lakes Water-Wastewater Master Plan Capacity Assessment
4.4 Woodville Water System Upgrades Table 4-10: Woodville Upgrade Projects List Upgrade ID
Type
Project Description
WAT-WV-01
WTP
WTP Capacity Increase
Length or Size
Class EA Status
Total Cost (2025 Dollars)
0.8 MLD
Schedule C
$7,150,000
Project Number 10599 January 2025
Page 11
Technical Memorandum 8 Kawartha Lakes Water-Wastewater Master Plan Capacity Assessment
4.5 Cost of Recommended Water Infrastructure The capital investments required for the proposed water system upgrades are provided below. Table 4-11: 2031 Water Infrastructure Costs – By Community
Lindsay
2031 Forecasted Growth [Res. Units] 6,101
2031 Estimated Capital Costs $449,600,000
Bobcaygeon
532
$72,670,000
Fenelon Falls
456
$3,680,000
Woodville
-
-
Oakwood
-
-
Omemee
-
-
TOTAL
7,089
$525,950,000
Water System
Table 4-12: 2041 Water Infrastructure Costs – By Community Water System
2041 Forecasted Growth [Res. Units]
2041 Estimated Capital Costs
Lindsay
5,120
$7,660,000
Bobcaygeon
770
$1,020,000
Fenelon Falls
793
$29,600,000
Woodville
-
-
Oakwood
-
-
Omemee
-
-
TOTAL
6,683
$38,280,000
Project Number 10599 January 2025
Page 12
Technical Memorandum 8 Kawartha Lakes Water-Wastewater Master Plan Capacity Assessment
Table 4-13: 2051 Water Infrastructure Costs – By Community
Lindsay
2051 Forecasted Growth [Res. Units] 12,280
2051 Estimated Capital Costs $19,900,000
Bobcaygeon
959
$3,760,000
Fenelon Falls
249
-
Woodville
148
$7,150,000
Oakwood
93
$5,980,000
Omemee
427
-
TOTAL
14,156
$36,790,000
Water System
Table 4-14: Water Infrastructure Costs - By Community Water System
Forecasted Growth [Res. Units]
Estimated Capital Costs
Cost/Unit
Lindsay
23,501
$477,160,000
$20,304
Oakwood
93
$5,980,000
$64,301
Bobcaygeon
2,261
$77,450,000
$34,255
Fenelon Falls
1,498
$33,280,000
$22,213
Woodville
148
$7,150,000
$48,311
TOTAL
27,501
$601,020,000
-
Project Number 10599 January 2025
Page 13
Technical Memorandum 8 Kawartha Lakes Water-Wastewater Master Plan Capacity Assessment
5 WASTEWATER SYSTEM The 2051 growth numbers identified in TM5 were used for the system capacity assessment and the following project list were identified. Through various discussion with the City, 2031 and 2041 planning numbers were agreed upon and the planning data was used to identify which all 2051 projects would be required to support growth in 2031 and 2041 growth at respective locations.
5.1 Lindsay Wastewater System Upgrades The proposed wastewater system upgrades consist of the following: Table 5-1: Lindsay 2031 Upgrade Projects List
Upgrade ID
WW-LIN-02
WW-LIN-03
Type
Project Description
Length or Size
Class EA Status
Total Cost (2025 Dollars)
Sewer
Sewer Upgrade to 300mm from 200mm between Laurent Blvd and Angeline St S
86 m
Exempt
$610,000
Sewer
Sewer Upgrade to 300mm along Angeline St S
629 m
Exempt
$3,270,000
343 m
Exempt
$2,230,000
206 m
Exempt
$1,400,000
WW-LIN-04
Sewer
WW-LIN-05
Sewer
Sewer Upgrade to 375mm from 300mm along Auk Trail Sewer Upgrade to 375mm from 300mm along Adelaide St S
Project Number 10599 January 2025
Page 14
Technical Memorandum 8 Kawartha Lakes Water-Wastewater Master Plan Capacity Assessment
WW-LIN-17
Sewer
WW-LIN-20
Sewer
Sewer Upgrade to 300mm from 250mm west of McLaughing Rd Sewer Upgrade to 375mm from 300mm along Lindsay St S between Kent St and Glenelg St
100 m
Exempt
$680,000
334 m
Exempt
$2,030,000
45 MLD
Schedule C
$206,000,000
WW-LIN-33
WPCP
WPCP Capacity Increase
WW-LIN-34
SPS
Rideout St SPS upgrades
508 L/s
Schedule B
$14,730,000
SPS
Riverview St SPS Upgrades
16 L/s
Schedule B
$460,000
Sewer
New 375mm Sewers for Tribute Lands
1399 m
Exempt
$6,720,000
Sewer
New 300mm along Lindsay St S
1129 m
Exempt
$5,070,000
SPS
Mary St SPS and Forcemain Upgrade
60 L/s
Schedule B
$3,610,000
WW-LIN-36
WW-LIN-40
WW-LIN-41
WW-LIN-43
Project Number 10599 January 2025
Page 15
Technical Memorandum 8 Kawartha Lakes Water-Wastewater Master Plan Capacity Assessment
WW-LIN-44
WW-LIN-45
WW-LIN-46
Sewer
Sewer Upgrade to 250mm from 225mm along Wolfe St
219 m
Exempt
$1,110,000
Sewer
Sewer Upgrade to 300mm along Durham St
160 m
Exempt
$860,000
Sewer
Sewer Upgrade to 300mm along Huron St
83 m
Exempt
$450,000
Type
Project Description
Length or Size
Class EA Status
Total Cost (2025 Dollars)
Sewer
Sewer Upgrade to 250mm from 200mm along Laurent Blvd
1024 m
Exempt
$5,180,000
Sewer
Sewer Upgrade to 600mm along Albert St S
464 m
Exempt
$2,970,000
Sewer
Sewer Upgrade to 600mm from 450mm along Durham St W
191 m
Exempt
$1,370,000
Table 5-2: Lindsay 2041 Upgrade Projects List
Upgrade ID
WW-LIN-01
WW-LIN-06
WW-LIN-07
Project Number 10599 January 2025
Page 16
Technical Memorandum 8 Kawartha Lakes Water-Wastewater Master Plan Capacity Assessment
WW-LIN-08
Sewer
WW-LIN-09
Sewer
WW-LIN-10
Sewer
WW-LIN-11
Sewer
WW-LIN-12
Sewer
Sewer Upgrade to 600mm from 450mm along Sussex St S between Glenelg St and Durham St Sewer Upgrade to 600mm from 500mm along Sussex St S from south of Kent St Sewer Upgrade to 600mm from 500mm along Kent St W between Sussex St and Victoria Ave Sewer Upgrade to 600mm from 500mm along Victoria Ave N Sewer Upgrade to 600mm from 500mm along Wellington St between Victoria Ave and Cambridge St
269 m
Exempt
$1,930,000
221 m
Exempt
$1,590,000
122 m
Exempt
$880,000
292 m
Exempt
$2,100,000
128 m
Exempt
$920,000
Project Number 10599 January 2025
Page 17
Technical Memorandum 8 Kawartha Lakes Water-Wastewater Master Plan Capacity Assessment
WW-LIN-13
Sewer
WW-LIN-14
Sewer
WW-LIN-15
Sewer
WW-LIN-16
Sewer
WW-LIN-21
WW-LIN-22
Sewer Upgrade to 600mm from 500mm along Cambridge St N between Wellington St and Bond St Sewer Upgrade to 600mm from 500mm along Bond St W between Cambridge St and William St Sewer Upgrade to 600mm from 500mm along William St N between Bond St and Francis St Sewer Upgrade to 600mm from 525mm along Francis St, east of Francis St
130 m
Exempt
$930,000
186 m
Exempt
$1,340,000
145 m
Exempt
$1,040,000
83 m
Exempt
$600,000
Sewer
Sewer Upgrade to 300mm from 200mm along Logan Lane
92 m
Exempt
$640,000
Sewer
Sewer Upgrade to 375mm from 200mm along Maguire St
254 m
Exempt
$1,550,000
Project Number 10599 January 2025
Page 18
Technical Memorandum 8 Kawartha Lakes Water-Wastewater Master Plan Capacity Assessment
WW-LIN-23
WW-LIN-24
Sewer
Sewer Upgrade to 250mm from 200mm along Maguire St, east of Logan Lane
49 m
Exempt
$250,000
Sewer
Sewer Upgrade to 600mm along Logie St
994 m
Exempt
$7,000,000
166 m
Exempt
$1,200,000
518 m
Exempt
$3,520,000
210 m
Exempt
$1,570,000
1782 m
Exempt
$10,660,000
WW-LIN-25
Sewer
WW-LIN-26
Sewer
WW-LIN-27
Sewer
WW-LIN-28
Sewer
Sewer Upgrade to 450mm from 375mm from Parkside St and crossing perpendicular ly to Hillside Dr Sewer Upgrade to 500mm from 450mm along Logie St from Hillside Dr to Riverview Rd Sewer Upgrade to 500mm from 450mm along Logie St from Hillside Dr to Riverview Rd New 600mm Sewer along Highway 36
Project Number 10599 January 2025
Page 19
Technical Memorandum 8 Kawartha Lakes Water-Wastewater Master Plan Capacity Assessment
WW-LIN-29
Sewer
New 600mm along W Wilson Rd
131 m
Exempt
$930,000
WW-LIN-30
Sewer
New 600mm along Lagoon St
515 m
Exempt
$3,080,000
Sewer
New 600mm along Lagoon St to Lindsay WPCP
98 m
Exempt
$590,000
SPS
Logie St SPS and Forcemain Upgrades
176 L/s
Schedule B
$5,860,000
SPS
Lindsay Fairground SPS upgrades
28 L/s
Schedule B
$810,000
2806 m
Exempt
$15,440,000
2023 m
Exempt
$9,580,000
WW-LIN-31
WW-LIN-35
WW-LIN-37
WW-LIN-38
Sewer
WW-LIN-39
Sewer
New sewers 300mm to 600mm for Flato Development s North of Pigeon Lake Rd New sewers 300 mm to 450mm for Flato Development s South of Pigeon Lake Rd
Project Number 10599 January 2025
Page 20
Technical Memorandum 8 Kawartha Lakes Water-Wastewater Master Plan Capacity Assessment
WW-LIN-42
SPS
Two New SPSs and Forcemain for Flato Lands
407 L/s (North SPS) 192 L/s (South SPS)
Schedule B
$19,520,000
Length or Size
Class EA Status
Total Cost (2025 Dollars)
576 m
Exempt
$3,060,000
236 m
Exempt
$1,270,000
Table 5-3: Lindsay 2051 Upgrade Projects List
Upgrade ID
Type
WW-LIN-18
Sewer
WW-LIN-19
Sewer
Project Description
Sewer Upgrade to 250mm from 200mm from the south end of Heritage Way and then crossing Angeline St to Chadwin Dr Sewer Upgrade to 300mm from 225mm along Angeline St N, between Chadwin Dr and Regent St
Project Number 10599 January 2025
Page 21
Technical Memorandum 8 Kawartha Lakes Water-Wastewater Master Plan Capacity Assessment
WW-LIN-32
Sewer
Sewer Upgrade to 400mm from 375mm along William St. N
95 m
Exempt
$580,000
5.2 Bobcaygeon Wastewater System Upgrades The proposed wastewater system upgrades consist of the following: Table 5-4: Bobcaygeon 2031 Upgrade Projects List
Type
Project Description
Length or Size
Class EA Status
Total Cost (2025 Dollars)
WW-BOB-01
Sewer
Sewer Upgrade to 300mm from 200mm along Helen St
111 m
Exempt
$600,000
WW-BOB-08
WPCP
WPCP Capacity Increase
5.6 MLD
Schedule C
$46,500,000
WW-BOB-10
SPS
Front Street SPS Upgrades
61 L/s
Schedule B
$1,770,000
SPS
Anne Street SPS and Forcemain Upgrades
162 L/s
Schedule B
$10,450,000
Upgrade ID
WW-BOB-11
Project Number 10599 January 2025
Page 22
Technical Memorandum 8 Kawartha Lakes Water-Wastewater Master Plan Capacity Assessment
Table 5-5: Bobcaygeon 2041 Upgrade Projects List
Type
Project Description
Length or Size
Class EA Status
Total Cost (2025 Dollars)
Sewer
Sewer Upgrade to 300mm from 200mm along West St
61 m
Exempt
$330,000
WW-BOB-03
Sewer
Sewer Upgrade to 200mm from 150mm south of the end of Little Bob Dr
198 m
Exempt
$930,000
WW-BOB-12
SPS
Little Bob Drive SPS Upgrades
15 L/s
Schedule B
$440,000
Length or Size
Class EA Status
Total Cost (2025 Dollars)
239 m
Exempt
$1,210,000
719 m
Exempt
$3,640,000
Upgrade ID
WW-BOB-02
Table 5-6: Bobcaygeon 2051 Upgrade Projects List
Upgrade ID
Type
WW-BOB-04
Sewer
WW-BOB-05
Sewer
Project Description Sewer Upgrade to 250mm from 200mm along Helen St Sewer Upgrade to 250mm from 200mm along Cedartree Ln
Project Number 10599 January 2025
Page 23
Technical Memorandum 8 Kawartha Lakes Water-Wastewater Master Plan Capacity Assessment
WW-BOB-06
Sewer
WW-BOB-07
Sewer
WW-BOB-09
SPS
Sewer Upgrade to 300mm from 250mm along Front St W Sewer Upgrade to 350mm from 300mm along Need St Need St SPS Upgrades
383 m
Exempt
$2,070,000
112 m
Exempt
$640,000
61 L/s
Schedule B
$1,770,000
5.3 Fenelon Falls Wastewater System Upgrades The proposed wastewater system upgrades consist of the following: Table 5-7: Fenelon Falls 2031 Upgrade Projects List
Upgrade ID
Type
WW-FF-01
Sewer
WW-FF-02
Sewer
WW-FF-13
WPCP
Project Description Sewer Upgrade to 300mm from 200mm along Bond St E Sewer Upgrade to 250mm from 200mm along Lindsay St WPCP Capacity Increase
Length or Size
Class EA Status
Total Cost (2025 Dollars)
142 m
Exempt
$770,000
277 m
Exempt
$1,400,000
2.8 MLD
Schedule C
$20,400,000
Project Number 10599 January 2025
Page 24
Technical Memorandum 8 Kawartha Lakes Water-Wastewater Master Plan Capacity Assessment
WW-FF-14
SPS
WW-FF-15
SPS
WW-FF-16
SPS
Colborne St SPS Forcemain Upgrade and Forcemain Upgrade Ellice St SPS Upgrades and Forcemain Upgrades Francis St SPS Upgrades
145 L/s
Schedule B
$5,210,000
225 L/s
Schedule B
$9,580,000
50 L/s
Schedule B
$1,450,000
Length or Size
Class EA Status
Total Cost (2025 Dollars)
101 m
Exempt
$550,000
115 m
Exempt
$700,000
141 m
Exempt
$860,000
341 m
Exempt
$2,050,000
Table 5-8: Fenelon Falls 2041 Upgrade Projects List Upgrade ID
Type
WW-FF-03
Sewer
WW-FF-04
Sewer
WW-FF-05
Sewer
WW-FF-06
Sewer
Project Description Sewer Upgrade to 300mm from 200mm along Bond St E Sewer Upgrade to 375mm from 200mm along Elgin St Sewer Upgrade to 375mm from 250mm along Clifton St Sewer Upgrade to 375mm along Francis St W
Project Number 10599 January 2025
Page 25
Technical Memorandum 8 Kawartha Lakes Water-Wastewater Master Plan Capacity Assessment
WW-FF-07
Sewer
WW-FF-08
Sewer
WW-FF-09
Sewer
WW-FF-10
Sewer
WW-FF-11
Sewer
Sewer Upgrade to 375mm from 300mm along Colborne St Sewer Upgrade to 450mm from 400mm along Lindsay St Sewer Upgrade to 600mm from 450mm along Elliot St to Ellice St SPS New 250mm sewer West of Sturgeon Point Rd New 200mm sewer along Short St
116 m
Exempt
$710,000
76 m
Exempt
$480,000
605 m
Exempt
$4,340,000
1209 m
Exempt
$4,930,000
330 m
Exempt
$1,300,000
Table 5-9: Fenelon Falls 2051 Upgrade Projects List Upgrade ID
WW-FF-12
Type
Project Description
Length or Size
Class EA Status
Total Cost (2025 Dollars)
Sewer
Sewer Upgrade to 250mm from 200mm along Francis St E to Francis St SPS
103 m
Exempt
$520,000
5.4 Omemee Wastewater System Upgrades The proposed wastewater system upgrades consist of the following:
Project Number 10599 January 2025
Page 26
Technical Memorandum 8 Kawartha Lakes Water-Wastewater Master Plan Capacity Assessment
Table 5-10: Omemee Upgrade Projects List
Upgrade ID
WW-OME-01
Type
Project Description
Length or Size
Class EA Status
Total Cost (2025 Dollars)
Sewer
Sewer Upgrade to 450mm from 300mm
781 m
Exempt
$4,960,000
5.5 Cost of Recommended Wastewater Infrastructure The capital investments required for the proposed wastewater system upgrades are provided below. Table 5-11: 2031 Wastewater Infrastructure Costs – By Community Wastewater System
2031 Forecasted Growth [Res. Units]
2031 Estimated Capital Costs
Lindsay
6,101
$249,230,000
Bobcaygeon
532
$59,320,000
Fenelon Falls
456
$38,810,000
Omemee
-
-
TOTAL
7,089
$347,360,000
Table 5-12: 2041 Wastewater Infrastructure Costs – By Community Wastewater System
2041 Forecasted Growth [Res. Units]
2041 Estimated Capital Costs
Lindsay
5,120
$103,050,000
Bobcaygeon
770
$1,700,000
Fenelon Falls
793
$15,920,000
Omemee
-
-
Project Number 10599 January 2025
Page 27
Technical Memorandum 8 Kawartha Lakes Water-Wastewater Master Plan Capacity Assessment
Wastewater System
2041 Forecasted Growth [Res. Units]
2041 Estimated Capital Costs
TOTAL
6,683
$120,670,000
Table 5-13: 2051 Wastewater Infrastructure Costs – By Community Wastewater System
2051 Forecasted Growth [Res. Units]
2051 Estimated Capital Costs
Lindsay
12,280
$4,910,000
Bobcaygeon
959
$9,330,000
Fenelon Falls
249
$520,000
Omemee
427
$4,960,000
TOTAL
13,915
$19,720,000
Table 5-14: Wastewater Infrastructure Costs – By Community Wastewater System
Forecasted Growth [Res. Units]
Estimated Capital Costs
Cost/Unit
Lindsay
23,501
$357,190,000
$15,199
Bobcaygeon
2,261
$70,350,000
$31,110
Fenelon Falls
1,498
$55,250,000
$36,877
Omemee
427
$4,960,000
$11,616
TOTAL
27,687
$487,750,000
Project Number 10599 January 2025
Page 28
O din
Technical Memorandum 6
Kawartha Lakes Water-Wastewater Master Plan Modelling January 2025 | CKL Contract 2022-13-CP | TYLin Project 10599 City of Kawartha Lakes
Technical Memorandum 6 Kawartha Lakes Water-Wastewater Master Plan Capacity Assessment
TABLE OF CONTENTS 1
INTRODUCTION....................................................................................................................... 1
2
MODELLING BACKGROUND................................................................................................... 2 2.1 Modelling Platforms ......................................................................................................... 2
3
2.2
Communities Modelled .............................................................................................. 2
2.3
Existing Population ..................................................................................................... 2
WATER MODELLING METHODOLOGY .................................................................................. 3 3.1
3.2
3.3
3.4
4
Pipe Networks ............................................................................................................. 3 3.1.1
Junction Elevations.................................................................................................................... 3
3.1.2
Pipe Roughness C-Factors ..................................................................................................... 3
Water Facilities ............................................................................................................ 4 3.2.1
Water Treatment Plants .......................................................................................................... 4
3.2.2
Booster Pumping Stations...................................................................................................... 4
3.2.3
Elevated Tanks and Reservoirs ............................................................................................. 4
Water Demands........................................................................................................... 4 3.3.1
Design Flows Criteria................................................................................................................ 4
3.3.2
Nodal Demand Distribution .................................................................................................. 5
3.3.1
Future Modelling Considerations........................................................................................ 6
Water Hydraulic Analysis ........................................................................................... 6 3.4.1
Water System Pressures and Fire Flow Requirements................................................. 6
3.4.2
Demand Scenarios .................................................................................................................... 7
3.4.3
Water Hydraulic Modelling Results - Planning Scenarios.......................................... 7
3.4.4
Lindsay Modelling Results...................................................................................................... 7
3.4.5
Bobcaygeon Modelling Results..........................................................................................23
3.4.6
Fenelon Falls Modelling Results.........................................................................................38
3.4.7
Woodville Modelling Results ..............................................................................................53
WASTEWATER MODELLING METHODOLOGY.................................................................... 62 4.1
Pipe Networks ........................................................................................................... 62 4.1.1
4.2
Pipe Roughness Factor..........................................................................................................62
Lindsay Updates ........................................................................................................ 62 4.2.1
Downtown Trunk Sewer........................................................................................................62
4.2.2
New Sewage Pumping Stations .........................................................................................62
Project Number 10599 January 2025
Page | ii
Technical Memorandum 6 Kawartha Lakes Water-Wastewater Master Plan Capacity Assessment
4.3
4.4
4.5
Facilities...................................................................................................................... 63 4.3.1
Wastewater Treatment Plants.............................................................................................63
4.3.2
Sewage Pumping Stations....................................................................................................63
Wastewater Loads ..................................................................................................... 67 4.4.1
Model Calibration....................................................................................................................67
4.4.2
Design Criteria ..........................................................................................................................70
4.4.3
Wastewater Nodal Distribution..........................................................................................70
4.4.4
Future Modelling Considerations......................................................................................73
Sanitary Sewer Capacity Analysis Methodology.................................................... 73 4.5.1
Level of Service.........................................................................................................................73
4.5.2
Capacity Analysis Scenarios.................................................................................................74
4.5.3
Sanitary System Solutions ....................................................................................................75
4.5.4
Wastewater Hydraulic Modelling Results.......................................................................75
LIST OF FIGURES Figure 3-1: Residential Water Demands Allocation ........................................................................................... 6 Figure 3-2: Lindsay Available Fire Flow under Baseline MDD+FF Scenario .............................................. 8 Figure 3-3: Lindsay Available Fire Flow under Baseline MDD+FF Scenario .............................................. 9 Figure 3-4: Location of Valve Closure ...................................................................................................................10 Figure 3-5: Lindsay Simulated Available Fire Flow with 2031 Proposed Network under MDD+FF Scenario ..............................................................................................................................................12 Figure 3-6: Lindsay Simulated Pressures with2031 Proposed Network under PHD Scenario .........13 Figure 3-7: Lindsay Simulated Available Fire Flow with 2041 Proposed Network under MDD+FF Scenario ..............................................................................................................................................15 Figure 3-8: Lindsay Simulated Pressures with 2041 Proposed Network under PHD Scenario........16 Figure 3-9: Lindsay Simulated Available Fire Flow with 2051 Existing Network under MDD+FF Scenario ..............................................................................................................................................18 Figure 3-10: Lindsay Simulated Pressures with 2051 Existing Network PHD Scenario ......................19 Figure 3-11: Lindsay Simulated Available Fire Flow with 2051 Existing Network under MDD+FF Scenario ..............................................................................................................................................21 Figure 3-12: Lindsay Simulated Pressures with 2051 Existing Network PHD Scenario ......................22 Figure 3-13: Bobcaygeon Simulated Available Fire Flow under Baseline MDD+FF Scenario ..........24 Figure 3-14: Bobcaygeon Simulated Pressures under Baseline PHD Scenario......................................25 Figure 3-15: Bobcaygeon Simulated Available Fire Flow with 2031 Proposed Network under
Project Number 10599 January 2025
Page | iii
Technical Memorandum 6 Kawartha Lakes Water-Wastewater Master Plan Capacity Assessment
MDD+FF Scenario...........................................................................................................................27 Figure 3-16: Bobcaygeon Simulated Pressures with 2031 Proposed Network under PHD Scenario ................................................................................................................................................................28 Figure 3-17: Bobcaygeon Simulated Available Fire Flow with 2041 Proposed Network under MDD+FF Scenario...........................................................................................................................30 Figure 3-18: Bobcaygeon Simulated Pressures with 2041 Proposed Network under PHD Scenario ................................................................................................................................................................31 Figure 3-19: Bobcaygeon Simulated Available Fire Flow with 2051 Existing Network under MDD+FF Scenario...........................................................................................................................33 Figure 3-20: Bobcaygeon Simulated Pressures with 2051 Existing Network under PHD Scenario ................................................................................................................................................................34 Figure 3-21: Bobcaygeon Simulated Available Fire Flow with Proposed 2051 Network under MDD+FF Scenario...........................................................................................................................36 Figure 3-22: Bobcaygeon Simulated Pressures with Proposed 2051 Network under PHD Scenario ................................................................................................................................................................37 Figure 3-23: Fenelon Falls Available Fire Flow under Baseline MDD+FF Scenario...............................39 Figure 3-24: Fenelon Falls Simulated Pressures under Baseline PHD Scenario.....................................40 Figure 3-25: Fenelon Falls Simulated Available Fire Flow with 2031 Proposed Network under MDD+FF Scenario...........................................................................................................................42 Figure 3-26: Fenelon Falls Simulated Pressures with 2031 Proposed Network under PHD Scenario ................................................................................................................................................................43 Figure 3-27: Fenelon Falls Simulated Available Fire Flow with 2041 Proposed Network under MDD+FF Scenario...........................................................................................................................45 Figure 3-28: Fenelon Falls Simulated Pressures with 2041 Proposed Network under PHD Scenario ................................................................................................................................................................46 Figure 3-29: Fenelon Falls Simulated Available Fire Flow with 2051 Existing Network under MDD+FF Scenario...........................................................................................................................48 Figure 3-30: Fenelon Falls Simulated Pressures with 2051 Existing Network PHD Scenario ...........49 Figure 3-31: Fenelon Falls Simulated Available Fire Flow with Proposed 2051 Network under MDD+FF Scenario...........................................................................................................................51 Figure 3-32: Fenelon Falls Simulated Pressures with Proposed 2051 Network under PHD Scenario ................................................................................................................................................................52 Figure 3-33: Woodville Simulated Available Fire Flow under Baseline MDD+FF Scenario...............54 Figure 3-34: Woodville Simulated Pressures under Baseline PHD Scenario ..........................................55 Figure 3-35: Woodville Simulated Available Fire Flow with 2051 Existing Network under MDD+FF Scenario ..............................................................................................................................................57 Figure 3-36: Woodville Simulated Pressures with 2051 Existing Network PHD Scenario .................58
Project Number 10599 January 2025
Page | iv
Technical Memorandum 6 Kawartha Lakes Water-Wastewater Master Plan Capacity Assessment
Figure 3-37: Woodville Simulated Available Fire Flow with 2051 Existing Network under MDD+FF Scenario ..............................................................................................................................................60 Figure 3-38: Woodville Simulated Pressures with 2051 Existing Network PHD Scenario .................61 Figure 4-1: Sample Pump Curve (Mary Street SPS)..........................................................................................64 Figure 4-2: Sanitary Loads Distributions ..............................................................................................................71 Figure 4-3: Example of A Sanitary Pattern...........................................................................................................72 Figure 4-4: Lindsay Simulated Dry Weather Flow under 2031 Existing Buildout Scenario ...............76 Figure 4-5: Lindsay Simulated Wet Weather Flow under 2031 Existing Buildout Scenario..............77 Figure 4-6: Lindsay Simulated Dry Weather Flow under 2041 Existing Buildout Scenario ...............79 Figure 4-7: Lindsay Simulated Wet Weather Flow under 2041 Existing Buildout Scenario..............80 Figure 4-8: Lindsay Simulated Dry Weather Flow under 2051 Existing Buildout Scenario ...............82 Figure 4-9: Lindsay Simulated Wet Weather Flow under 2051 Existing Buildout Scenario..............83 Figure 4-10: Lindsay Simulated Dry Weather Flow under 2051 Proposed Scenario ...........................85 Figure 4-11: Lindsay Simulated Wet Weather Flow under 2051 Proposed Scenario..........................86 Figure 4-16: Bobcaygeon Simulated Dry Weather Flow under 2031 Existing Buildout Scenario...88 Figure 4-17: Bobcaygeon Simulated Wet Weather Flow under 2031 Existing Buildout Scenario .89 Figure 4-18: Bobcaygeon Simulated Dry Weather Flow under 2041 Existing Buildout Scenario...91 Figure 4-19: Bobcaygeon Simulated Wet Weather Flow under 2041 Existing Buildout Scenario .92 Figure 4-20: Bobcaygeon Simulated Dry Weather Flow under 2051 Existing Buildout Scenario...94 Figure 4-21: Bobcaygeon Simulated Wet Weather Flow under 2051 Existing Buildout Scenario .95 Figure 4-22: Bobcaygeon Simulated Dry Weather Flow under 2051 Proposed Scenario .................97 Figure 4-23: Bobcaygeon Simulated Wet Weather Flow under 2051 Proposed Scenario................98 Figure 4-20: Fenelon Falls Simulated Dry Weather Flow under 2031 Existing Buildout Scenario ............................................................................................................................................................. 100 Figure 4-21: Fenelon Falls Simulated Wet Weather Flow under 2031 Existing Buildout Scenario ............................................................................................................................................................. 101 Figure 4-22: Fenelon Falls Simulated Dry Weather Flow under 2041 Existing Buildout Scenario ............................................................................................................................................................. 103 Figure 4-23: Fenelon Falls Simulated Wet Weather Flow under 2041 Existing Buildout Scenario ............................................................................................................................................................. 104 Figure 4-24: Fenelon Falls Simulated Dry Weather Flow under 2051 Existing Buildout Scenario ............................................................................................................................................................. 106 Figure 4-25: Fenelon Falls Simulated Wet Weather Flow under 2051 Existing Buildout Scenario ............................................................................................................................................................. 107 Figure 4-26: Fenelon Falls Simulated Dry Weather Flow under 2051 Proposed Scenario ............. 109 Figure 4-27: Fenelon Falls Simulated Wet Weather Flow under 2051 Proposed Scenario............ 110 Figure 4-28: Omemee Simulated Dry Weather Flow under 2051 Existing Buildout Scenario ...... 112
Project Number 10599 January 2025
Page | v
Technical Memorandum 6 Kawartha Lakes Water-Wastewater Master Plan Capacity Assessment
Figure 4-29: Omemee Simulated Wet Weather Flow under 2051 Existing Buildout Scenario..... 113 Figure 4-30: Omemee Simulated Dry Weather Flow under 2051 Proposed Scenario..................... 115 Figure 4-31: Omemee Simulated Wet Weather Flow under 2051 Proposed Scenario ................... 116
LIST OF TABLES Table 3-1: Watermain Roughness Factors............................................................................................................. 3 Table 3-2: City of Kawartha Lakes and MECP Design Flows Criteria ........................................................... 5 Table 3-3: City of Kawartha Lakes and MECP Water Supply System Pressures Design Criteria ....... 7 Table 4-1: Lindsay Sewage Pumping Stations....................................................................................................65 Table 4-2: Bobcaygeon Sewage Pumping Stations..........................................................................................66 Table 4-3: Fenelon Falls Sewage Pumping Stations.........................................................................................67 Table 4-4: Omemee Sewage Pumping Stations................................................................................................67 Table 4-5: Stations and Parameters used in the wastewater model calibration ...................................69 Table 4-6: Wastewater Design Criteria..................................................................................................................70 Table 4-7: Existing and Future Sanitary Flow Criteria ......................................................................................73 Table 4-8: Lindsay SPS Phased Flows ................................................................................................................. 117 Table 4-9: Bobcaygeon SPS Phased Flows ....................................................................................................... 118 Table 4-10: Fenelon Falls SPS Phased Flows.................................................................................................... 119 Table 4-11: Omemee SPS Phased Flows ........................................................................................................... 119
Project Number 10599 January 2025
Page | vi
Technical Memorandum 6 Kawartha Lakes Water-Wastewater Master Plan Capacity Assessment
1 INTRODUCTION T.Y. Lin International Canada (TYLin) has been contracted by the City of Kawartha Lakes for completion of a Water and Wastewater Master Plan Update. As part of this update, TYLin is responsible for updating the City’s existing water and wastewater hydraulic models for the three communities of Lindsay, Bobcaygeon and Fenelon Falls. In addition, a new water model was created for the Woodville community and a wastewater model for the Omemee community. This technical memorandum describes the process undertaken to update and build the hydraulic models for the Kawartha Lakes communities based on the available information. It also documents any of the assumptions made during this process.
Project Number 10599 January 2025
Page | 1
Technical Memorandum 6 Kawartha Lakes Water-Wastewater Master Plan Capacity Assessment
2 MODELLING BACKGROUND 2.1 Modelling Platforms The previous water and wastewater hydraulics models were built using Bentley SewerGEMs and WaterGEMs, respectively. SewerGEMs is an advanced engineering software for sanitary and combined sewer system analysis, design and operation. WaterGEMs is a water distribution system hydraulic modelling application. TYLin updated the models on the same modelling platforms to maintain consistency.
2.2 Communities Modelled The hydraulic models include modelling for five main communities: ► Lindsay ► Bobcaygeon ► Fenelon Falls ► Woodville (Water only) ► Omemee (Wastewater only).
2.3 Existing Population Loading/demand was developed on a parcel-by-parcel basis using the zoning and parcel shapefiles and unit counts provided. Zoning was used to identify and categorize parcels into appropriate categories based on design criteria.
Project Number 10599 January 2025
Page | 2
Technical Memorandum 6 Kawartha Lakes Water-Wastewater Master Plan Capacity Assessment
3 WATER MODELLING METHODOLOGY TYLin reviewed the provided existing models and updated the models based on the latest GIS data (Water_Storm_Sanitary_CKL_Layers_Export_April_2022) received from the City. The water hydraulic model network consists of pipes, junctions, reservoirs, tanks, pumping stations, and customer meters.
3.1 Pipe Networks TYLin updated the pipe networks to include the constructed new services and approved developments in the past five years. Pipe network for each community was isolated based on “Type” and “Status”. Only the following watermains were isolated and imported into the models: ► Type: Distribution (Nontreated), Distribution (Treated), and Trunk/Transmission ► Status: Active, Unassumed, Unconfirmed (Existence) Labels were updated to include the asset ID for ease of tracking. Apparent discrepancies were identified, and the zero diameter mains were assigned the diameter of the upstream or downstream pipes.
3.1.1 Junction Elevations Junctions were created based on the new pipe networks. Elevations were assigned to the junctions based on DEM developed from 5 m contour data (OpenData).
3.1.2 Pipe Roughness C-Factors The C values for pipes were assigned based on the City of Kawartha Lakes 2021 Infrastructure Guidelines as shown in Table 3-1. Table 3-1: Watermain Roughness Factors Pipe Diameter (mm)
C Factor
<150mm
100
200 – 300 mm
110
350 – 600 mm
120
>600mm
130
Project Number 10599 January 2025
Page | 3
Technical Memorandum 6 Kawartha Lakes Water-Wastewater Master Plan Capacity Assessment
3.2 Water Facilities The Operation and Maintenance (O&M) Manuals, record drawings, and operational set points (storages) for all the facilities were provided. The relevant information for each facility was extracted and inputted in the model. This extracted information was also summarized in a table for ease of tracking. The following sections describes details of each facility for each of the four communities.
3.2.1 Water Treatment Plants The water treatment plants were modelled as Reservoir element with a fixed hydraulic grade line (HGL) representing the hydraulic head.
3.2.2 Booster Pumping Stations The booster pumping stations were modelled based on the storage at each station and pump design points on record.
3.2.3 Elevated Tanks and Reservoirs The tank geometry was established as per the record information. Operating levels were provided by City Operations staff and/or in accordance with O&M manuals. In steady-state modelling, HGL assumptions in elevated tanks and reservoirs should be as follows: ► Average Day Demand (ADD): Bottom of Equalization Storage ► Max Day Demand (MDD): Bottom of Equalization Storage ► Peak Hour Demand (PHD): Bottom of Equalization Storage ► Minimum Hour Demand (MIN): Top of Equalization Storage ► Maximum Day plus Fire Flow (MDD+FF): Bottom of Fire Storage
3.3 Water Demands 3.3.1 Design Flows Criteria Water demand calculations for existing and future developments were based on the City of Kawartha Lakes Infrastructure Guidelines - 2021 Water, and MECP guidelines. Table 3-2 summarises the estimated average day demand for all types of land use and peaking factors under different scenarios.
Project Number 10599 January 2025
Page | 4
Technical Memorandum 6 Kawartha Lakes Water-Wastewater Master Plan Capacity Assessment
Table 3-2: City of Kawartha Lakes and MECP Design Flows Criteria Community
Zoning
Average Day Demand
Maximum Day Peaking Factor
Peak Hour Factor
Residential
450 Lpcd
1.9
2.85
Industrial, Commercial, Institutional (ICI)
0.4 L/s/ha
-
-
Residential
450 Lpcd
2.25
3.38
Industrial, Commercial, Institutional (ICI)
0.4 L/s/ha
-
-
Residential
450 Lpcd
2.0
3.0
Industrial, Commercial, Institutional (ICI)
0.4 L/s/ha
-
-
Residential
450 Lpcd
2.75
4.13
Industrial, Commercial, Institutional (ICI)
0.4 L/s/ha
-
-
Lindsay
Fenelon Falls
Bobcaygeon
Woodville
3.3.2 Nodal Demand Distribution The nodal demand was distributed based on land use and on a parcel-by-parcel basis. ► Parcels were assigned a number of units based on weighted densities developed for residential housing types ► ICI parcels were identified based on zoning and area was used for calculating demands ► Parcels were aggregated to the nearest node ► Model nodes were populated Project Number 10599 January 2025
Page | 5
Technical Memorandum 6 Kawartha Lakes Water-Wastewater Master Plan Capacity Assessment
For the residential lands, hydraulic model elements (nodes or pipes) were assigned to the closet customer meters. Customer meters were used to load water demands based on the number of units (persons). For the employment lands, the water demands were estimated based on the area of land and entered as a Base Demand. Figure 3-1: Residential Water Demands Allocation
3.3.1 Future Modelling Considerations When considering future water demands, the City shall review future development to ensure the tie-in connections aligns with the anticipated model tie-in connection. If not, the City shall review the impacts of an alternative tie-in connection to provide the levels of service as required by the MECP design guidelines and the required fire flows.
3.4 Water Hydraulic Analysis 3.4.1 Water System Pressures and Fire Flow Requirements The City of Kawartha Lakes Infrastructure Guidelines - 2021 Water, and MECP guidelines govern the basis of analysis and required levels of service of the existing and proposed water systems. Table 3-3 summarises the recommended operating pressures in the City’s water distribution system. The minimum required fire flow for single family, detached dwellings is 4,500 L/min (75 L/s).
Project Number 10599 January 2025
Page | 6
Technical Memorandum 6 Kawartha Lakes Water-Wastewater Master Plan Capacity Assessment
Table 3-3: City of Kawartha Lakes and MECP Water Supply System Pressures Design Criteria Parameter
System Pressure
Maximum Recommended Static Pressure
700 kPa (100 psi)
Minimum Pressure under Normal Operating Conditions
275 kPa (40 psi)
Minimum Pressure during Maximum Day and Fire Flow Demands
140 kPa (20 psi)
3.4.2 Demand Scenarios The model simulations are currently running as steady state for all scenarios in WaterGEMs. There are four main scenarios set up under existing condition: Average Day Demand (ADD), Maximum Day Demand (MDD), Peak Hour Demand (PHD), and Maximum Day Demand Plus Fire Flow (MDD+FF). The calculation type is set as Hydraulic only for all scenarios and Fire Flow for the “Maximum Day plus Fire Flow” scenario.
3.4.3 Water Hydraulic Modelling Results - Planning Scenarios This Technical Memorandum summarises the model results of the Baseline, 2031 Phased Growth, 2041 Phased Growth, 2051 Existing Network and 2051 Proposed Upgrades planning scenarios.
3.4.4 Lindsay Modelling Results 3.4.4.1 Baseline Scenario The baseline scenario was modelled with the existing infrastructure and water demands. Figure 3-2 shows that the available fire flow in Lindsay under existing conditions exceeds 200 L/s in most areas, with the exception of the dead ends. Figure 3-3 indicates that simulated pressures in Lindsay under existing conditions range from 345 kPa (50 psi) to 620 kPa (90 psi) in most areas, while pressures in the southwestern area fall below the recommended minimum of 275 kPa (40 psi).
Project Number 10599 January 2025
Page | 7
Technical Memorandum 6 Kawartha Lakes Water-Wastewater Master Plan Capacity Assessment
Figure 3-2: Lindsay Available Fire Flow under Baseline MDD+FF Scenario
Project Number 10599 January 2025
Page | 8
Technical Memorandum 6 Kawartha Lakes Water-Wastewater Master Plan Capacity Assessment
Figure 3-3: Lindsay Peak Hour Demand Scenario
Project Number 10599 January 2025
Page | 9
Technical Memorandum 6 Kawartha Lakes Water-Wastewater Master Plan Capacity Assessment
3.4.4.2 2031 Scenario A 2031 Scenario was modelled with the future water demands based on the planning information intended to come in service by 2031. The 2031 phased growth of 6,101 residential units and 21.7 ha of commercial lands will result in an additional water demand of 83 L/s under Average Day Demand condition. The 2031 water system constraints were identified through modelling based on the existing network and the additional water demands for 2031. Proposed upgrades for 2031 to address the constraints are documented in Technical Memorandum 8 Capital Implementation Plan. In order to address the low-pressure issue in the southwestern area of Lindsay, the valves south of Kent St W and west of Angeline St S were set to be closed. The location of the valve closures is shown in Figure 3-4. By closing these valves, the lowpressure area was isolated from the high-elevation area and no longer affected by the hydraulic influence of the high elevation. Figure 3-4: Location of Valve Closure
Project Number 10599 January 2025
Page |1
Technical Memorandum 6 Kawartha Lakes Water-Wastewater Master Plan Capacity Assessment
Figure 3-5 and Figure 3-6 show the modelled results with the 2031 additional demands and proposed upgrades. It can be observed that the low pressures were significantly improved with the proposed upgrades and valve closure. The available fire flow range between 150 L/s and 200 L/s in most areas, while the neighbourhood west of the Broad Street Park shows slightly lower available fire flow ranging from 75 L/s to 150 L/s due to the valve closure on Broad St. Except for the Ross Memorial Hospital area (Kent St and Angeline St), the simulated pressures and available fire flow are within the acceptable range.
Project Number 10599 January 2025
Page | 11
Technical Memorandum 6 Kawartha Lakes Water-Wastewater Master Plan Capacity Assessment
Figure 3-5: Lindsay Simulated Available Fire Flow with 2031 Proposed Network under MDD+FF Scenario
Project Number 10599 January 2025
Page | 12
Technical Memorandum 6 Kawartha Lakes Water-Wastewater Master Plan Capacity Assessment
Figure 3-6: Lindsay Simulated Pressures with 2031 Proposed Network under PHD Scenario
Project Number 10599 January 2025
Page | 13
Technical Memorandum 6 Kawartha Lakes Water-Wastewater Master Plan Capacity Assessment
3.4.4.3 2041 Scenario A 2041 Scenario was modelled with the future water demands based on the planning information intended to come in service by 2041. The 2041 phased growth of 5,120 residential units and 137 ha of commercial lands will result in a water demand of 66 L/s under Average Day Demand condition. The 2041 water system constraints were identified through modelling based on the 2031 upgrades and the additional water demands for 2041. Proposed upgrades for 2041 to address the constraints were documented in Technical Memorandum 8 – Capital Implementation Plan. Figure 3-7, Figure 3-8, Figure 3-9 shows that the simulated pressures near the Ross Memorial Hospital have improved with the watermain upgrades along Angeline Street. Figure 3-8 shows that the available fire flow ranges between 150 L/s and 200 L/s in most areas, except for the dead-end nodes.
Project Number 10599 January 2025
Page | 14
Technical Memorandum 6 Kawartha Lakes Water-Wastewater Master Plan Capacity Assessment
Figure 3-7: Lindsay Simulated Available Fire Flow with 2041 Proposed Network under MDD+FF Scenario
Project Number 10599 January 2025
Page | 15
Technical Memorandum 6 Kawartha Lakes Water-Wastewater Master Plan Capacity Assessment
Figure 3-8: Lindsay Simulated Pressures with 2041 Proposed Network under PHD Scenario
Project Number 10599 January 2025
Page | 16
Technical Memorandum 6 Kawartha Lakes Water-Wastewater Master Plan Capacity Assessment
3.4.4.4 2051 Existing Network Scenario A 2051 Scenario was modelled with the future water demands based on the planning information intended to come in service by 2051. The 2051 phased growth of 12,280 residential units and 1.6 ha of commercial lands will result in a water demand of 149 L/s under Average Day Demand condition. The 2051 water system constraints were identified through modelling based on the 2041 upgrades and the additional water demands for 2051 Figure 3-9 and Figure 3-10 show the existing water system constraints with the 2051 additional demands. It can be observed that the system will experience critical low-pressure issue without upgrades.
Project Number 10599 January 2025
Page | 17
Technical Memorandum 6 Kawartha Lakes Water-Wastewater Master Plan Capacity Assessment
Figure 3-9: Lindsay Simulated Available Fire Flow with 2051 Existing Network under MDD+FF Scenario
Project Number 10599 January 2025
Page | 18
Technical Memorandum 6 Kawartha Lakes Water-Wastewater Master Plan Capacity Assessment
Figure 3-10: Lindsay Simulated Pressures with 2051 Existing Network PHD Scenario
Project Number 10599 January 2025
Page | 19
Technical Memorandum 6 Kawartha Lakes Water-Wastewater Master Plan Capacity Assessment
3.4.4.5 2051 Proposed Upgrades Scenario This scenario included the water demands for the proposed developments and incorporated all the 2051 proposed upgrades to the infrastructure into the model network. Proposed upgrades for 2051 to address the constraints were documented in Technical Memorandum 8 - Capital Implementation Plan. Figure 3-11 and Figure 3-12 show the modelled results with the 2051 additional demands and proposed upgrades. With the watermain upgrades along Verulam Rd and proposed watermain loop connecting Walsh Road and Dobson Street, the simulated pressures range from 345 kPa (50 psi) to 620 kPa (90 psi) in most areas. The pressures in southwestern area and Flato lands are lower, ranging from 283 kPa (41 psi) to 345 kPa (50 psi). The available fire flow varies between 100 L/s to 200 L/s in most areas.
Project Number 10599 January 2025
Page | 20
Technical Memorandum 6 Kawartha Lakes Water-Wastewater Master Plan Capacity Assessment
Figure 3-11: Lindsay Simulated Available Fire Flow with 2051 Existing Network under MDD+FF Scenario
Project Number 10599 January 2025
Page | 21
Technical Memorandum 6 Kawartha Lakes Water-Wastewater Master Plan Capacity Assessment
Figure 3-12: Lindsay Simulated Pressures with 2051 Existing Network PHD Scenario
Project Number 10599 January 2025
Page | 22
Technical Memorandum 6 Kawartha Lakes Water-Wastewater Master Plan Capacity Assessment
3.4.5 Bobcaygeon Modelling Results 3.4.5.1 Baseline Scenario The baseline scenario was modelled with the existing infrastructure and water demands. Figure 3-13 shows that Bobcaygeon has the fire flow deficiency issue under existing condition except for the central area. Figure 3-14 indicates that simulated pressures in Bobcaygeon under existing conditions range from 345 kPa (50 psi) to 620 kPa (90 psi).
Project Number 10599 January 2025
Page | 23
Technical Memorandum 6 Kawartha Lakes Water-Wastewater Master Plan Capacity Assessment
Figure 3-13: Bobcaygeon Simulated Available Fire Flow under Baseline MDD+FF Scenario
Project Number 10599 January 2025
Page | 24
Technical Memorandum 6 Kawartha Lakes Water-Wastewater Master Plan Capacity Assessment
Figure 3-14: Bobcaygeon Simulated Pressures under Baseline PHD Scenario
Project Number 10599 January 2025
Page | 25
Technical Memorandum 6 Kawartha Lakes Water-Wastewater Master Plan Capacity Assessment
3.4.5.2 2031 Scenario A 2031 Scenario was modelled with the future water demands based on the planning information intended to come in service by 2031. The 2031 phased growth of 532 residential units and 2.2 ha of commercial lands will result in an additional water demand of 12 L/s under Average Day Demand condition. The 2031 water system constraints were identified through modelling based on the existing network and the additional water demands for 2031. Proposed upgrades for 2031 to address the constraints were documented in Technical Memorandum 8 Capital Implementation Plan. Figure 3-15 shows that available fire flow in the northwest area and southeast area has significantly improved with the watermain upgrades north of North St and along Canal Street. Figure 3-16 indicates the good pressure condition with the additional demands under 2031 scenario.
Project Number 10599 January 2025
Page | 26
Technical Memorandum 6 Kawartha Lakes Water-Wastewater Master Plan Capacity Assessment
Figure 3-15: Bobcaygeon Simulated Available Fire Flow with 2031 Proposed Network under MDD+FF Scenario
Project Number 10599 January 2025
Page | 27
Technical Memorandum 6 Kawartha Lakes Water-Wastewater Master Plan Capacity Assessment
Figure 3-16: Bobcaygeon Simulated Pressures with 2031 Proposed Network under PHD Scenario
Project Number 10599 January 2025
Page | 28
Technical Memorandum 6 Kawartha Lakes Water-Wastewater Master Plan Capacity Assessment
3.4.5.3 2041 Scenario A 2041 Scenario was modelled with the future water demands based on the planning information intended to come in service by 2041. The 2041 phased growth of 744 residential units will result in an additional water demand of 8.9 L/s under Average Day Demand condition. The 2041 water system constraints were identified through modelling based on the existing network and the additional water demands for 2041. Proposed upgrades for 2041 to address the constraints were documented in Technical Memorandum 8 - Capital Implementation Plan. Figure 3-17 shows that the fire flow availability has improved in the southwest area has improved to 75 L/s to 100 L/s with the watermain upgrades along Park Street. Figure 3-18 indicates that the modelled pressures range from 345 kPa (50 psi) to 620 kPa (90 psi) results with the 2041 additional demands.
Project Number 10599 January 2025
Page | 29
Technical Memorandum 6 Kawartha Lakes Water-Wastewater Master Plan Capacity Assessment
Figure 3-17: Bobcaygeon Simulated Available Fire Flow with 2041 Proposed Network under MDD+FF Scenario
Project Number 10599 January 2025
Page | 30
Technical Memorandum 6 Kawartha Lakes Water-Wastewater Master Plan Capacity Assessment
Figure 3-18: Bobcaygeon Simulated Pressures with 2041 Proposed Network under PHD Scenario
Project Number 10599 January 2025
Page | 31
Technical Memorandum 6 Kawartha Lakes Water-Wastewater Master Plan Capacity Assessment
3.4.5.4 2051 Existing Network Scenario A 2051 Existing Network Scenario was modelled for the proposed 2051 developments were added to the 2051 Existing Network Scenario. The 2051 phased growth of 951 residential units and 18ha of commercial lands will result in a water demand of 18.7 L/s under Average Day Demand condition. The 2051 water system constraints were identified through modelling based on the 2041 upgrades and the additional water demands for 2051. It can be observed that Bobcaygeon is expected to experience a severe fire flow shortage with the 2051 additional under the existing water infrastructure. Figure 3-19 and Figure 3-20 show the modelled results with the 2051 additional demands and existing network. It can be observed that Bobcaygeon is expected to experience a severe fire flow shortage with the 2051 additional under the existing water infrastructure.
Project Number 10599 January 2025
Page | 32
Technical Memorandum 6 Kawartha Lakes Water-Wastewater Master Plan Capacity Assessment
Figure 3-19: Bobcaygeon Simulated Available Fire Flow with 2051 Existing Network under MDD+FF Scenario
Project Number 10599 January 2025
Page | 33
Technical Memorandum 6 Kawartha Lakes Water-Wastewater Master Plan Capacity Assessment
Figure 3-20: Bobcaygeon Simulated Pressures with 2051 Existing Network under PHD Scenario
Project Number 10599 January 2025
Page | 34
Technical Memorandum 6 Kawartha Lakes Water-Wastewater Master Plan Capacity Assessment
3.4.5.5 2051 Proposed Upgrades Scenario This scenario included the water demands for the proposed developments and incorporated all the 2051 proposed upgrades to the infrastructure into the model network. Proposed upgrades for 2051 to address the constraints were documented in Technical Memorandum 8 - Capital Implementation Plan. and Figure 3-22 show the modelled results with the 2051 additional demands and proposed upgrades. It can be observed that the improved available fire flow range from 100 L/s to 200 L/s in most areas.
Project Number 10599 January 2025
Page | 35
Technical Memorandum 6 Kawartha Lakes Water-Wastewater Master Plan Capacity Assessment
Figure 3-21: Bobcaygeon Simulated Available Fire Flow with Proposed 2051 Network under MDD+FF Scenario
Project Number 10599 January 2025
Page | 36
Technical Memorandum 6 Kawartha Lakes Water-Wastewater Master Plan Capacity Assessment
Figure 3-22: Bobcaygeon Simulated Pressures with Proposed 2051 Network under PHD Scenario
Project Number 10599 January 2025
Page | 37
Technical Memorandum 6 Kawartha Lakes Water-Wastewater Master Plan Capacity Assessment
3.4.6 Fenelon Falls Modelling Results 3.4.6.1 Baseline Scenario The baseline scenario was modelled with the existing infrastructure and water demands. Figure 3-23 shows that the available fire flow in Fenelon Falls under existing conditions exceeds 75 L/s in most areas, with the exception of the dead ends. Figure 3-24 indicates that simulated pressures in Lindsay under existing conditions range from 345 kPa (50 psi) to 620 kPa (90 psi) in most areas, while pressures in the northeastern area are slightly in a lower range between 275 kPa (40 psi) to 345 kPa (50 psi).
Project Number 10599 January 2025
Page | 38
Technical Memorandum 6 Kawartha Lakes Water-Wastewater Master Plan Capacity Assessment
Figure 3-23: Fenelon Falls Available Fire Flow under Baseline MDD+FF Scenario
Project Number 10599 January 2025
Page | 39
Technical Memorandum 6 Kawartha Lakes Water-Wastewater Master Plan Capacity Assessment
Figure 3-24: Fenelon Falls Simulated Pressures under Baseline PHD Scenario
Project Number 10599 January 2025
Page | 40
Technical Memorandum 6 Kawartha Lakes Water-Wastewater Master Plan Capacity Assessment
3.4.6.2 2031 Scenario A 2031 Scenario was modelled with the future water demands based on the planning information intended to come in service by 2031. The 2031 phased growth of 456 residential units will result in an additional water demand of 5.46 L/s under Average Day Demand condition. The 2031 water system constraints were identified through modelling based on the existing network and the additional water demands for 2031. Proposed upgrades for 2031 to address the constraints were documented in Technical Memorandum 8 - Capital Implementation Plan. Figure 3-27 and Figure 3-26 show the modelled results with the 2031 additional demands and proposed upgrades. It can be observed that the pressures along Short Street has improved with the proposed Loop connecting Francis Street E.
Project Number 10599 January 2025
Page | 41
Technical Memorandum 6 Kawartha Lakes Water-Wastewater Master Plan Capacity Assessment
Figure 3-25: Fenelon Falls Simulated Available Fire Flow with 2031 Proposed Network under MDD+FF Scenario
Project Number 10599 January 2025
Page | 42
Technical Memorandum 6 Kawartha Lakes Water-Wastewater Master Plan Capacity Assessment
Figure 3-26: Fenelon Falls Simulated Pressures with 2031 Proposed Network under PHD Scenario
Project Number 10599 January 2025
Page | 43
Technical Memorandum 6 Kawartha Lakes Water-Wastewater Master Plan Capacity Assessment
3.4.6.3 2041 Scenario A 2041 Scenario was modelled with the future water demands based on the planning information intended to come in service by 2031. The 2041 phased growth of 793 residential units will result in an additional water demand of 9.2 L/s under Average Day Demand condition. The 2041 water system constraints were identified through modelling based on the existing network and the additional water demands for 2041. Proposed upgrades for 2041 to address the constraints were documented in Technical Memorandum 8 - Capital Implementation Plan Figure 3-29 and Figure 3-30 show the modelled results with the 2041 additional demands and proposed upgrades. It can be observed that the available fire flow has significantly improved
Project Number 10599 January 2025
Page | 44
Technical Memorandum 6 Kawartha Lakes Water-Wastewater Master Plan Capacity Assessment
Figure 3-27: Fenelon Falls Simulated Available Fire Flow with 2041 Proposed Network under MDD+FF Scenario
Project Number 10599 January 2025
Page | 45
Technical Memorandum 6 Kawartha Lakes Water-Wastewater Master Plan Capacity Assessment
Figure 3-28: Fenelon Falls Simulated Pressures with 2041 Proposed Network under PHD Scenario
Project Number 10599 January 2025
Page | 46
Technical Memorandum 6 Kawartha Lakes Water-Wastewater Master Plan Capacity Assessment
3.4.6.4 2051 Existing Network Scenario A 2051 Existing Network Scenario was modelled for the proposed 2051 developments were added to the 2051 Existing Network Scenario. The 2051 phased growth of 249 residential units will result in a water demand of 3.0 L/s under Average Day Demand condition. The 2051 water system constraints were identified through modelling based on the 2041 upgrades and the additional water demands for 2051. Figure 3-29 shows that the available fire flow drops below the required fire flow of 75 L/s in the southeast area and along the Short Street with the additional 2051 demands. Figure 3-30 indicates the low pressure along Short Street under existing network.
Project Number 10599 January 2025
Page | 47
Technical Memorandum 6 Kawartha Lakes Water-Wastewater Master Plan Capacity Assessment
Figure 3-29: Fenelon Falls Simulated Available Fire Flow with 2051 Existing Network under MDD+FF Scenario
Project Number 10599 January 2025
Page | 48
Technical Memorandum 6 Kawartha Lakes Water-Wastewater Master Plan Capacity Assessment
Figure 3-30: Fenelon Falls Simulated Pressures with 2051 Existing Network PHD Scenario
Project Number 10599 January 2025
Page | 49
Technical Memorandum 6 Kawartha Lakes Water-Wastewater Master Plan Capacity Assessment
3.4.6.5 2051 Proposed Upgrades Scenario This scenario included the water demands for the proposed developments and incorporated all the 2051 proposed upgrades to the infrastructure into the model network. Proposed upgrades for 2051 to address the constraints were documented in Technical Memorandum 8 - Capital Implementation Plan. Figure 3-31 and Figure 3-32 show the modelled results with the 2051 additional demands and proposed upgrades. The available fire flow ranges from 100 L/s to 150 L/s in most areas except for the dead ends. The simulated pressures range from 345 kPa (50 psi) to 689 kPa (100 psi) with the proposed upgrades .
Project Number 10599 January 2025
Page | 50
Technical Memorandum 6 Kawartha Lakes Water-Wastewater Master Plan Capacity Assessment
Figure 3-31: Fenelon Falls Simulated Available Fire Flow with Proposed 2051 Network under MDD+FF Scenario
Project Number 10599 January 2025
Page | 51
Technical Memorandum 6 Kawartha Lakes Water-Wastewater Master Plan Capacity Assessment
Figure 3-32: Fenelon Falls Simulated Pressures with Proposed 2051 Network under PHD Scenario
Project Number 10599 January 2025
Page | 52
Technical Memorandum 6 Kawartha Lakes Water-Wastewater Master Plan Capacity Assessment
3.4.7 Woodville Modelling Results 3.4.7.1 Baseline Scenario The baseline scenario was modelled with the existing infrastructure and water demands. Figure 3-33 shows that Woodville has the fire flow deficiency issue under existing condition in most areas. Figure 3-34 indicates that simulated pressures in Woodville under existing conditions are about 345 kPa (50 psi) in most areas.
Project Number 10599 January 2025
Page | 53
Technical Memorandum 6 Kawartha Lakes Water-Wastewater Master Plan Capacity Assessment
Figure 3-33: Woodville Simulated Available Fire Flow under Baseline MDD+FF Scenario
Project Number 10599 January 2025
Page | 54
Technical Memorandum 6 Kawartha Lakes Water-Wastewater Master Plan Capacity Assessment
Figure 3-34: Woodville Simulated Pressures under Baseline PHD Scenario
Project Number 10599 January 2025
Page | 55
Technical Memorandum 6 Kawartha Lakes Water-Wastewater Master Plan Capacity Assessment
3.4.7.2 2051 Existing Network Scenario A 2051 Existing Network Scenario was modelled for the proposed 2051 developments were added to the 2051 Existing Network Scenario. Figure 3-34 and Figure 3-35 show the modelled available fire flow and pressures with the additional demands under the existing network. It can be noticed that the available fire flow is under the minimum fire flow requirement of 75 L/s in most areas.
Project Number 10599 January 2025
Page | 56
Technical Memorandum 6 Kawartha Lakes Water-Wastewater Master Plan Capacity Assessment
Figure 3-35: Woodville Simulated Available Fire Flow with 2051 Existing Network under MDD+FF Scenario
Project Number 10599 January 2025
Page | 57
Technical Memorandum 6 Kawartha Lakes Water-Wastewater Master Plan Capacity Assessment
Figure 3-36: Woodville Simulated Pressures with 2051 Existing Network PHD Scenario
Project Number 10599 January 2025
Page | 58
Technical Memorandum 6 Kawartha Lakes Water-Wastewater Master Plan Capacity Assessment
3.4.7.3 2051 Proposed Upgrades Scenario This scenario included the water demands for the proposed developments and incorporated all the 2051 proposed upgrades to the infrastructure into the model network. Figure 3-36 and Figure 3-37 show that the available fire flow and pressures are within the acceptable range with the proposed watermain loops.
Project Number 10599 January 2025
Page | 59
Technical Memorandum 6 Kawartha Lakes Water-Wastewater Master Plan Capacity Assessment
Figure 3-37: Woodville Simulated Available Fire Flow with 2051 Existing Network under MDD+FF Scenario
Project Number 10599 January 2025
Page | 60
Technical Memorandum 6 Kawartha Lakes Water-Wastewater Master Plan Capacity Assessment
Figure 3-38: Woodville Simulated Pressures with 2051 Existing Network PHD Scenario
Project Number 10599 January 2025
Page | 61
Technical Memorandum 6 Kawartha Lakes Water-Wastewater Master Plan Capacity Assessment
4 WASTEWATER MODELLING METHODOLOGY 4.1 Pipe Networks The pipe network consists of interconnected pipes, manholes, wet wells, pumping stations, outfalls, and other components that transport wastewater. TYLin reviewed an existing wastewater model provided by the City and conducted QA/QC. The model was then updated using the most recent GIS data and record drawings from the City. During this process, discrepancies were identified, and data gaps were filled, with assumptions made where necessary to resolve missing information.
4.1.1 Pipe Roughness Factor A Manning’s Roughness Coefficient of 0.013 was assigned to all sewer pipe elements, based on the City of Kawartha Lakes 2021 Infrastructure Guidelines. The pipe material for the network was assigned based on the City's provided data, including materials such as PVC, concrete, vitreous clay, and others. This data is essential as it impacts the hydraulic performance of the sewer system. Next, the appropriate roughness factor (Manning’s n value) was determined, as it influences flow resistance. A higher n value indicates greater resistance, while a lower value suggests smoother pipes. To ensure accuracy, SewerGEMS’ builtin data library was used to automatically assign the correct roughness factor based on the pipe material.
4.2 Lindsay Updates 4.2.1 Downtown Trunk Sewer Design drawings were received from the City to update the Downtown Trunk Sewer in Lindsay. Following that, a section of the trunk sewer along St. Davis St, between Simpson St and Lagoon St, has been revised from a 700 mm diameter to 675 mm.
4.2.2 New Sewage Pumping Stations Rivera SPS and Fairground SPS were added to the model, and the design curves were used for its pumps. The model incorporates nine Sewage Pumping Stations (SPS), including Rivera SPS and Fairground SPS.
Project Number 10599 January 2025
Page | 62
Technical Memorandum 6 Kawartha Lakes Water-Wastewater Master Plan Capacity Assessment
The Wellington SPS has very limited capacity and is not visually represented in the model; however, the flow contribution from this station has been included to ensure an accurate system analysis. Pump characteristics, such as performance curves and operational parameters, were defined using data from the ECA report, which provided detailed specifications for each pump’s operation, including flow rates and head conditions, ensuring the model accurately reflects their behavior in the system.
4.3 Facilities 4.3.1 Wastewater Treatment Plants The influent hydraulics of the water treatment plant are modeled by simulating the raw water entering the facility. This includes modeling flow rates, hydraulic conditions at the influent points (such as pipes and manholes), and flow variations. Both Dry Weather Flow (DWF) and Wet Weather Flow (WWF) scenarios were simulated to capture flow fluctuations, as well as peak flows.
4.3.2 Sewage Pumping Stations Sewage pumping stations are modeled using an Extended Period Simulation (EPS), where the on/off values are updated based on the information received. Each pump is assigned a specific Pump Definition. The Pump Definition for each pump was derived from ECA documentation provided by the City. It is understood that these pump curves are based on design capacity rather than field inspections. Each pump was then assigned to its corresponding Pump Station to create a Combination Pump. An example of this process is illustrated below for the Mary Street SPS in Lindsay:
Project Number 10599 January 2025
Page | 63
Technical Memorandum 6 Kawartha Lakes Water-Wastewater Master Plan Capacity Assessment
Figure 4-1: Sample Pump Curve (Mary Street SPS)
Project Number 10599 January 2025
Page | 64
Technical Memorandum 6 Kawartha Lakes Water-Wastewater Master Plan Capacity Assessment
Table 4-1: Lindsay Sewage Pumping Stations Facility
# of Pumps
Total Capacity [L/s]
Firm Capacity [L/s]
Source
Fairground SPS
2
36
18
2003 ECA
Jennings Creek SPS
3
825
550
Lindsay Street North SPS
3
600
400
2015 - Lindsay Capacity Report
2011 ECA
Logie Street SPS
2
138.2
69.1
2008 - AS PER MOE CERTIFICATE OF APPROVAL FROM LOGIE ST. FILE
Mary Street SPS
2
40
20
2021 - MTE Report
Ridout Street SPS
3
540
360
Rivera Park SPS
3
984
732
2017 ECA
Riverview Estates SPS
2
16.8
8.4
As received model
2002 ECA
Note: The Wellington St SPS is not listed; please refer to section 4.1.2.2 for further details.
Project Number 10599 January 2025
Page | 65
Technical Memorandum 6 Kawartha Lakes Water-Wastewater Master Plan Capacity Assessment
Table 4-2: Bobcaygeon Sewage Pumping Stations Facility
# of Pumps
Total Capacity [L/s]
Firm Capacity [L/s]
Source
Canal St. E SPS
3
53.4
35.6
ECA Report
Lance Street SPS
2
27.8
13.9
ECA Report
Bolton Street SPS
2
13.4
6.7
Main St SPS
2
12.6
6.3
Front Street W SPS
2
27.8
13.9
Anne Street SPS
3
91.5
61
Navigators Trail and Island Bay Drive SPS
ECA Report ECA Report ECA Report ECA Report ECA Report
3
84
42
Navigators Trail SPS (by Patricia Place)
2
37.8
18.9
Mill Street SPS
2
37.8
18.9
Little Bob Drive SPS
2
30
15
Riverside Drive SPS
2
28.2
14.1
ECA Report
Project Number 10599 January 2025
ECA Report ECA Report ECA Report
Page | 66
Technical Memorandum 6 Kawartha Lakes Water-Wastewater Master Plan Capacity Assessment
Table 4-3: Fenelon Falls Sewage Pumping Stations Facility
# of Pumps
Total Capacity [L/s]
Firm Capacity [L/s]
Colbourne St SPS
2
100
50
Ellice St SPS
3
180
120
ECA Report
Francis St SPS
2
12.4
6.2
ECA Report
Source ECA Report
Table 4-4: Omemee Sewage Pumping Stations Facility
# of Pumps
Total Capacity [L/s]
Firm Capacity [L/s]
Source
Church St SPS
2
90
45
ECA Report
Sturgeon St SPS
3
176
88
ECA Report
4.4 Wastewater Loads 4.4.1 Model Calibration The existing condition model was calibrated for both DWF and WWF. The DWF generation rates were calculated using the measured flows during dry days. The model calculated the flow for each contributing property based on the residential population and the flow generation rate and routed the flow downstream through the sewer network. The wet-weather flow response for the flow monitors was reviewed and analyzed to estimate the peak I/I rate during each captured storm. The projected 1:25 I/I rate was used for the WWF component. For more information about the flow monitoring analysis, please refer to TM 3 of the Master Plan. Calibration was first carried out at the upstream monitoring locations, then progressively to downstream locations considering accumulated flows from the upstream catchment areas. A contributing area is considered calibrated when the peak flow, volume and shape of the hydrograph have met the following WaPUG (Wastewater Planning Users Group) criteria: ► Non-instantaneous peak flow matches within -15% to +25%; ► Volume matches within -10% to +20%; and
Project Number 10599 January 2025
Page | 67
Technical Memorandum 6 Kawartha Lakes Water-Wastewater Master Plan Capacity Assessment
► The modelled hydrograph resembles the shape of the observed hydrograph for the duration of the event. 4.4.1.1 Rainfall and Flow Monitoring Data Flow monitoring data was collected over a nine-month span from January 2023 to October 2023. Additionally, data from a previous flow monitoring program conducted in Lindsay from November 2021 to November 2022 was incorporated into the calibration. In total, thirty-seven (37) flow monitoring stations were analyzed across Lindsay, Fenelon Falls, and Bobcaygeon. Rainfall data analysis utilized nine (9) rain gauges distributed as follows: Lindsay had 5 gauges, Fenelon Falls and Bobcaygeon each had 2 gauges. For more information about the flow monitoring analysis, please refer to TM-3 of the Master Plan. 4.4.1.2 Historical Model Calibration The City's original model was not calibrated, and the received models were provided as steadystate models for the three areas: Lindsay, Bobcaygeon, and Fenelon Falls. These models were then converted to Extended Period Simulation (EPS), a more effective approach for analyzing hydraulic capacity over time by accounting for fluctuations and changes in flow conditions. 4.4.1.3 Dry Weather Flow Calibration The DWF generation rates were calculated using measured flows during dry days. The model determines the flow for each contributing catchment by considering the residential population and the corresponding flow generation rate, then routes the flow downstream through the sewer network. DWF was calibrated for each station by averaging the measured DWF during the flow monitoring periods. Periods with missing data or instances where the data quality was insufficient were excluded from the calibration process. 4.4.1.4 Wet-Weather Flow Rainfall-Derived Inflow and Infiltration (I/I) refers to water entering the sanitary system from external sources during storm events. The projected I/I was determined based on rates observed during the flow monitoring period, and details of the specific I/I rate utilized can be found in TM3. 4.4.1.5 Wastewater Planning Users Group (WaPUG) Criteria Observed vs. Predicted plots and goodness-of-fit metrics (including peak flow and volume) were documented and compared to assess model accuracy. The generation rate parameters were then adjusted to align with the Wastewater Planning Users Group (WaPUG) criteria, ensuring that the model’s predictions met the required standards for hydraulic and flow analysis. Project Number 10599 January 2025
Page | 68
Technical Memorandum 6 Kawartha Lakes Water-Wastewater Master Plan Capacity Assessment
► Non-instantaneous peak flow matches within -15% to 25%; ► Volume matches within -10% to +20%; ► The modelled hydrograph’s shape should closely resemble the shape of the observed hydrograph for the duration of the event Table presents the calibrated Dry Weather Flow (DWF) rates and Inflow/Infiltration (I/I) rates for each station and community. This table offers detailed insights into the flow characteristics at various monitoring stations and within different communities, which are essential for assessing the hydraulic performance and conducting capacity analysis of the sewer system. Table 4-5: Stations and Parameters used in the wastewater model calibration Community
Flow monitoring ID
DWF Rate (L/c/d)
I/I Rate (L/ha/d)
Lindsay
1-1
775
1.84
1-2
750
0.26
2-2
600
1.12
2-3
176
0.74
4-1
333
2.39
5-1a
615
1.70
5-2
600
0.56
6-1
685
1.81
6-2
333
0.57
L1
280
0.44
L2
300
0.82
L3
250
0.79
L4
236
1.12
L5
590
0.19
L6
807
1.44
L7
162
0.18
L8
745
0.39
B-2
486
0.85
B-4
380
0.13
B-5
1023
0.64
Project Number 10599 January 2025
Page | 69
Bobcaygeon
Technical Memorandum 6 Kawartha Lakes Water-Wastewater Master Plan Capacity Assessment
B-6
50
0.97
B-8
164
0.15
B-9
150
0.12
B-10
240
0.17
F1
305
0.52
F2
460
0.73
F3
330
0.48
Fenelon Falls
Note: In Lindsay, 17 out of the 27 flow monitoring stations were selected for model calibration. The selection criteria were based on the total catchment area and/or the location of flow meters upstream of sanitary pump stations to ensure accurate existing flow readings.
4.4.2 Design Criteria Sanitary loads for unmonitored areas and future developments were assigned based on the City of Kawartha Lakes 2021 Infrastructure Guidelines as summarized in Table 4-6. Table 4-6: Wastewater Design Criteria Parameter
Peak Design Flow
Residential
450 L/capita/day
Commercial/Industrial
0.40 L/s/ha
Schools and Institutions
0.32 L/s/ha
4.4.3 Wastewater Nodal Distribution The nodal was distributed based on land use and on a parcel-by-parcel basis and unit basis. ► Parcels were assigned a number of units based on weighted densities developed for residential housing types ► ICI parcels were identified based on zoning and area was used for calculating sanitary generation loads ► Parcels were aggregated to the nearest node/conduit ► Model nodes/conduits were populated Model sanitary loads were assigned to the following fields ► Input as “Property connections”, which includes: ► Sanitary Unit Loads Project Number 10599 January 2025
Page | 70
Technical Memorandum 6 Kawartha Lakes Water-Wastewater Master Plan Capacity Assessment
► Loading unit count (Population) ► Unit Sanitary Load: Generation rate as per the calibration process and a respective sanitary pattern was assigned per catchment area. Figure 4-2: Sanitary Loads Distributions
Project Number 10599 January 2025
Page | 71
Technical Memorandum 6 Kawartha Lakes Water-Wastewater Master Plan Capacity Assessment
Figure 4-3: Example of A Sanitary Pattern
For the existing conditions, the model is built on measured flow data, which serves as the baseline for calibration. This ensures that the model accurately represents the current system's behavior. For existing developments, the model incorporates measured per capita DWF, which reflects the typical flow during dry periods, sanitary patterns and peaking factors. For unmonitored areas, where direct measurement data is unavailable, the model relies on theoretical per capita DWF and Inflow/Infiltration (I/I) rates, which are defined according to the City’s design criteria. The I/I rate is calculated by considering the area of each parcel, as this directly impacts the amount of water entering the system due to infiltration or inflow. These I/I values are incorporated into the model as baseflow, which is represented through inflow profiles. To account for future developments, the baseline model is forced with the proposed development data to simulate how flow would change due to anticipated population growth or changes in land Project Number 10599 January 2025
Page | 72
Technical Memorandum 6 Kawartha Lakes Water-Wastewater Master Plan Capacity Assessment
use. The Harmon Peaking Factor, a widely accepted method for adjusting flow data based on population size, is used to determine the peak flow values. This factor helps adjust for the increased flow during peak demand periods in areas with higher population densities. The Harmon Peaking Factor is assigned based on the total population in the area, ensuring that the model accounts for expected population growth and corresponding increases in flow demands over time. This comprehensive approach allows the model to accurately represent both current and future conditions, ensuring the sewer system is designed to handle both present-day usage and future growth. Table 4-7: Existing and Future Sanitary Flow Criteria Development Condition Existing (at the time of flow monitoring, i.e., 2022/2023)
Approved and Future Residential Developments Commercial and Industrial Developments
Per Capita DWF
Peaking Factor
Peak I/I Rate
Measured Flow Monitoring Results
Measured
I/I projection based on flow monitoring results.
450 L/c/d
Harmon Peaking Factor
0.26 L/s/ha
0.40 L/sec./ha
1.0
0.26 L/s/ha
Generation Rates
4.4.4 Future Modelling Considerations When considering future sanitary flows, the City shall review future development to ensure the tie-in connections aligns with the model tie-in connection. If not, the City shall review the impacts of an alternative tie-in connection to assess the level of service of the downstream collection system.
4.5 Sanitary Sewer Capacity Analysis Methodology 4.5.1 Level of Service In this study, acceptable levels of service are defined to ensure that the sewer system functions efficiently and does not face undue pressure under different flow conditions. ► Free flow under Dry-Weather Flow (DWF): This condition refers to the ideal operating scenario during periods of dry weather when there is no significant rainfall. The sewer system is expected to carry wastewater without experiencing any surcharge, which
Project Number 10599 January 2025
Page | 73
Technical Memorandum 6 Kawartha Lakes Water-Wastewater Master Plan Capacity Assessment
means that the flow within the pipes should not exceed the pipe's capacity. In this case, the maximum flow depth should be below the top of the pipe (the obvert), ensuring that there is no backup of wastewater in the system. ► Limited Surcharge under Wet-Weather Flow (WWF): When it rains, the sewer system may experience an increase in flow due to inflow and infiltration (I/I) from stormwater. This can cause the system to surcharge, meaning that the flow exceeds the normal pipe capacity. However, it is acceptable for the pipes to operate under surcharge conditions, provided that the distance between the ground surface and the Hydraulic Grade Line (HGL), which represents the water level in the pipe, is greater than 1.8 meters. This ensures that even under surcharge conditions, there is enough clearance to prevent flooding or significant damage. The criteria mentioned above are generally applied to maintain system efficiency and prevent overflows. However, exceptions may be made based on factors such as the age, condition, or specific location of the pipes. For example, pipes in areas where surcharging is less critical or where mitigation measures are in place may be subject to different operational standards.
4.5.2 Capacity Analysis Scenarios The calibrated model is utilized to evaluate the available capacities within the sewer system to accommodate future developments. Four development scenarios were analyzed to assess the performance of the sanitary sewer system in the study area. These scenarios are detailed below: ► Scenario 1: Existing – Calibrated EPS This scenario represents the existing condition at the time of the flow monitoring period. It is characterized by concurrent flow monitoring data. The sanitary generation rates, I/I rates, and DWF patterns for the existing conditions were calculated based on flow monitoring data. ► Scenario 2 & Scenario 3: 2031 & 2041 Planning Horizons To identify development phasing within the study area, population is estimated for the planning horizons (i.e. years 2031 and 2041) based on the anticipated development. Each interim horizon is set up as a separate scenario and constraints are determined. To this end, the estimated population from the potential developments are assigned to the property connections. These connections use the design generation rate of 450 L/c/d and the interim population to calculate the flow. Additionally, the inflow and infiltration (I/I) for the 2031 and 2041 scenarios is accounted for based on the design criteria of 0.26 L/s/ha, as shown in Table 14. ► Scenario 4: Ultimate Future Condition (2051) – Steady State
Project Number 10599 January 2025
Page | 74
Technical Memorandum 6 Kawartha Lakes Water-Wastewater Master Plan Capacity Assessment
This scenario represents the condition where the communities areas are fully occupied with the future population and shows the condition from year 2051 and beyond. New property connections were added to the model to characterize the flow from the future developments. Theoretical DWF and I/I are assumed for the future developments inside the study areas boundary for residential, industrial and commercial based on the design criteria noted in Table 4-6.
4.5.3 Sanitary System Solutions Solutions are recommended to further expand the residual sewer capacity to accommodate additional future developments in the City of Kawartha Lakes. Possible solutions include pipe replacement (upsizing), new sanitary sections, and flow monitoring as detailed in TM-8.
4.5.4 Wastewater Hydraulic Modelling Results This Technical Memorandum summarizes the modelling results of the following for the Lindsay, Bobcaygeon, Fenelon Falls and Omemee as follows 4.5.4.1 Lindsay 4.5.4.1.1 Baseline Condition The baseline scenario was modeled using the existing infrastructure and wastewater demands. Under the Dry Weather Flow (DWF) scenario, the flow in the sewer remains within 85% of capacity for most areas, except for Wolfe St from George St E to Durham St E. The freeboard in the manholes is greater than 1.80 m in most of the study area with some exception around the area near Lindsay St S and Durham St W intersection. 4.5.4.1.2 Dry Weather Flow and Wet Weather Flow of the 2031 Existing Buildout A 2031 scenario was modeled based on the projected future wastewater demands, as outlined in the planning information for projects expected to be operational by 2031. The Harmon peaking factor was applied to determine peak flow in accordance with the guidelines. The phased growth anticipated by 2031 will result in additional wastewater demands under both Dry Weather Flow (DWF) and Wet Weather Flow (WWF) scenarios. The 2031 wastewater system constraints were identified through modeling, considering both the existing network and the additional wastewater demands for 2031. Proposed upgrades to address these constraints are detailed in Technical Memorandum 8 – Capital Implementation Plan. Developments at Lin-Flato6 and Lin-Flato-8 are expected to occur within this timeframe and are assumed to be connected to the existing network. Additionally, Riverview and Mary SPS will experience increased flow and will require upgrades.
Project Number 10599 January 2025
Page | 75
Technical Memorandum 6 Kawartha Lakes Water-Wastewater Master Plan Capacity Assessment
Figure 4-4: Lindsay Simulated Dry Weather Flow under 2031 Existing Buildout Scenario
Project Number 10599 January 2025
Page | 76
Technical Memorandum 6 Kawartha Lakes Water-Wastewater Master Plan Capacity Assessment
Figure 4-5: Lindsay Simulated Wet Weather Flow under 2031 Existing Buildout Scenario
Project Number 10599 January 2025
Page | 77
Technical Memorandum 6 Kawartha Lakes Water-Wastewater Master Plan Capacity Assessment
4.5.4.1.3 Dry Weather Flow and Wet Weather Flow of the 2041 Existing Buildout A 2041 scenario was modeled based on the projected future wastewater demands, using planning information for developments expected to be operational by 2041. The Harmon peaking factor was applied to determine peak flow, in line with the guidelines. The phased growth anticipated by 2041 will lead to additional wastewater demands under both Dry Weather Flow (DWF) and Wet Weather Flow (WWF) scenarios. The 2041 wastewater system constraints were identified through modeling, considering both the existing network and the added demands for 2041. Proposed upgrades to address these constraints are outlined in Technical Memorandum 8 – Capital Implementation Plan. The network for the Flato Development will need to be constructed to meet the increased demand from this area. Additionally, Ridout, Logie, and Fairground SPS will require upgrades to manage the increased flow.
Project Number 10599 January 2025
Page | 78
Technical Memorandum 6 Kawartha Lakes Water-Wastewater Master Plan Capacity Assessment
Figure 4-6: Lindsay Simulated Dry Weather Flow under 2041 Existing Buildout Scenario
Project Number 10599 January 2025
Page | 79
Technical Memorandum 6 Kawartha Lakes Water-Wastewater Master Plan Capacity Assessment
Figure 4-7: Lindsay Simulated Wet Weather Flow under 2041 Existing Buildout Scenario
Project Number 10599 January 2025
Page | 80
Technical Memorandum 6 Kawartha Lakes Water-Wastewater Master Plan Capacity Assessment
4.5.4.1.4 Dry Weather Flow and Wet Weather Flow of the 2051 Existing Buildout A 2051 scenario was modeled based on projected future wastewater demands, using planning information for developments expected to be operational by 2051. The Harmon peaking factor was applied to calculate peak flow in accordance with the guidelines. The phased growth anticipated by 2051 will result in additional wastewater demands under both Dry Weather Flow (DWF) and Wet Weather Flow (WWF) scenarios. The 2051 wastewater system constraints were identified through modeling, taking into account both the existing network and the additional demands for 2051. The constraints maps indicate that the existing sewer will overflow, and the manhole will become surcharged in several areas of the study unless the necessary upgrades are implemented. Proposed upgrades to address these constraints are outlined in Technical Memorandum 8 – Capital Implementation Plan.
Project Number 10599 January 2025
Page | 81
Technical Memorandum 6 Kawartha Lakes Water-Wastewater Master Plan Capacity Assessment
Figure 4-8: Lindsay Simulated Dry Weather Flow under 2051 Existing Buildout Scenario
Project Number 10599 January 2025
Page | 82
Technical Memorandum 6 Kawartha Lakes Water-Wastewater Master Plan Capacity Assessment
Figure 4-9: Lindsay Simulated Wet Weather Flow under 2051 Existing Buildout Scenario
Project Number 10599 January 2025
Page | 83
Technical Memorandum 6 Kawartha Lakes Water-Wastewater Master Plan Capacity Assessment
4.5.4.1.5 Dry Weather Flow and Wet Weather Flow of the 2051 Proposed Buildout This scenario included the wastewater demands for the proposed developments and incorporated all the planned 2051 infrastructure upgrades into the model network. The proposed upgrades for 2051, aimed at addressing the identified constraints, are detailed in Technical Memorandum 8 – Capital Implementation Plan. See figures below illustrates the modeled results, including the 2051 additional demands and the proposed upgrades.
Technical Memorandum 6 Kawartha Lakes Water-Wastewater Master Plan Capacity Assessment
Figure 4-10: Lindsay Simulated Dry Weather Flow under 2051 Proposed Scenario
Project Number 10599 January 2025
Page | 85
Technical Memorandum 6 Kawartha Lakes Water-Wastewater Master Plan Capacity Assessment
Figure 4-11: Lindsay Simulated Wet Weather Flow under 2051 Proposed Scenario
Project Number 10599 January 2025
Page | 86
Technical Memorandum 6 Kawartha Lakes Water-Wastewater Master Plan Capacity Assessment
4.5.4.2 Bobcaygeon Modelling Results 4.5.4.2.1 Baseline Condition The baseline scenario was modeled using the existing infrastructure and wastewater demands. Under the Dry Weather Flow (DWF) scenario, the flow in the sewer remains within 85% of capacity. The freeboard in the manholes is greater than 1.80m in most of the study area with some exception around the area near southeastern portion of the study area. The existing ground and manhole invert elevations indicate shallow sewer, however, flooding in not reported in this area based on city’s record. 4.5.4.2.2 Dry Weather Flow and Wet Weather Flow of the 2031 Existing Buildout A 2031 scenario was modeled based on the projected future wastewater demands, as outlined in the planning information for projects expected to be operational by 2031. The Harmon peaking factor was applied to determine peak flow in accordance with the guidelines. The phased growth anticipated by 2031 will result in additional wastewater demands under both Dry Weather Flow (DWF) and Wet Weather Flow (WWF) scenarios. The 2031 wastewater system constraints were identified through modeling, considering both the existing network and the additional wastewater demands for 2031. The flow remains within the 85% of the sewer capacity for most of the area under DWF scenario. However, under WWF scenario less than 1.80 m of freeboard if found in the manholes near the southeastern area similar to the baseline WWF scenario. Proposed upgrades to address these constraints except the freeboard issues in the southeaster region of the study are detailed in Technical Memorandum 8 – Capital Implementation Plan. The Rainfall Dependent Infiltration and Inflow (RDII) in the southeastern area should be managed effectively to mitigate the risk of surcharge.
Project Number 10599 January 2025
Page | 87
Technical Memorandum 6 Kawartha Lakes Water-Wastewater Master Plan Capacity Assessment
Figure 4-12: Bobcaygeon Simulated Dry Weather Flow under 2031 Existing Buildout Scenario
Project Number 10599 January 2025
Page | 88
Technical Memorandum 6 Kawartha Lakes Water-Wastewater Master Plan Capacity Assessment
Figure 4-13: Bobcaygeon Simulated Wet Weather Flow under 2031 Existing Buildout Scenario
Project Number 10599 January 2025
Page | 89
Technical Memorandum 6 Kawartha Lakes Water-Wastewater Master Plan Capacity Assessment
4.5.4.2.3 Dry Weather Flow and Wet Weather Flow of the 2041 Existing Buildout A 2041 scenario was modeled based on the projected future wastewater demands, using planning information for developments expected to be operational by 2041. The Harmon peaking factor was applied to determine peak flow, in line with the guidelines. The phased growth anticipated by 2041 will lead to additional wastewater demands under both Dry Weather Flow (DWF) and Wet Weather Flow (WWF) scenarios. The 2041 wastewater system constraints were identified through modeling, considering both the existing network and the added demands for 2041. Proposed upgrades to address these constraints are outlined in Technical Memorandum 8 – Capital Implementation Plan. Little Bob Dr SPS will require upgrades to manage the increased flow.
Project Number 10599 January 2025
Page | 90
Technical Memorandum 6 Kawartha Lakes Water-Wastewater Master Plan Capacity Assessment
Figure 4-14: Bobcaygeon Simulated Dry Weather Flow under 2041 Existing Buildout Scenario
Project Number 10599 January 2025
Page | 91
Technical Memorandum 6 Kawartha Lakes Water-Wastewater Master Plan Capacity Assessment
Figure 4-15: Bobcaygeon Simulated Wet Weather Flow under 2041 Existing Buildout Scenario
Project Number 10599 January 2025
Page | 92
Technical Memorandum 6 Kawartha Lakes Water-Wastewater Master Plan Capacity Assessment
4.5.4.2.4 Dry Weather Flow and Wet Weather Flow of the 2051 Existing Buildout A 2051 scenario was modeled based on projected future wastewater demands, using planning information for developments expected to be operational by 2051. The Harmon peaking factor was applied to calculate peak flow in accordance with the guidelines. The phased growth anticipated by 2051 will result in additional wastewater demands under both Dry Weather Flow (DWF) and Wet Weather Flow (WWF) scenarios. The 2051 wastewater system constraints were identified through modeling, taking into account both the existing network and the additional demands for 2051. The constraints maps indicate that the existing sewer will overflow, and the manhole will become surcharged in several areas of the study unless the necessary upgrades are implemented. Proposed upgrades to address these constraints are outlined in Technical Memorandum 8 – Capital Implementation Plan.
Project Number 10599 January 2025
Page | 93
Technical Memorandum 6 Kawartha Lakes Water-Wastewater Master Plan Capacity Assessment
Figure 4-16: Bobcaygeon Simulated Dry Weather Flow under 2051 Existing Buildout Scenario
Project Number 10599 January 2025
Page | 94
Technical Memorandum 6 Kawartha Lakes Water-Wastewater Master Plan Capacity Assessment
Figure 4-17: Bobcaygeon Simulated Wet Weather Flow under 2051 Existing Buildout Scenario
Project Number 10599 January 2025
Page | 95
Technical Memorandum 6 Kawartha Lakes Water-Wastewater Master Plan Capacity Assessment
4.5.4.2.5 Dry Weather Flow and Wet Weather Flow of the 2051 Proposed Buildout This scenario included the wastewater demands for the proposed developments and incorporated all the planned 2051 infrastructure upgrades into the model network. The proposed upgrades for 2051, aimed at addressing the identified constraints, are detailed in Technical Memorandum 8 – Capital Implementation Plan. The figures below illustrate the modeled results, including the 2051 additional demands and the proposed upgrades.
Project Number 10599 January 2025
Page | 96
Technical Memorandum 6 Kawartha Lakes Water-Wastewater Master Plan Capacity Assessment
Figure 4-18: Bobcaygeon Simulated Dry Weather Flow under 2051 Proposed Scenario
Project Number 10599 January 2025
Page | 97
Technical Memorandum 6 Kawartha Lakes Water-Wastewater Master Plan Capacity Assessment
Figure 4-19: Bobcaygeon Simulated Wet Weather Flow under 2051 Proposed Scenario
Project Number 10599 January 2025
Page | 98
Technical Memorandum 6 Kawartha Lakes Water-Wastewater Master Plan Capacity Assessment
4.5.4.3 Fenelon Falls 4.5.4.3.1 Baseline Condition The baseline scenario was modeled using the existing infrastructure and wastewater demands. Under the Dry Weather Flow (DWF) scenario, the flow in most of the sewer remains within 85% of capacity. The freeboard in the manholes is greater than 1.80m in most of the study area with some exception around the area mostly near the western portion of the study area. 4.5.4.3.2 Dry Weather Flow and Wet Weather Flow of the 2031 Existing Buildout A 2031 scenario was modeled based on the projected future wastewater demands, as outlined in the planning information for projects expected to be operational by 2031. The Harmon peaking factor was applied to determine peak flow in accordance with the guidelines. The phased growth anticipated by 2031 will result in additional wastewater demands under both Dry Weather Flow (DWF) and Wet Weather Flow (WWF) scenarios. The 2031 wastewater system constraints were identified through modeling, considering both the existing network and the additional wastewater demands for 2031. The flow-to-capacity ratio and freeboard in the manholes indicate strain on the existing sewer system. Proposed upgrades to address these constraints are outlined in Technical Memorandum 8 – Capital Implementation Plan. Colbourne St, Francis St and Ellice St SPS will require upgrades within this timeframe to manage the increased flow.
Project Number 10599 January 2025
Page | 99
Technical Memorandum 6 Kawartha Lakes Water-Wastewater Master Plan Capacity Assessment
Figure 4-20: Fenelon Falls Simulated Dry Weather Flow under 2031 Existing Buildout Scenario
Project Number 10599 January 2025
Page | 100
Technical Memorandum 6 Kawartha Lakes Water-Wastewater Master Plan Capacity Assessment
Figure 4-21: Fenelon Falls Simulated Wet Weather Flow under 2031 Existing Buildout Scenario
Project Number 10599 January 2025
Page | 101
Technical Memorandum 6 Kawartha Lakes Water-Wastewater Master Plan Capacity Assessment
4.5.4.3.3 Dry Weather Flow and Wet Weather Flow of the 2041 Existing Buildout A 2041 scenario was modeled based on the projected future wastewater demands, using planning information for developments expected to be operational by 2041. The Harmon peaking factor was applied to determine peak flow, in line with the guidelines. The phased growth anticipated by 2041 will lead to additional wastewater demands under both Dry Weather Flow (DWF) and Wet Weather Flow (WWF) scenarios. The 2041 wastewater system constraints were identified through modeling, considering both the existing network and the added demands for 2041. Proposed upgrades to address these constraints are outlined in Technical Memorandum 8 – Capital Implementation Plan. Most of the sewer upgrades need to be completed within this time horizon, which aligns with the anticipated growth.
Project Number 10599 January 2025
Page | 102
Technical Memorandum 6 Kawartha Lakes Water-Wastewater Master Plan Capacity Assessment
Figure 4-22: Fenelon Falls Simulated Dry Weather Flow under 2041 Existing Buildout Scenario
Project Number 10599 January 2025
Page | 103
Technical Memorandum 6 Kawartha Lakes Water-Wastewater Master Plan Capacity Assessment
Figure 4-23: Fenelon Falls Simulated Wet Weather Flow under 2041 Existing Buildout Scenario
Project Number 10599 January 2025
Page | 104
Technical Memorandum 6 Kawartha Lakes Water-Wastewater Master Plan Capacity Assessment
4.5.4.3.4 Dry Weather Flow and Wet Weather Flow of the 2051 Existing Buildout A 2051 scenario was modeled based on projected future wastewater demands, using planning information for developments expected to be operational by 2051. The Harmon peaking factor was applied to calculate peak flow in accordance with the guidelines. The phased growth anticipated by 2051 will result in additional wastewater demands under both Dry Weather Flow (DWF) and Wet Weather Flow (WWF) scenarios. The 2051 wastewater system constraints were identified through modeling, taking into account both the existing network and the additional demands for 2051. The constraints maps indicate that the existing sewer will overflow, and the manhole will become surcharged in several areas of the study unless the necessary upgrades are implemented. Proposed upgrades to address these constraints are outlined in Technical Memorandum 8 – Capital Implementation Plan.
Project Number 10599 January 2025
Page | 105
Technical Memorandum 6 Kawartha Lakes Water-Wastewater Master Plan Capacity Assessment
Figure 4-24: Fenelon Falls Simulated Dry Weather Flow under 2051 Existing Buildout Scenario
Project Number 10599 January 2025
Page | 106
Technical Memorandum 6 Kawartha Lakes Water-Wastewater Master Plan Capacity Assessment
Figure 4-25: Fenelon Falls Simulated Wet Weather Flow under 2051 Existing Buildout Scenario
Project Number 10599 January 2025
Page | 107
Technical Memorandum 6 Kawartha Lakes Water-Wastewater Master Plan Capacity Assessment
4.5.4.3.5 Dry Weather Flow and Wet Weather Flow of the 2051 Proposed Buildout This scenario included the wastewater demands for the proposed developments and incorporated all the planned 2051 infrastructure upgrades into the model network. The proposed upgrades for 2051, aimed at addressing the identified constraints, are detailed in Technical Memorandum 8 – Capital Implementation Plan. The figures below illustrate the modeled results, including the 2051 additional demands and the proposed upgrades.
Project Number 10599 January 2025
Page | 108
Technical Memorandum 6 Kawartha Lakes Water-Wastewater Master Plan Capacity Assessment
Figure 4-26: Fenelon Falls Simulated Dry Weather Flow under 2051 Proposed Scenario
Project Number 10599 January 2025
Page | 109
Technical Memorandum 6 Kawartha Lakes Water-Wastewater Master Plan Capacity Assessment
Figure 4-27: Fenelon Falls Simulated Wet Weather Flow under 2051 Proposed Scenario
Project Number 10599 January 2025
Page | 110
Technical Memorandum 6 Kawartha Lakes Water-Wastewater Master Plan Capacity Assessment
4.5.4.4 Omemee Modelling Results 4.5.4.4.1 Baseline Condition The baseline scenario was modeled using the existing infrastructure and wastewater demands. Under the Dry Weather Flow (DWF) scenario, the flow in the sewer remains within 85% of capacity. Under the Wet Weather Flow (WWF) scenario, the freeboard in the manholes exceeds 1.80m across the study area. 4.5.4.4.2 Dry Weather Flow and Wet Weather Flow of the 2051 Existing Buildout A 2051 scenario was modeled based on projected future wastewater demands, using planning information for developments expected to be operational by 2051. The Harmon peaking factor was applied to calculate peak flow in accordance with the guidelines. The phased growth anticipated by 2051 will result in additional wastewater demands under both Dry Weather Flow (DWF) and Wet Weather Flow (WWF) scenarios. The 2051 wastewater system constraints were identified through modeling, taking into account both the existing network and the additional demands for 2051. The constraints maps indicate that the existing sewer will overflow, and the manhole will become surcharged in areas north of Beaver Rd unless the necessary upgrades are implemented. Proposed upgrades to address these constraints are outlined in Technical Memorandum 8 – Capital Implementation Plan.
Project Number 10599 January 2025
Page | 111
Technical Memorandum 6 Kawartha Lakes Water-Wastewater Master Plan Capacity Assessment
Figure 4-28: Omemee Simulated Dry Weather Flow under 2051 Existing Buildout Scenario
Project Number 10599 January 2025
Page | 112
Technical Memorandum 6 Kawartha Lakes Water-Wastewater Master Plan Capacity Assessment
Figure 4-29: Omemee Simulated Wet Weather Flow under 2051 Existing Buildout Scenario
Project Number 10599 January 2025
Page | 113
Technical Memorandum 6 Kawartha Lakes Water-Wastewater Master Plan Capacity Assessment
4.5.4.4.3 Dry Weather Flow and Wet Weather Flow of the 2051 Proposed Buildout This scenario included the wastewater demands for the proposed developments and incorporated all the planned 2051 infrastructure upgrades into the model network. The proposed upgrades for 2051, aimed at addressing the identified constraints, are detailed in Technical Memorandum 8 – Capital Implementation Plan. The figures below illustrate the modeled results, including the 2051 additional demands and the proposed upgrades.
Project Number 10599 January 2025
Page | 114
Technical Memorandum 6 Kawartha Lakes Water-Wastewater Master Plan Capacity Assessment
Figure 4-30: Omemee Simulated Dry Weather Flow under 2051 Proposed Scenario
Project Number 10599 January 2025
Page | 115
Technical Memorandum 6 Kawartha Lakes Water-Wastewater Master Plan Capacity Assessment
Figure 4-31: Omemee Simulated Wet Weather Flow under 2051 Proposed Scenario
Project Number 10599 January 2025
Page | 116
Technical Memorandum 6 Kawartha Lakes Water-Wastewater Master Plan Capacity Assessment
4.5.4.5 Sewage Pumping Stations Solutions are recommended to further expand each SPS to accommodate additional future developments in the City of Kawartha Lakes. Possible solutions will include SPS upgrades and forcemain upsizing based on the phased flow projections at each respective SPS. The below tables identify the firm capacity of each SPS and the modelled baseline, 2031, 2041 and 2051 design flows. The need for SPS upgrades was determined when the modeled flow exceeded the firm capacity of the SPS. A desktop analysis was performed to assess the current forcemain pipe sizes in relation to the flow velocities of the projected design modeled flows. These were compared with MECP design guidelines, which recommend flow velocities between 0.8 m/s and 3.0 m/s. Any projected design flows exceeding 3.0 m/s were flagged for upgrades. The forcemain size will also need to be confirmed during the detailed design phase. Proposed SPS and FM upgrades to address these constraints are detailed in Technical Memorandum 8 – Capital Implementation Plan Table 4-8: Lindsay SPS Phased Flows Model
Model
Model
2031
2041
2051
(L/s)
Flows (L/s
Flows (L/s)
Flows (L/s)
Model Facility
Firm Capacity (L/s)
Baseline
Fairground SPS
18
0.06
1.27
27.5
27.5
Jennings Creek SPS
550
60.7
178.4
183.9
257.1
Lindsay Street North SPS
400
227.4
317.8
317.8
311.8
Logie Street SPS
69.1
7.3
60.6
102.1
176.5
Mary Street SPS
20
55.0
57.0
57.0
57.0
Ridout Street SPS
360
246.4
392.3
488.0
508.1
Rivera Park SPS
732
389.8
456.3
536.5
569.4
Riverview Estates SPS
58.4
6.4
10.9
10.9
16.6
Project Number 10599 January 2025
Page | 117
Technical Memorandum 6 Kawartha Lakes Water-Wastewater Master Plan Capacity Assessment
Table 4-9: Bobcaygeon SPS Phased Flows Model Facility
Firm Capacity (L/s)
Baseline Flow (L/s)
Model
Model
Model
2031
2041
2051
Flows (L/s
Flows (L/s)
Flows (L/s)
Canal St. E SPS
35.6
9.7
20.4
20.4
60.4
Lance Street SPS
13.9
6.5
9.6
9.6
9.6
Bolton Street SPS
6.7
0.2
0.2
0.2
0.2
Main St SPS
6.3
0.2
0.2
0.2
.4
Front Street W SPS
13.9
5.8
26.5
35.3
61.7
Anne Street SPS
61.0
31.8
78.0
87.8
162.5
Navigators Trail and Island Bay Drive SPS
42
7.7
8.7
8.7
25.5
Navigators Trail SPS (by Patricia Place)
18.9
4.0
6.8
6.8
6.8
Mill Street SPS
18.9
7.3
10.1
10.1
10.1
Little Bob Drive SPS
15
3.3
3.8
17.6
30.4
Riverside Drive SPS
14.1
6.5
7.8
7.8
7.8
Project Number 10599 January 2025
Page | 118
Technical Memorandum 6 Kawartha Lakes Water-Wastewater Master Plan Capacity Assessment
Table 4-10: Fenelon Falls SPS Phased Flows
Facility Facility
Model Firm Baseline Capacity Flow (L/s) Firm Capacity (L/s) (L/s)
Model Model Model Model 2031 2041 Buildout2051 Flow Baseline Flow (L/s) Flows (L/s Flows (L/s) Flows (L/s) (L/s)
Church St SPS Colborne 50 Street SPSRoad SPS Sturgeon
45.0 96.12 88.0
109.17
22.6 132.16
37.7 145.94 86.1
Ellice Street SPS
120
163.26
181.86
211.99
225.56
Francis Street SPS
6.2
10.49
10.49
12.31
49.93
54.6
Table 4-11: Omemee SPS Phased Flows Model Facility
Firm Capacity (L/s)
Baseline Flow (L/s)
Ultimate Design Flow (L/s)
Church SPS
45
22.6
37.6
Stugeon SPS
88
32.1 Model
Facility
Firm Capacity (L/s)
Baseline Flow (L/s)
86.2 Ultimate Design Flow (L/s)
Church SPS
45
22.6
37.6
Stugeon SPS
88
32.1
86.2
Project Number 10599 January 2025
Page | 119
Technical Memorandum 7
Kawartha Lakes Water-Wastewater Master Plan Uncommitted Reserve Capacity January 2025 | CKL Contract 2022-13-CP | TYLin Project 10599 City of Kawartha Lakes
Technical Memorandum 7 Kawartha Lakes Water-Wastewater Master Plan Capacity Assessment
TABLE OF CONTENTS 1
INTRODUCTION....................................................................................................................... 1
2
APPROACH AND METHODOLOGY ........................................................................................ 2
3
4
5
6
7
2.1
Water ............................................................................................................................ 2
2.2
Wastewater .................................................................................................................. 2
LINDSAY ................................................................................................................................... 4 3.1
Water Treatment Plant ............................................................................................... 4
3.2
Water Storage.............................................................................................................. 4 3.2.1
Lindsay........................................................................................................................................... 4
3.2.2
Oakwood....................................................................................................................................... 5
3.3
Water Distribution System......................................................................................... 6
3.4
Wastewater Treatment Plant ..................................................................................... 9
3.5
Sewer Collection System ............................................................................................ 9
BOBCAYGEON........................................................................................................................ 12 4.1
Water Treatment Plant ............................................................................................. 12
4.2
Water Storage............................................................................................................ 12
4.3
Water Distribution System....................................................................................... 13
4.4
Wastewater Treatment Plant ................................................................................... 16
4.5
Sewer Collection System .......................................................................................... 16
FENELON FALLS ..................................................................................................................... 19 5.1
Water Treatment Plant ............................................................................................. 19
5.2
Water Storage............................................................................................................ 19
5.3
Water Distribution System....................................................................................... 21
5.4
Wastewater Treatment Plant ................................................................................... 24
5.5
Sewer Collection System .......................................................................................... 24
WOODVILLE ........................................................................................................................... 27 6.1
Water Treatment Plant ............................................................................................. 27
6.2
Water Storage............................................................................................................ 27
6.3
Water Distribution System....................................................................................... 28
OMEMEE................................................................................................................................. 31 7.1
Wastewater Treatment Plant ................................................................................... 31
7.2
Sewer Collection System .......................................................................................... 31
Project Number 10599 January 2025
Page | ii
Technical Memorandum 7 Kawartha Lakes Water-Wastewater Master Plan Capacity Assessment
LIST OF FIGURES Figure 3-1: Lindsay WTP Demand Projections..................................................................................................... 4 Figure 3-2: Lindsay Water Storage Projections.................................................................................................... 5 Figure 3-3: Lindsay Wastewater Flow Projections .............................................................................................. 9 Figure 4-1: Bobcaygeon WTP Demand Projections .........................................................................................12 Figure 4-2: Bobcaygeon Water Storage Projections........................................................................................13 Figure 4-3: Bobcaygeon WPCP Flow Projections..............................................................................................16 Figure 5-1: Fenelon Falls WTP Demand Projections ........................................................................................19 Figure 5-2: Fenelon Falls Water Storage Projections.......................................................................................20 Figure 5-3: Fenelon Falls Water Storage Projections with Booster Pumping Station .........................21 Figure 5-4: Fenelon Falls WPCP Flow Projections.............................................................................................24 Figure 6-1: Woodville WTP Demand Projections..............................................................................................27 Figure 6-2: Woodville Water Storage Projections ............................................................................................28 Figure 7-1: Omemee WPCP Flow Projections ....................................................................................................31
Project Number 10599 January 2025
Page | iii
Technical Memorandum 7 Kawartha Lakes Water-Wastewater Master Plan Capacity Assessment
1 INTRODUCTION T.Y. Lin International Canada (TYLin) has been contracted by the City of Kawartha Lakes for completion of a Water and Wastewater Master Plan Update. As part of this study, TYLin is responsible for assessing uncommitted reserve capacity for the water and wastewater facilities, sanitary collection system and water distribution system. The following technical memorandum describes the methodology undertaken to assess the uncommitted reserve capacity of sewage collection system, wastewater treatment facilities and water treatment facilities. It also documents any of the assumptions made during this process.
Project Number 10599 January 2025
Page | 1
Technical Memorandum 7 Kawartha Lakes Water-Wastewater Master Plan Capacity Assessment
2 APPROACH AND METHODOLOGY The intent of this technical memorandum is to identify uncommitted reserve capacity within the water and wastewater collection systems which will guide the City for where additional development can be implemented. The reserve capacity in the entire water distribution system and downstream system is subject to change as additional water demands and sanitary loads are introduced, which could strain the system’s ability to handle increased demand. As the communities experiences growth, both in terms of population and development, these additional water demands and sanitary loads will impact the overall capacity and performance of the system. Therefore, it is crucial that the reserve capacity be continuously monitored and updated to ensure that the system remains capable of accommodating future growth, preventing potential pressure issues/overflows or service disruptions, and ensuring that infrastructure investments are aligned with evolving needs.
2.1 Water The uncommitted reserve capacity for water for was determined by subtracting the maximum flow available at each watermain node from the maximum day fire flow scenario being drawn from the system. The unused flow was then used to calculate the number of units that could be serviced in the future using the City’s Design Criteria. Any new water services connections will have system wide impacts and shall be verified by running the model prior to making any new service decisions based on the uncommitted reserve capacity. The detailed capacity analysis for the Water Treatment Plants (WTP), Reservoir and Booster Pumping stations were evaluated in Technical Memorandum 5 (TM-5). The water distribution system detailed capacity analysis was evaluated in Technical Memorandum 6 (TM-6).
2.2 Wastewater The uncommitted reserve capacity for wastewater was determined by subtracting the maximum sewer flow from the sewer full capacity. The calculation was conducted under wet weather flow conditions to account for both dry weather flow and I/I demand. A minimum freeboard of 1.80 meters is recommended in the manhole under the Wet Weather Flow (WWF) scenario. Any new service connection could alter the current freeboard status. Therefore, the freeboard in the manholes should be verified by running the model prior to making any new service decisions based on the uncommitted reserve capacity . The detailed capacity analysis for the Wastewater Treatment Plants (WPCP) were evaluated in
Project Number 10599 January 2025
Page | 2
Technical Memorandum 7 Kawartha Lakes Water-Wastewater Master Plan Capacity Assessment
Technical Memorandum 5 (TM-5). The sanitary wastewater collection detailed capacity analysis were evaluated in Technical Memorandum 6 (TM-6).
Project Number 10599 January 2025
Page | 3
Technical Memorandum 7 Kawartha Lakes Water-Wastewater Master Plan Capacity Assessment
3 LINDSAY 3.1 Water Treatment Plant The Lindsay Water Treatment Plant has a rated maximum day capacity of 22,730 m3/d. Based on the anticipated demand projections shown in Figure 3-1, the WTP will reach 80% of its rated capacity when the population of Lindsay reaches approximately 28,000 residents, and 100% capacity at 34,000 residents. Based on an existing serviced population of 23,500 residents and 2.3 persons per unit, these estimates equate to 1,900 and 4,500 additional residential units respectively. Figure 3-1: Lindsay WTP Demand Projections
3.2 Water Storage 3.2.1 Lindsay There is currently 11,650 m3 of storage available in Lindsay, split between the Thornhill Road Reservoir (9,000 m3) and the Verulam Road Elevated Tank (2,650 m3). Based on the anticipated demand projections and storage requirements shown in Figure 3-2, Project Number 10599 January 2025
Page | 4
Technical Memorandum 7 Kawartha Lakes Water-Wastewater Master Plan Capacity Assessment
the existing required water storage in Lindsay already exceeds 80% of its total capacity. It will reach 100% of its total storage capacity at approximately 28,000 residents. Based on an existing serviced population of 23,500 residents and 2.3 persons per unit, these estimates equate to 1,950 additional residential units. Figure 3-2: Lindsay Water Storage Projections
Lindsay Water Storage Projections 35,000
Storage volume (m3)
P5
Plan for Plant Upgrade
30,000 25,000
P4 P3
20,000
P2A
P2B
15,000 10,000 5,000
P1 Existing
20,000
30,000
40,000
50,000
60,000
70,000
80,000
Population Water Storage Required
Existing Capacity
80% Capacity
3.2.2 Oakwood 3.2.2.1 Booster Pumping Station Based on the anticipated demand projections the BPS will reach 80% of its rated capacity when the population of Oakwood reaches approximately 850 residents, and 100% capacity at 1,100 residents. Based on an existing serviced population of 650 residents and 2.3 persons per unit, these estimates equate to 85 and 195 additional residential units respectively. 3.2.2.2 Reservoir There is currently 232 m3 of storage available at the Oakwood Reservoir which is not capable to provide fire protection. The Oakwood Reservoir is deficient in the existing planning category and as such cannot support any additional residential units at this time. A reservoir expansion will be required to address the existing and buildout planning category.
Project Number 10599 January 2025
Page | 5
Technical Memorandum 7 Kawartha Lakes Water-Wastewater Master Plan Capacity Assessment
3.3 Water Distribution System The 2025 Uncommitted Water Reserve and 2051 Uncommitted Water Reserve for Lindsay water distribution system can be seen on the following figures. The uncommitted reserve units are determined for each node, reflecting the number of units that can be added based on the available excess flow as described in Section 2.1. It is important to note that dead ends within the water distribution system may provide adequate flow but tend to have lower pressures due to the absence of looping.
Project Number 10599 January 2025
Page | 6
¯ !
!
!
!
!
! !
! !! ! !!
! !! ! ! ! ! !!
!
!
! !
!
!
! ! !
!
! !
! ! ! ! !! ! !
Legend
!
!! !!
!
! ! ! ! !
!
! ! ! ! !
!
! ! ! ! ! ! ! ! !
!
!! ! ! ! ! !
!! !
!
! ! !
!
! ! !
!
$ + " #
!
!
! ! ! ! ! ! ! ! ! ! ! ! !! ! ! ! ! ! ! ! ! ! ! ! ! ! ! ! ! ! ! ! ! !! ! ! ! ! ! ! ! !! ! ! ! !! ! ! ! !! ! ! ! ! ! !! !! ! ! ! ! ! ! ! ! ! ! !! !! ! ! ! ! ! ! ! ! !! ! !! ! ! !! ! ! ! ! ! ! ! ! ! !! ! ! ! ! !! ! ! ! !! ! ! ! ! ! ! ! ! ! ! ! ! ! ! ! ! ! ! ! ! ! ! ! !! !!! ! ! ! !! ! ! ! ! ! ! ! ! ! ! ! ! ! ! ! ! ! ! ! !! ! ! ! ! ! !! ! ! ! ! ! ! ! ! ! ! !! ! ! ! ! ! ! ! ! ! ! ! ! ! ! ! ! ! ! ! ! ! ! ! ! !! ! !! ! ! ! ! ! ! ! ! ! ! ! ! ! ! ! !! ! !! ! ! ! ! !! !! !! ! ! ! ! ! ! ! ! !! ! ! ! ! !! ! ! ! ! ! ! ! ! ! ! ! ! ! ! !! ! ! ! ! ! ! ! ! ! ! ! ! ! ! ! ! ! !! ! ! ! ! ! ! ! ! ! ! !! ! ! ! ! ! ! ! ! ! ! ! ! ! ! ! ! !! ! ! ! ! ! ! ! !! ! ! ! ! ! !! ! ! ! ! ! !! ! ! ! ! ! ! ! ! ! ! ! ! ! ! ! ! ! ! ! ! ! ! ! !! ! !! ! ! !! ! ! ! !!! ! ! !! ! ! ! ! ! ! ! ! ! ! ! ! !! ! ! ! ! ! ! ! ! ! ! ! ! ! !! ! ! ! ! ! ! ! ! ! ! ! ! ! !! ! ! !! ! !! !! ! ! ! ! ! ! ! ! !! ! ! ! ! ! ! ! ! !! ! ! ! ! ! !! !! ! !! !! ! ! ! !! ! ! ! !! ! !! ! ! ! ! ! ! ! ! ! ! ! ! ! ! ! ! ! ! ! ! !!! ! ! !! ! ! ! ! ! ! ! !! !! ! ! ! ! ! ! ! ! ! ! ! ! !! ! !!! ! ! ! ! ! ! ! ! ! ! !! ! !! !! ! !! ! ! !! ! ! ! ! ! ! ! !! !! ! ! ! ! ! ! ! ! ! ! ! ! ! !! ! ! ! ! !! ! ! ! ! ! ! ! ! !! ! ! ! ! ! ! !! ! ! ! ! ! ! ! ! ! ! ! !! ! !! ! ! ! ! ! ! ! ! ! ! ! ! ! ! ! !! ! ! ! ! ! !! !! ! ! ! ! !! ! !! ! !! ! ! ! ! ! !! !!! ! ! ! ! ! !! ! ! ! ! ! ! ! ! ! ! ! !! ! ! ! ! ! ! ! ! ! ! ! ! ! !! !! ! ! ! ! ! ! ! !! ! ! ! ! ! ! ! ! ! !
Settlement Boundary
! ! ! !
Reservoir Pump
Uncommitted Reserve
!
!
< 1,500 Units
!
1,500 - 3,000 Units
!
3,000 - 4,500 Units
!
> 4,500 Units
Diameter
<= 150 mm
$ +
!
Tank
151 - 200 mm 201 - 300 mm
# # # $ +
301 - 600 mm
!
! ! !
# # "
! !
!
! !
! ! ! ! !
!
! ! ! !
! ! !
! !
!
!!
! ! !
!
!
!
!
! !
!! !
! ! !!
TYLin Project #: 10599
!!
!
!! !
Kawartha Lakes W-WW Master Plan
!
! !
!
!!
Linday 2025 Uncommitted Water Reserve
!
0
0.375 0.75
1.5
2.25
3 Kilometers
DRAWN BY: AT Sources: Esri, HERE, Garmin, Intermap, increment P Corp.,
DATE: January 2025
¯ !
!
!
$ ! !
!
!
! ! ! ! ! ! ! ! !
!
! !! ! !
!! !! ! ! ! ! ! ! !! ! ! ! ! ! ! ! ! ! !
!
! ! ! !
!
! ! !
!
!
! !
! ! ! ! !! ! !
Legend
!
!! !! !! ! ! ! ! !
!!
! !
! ! !
!
! ! !
!
$ " #
!
!
! ! ! ! ! ! ! ! ! ! ! ! !! ! ! ! ! ! ! ! !! ! ! ! ! ! ! ! ! ! ! ! !! ! ! ! ! ! ! ! !! ! ! ! !! ! ! ! !! ! ! ! ! ! !! !! ! ! ! ! ! ! ! ! ! ! !! !! ! ! ! ! ! ! ! ! !! ! !! ! ! !! ! ! ! ! ! ! ! ! ! !! ! ! ! ! !! ! ! ! !! ! ! ! ! ! ! ! ! ! ! ! ! ! ! ! ! ! ! ! ! ! ! ! !! !!! ! ! ! !! ! ! ! ! ! ! ! ! ! ! ! ! ! ! ! ! ! ! ! !! ! ! ! ! ! !! ! ! ! ! ! ! ! ! ! ! ! !! ! ! ! ! ! ! ! ! ! ! ! ! ! ! ! ! ! ! ! ! ! ! ! !! ! !! ! ! ! ! ! ! ! ! ! ! ! ! ! ! ! !! ! !! ! ! ! ! !! !! !! ! ! ! ! ! ! ! ! !! ! ! ! ! !! ! ! ! ! ! ! ! ! ! ! ! ! ! ! !! ! ! ! ! ! ! ! ! ! ! ! ! ! ! ! ! ! !! ! ! ! ! ! ! ! ! ! ! !! ! ! ! ! ! ! ! ! ! ! ! ! ! ! ! ! !! ! ! ! ! !! ! !! ! ! ! ! ! ! !! ! !! ! ! ! !! ! ! ! ! ! ! ! ! !! ! ! ! ! ! ! ! ! ! ! ! ! !! ! !! ! ! !! ! ! ! !! ! !!! ! ! ! ! ! ! ! ! ! ! ! ! ! ! ! !! ! ! ! ! ! ! ! ! ! ! ! ! ! !! ! ! ! ! ! ! ! ! ! ! ! ! ! !! ! ! !! ! !! ! !! ! ! ! ! ! ! ! ! !! ! ! ! ! ! ! ! ! !! ! ! ! ! ! !! !! ! !! !! ! ! ! ! ! ! ! ! !! ! !! ! ! ! ! ! ! ! ! ! ! ! ! ! ! ! ! ! ! ! ! !!! ! ! !! ! ! ! ! ! ! ! !! !! ! ! ! ! ! ! ! ! ! ! !!! ! ! ! ! ! ! ! ! ! ! !! ! ! !! ! !! !! ! ! ! ! !! ! ! ! ! ! ! !! ! ! !! ! ! ! !! ! ! ! ! ! ! !! ! ! ! !! ! ! !! ! ! ! ! ! ! ! ! ! ! !! ! ! ! ! ! ! ! ! !! ! ! ! ! ! ! ! !! ! ! ! ! ! ! ! ! ! ! !! ! ! ! ! ! ! !! ! ! ! ! ! !! !! ! ! ! ! !! ! !! ! !! ! ! ! ! ! !! !!! ! ! ! ! !! ! ! ! ! ! ! ! ! ! ! ! ! ! !! ! ! ! ! ! ! !! ! ! ! !! ! ! !! ! ! ! ! ! ! !! ! ! ! ! ! ! ! ! ! !
Settlement Boundary
! ! ! !
Reservoir Pump
Uncommitted Reserve
!
!
< 1,500 Units
!
1,500 -3,000 Units
!
3,000 - 4,500 Units
!
> 4,500 Units
Diameter
<= 150 mm
$
!
Tank
151 - 200 mm 201 - 300 mm
# # # $
301 - 600 mm
!
# # "
! !
!
! !
! ! ! ! !
!
! ! ! !
! ! !
! !
! !
!
! !
!!
! ! !
!
!
!
!! !
! ! !!
TYLin Project #: 10599
!!
!
!! !
Kawartha Lakes W-WW Master Plan
!
! !
!
!!
Linday 2051 Uncommitted Water Reserve
!
0
0.375 0.75
1.5
2.25
3 Kilometers
DRAWN BY: AT Sources: Esri, HERE, Garmin, Intermap, increment P Corp.,
DATE: January 2025
Technical Memorandum 7 Kawartha Lakes Water-Wastewater Master Plan Capacity Assessment
3.4 Wastewater Treatment Plant The Lindsay WPCP has a rated Average Day Flow (ADF) capacity of 24,500 m³/d, with the current ADF demand at 14,178 m³/d, which is 58% of the rated capacity. Additionally, 30,061 m³/d of flow has been committed through planning approvals up to 2051. The total of existing and committed approvals amounts to 44,239 m³/d, exceeding the rated capacity. Therefore, an expansion of the WPCP is required to accommodate the committed approvals as well as potential new services based on the uncommitted reserve. Figure 3-3: Lindsay Wastewater Flow Projections
3.5 Sewer Collection System The 2025 Uncommitted Wastewater Reserve and 2051 Uncommitted Wastewater Reserve for Lindsay can be seen on the following figures. The uncommitted reserve units are determined for each pipe, reflecting the number of units that can be added based on the excess capacity within the pipe as described in Section 2.2.
Project Number 10599 January 2025
Page | 9
¯ Legend Settlement Boundary
Manhole Freeboard < 1.80 m
Uncommitted Reserve < 2,000 Units 2,000 - 4,000 Units 4,000 - 6,000 Units > 6,000 Units
TYLin Project #: 10599
Kawartha Lakes W-WW Master Plan Lindsay 2025 Uncommitted Reserve
0
0.375 0.75
1.5
2.25
3 Kilometers
DRAWN BY: AT Sources: Esri, HERE, Garmin, Intermap, increment P Corp.,
DATE: January 2025
¯ Legend Settlement Boundary
Manhole Freeboard < 1.80 m
Uncommitted Reserve < 2,000 Units 2,000 - 4,000 Units 4,000 - 6,000 Units > 6,000 Units
TYLin Project #: 10599
Kawartha Lakes W-WW Master Plan Lindsay 2051 Uncommitted Reserve
0
0.375 0.75
1.5
2.25
3 Kilometers
DRAWN BY: AT Sources: Esri, HERE, Garmin, Intermap, increment P Corp.,
DATE: January 2025
Technical Memorandum 7 Kawartha Lakes Water-Wastewater Master Plan Capacity Assessment
4 BOBCAYGEON 4.1 Water Treatment Plant The Bobcaygeon Water Treatment Plant has a rated maximum day capacity of 5,184 m3/d. Based on the anticipated demand projections shown in Figure 4-1, the WTP will reach 80% of its rated capacity when the population of Bobcaygeon reaches approximately 4,100 residents, and 100% capacity at 5,150 residents. Based on an existing serviced population of 3,500 residents and 2.3 persons per unit, these estimates equate to approximately 260 and 700 additional residential units respectively. Figure 4-1: Bobcaygeon WTP Demand Projections
Bobcaygeon WTP Demand Projections 10,000 9,000
Plan for Plant Upgrade P3
Max Day Demand (m3/d)
8,000 7,000 6,000 5,000 4,000 3,000
P1
2,000
P2
Existing
1,000 3,000
4,000
5,000
6,000
7,000
8,000
9,000
10,000
Population Projected MDD
Existing Capacity
80% Capacity
4.2 Water Storage The storage in the water distribution system in Bobcaygeon is provided by the Dunn Street Elevated Tank located at 85 Dunn Street. The elevated tank has a storage volume of 4,400 m3. Based on the anticipated demand projections and storage requirements shown in Figure 4-2, the existing water storage in Bobcaygeon is sufficient up to planning horizon P2. Required
Project Number 10599 January 2025
Page | 12
Technical Memorandum 7 Kawartha Lakes Water-Wastewater Master Plan Capacity Assessment
storage will reach 80% of its total storage capacity at approximately 6,200 residents and 100% of its capacity at approximately 7,800 residents. Based on an existing serviced population of 3,500 residents and 2.3 persons per unit, these estimates equate to respectively 1,150 and 1,850 additional residential units. Figure 4-2: Bobcaygeon Water Storage Projections
Bobcaygeon Water Storage Projections 6,000
Storage volume (m3)
5,000
P3
4,000
3,000
P2
2,000
Plan for Plant Upgrade
P1 Existing
1,000
3,000
4,000
5,000
6,000
7,000
8,000
9,000
10,000
Population Water Storage Required
Existing Capacity
80% Capacity
4.3 Water Distribution System The 2025 Uncommitted Water Reserve and 2051 Uncommitted Water Reserve for Bobcaygeon can be seen in the following figures. The uncommitted reserve units are determined for each node, reflecting the number of units that can be added based on the available excess flow as described in Section 2.1. It is important to note that dead ends within the water distribution system may provide adequate flow but tend to have lower pressures due to the absence of looping.
Project Number 10599 January 2025
Page | 13
FR 128
¯
V OLI RD ERS
HS COS RD
K BIC
D A R! ! !! ALM! !
ST
LO TAY
! !
! ! !
!
!ST ! DUNN ! !
!
!
!
8 RD
SE PH ! ! ST
ST
ST WE
NTY COU
!
ST
!
!
T !! EN S QUE ! ! !! !
! !T S
!
DR U S! ! CT!
!
! !
NS ! IN M !
!
!
!
!
!
INT R D!
!
! !
!
!FOR
E AN ! L EST !!
E ! ! OLD ! ! ! ISL!! ! ! AN ! D ! ! BA Y D! ! ! R ! !
!!
PO SNAKE
!
!
! !
!
G KIN !
!
! !
! !
!
! T E !! ! G!S N I K W !!!! ST
!
!
! !
!
! !
IL TR A ORS ! ! ! IGAT ! ! NAV ! !
!
! ! ! ! !
! !
!!MI LL ! ! ST
! !! !! !
!E AV !
Pump
!
< 1,500 Units
!
1,500 - 3,000 Units
!
3,000 - 4,500 Units
!
> 4,500 Units
!
!!
!
Reservoir
! !
Diameter
! !
< = 100 mm
! ! ! ! ! ! !
101 - 150 mm
! ! !! ! ! CRT ! YLVAN ! !S ! ! ! ! ! ! ! ! ! ! !
! !! ! ! ! !!
!
151 - 200 mm 201 - 300 mm
! ! !
R VE D RI K R R PA
E RF PE !
T!
!! !
! ! !
ST
!
DR
LE CO
D BOY
!! !
S RT PO
!
!
!
ST
!
S RK PA
!!
!
Tank
Uncommitted Reserve
! !!
D NEE
# # "
$ " #
!
!
!
W
T
!
! !! ! W ! ST! ! ! L ! !! !N!A ! CA! ! !!
!
ST NT FRO !
!
!
!
Settlement Boundary
!
T
!
D HEA
!
!
!
! JO
ST
!
T
Legend
R
!
AN NE S
T !
! !
27
N
S RTH NO
!
D DE RSI
1 FR
ST
ES DUK
!
T
HEL EN
ST
!
! ! !! ! !! DAR D R E ! C REE
!
ES JAN
E RIV
!
ST
T
! ! !
!
!
T EAS
ST VA CLA
!
! !
!
! !
A BAL
DS REI
ST WE
!
!
!
!
$
! !
!
MA IN
!
!
!
!
!
T K S! BIC ! !
T R S !!
!
T EAS ST
ES TU RI
AN
RD
S
K OA RD
TYLin Project #10599
R RD
3 RD 6
RD
24
Y UNT CO
Y CK RO
RD
E AN
RD CH RAN
TY UN O C
L RY BER
EGO GR MC
RK PA
LAKELAND RD
Kawartha Lakes W-WW Master Plan Bobcaygeon 2025 Uncommitted Water Reserve
0
500
1,000
1,500
2,000 Meters
SCALE:1:20,000
Sources: Esri, HERE, Garmin, Intermap, increment P Corp.,
DRAWN BY: AT
DATE: January 2025
¯ !
!
!
$ ! !
!
!
! ! ! ! ! ! ! ! !
!
! !! ! !
!! !! ! ! ! ! ! ! !! ! ! ! ! ! ! ! ! ! !
!
! ! ! !
!
! ! !
!
!
! !
! ! ! ! !! ! !
Legend
!
!! !! !! ! ! ! ! !
!!
! !
! ! !
!
! ! !
!
$ " #
!
!
! ! ! ! ! ! ! ! ! ! ! ! !! ! ! ! ! ! ! ! !! ! ! ! ! ! ! ! ! ! ! ! !! ! ! ! ! ! ! ! !! ! ! ! !! ! ! ! !! ! ! ! ! ! !! !! ! ! ! ! ! ! ! ! ! ! !! !! ! ! ! ! ! ! ! ! !! ! !! ! ! !! ! ! ! ! ! ! ! ! ! !! ! ! ! ! !! ! ! ! !! ! ! ! ! ! ! ! ! ! ! ! ! ! ! ! ! ! ! ! ! ! ! ! !! !!! ! ! ! !! ! ! ! ! ! ! ! ! ! ! ! ! ! ! ! ! ! ! ! !! ! ! ! ! ! !! ! ! ! ! ! ! ! ! ! ! ! !! ! ! ! ! ! ! ! ! ! ! ! ! ! ! ! ! ! ! ! ! ! ! ! !! ! !! ! ! ! ! ! ! ! ! ! ! ! ! ! ! ! !! ! !! ! ! ! ! !! !! !! ! ! ! ! ! ! ! ! !! ! ! ! ! !! ! ! ! ! ! ! ! ! ! ! ! ! ! ! !! ! ! ! ! ! ! ! ! ! ! ! ! ! ! ! ! ! !! ! ! ! ! ! ! ! ! ! ! !! ! ! ! ! ! ! ! ! ! ! ! ! ! ! ! ! !! ! ! ! ! !! ! !! ! ! ! ! ! ! !! ! !! ! ! ! !! ! ! ! ! ! ! ! ! !! ! ! ! ! ! ! ! ! ! ! ! ! !! ! !! ! ! !! ! ! ! !! ! !!! ! ! ! ! ! ! ! ! ! ! ! ! ! ! ! !! ! ! ! ! ! ! ! ! ! ! ! ! ! !! ! ! ! ! ! ! ! ! ! ! ! ! ! !! ! ! !! ! !! ! !! ! ! ! ! ! ! ! ! !! ! ! ! ! ! ! ! ! !! ! ! ! ! ! !! !! ! !! !! ! ! ! ! ! ! ! ! !! ! !! ! ! ! ! ! ! ! ! ! ! ! ! ! ! ! ! ! ! ! ! !!! ! ! !! ! ! ! ! ! ! ! !! !! ! ! ! ! ! ! ! ! ! ! !!! ! ! ! ! ! ! ! ! ! ! !! ! ! !! ! !! !! ! ! ! ! !! ! ! ! ! ! ! !! ! ! !! ! ! ! !! ! ! ! ! ! ! !! ! ! ! !! ! ! !! ! ! ! ! ! ! ! ! ! ! !! ! ! ! ! ! ! ! ! !! ! ! ! ! ! ! ! !! ! ! ! ! ! ! ! ! ! ! !! ! ! ! ! ! ! !! ! ! ! ! ! !! !! ! ! ! ! !! ! !! ! !! ! ! ! ! ! !! !!! ! ! ! ! !! ! ! ! ! ! ! ! ! ! ! ! ! ! !! ! ! ! ! ! ! !! ! ! ! !! ! ! !! ! ! ! ! ! ! !! ! ! ! ! ! ! ! ! ! !
Settlement Boundary
! ! ! !
Reservoir Pump
Uncommitted Reserve
!
!
< 1,500 Units
!
1,500 -3,000 Units
!
3,000 - 4,500 Units
!
> 4,500 Units
Diameter
<= 150 mm
$
!
Tank
151 - 200 mm 201 - 300 mm
# # # $
301 - 600 mm
!
# # "
! !
!
! !
! ! ! ! !
!
! ! ! !
! ! !
! !
! !
!
! !
!!
! ! !
!
!
!
!! !
! ! !!
TYLin Project #: 10599
!!
!
!! !
Kawartha Lakes W-WW Master Plan
!
! !
!
!!
Linday 2051 Uncommitted Water Reserve
!
0
0.375 0.75
1.5
2.25
3 Kilometers
DRAWN BY: AT Sources: Esri, HERE, Garmin, Intermap, increment P Corp.,
DATE: January 2025
Technical Memorandum 7 Kawartha Lakes Water-Wastewater Master Plan Capacity Assessment
4.4 Wastewater Treatment Plant The Bobcaygeon WTP has a rated Average Day Flow (ADF) capacity of 3,055 m³/d, with the current ADF demand at 2,583 m³/d, which is 85% of the rated capacity. Additionally, 3,011 m³/d of flow has been committed through planning approvals up to 2051. The total of existing and committed approvals amounts to 5,594 m³/d, exceeding the rated capacity. Therefore, an expansion of the WPCP is required to accommodate the committed approvals as well as potential new services based on the uncommitted reserve. The Bobcaygeon WPCP will reach 100% capacity at approximately 4,600 residents. Based on an existing serviced population of 3,500 residents and 2.3 persons per unit, this estimate equates to 475 additional residential units. Figure 4-3: Bobcaygeon WPCP Flow Projections
4.5 Sewer Collection System The 2025 Uncommitted Wastewater Reserve and 2051 Uncommitted Wastewater Reserve for Bobcaygeon can be seen in the following figures. The uncommitted reserve units are determined for each pipe, reflecting the number of units that can be added based on the excess capacity within the pipe, as described in Section 2.2.
Project Number 10599 January 2025
Page | 16
¯ Legend Settlement Boundary
Manhole Freeboard < 1.80m
Uncommitted Reserve < 1,500 Units 1,500 - 3,000 Units 3,000 - 4,500 Units > 4,500 Units
TY Lin Project #: 10599
Kawartha Lakes W-WW Master Plan Bobcaygeon 2025 Uncommitted Reserve 0
500
1,000
1,500
2,000 Meters
SCALE:1:20,000
Sources: Esri, HERE, Garmin, Intermap, increment P Corp.,
DRAWN BY: AT
DATE: January 2025
¯ Legend Settlement Boundary
Manhole Freeboard < 1.80 m
Uncommitted Reserve < 1,500 Units 1,500 - 3,000 Units 3,000 - 4,500 Units > 6,000 Units
TY Lin Project #: 10599
Kawartha Lakes W-WW Master Plan Bobcaygeon 2051 Uncommitted Reserve 0
500
1,000
1,500
2,000 Meters
SCALE:1:20,000
Sources: Esri, HERE, Garmin, Intermap, increment P Corp.,
DRAWN BY: AT
DATE: January 2025
Technical Memorandum 7 Kawartha Lakes Water-Wastewater Master Plan Capacity Assessment
5 FENELON FALLS 5.1 Water Treatment Plant The Fenelon Falls Water Treatment Plant has a rated maximum day capacity of 4,100 m3/d. Based on the anticipated demand projections shown in Figure 5-1, the WTP will reach 80% of its rated capacity when the population of Fenelon Falls reaches approximately 4,300 residents, and 100% capacity at 5,300 residents. Based on an existing serviced population of 2,100 residents and 2.3 persons per unit, these estimates equate to 940 and 1,400 additional residential units respectively. Figure 5-1: Fenelon Falls WTP Demand Projections
Fenelon Falls WTP Demand Projections 6,000
Max Day Demand (m3/d)
5,000
P2
4,000
3,000
P1
Plan for Plant Upgrade
2,000
1,000
Existing
2,000
2,500
3,000
3,500
4,000
4,500
5,000
5,500
6,000
6,500
Population Projected MDD
Existing Capacity
80% Capacity
5.2 Water Storage There is currently 2,450 m3 of storage available in Fenelon Falls standpipe located at 18 Church Street. The standpipe has a total height of 31 m and a diameter of 10 m. The facility is not equipped with a booster pumping station at the base.
Project Number 10599 January 2025
Page | 19
Technical Memorandum 7 Kawartha Lakes Water-Wastewater Master Plan Capacity Assessment
Figure 5-2: Fenelon Falls Water Storage Projections
Fenelon Falls Water Storage Projections 3,000
P2
Storage volume (m3)
2,500
2,000
1,500
P1
1,000
Existing
Plan for Plant Upgrade
500
2,000
2,500
3,000
3,500
4,000
4,500
5,000
5,500
6,000
6,500
Population Water Storage Required
Existing Capacity
80% Capacity
Based on the anticipated demand projections and storage requirements shown in Figure 5-2 the existing water storage in Fenelon Falls is insufficient to service the existing condition and P1 without construction of a booster pumping station at the base. With the booster pumping station shown in Figure 5-3, required storage will reach 80% of its total storage capacity at approximately 3,950 residents and 100% of its capacity at approximately 5,050 residents as shown in Figure 5-3. Based on an existing serviced population of 2,502 residents and 2.3 persons per unit, these estimates equate to respectively 600 and 1,100 additional residential units.
Project Number 10599 January 2025
Page | 20
Technical Memorandum 7 Kawartha Lakes Water-Wastewater Master Plan Capacity Assessment
Figure 5-3: Fenelon Falls Water Storage Projections with Booster Pumping Station
Fenelon Falls Water Storage Projections 3,000
P2
Storage volume (m3)
2,500
2,000
1,500
Plan for Plant Upgrade
P1
1,000
Existing
500
2,000
2,500
3,000
3,500
4,000
4,500
5,000
5,500
6,000
6,500
Population Water Storage Required
Existing Capacity
80% Capacity
5.3 Water Distribution System The 2025 Uncommitted Water Reserve and 2051 Uncommitted Water Reserve for Fenelon Falls can be seen in the following Figures. The uncommitted reserve units are determined for each node, reflecting the number of units that can be added based on the available excess flow as described in Section 2.1. It is important to note that dead ends within the water distribution system may provide adequate flow but tend to have lower pressures due to the absence of looping.
Project Number 10599 January 2025
Page | 21
RT
RA IL
NO
¯
IN E
USH T
HL
S UG
AD
AR B
RO
LOUIS A ST 12
1
REET AD UN
ST IN
CE
!
S
S
S
DD
Settlement boundary
AL
PR
DO
!
!
CO
RT BE
! ! !
ST RE
TR EE
T
! W ES ! ! T
ET
!
!
T ST SHO R!
!
ST
RE
ET
RE ST NE
OR
ET RE
E
ST
!
EE
T
WA Y
TR
NS
R IV YD
ON
ED
I FT
EE TR
NN KE
!
MU
RR
JU
!!
AY S
DS LIN
T
AY S
RA TE VE
201 -300 mm
D
!
OA
D
! !
NI
!
! !
DA
TR
!
! ! !! !
!! !
T
LI S
D
!! !!
EE
J AN
> 3,000 Units
OA
!
TR
!
!
2,000 - 3,000 Units
NR
TS
1,000 - 2,000 Units
151 - 200 mm
O IN
LI O
E R IV
SS IO
EL
!
< 1,000 Units
101 - 150 mm
NP
!
! ! !
!
ET T RE !
NCE
!
ET
IN S
EO
ET
EL G
!
Pump
<= 100 mm
RG
! ! !
Reservoir
Diameter
!
CO
T RE
D
!
!
!
STU
GS
E
! !
N
OA
HEL
RE N ST
!
!
!
!
EET
ER D8
!
STR
IO L R OA
!
Tank
Uncommitted Reserve
8
!
! ! !! ! !
T
AD
!
!!
! ! ! !
ST
WE
OR
C
TY O UN
EE
!
!
CL
TR
!
KIN
!
$!
CO
KS
!
!
# RO
! !
!
! OA
!
!
!
"
!
LB
!
$
!! !!
!
ET
RE ST HN JO
!
!
!
!
!
!
!
!! ! # # # " "
!
!
!
! !
!
ET
!
! ! ! ! !!
!
! !!
TY
EN
! !
!
UN
!! QU E
!! ! !! !
!
R EET
CO
!
!
Legend
TY
RE
RO
ET
GAB LE STR EET
!
PE
R
!
ST
RE
ET
! !
! !
!
!!
! ! !
WO
OD
! !
TYLin Project #10599 RIV ER
!
R IA
D RIV
US T
E ET
IN D
!
T
ST R
CH
EN
ICE
WY
SC
EL L
!
E CR
!
E
L PA RK
N
T RE
ET
E AS
T
CO UNTY RO
IVE
AD 121
DR
F RA
!
S C IS
RA
Kawartha Lakes W-WW Master Plan
BY ST RE
WE
ET
ST STR EET SO U
Fenelon Falls 2025 Uncommitted Water Reserve
Kilometers 2 TH
0
0.25
0.5
1
1.5
SCALE:1:15,000
Sources: Esri, HERE, Garmin, Intermap, increment P Corp.,
DRAWN BY: AT
DATE: January 2025
RT
RA IL
NO
¯
IN E
USH T
HL
S UG
AD
AR B
RO
LOUIS A ST 12
1
REET AD UN
ST IN
CE
!
S
S
S
DD
Settlement boundary
AL
PR
DO
!
!
CO
RT BE
! ! !
ST RE
TR EE
T
! W ES ! ! T
ET
!
!
T ST SHO R!
!
ST
RE
ET
RE ST NE
OR
$!
ET RE
EE
T
WA Y
TR
NS
EE TR !
MU
RR
JU
!!
AY S
DS LIN
T
AY S
RA TE
R IV
D
VE
OA
YD
! !
NI
!
! !
!
TR
! !! !
D
O IN
!
!
DA
!
D
!! !!
!! !
T
LI S
200 - 300 mm
NP
!
EE
J AN
> 3,000 Units
OA
!
TR
!
NR
TS
SS IO
LI O
E R IV
NCE
EL
!
1,000 - 2,000 Units
150 - 200 mm
EO
ET
!
! ! !
!
ET T RE !
CO
T RE ET
IN S
RG
GS
D
!
PE
R
!
ST
RE
ET
! !
! !
!
!!
! ! !
CH
WO
OD
T
! !
TYLin Project #10599 RIV ER
!
R IA
D RIV
US T
E ET
IN D
!
EN
ST R
WY
SC
ICE
!
E CR
EL L
!
EL G
!
< 1,000 Units
100 - 150 mm
STU
KIN
E
RE N ST
! !
N
OA
HEL !
!
! ! ! !
!
EET
ER D8
STR
IO L R OA
!
ST
WE
OR
C
TY O UN
! ! !
Pump
< = 100 mm
!
ED
! !
!
E
ST ON I FT
! !! !!
Reservoir
Diameter
!
!
NN
!
T
!
KE
!
EE
Tank
Uncommitted Reserve
8
!
CL
TR
AD
!
!
! !
!
!
!!
CO
KS
# RO
! !
!
!
OA
!
!
!
"
!
LB
!
$
!! !!
! !
!
ET
RE ST HN JO
!
!
!
!
!
!
!
! ! # # # " " !
!
!
!
!
ET
!
!! ! ! ! !
!
! !!
TY
EN
! !
!
UN
!! QU E
!! ! !! !
!
R EET
CO
!
!
Legend
TY
RE
RO
ET
GAB LE STR EET
!
!
E
L PA RK
N
T RE
ET
E AS
T
CO UNTY RO
IVE
AD 121
DR
F RA
!
S C IS
RA
Kawartha Lakes W-WW Master Plan
BY ST RE
WE
ET
ST STR EET SO U
Fenelon Falls 2051 Uncommitted Water Reserve
Kilometers 2 TH
0
0.25
0.5
1
1.5
SCALE:1:15,000
Sources: Esri, HERE, Garmin, Intermap, increment P Corp.,
DRAWN BY: AT
DATE: January 2025
Technical Memorandum 7 Kawartha Lakes Water-Wastewater Master Plan Capacity Assessment
5.4 Wastewater Treatment Plant The Fenelon Falls WWTP has a rated Average Day Flow (ADF) capacity of 1,800 m³/d, with the current ADF demand at 1,120 m³/d, which is 62% of the rated capacity. Additionally, 908 m³/d of flow has been committed through planning approvals up to 2051. The total of existing and committed approvals amounts to 2,708 m³/d, exceeding the rated capacity. Therefore, an expansion of the WPCP is required to accommodate the committed approvals as well as potential new services based on the uncommitted reserve. Based on the anticipated demand projections shown in Figure 5-4, the WPCP will reach 80% of its average day rated capacity when the population of Fenelon Falls reaches approximately 3,200 residents, and 100% capacity at 3,900 residents. Based on an existing serviced population of 2,500 residents and 2.3 persons per unit, these estimates equate to 300 and 800 additional residential units respectively. Figure 5-4: Fenelon Falls WPCP Flow Projections
Fenelon Falls WPCP Flow Projections 3,000
Plan for Plant Upgrade
Average Day Flow (m3/d)
2,500
P2
2,000
1,500
P1
1,000
Existing
500
2,000
2,500
3,000
3,500
4,000
4,500
5,000
5,500
6,000
6,500
Population Projected ADF
Existing Capacity
80% Capacity
5.5 Sewer Collection System The 2025 Uncommitted Wastewater Reserve and 2051 Uncommitted Wastewater Reserve for Fenelon Falls can be seen in the following figures. The uncommitted reserve units are determined for each pipe, reflecting the number of units that can be added based on the excess capacity within the pipe, as described in Section 2.2.
Project Number 10599 January 2025
Page | 24
RT
RA IL
NO
¯
IN E
USH T
HL
S UG
AD
AR B
RO
LOUIS A ST CE
DD
Settlement boundary
AL
IN
DO
PR
BE
CO
RT
UN
ST
TY
RE
RO
ET
AD
12
1
REET
GAB LE STR EET
Legend
S
S
S
ST RE ET
TR EE
TW
Manhole Freeboard
ES T SHO R
Uncommitted Reserve
EE
T
RO
< 1,500 Units AD
1,500 - 3,000 Units
8
3,000 - 4,500 Units > 4,500 Units
R IV ED
T
EE
T
WA Y
NN
T
AY S
TR
NS
EE TR MU
RR
AY S
LIN
RA TE
DS
W
ES
CE
NT
PE
R
ST
RE
ET
TYLin Project # 10599
ICE
RIV ER
R IA
D RIV
US T
E ET
IN D
ST R
CH
CR
NI
EL L
WY
D
JU
D OO
OA
T
D
VE
IV E
TR
DR
OA
EE
DA
O IN
TR
LI S
NR
TS
J AN
SS IO
LI O
NCE
EL
NP
ET
D D8 R OA
ET
ET
CO
T RE TR E
T RE
EO
GS EN S
IN S
RG
KIN HEL
N
OA
EET
ER
STR
IO L
ST
WE
OR
C
TY O UN
EL G
STU
KE
EE
YD
ON
TR
I FT
KS
CL
OA
E
ST
RE
ET
CO
LB
OR
NE
JO
ST
HN
RE
ST
ET
RE
ET
TR
TY
NS
UN
EE
< 1.80 m
EET
CO
QU
T S TR
E
L PA RK
N
T RE
ET
E AS
T
CO UNTY RO
IVE
AD 121
DR
F RA
S C IS
RA
Kawartha Lakes W-WW Master Plan
BY ST RE
WE
ET
ST STR EET
Fenelon Falls 2025 Uncommitted Reserve
SO U
Kilometers 2 TH
0
0.25
0.5
1
1.5
SCALE:1:15,000
Sources: Esri, HERE, Garmin, Intermap, increment P Corp.,
DRAWN BY: AT
DATE: January 2025
RT
RA IL
NO
¯
IN E
USH T
HL
S UG
AD
AR B
RO
LOUIS A ST CE
DD
Settlement boundary
AL
IN
DO
PR
BE
CO
RT
UN
ST
TY
RE
RO
ET
AD
12
1
REET
GAB LE STR EET
Legend
S
S
S
ST RE ET
TR EE
TW
Uncommitted Reserve
ES T SHO R
1,500 - 3,000 Units
EE
T
RO
AD
3,000 - 4,500 Units 8
< 4,500 Units
R IV ED
T
EE
T
WA Y
NN
T
AY S
TR
NS
EE TR MU
RR
AY S
LIN
RA TE
DS
W
ES
CE
NT
PE
R
ST
RE
ET
TYLin Project # 10599
ICE
RIV ER
R IA
D RIV
US T
E ET
IN D
ST R
CH
CR
NI
EL L
WY
D
JU
D OO
OA
T
D
VE
IV E
TR
DR
OA
EE
DA
O IN
TR
LI S
NR
TS
J AN
SS IO
LI O
NCE
EL
NP
ET
D D8 R OA
ET
ET
CO
T RE TR E
T RE
EO
GS EN S
IN S
RG
KIN HEL
N
OA
EET
ER
STR
IO L
ST
WE
OR
C
TY O UN
EL G
STU
KE
EE
YD
ON
TR
I FT
KS
CL
OA
E
ST
RE
ET
CO
LB
OR
NE
JO
ST
HN
RE
ST
ET
RE
ET
TR
TY
NS
UN
EE
< 1,500 Units
EET
CO
QU
T S TR
E
L PA RK
N
T RE
ET
E AS
T
CO UNTY RO
IVE
AD 121
DR
F RA
S C IS
RA
Kawartha Lakes W-WW Master Plan
BY ST RE
WE
ET
ST STR EET
Fenelon Falls 2051 Uncommitted Reserve
SO U
Kilometers 2 TH
0
0.25
0.5
1
1.5
SCALE:1:15,000
Sources: Esri, HERE, Garmin, Intermap, increment P Corp.,
DRAWN BY: AT
DATE: January 2025
Technical Memorandum 7 Kawartha Lakes Water-Wastewater Master Plan Capacity Assessment
6 WOODVILLE 6.1 Water Treatment Plant The Woodville Water Treatment Plant has a rated maximum day capacity of 588 m3/d. Based on the anticipated demand projections shown in Figure 6-1, the WTP will reach 80% of its rated capacity when the population of Woodville reaches approximately 720 residents and 100% capacity at 815 residents. Based on an existing serviced population of 619 residents and 2.3 persons per unit, these estimates equate to 40 and 80 additional residential units respectively. Figure 6-1: Woodville WTP Demand Projections
Woodville WTP Demand Projections 900
Buildout
Max Day Demand (m3/d)
800 700 600 500 400 300
Plan for Plant Upgrade
Existing
200 100 600
650
700
750
800
850
900
950
1,000
1,050
Population Projected MDD
Existing Capacity
80% Capacity
6.2 Water Storage The Woodville standpipe is capable to supply fire storage and has sufficient storage capacity for the forecasted buildout population.
Project Number 10599 January 2025
Page | 27
Technical Memorandum 7 Kawartha Lakes Water-Wastewater Master Plan Capacity Assessment
Figure 6-2: Woodville Water Storage Projections
Woodville Water Storage Projections 1,400
Storage volume (m3)
1,200 1,000 800 600 400 200 600
650
700
750
800
850
900
950
1,000
1,050
Population Water Storage Required
Existing Capacity
80% Capacity
6.3 Water Distribution System The 2025 Uncommitted Water Reserve and 2051 Uncommitted Water Reserve for Woodville can be seen in the following figures. The uncommitted reserve units are determined for each node, reflecting the number of units that can be added based on the available excess flow as described in Section 2.1. It is important to note that dead ends within the water distribution system may provide adequate flow but tend to have lower pressures due to the absence of looping.
Project Number 10599 January 2025
Page | 28
¯ ! !!
+ $
! !
!
!
!
!
!!
!
!
!
!
!! !
!!
!
!
!
! !!
! !
!
!
Legend
!! !
!
!
!
!
! ! !
Settlement boundary
!!
!
! !
! !
!
+ $
!
Tank
Reservoir
!
!
#
Pump
!
< 1,000 Units
Uncommitted Reserve
!
!
1,000 - 2,000 Units
!
> 3,000 Units
Diameter
<= 100 mm
101 - 150 mm 151 - 200 mm
TYLin Project #: 10599
Kawartha Lakes W-WW Master Plan
0
125
250
500
750
1,000 Meters
Woodville 2025 Uncommitted Water Reserve
!
!
#
!!
SCALE:1:15,000
Sources: Esri, HERE, Garmin, Intermap, increment P Corp.,
DRAWN BY: AT
DATE: January 2025
¯ !
!
! !!
+ $
! !
!
!
!
!
!
!!
! !
!
!
!
!
!
!
!! !
!!
! !
!
!
!
!
!
!
Legend
!!
!
!
!
!
!
! !
!
! !! !
!!
!
!
Settlement boundary
! ! !
!
+ $
Tank
Reservoir
!
#
Pump
!
< 1,000 Units
Uncommitted Reserve
!
!
1,000 - 2,000 Units
!
2,000 - 3,000 Units
!
> 3,000 Units
Diameter
<= 100 mm
101 - 150 mm 151 - 200 mm
TYLin Project #: 10599
Kawartha Lakes W-WW Master Plan
0
125
250
500
750
1,000 Meters
Woodville 2051 Uncommitted Water Reserve
!
!
#
!!
SCALE:1:15,000
Sources: Esri, HERE, Garmin, Intermap, increment P Corp.,
DRAWN BY: AT
DATE: January 2025
Technical Memorandum 7 Kawartha Lakes Water-Wastewater Master Plan Capacity Assessment
7 OMEMEE 7.1 Wastewater Treatment Plant The Omemee WPCP has a rated Average Day Flow (ADF) capacity of 1,353 m³/d, with the current ADF demand at 788 m³/d, which is 58% of the rated capacity. Additionally, 473 m³/d of flow has been committed through planning approvals up to 2051. The total of existing and committed approvals amounts to 1,261 m³/d, which does not exceed the rated capacity. Based on Figure 7-1, there is sufficient capacity at the WPCP for the full buildout population of Omemee. Treatment plant capacity upgrades should be considered when 80% of its rated capacity reaches are met which is at approximately 2,100 residents. Based on an existing serviced population of 1,035 residents and 2.3 persons per unit, these estimates equate to 450 additional residential units. Figure 7-1: Omemee WPCP Flow Projections
7.2 Sewer Collection System The 2025 Uncommitted Wastewater Reserve and 2051 Uncommitted Wastewater Reserve for Omemee can be seen in the following figures. The uncommitted reserve units are determined for each pipe, reflecting the number of units that can be added based on the excess capacity within the pipe, as described in Section 2.2.
Project Number 10599 January 2025
Page | 31
¯ Legend Settlement Boundary
Uncommitted Reserve < 2,0000 Units
2,000 - 4,000 Units 4,000 - 6,000 Units > 6,000 Units
TYLin Project #: 10599
Kawartha Lakes W-WW Master Plan Omemee 2025 Uncommitted Reserve 0
125
250
500
750
1,000 Meters
SCALE:1:15,000
Sources: Esri, HERE, Garmin, Intermap, increment P Corp.,
DRAWN BY: AT
DATE: January 2025
¯ Legend Settlement Boundary
Uncommitted Reserve < 2,000 Units
2,000 - 4,000 Units 4,000 - 6,000 Units > 6,000 Units
TYLin Project #: 10599
Kawartha Lakes W-WW Master Plan Omemee 2051 Uncommitted Reserve 0
125
250
500
750
1,000 Meters
SCALE:1:15,000
Sources: Esri, HERE, Garmin, Intermap, increment P Corp.,
DRAWN BY: AT
DATE: January 2025
Prepared For The City of Kawartha Lakes
Flow Monitoring Report For Kawartha Lakes Water and Wastewater Servicing Capacity Master Plan Update
June 4, 2024
330 Rodinea Road, Unit 3 Vaughan, Ontario, Canada L6A 4P5
(905) 417-9792
www.civi.ca
City of Kawartha Lakes Kawartha Lakes Master Plan – Flow Monitoring Report June 4, 2024
STATEMENT OF QUALIFICATIONS AND LIMITATIONS The attached Report (the “Report”) has been prepared by Civica Infrastructure Inc. (the “Consultant”) at the request of, and for the exclusive use of, the City of Kawartha Lakes (the “Client”) in accordance with the terms of agreement between the Consultant and the Client, including the scope of work detailed therein (the “Agreement”). Please note that the information, data, analysis, recommendations, and conclusions contained in the Report was prepared for the specific purposes described in the Report and the Agreement and may be based upon information which has not been independently verified by the Consultant. The Consultant shall be entitled to rely upon the accuracy and completeness of information that was provided to the Consultant and has no obligation to update such information. The material in this report reflects the Consultant’s best professional judgement in the light of the information available to it at the time of preparation and publication. The Consultant agrees that the Report represents its professional judgement as described above and that the Information has been prepared for the specific purpose and use described in the Report and the Agreement. The Consultant makes no other representations, any guarantees or warranties whatsoever, whether expressed or implied, with respect to the Report or any part thereof. The Report is to be treated as confidential and may not be used or relied upon by third parties, except as agreed in writing by the Consultant and the Client. Neither possession of the Report, nor a copy of it, carries the right of publication. The Report shall not be disclosed, produced or reproduced, in whole or in part, neither published in any manner, without the written consent of the Consultant and the Client. The Consultant expressly excludes liability to any party except the Client for either any use of or reliance upon the Report. This Statement of Qualifications and Limitations is attached to and forms part of the Report and any usage of the Report is subject to the terms therein.
Page 2
Civica Infrastructure Inc. 330 Rodinea Road, Unit 3, Vaughan, Ontario, Canada, L6A 4P5 905-417-9792 | www.civi.ca | info@civi.ca
June 4, 2024
CIVICA Ref: KAW22-0003
City of Kawartha Lakes 26 Francis Street Lindsay, Ontario K9V 5R8 Attention: Mr. Nafiur Rahman, P.Eng.,PMP
Supervisor, Environmental Capital Project Management Infrastructure Design and Construction, Engineering and Corporate Assets City of Kawartha Lakes
Dear Mr. Nafiur, RE: Kawartha Lakes Water and Watewater Servicing Capacity Master Plan Update – Flow Monitoring Report Civica Infrastructure Inc. (Civica) is pleased to submit this final report on the flow monitoring results collected in support of the City of Kawartha Lakes Water and Wastewater Servicing Capacity Master Plan Update. This document outlines the flow monitoring results and details the flow metrics for the monitored areas. The objective is to determine the flow conditions at the monitoring locations to understand how the existing system is currently functioning. Summary of Findings: Monitoring Period: •
Flow monitoring data was collected over a nine-month period from January 2023 to October 2023.
•
Data from a previous flow monitoring program implemented in Lindsay from November 2021 to November 2022, was also included in this analysis.
Monitoring Stations: A total of thirty-seven (37) flow monitoring stations were analized across Lindsay, Fenelon Falls, and Bobcaygeon. •
Lindsay: 27 stations (12 from the November 2021 to November 2022 period, and 15 stations from the January 2023 to October 2023 period)
•
Fenelon Falls: 3 stations
•
Bobcaygeon: 7 stations
Rainfall Data: Seven (9) Civica rain gauges were used to analyze rainfall data.
Civica Infrastructure Inc. • 330 Rodinea Road, Unit 3, Vaughan, Ontario, Canada, L6A 4P5 • 905-417-9792 | www.civi.ca | info@civi.ca
City of Kawartha Lakes Kawartha Lakes Master Plan – Flow Monitoring Report June 4, 2024
•
Lindsay: 5 gauges (2 from the November 2021 to November 2022 period, and 3 gauges from the January 2023 to October 2023 period)
•
Fenelon Falls: 2 gauges
•
Bobcaygeon: 2 gauges
Dry-Weather Flow Metrics: •
•
•
Lindsay: o
Average: 470 L/c/d
o
Maximum: 874 L/c/d (at 5-1a)
o
Minimum: 60 L/c/d (at 6-3)
Fenelon Falls: o
Average: 575 L/c/d
o
Maximum: 653 L/c/d (at F3)
o
Minimum: 462 L/c/d (at F1)
Bobcaygeon: o
Average: 379 L/c/d
o
Maximum: 939 L/c/d (at B5)
o
Minimum: 109 L/c/d (at B6)
Projected 25-Year Inflow/Infiltration (I/I) Rates: •
•
Lindsay: o
Average: 0.82 L/s/ha
o
Maximum: 2.39 L/s/ha (at 4-1)
o
Minimum: 0.18 L/s/ha (at L7)
Fenelon Falls: o
Average: 0.52 L/s/ha
o
Maximum: 0.73 L/s/ha (at F2)
o
Minimum: 0.29 L/s/ha (at F3)
Civica Infrastructure Inc. • 330 Rodinea Road, Unit 3, Vaughan, Ontario, Canada, L6A 4P5 • 905-417-9792 | www.civi.ca | info@civi.ca
City of Kawartha Lakes Kawartha Lakes Master Plan – Flow Monitoring Report June 4, 2024
•
Bobcaygeon: o
Average: 0.38 L/s/ha
o
Maximum: 0.97 L/s/ha (at B6)
o
Minimum: 0.12 L/s/ha (at B9)
The flow meters captured consistent daily dry-weather patterns, residential peaks occurred during typical daily routines, while ICI areas showed higher variability during business hours. High I/I was observed at many monitoring sites, particularly in areas with numerous ICI properties, which align with both wetweather and dry-weather results. To address these issues, continued flow monitoring and additional techniques such as smoke and dye testing, CCTV, and manhole inspections are recommended. Establishing a wet-weather flow reduction program and prioritizing rehabilitation and maintenance will help manage and reduce I/I. Implementing I/I reduction measures will improve the capacity of existing sewer systems, reducing the need for extensive expansions and supporting sustainable growth. This comprehensive analysis provides valuable insights into the current state of the water and wastewater systems across the monitored communities. The findings highlight areas of strength and identify critical areas needing attention to ensure the sustainable and efficient operation of the systems. Do not hesitate to contact us for further clarification and/or comment. Sincerely, CIVICA INFRASTRUCTURE INC.
Ilmar Simanovskis, P. Eng Project Manager cc: Nafiur Rahman, City of Kawartha Kevin Brown, TyLin Yuliana Zambrano, Civica Briana Sullivan, Civica Encl.
Kawartha Lakes Water and Wastewater Servicing Capacity Master Plan Update – Flow Monitoring Report
Civica Infrastructure Inc. • 330 Rodinea Road, Unit 3, Vaughan, Ontario, Canada, L6A 4P5 • 905-417-9792 | www.civi.ca | info@civi.ca
City of Kawartha Lakes Kawartha Lakes Master Plan – Flow Monitoring Report June 4, 2024
Document History & QA/QC Prepared by:
Yuliana Zambrano, B. Eng Project Manager Civica Infrastructure Inc.
Briana Sullivan, EIT Intermediate Project Analyst Civica Infrastructure Inc.
Authorised for Release:
Ilmar Simanovskis, P. Eng Project Manager Civica Infrastructure Inc.
Revision History Name
Date
Reason for Change
Version
Briana Sullivan
2024-02-01
First Draft
Version 1
Yuliana Zambrano
2024-06-03
First Submission
Version 2
Civica Infrastructure Inc. • 330 Rodinea Road, Unit 3, Vaughan, Ontario, Canada, L6A 4P5 • 905-417-9792 | www.civi.ca | info@civi.ca
City of Kawartha Lakes Kawartha Lakes Master Plan – Flow Monitoring Report June 4, 2024
TABLE OF CONTENTS
1.0 Introduction ............................................................................................................................. 1 1.1 Objectives...................................................................................................................................... 1 1.2 Selection of Flow Monitoring Locations ....................................................................................... 1 1.3 Study Area..................................................................................................................................... 1 2.0 Methodology............................................................................................................................ 4 2.1 Rainfall Monitoring ....................................................................................................................... 4 2.2 Flow Monitoring............................................................................................................................ 4 2.3 Data QA/QC and Process .............................................................................................................. 4 2.4 Analysis of Flow Monitoring Data ................................................................................................. 5 2.5 Inflow and Infiltration (I/I) Analysis .............................................................................................. 6 3.0 Summary of Results .................................................................................................................. 7 3.1 Rainfall Analysis............................................................................................................................. 7 3.2 Dry-Weather Flow Analysis......................................................................................................... 15 3.3 Wet-Weather Flow Analysis........................................................................................................ 18 3.4 I/I Projections.............................................................................................................................. 20 4.0
Conclusions ............................................................................................................................ 24
List of Figures Figure 1-1: Study Area – Lindsay................................................................................................................... 1 Figure 1-2: Study Area - Fenelon Falls .......................................................................................................... 2 Figure 1-3: Study Area - Bobcaygeon............................................................................................................ 3 Figure 2-1: Sanitary Flow Components......................................................................................................... 6 List of Tables Table 1-1: Flow Monitoring and Rain Gauge Locations – Lindsay (2023)..................................................... 1 Table 1-2: Flow Monitoring and Rain Gauge Locations – Fenelon Falls (2023)............................................ 2 Table 1-3: Flow Monitoring and Rain Gauge Locations – Bobcaygeon (2023) ............................................. 3 Table 3-1: Rain Gauges Assigned to Flow Monitoring Stations – Lindsay .................................................... 7 Table 3-2: Rain Gauges Assigned to Flow Monitoring Stations – Fenelon Falls ........................................... 8 Table 3-3: Rain Gauges Assigned to Flow Monitoring Stations – Bobcaygeon............................................. 8 Table 3-4: Rainfall Event Characteristics for RG1 – Lindsay.......................................................................... 9 Table 3-5: Rainfall Event Characteristics for RG2 – Lindsay........................................................................ 10 Table 3-6: Rainfall Event Characteristics for RG3 – Lindsay........................................................................ 11 Table 3-7: Rainfall Event Characteristics for RG01_2022 – Lindsay............................................................ 11 Table 3-8: Rainfall Event Characteristics for RG02_2022 – Lindsay............................................................ 12 Table 3-9: Rainfall Event Characteristics for RG1 – Fenelon Falls............................................................... 12 Table 3-10: Rainfall Event Characteristics for RG2 – Fenelon Falls............................................................. 13 Table 3-11: Rainfall Event Characteristics for RG1 – Bobcaygeon.............................................................. 14 Table 3-12: Rainfall Event Characteristics for RG2 – Bobcaygeon.............................................................. 14 Table 3-13: Dry-Weather Flow Analysis – Lindsay ...................................................................................... 15 Civica Infrastructure Inc. • 330 Rodinea Road, Unit 3, Vaughan, Ontario, Canada, L6A 4P5 • 905-417-9792 | www.civi.ca | info@civi.ca
City of Kawartha Lakes Kawartha Lakes Master Plan – Flow Monitoring Report June 4, 2024
Table 3-14: Dry-Weather Flow Analysis – Fenelon Falls ............................................................................. 17 Table 3-15: Dry-Weather Flow Analysis – Bobcaygeon .............................................................................. 17 Table 3-16: Wet-Weather Flow Analysis – Lindsay..................................................................................... 18 Table 3-17: Wet-Weather Flow Analysis – Fenelon Falls............................................................................ 19 Table 3-18: Wet-Weather Flow Analysis – Bobcaygeon ............................................................................. 20 Table 3-19: Flow Monitoring I/I Projection Results – Lindsay .................................................................... 20 Table 3-20: Flow Monitoring I/I Projection Results – Fenelon Falls ........................................................... 22 Table 3-21: Flow Monitoring I/I Projection Results – Bobcaygeon............................................................. 22
Appendices Appendix A: Flow Monitoring Report Appendix B: 25-Year I/I Projections
Civica Infrastructure Inc. • 330 Rodinea Road, Unit 3, Vaughan, Ontario, Canada, L6A 4P5 • 905-417-9792 | www.civi.ca | info@civi.ca
City of Kawartha Lakes Kawartha Lakes Master Plan – Flow Monitoring Report June 4, 2024
Definition of Terms Average Annual Flow - The total annual volume divided by 365 days. This value is approximated by the mean of the twelve monthly average flows. Average Annual Infiltration - The average of the monthly minimum flows. Average Annual Inflow - From the average annual flow, subtract the base sanitary flow and average annual infiltration. Average Dry Weather Flow (ADW) - Flow during a period of extended dry weather (7 to 14 days) and seasonally high groundwater. Flow includes sanitary flow and infiltration, and excludes significant industrial and commercial flows (assumes no inflow during dry weather conditions). Base Sanitary Flow (BSF) - The portion of wastewater which includes domestic, commercial, institutional, and industrial sewage and specifically excludes infiltration and inflow. (See Estimating Base Flow, below). Direct Inflow Volume- The portion of total inflow volume which is from direct connections to the collection system such as catch basins, roof leaders, manhole covers, etc. These inflow sources allow stormwater runoff to rapidly impact the collection system. Dry Weather Flow (DWF) - All flow in a sewer (includes sanitary flow and infiltration) except that caused directly by rainfall. Measured during a period of extended dry weather (7 to 14 days) and seasonally high groundwater. Groundwater Infiltration (GWI) – Measured during average dry weather flow period (see above). The average of the low nighttime flows (midnight to 6 am) per day for the same time period, minus significant industrial or commercial nighttime flows. Hydrograph - A graph showing stage (the height of a water surface above an established datum plane), flow, velocity, or other property of water with respect to time. Infiltration - Water other than sanitary wastewater that enters a sewer system from the ground through defective pipes, pipe joints, connections, or manholes. Infiltration does not include inflow. Inflow - Water other than sanitary wastewater that enters a sewer system from sources such as roof leaders, cellar/foundation drains, yard drains, area drains, drainsfrom springs and swampy areas, manhole covers, cross connections between storm sewers and sanitary sewers, and catch basins. Inflow does not include infiltration. Inflow volume - The total volume of inflow from a single storm event including both direct and delayed inflow. Total inflow is the area between the storm event hydrograph and the dry weather hydrograph. Maximum Daily Flow - The highest flow during a 24 hour period. Maximum Daily Infiltration - The highest daily flow at seasonal high groundwater after a dry period of three days or more minus the base sanitary flow. Maximum Weekly Infiltration - The highest 7 day average flow at high groundwater after a dry period of three or more days minus the base sanitary flow.
Civica Infrastructure Inc. • 330 Rodinea Road, Unit 3, Vaughan, Ontario, Canada, L6A 4P5 • 905-417-9792 | www.civi.ca | info@civi.ca
City of Kawartha Lakes Kawartha Lakes Master Plan – Flow Monitoring Report June 4, 2024
Maximum Monthly Infiltration - The highest monthly average flow during dry or minimal rain period minus the base sanitary flow. Maximum Daily Inflow - The highest daily wet weather flow minus the base sanitary flow and the infiltration prior to the rain event. Maximum Weekly Inflow (includes delayed infiltration) - The highest 7 day average wet weather flow minus the base sanitary flow and the infiltration prior to the rain event. Maximum Monthly Inflow - The highest monthly flow after subtracting the base sanitary flow and infiltration. Peak Hourly Dry Weather Flow - The highest one hour flow after a dry period of three or more days. Peak Hourly Inflow - The highest one hour flow rate during wet weather minus the base sanitary flow and the infiltration prior to the rain event. Peak Hourly Wet Weather Flow – The highest one hour flow during a significant rain event. Peak Infiltration- The highest nighttime (midnight to 6 am) flow during high groundwater (usually in early spring). Peak Instantaneous Wet Weather Flow - The peak flow during a significant rain event day when the ground water is seasonally high. Peaking Factor - The ratio of peak hourly flow to average daily flow. Rainfall-derived inflow/infiltration (RDII) - Extraneous flows, both inflow and infiltration, derived from rainfall. RDII is typically assumed to be comprised of the fast response component (inflow) and the slow response component (infiltration).Rainfall-Induced Infiltration - The short-term increase in infiltration which is the result of a rain event. Rainfall-induced infiltration is a portion of delayed inflow. Wet Weather Flow- The highest daily flow during and immediately after a significant storm event. Includes sanitary flow, infiltration and inflow.
Civica Infrastructure Inc. • 330 Rodinea Road, Unit 3, Vaughan, Ontario, Canada, L6A 4P5 • 905-417-9792 | www.civi.ca | info@civi.ca
City of Kawartha Lakes Kawartha Lakes Master Plan – Flow Monitoring Report June 4, 2024
1.0 Introduction Civica Infrastructure Inc. (Civica) was retained by TYLin to perform flow monitoring of the sanitary sewers located in the City of Kawartha Lakes. The primary flow monitoring assignment was conducted over a nine-month period, from January 2023 to October 2023. Additional data from a previous flow monitoring period in Lindsay, covering November 2021 to November 2022, was included in this analysis. This report summarizes the sanitary sewer flow monitoring results for the entire monitoring period.
1.1
Objectives
The objective of this project was to install, operate, and analyze the data collected from flow meters installed within the sanitary sewers. The primary purpose of the flow monitoring is to determine dryweather flow metrics and wet-weather flow at the selected locations in Kawartha Lakes. The collected flow data will be used to determine the flow conditions at the monitoring locations to understand how the existing system is currently working.
1.2
Selection of Flow Monitoring Locations
The flow monitoring locations were selected by Civica Infrastructure Inc. and were approved by the City of Kawartha Lakes. Upon site inspection, it was concluded that sixteen (16) of the sites were appropriate for the installation of A/V sensor along with a Downward Ultrasonic sensor to provide redundancy. At the remaining six (6) sites L4, L7, B4, B8, B9, and B10, a Downward Ultrasonic sensor was used in combination with a flume due to the low flows observed. Therefore, Detectronic (Detec) flow meters were used at twenty-two (22) stations. Additionally, flow data from an extra 15 stations in Lindsay, covering the period from November 2021 to November 2022, was included in this analysis.
1.3
Study Area
The study area is located in three communities that belong to the City of Kawartha Lakes, located in Ontario. A schematic showing the flow monitoring locations and rain gauge locations in the three communities of Lindsay, Fenelon Falls, and Bobcaygeon can be seen in Figure 1-1, Figure 1-2, and Figure 1-3, respectively. Table 1-1, Table 1-2, and Table 1-3 provide location summary for each sensor for Lindsay, Fenelon Falls, and Bobcaygeon, respectively.
Page 1
Civica Infrastructure Inc. • 330 Rodinea Road, Unit 3, Vaughan, Ontario, Canada, L6A 4P5 • 905-417-9792 | www.civi.ca | info@civi.ca
Gre ystone St m Ra rge Me
68ha
MillSt
Durha m St W
W olfe St
Ge orge St W
L7
5-2
L6
6ha
Auk Tl
Fie ld sid e Rd
Fieldside Rd W e ld on Rd
PigeonPigLake Rd e on La ke Rd
47ha
L5
L12
41
L2
52
L4
62
L6
64
L8
51a
L3
61
L5
63
L7
65
L9
Dobson St
W he a tfie ld Rd
Kawartha Lakes Water & Wastewater Servicing and Capacity Master Plan Update Highway 36
Figure 1-1 Study Area - Lindsay
W ood vie wRd
Lindsay Lind sa ySSt tS S
Ange line St S
Angeline St S
Brid le Rd
Little Brirain Rd
L1 1
––
157ha
Little Brita in Rd
L10
Ellis Cr
28ha
P * ,
21
L1
66
Pa rksid e Dr
P , * ª * ,
67
23
Ea stvie w
Holtom St
6ha
11
22
Highwa y36
St Ge orge St
45ha 1-1Rive rvie wRd
, , * –ªP– * , Ma ryknollAv * , * , * 1-2 Ka wa rtha Dr Russe llSt E 5-1a – ª– , * Rd
P, , * * , *
12ha
Force m a ins
Dom inion Dr
– ª– – ª–
Future Lnd Ma rySt E – ª––ª–
6-6
Highway 36
id St St Da v id St St Da v
Mount Hope St
20ha
Tra ilwa yLn Duke St
Ha m ilton St
St Pe te r St
24ha
54ha
Swe e tna m Dr
Be a llSt
Ne e d ha m St
Que e n St KingSt
De a ne St
Gle ne lgSt W
Be rtie St
Ke nt St E – – id out St ª R 4-1
Y ork St S
6-5
W illia m St S
– ª– * , Russe llSt W
Sa nita ryPum pingSta tions
12
Brock St
* ,
J ohn St
Ge orgia n St
W e llington St – ª– Pe e lSt
2-3
P * ,
e rlySt Be v
– ª– * , Short Av 29ha
St La wre nc e St
6-3
St Pa ulSt
– ª–
Sa nita ryFlowMonitoring Loca tions ( 27)
2-1 Colborne St E
2-2
* , – , * P, ª– * , * – – * , , ª *
6-2
– ª– , *
Sub-Drainage Areas:
Lo gie St
– ª– , *
W ilson Av
St Pa trick St
– ªª– – –
Legend
Sa nita rySe we rs
W a lsh Rd
Fle e twood Rd
49ha
6-1
Sim coe St
40ha
De nniston St
Ca roline St
38ha
12ha
Huron St
LoriBv
Victoria AvN
Pottinge r St
a m e s St J
37ha
Albe rt St S
Ba ySt
6-7 Ma rySt W
Mcgibbon Bv Ba rr St
Albe rt St N
ay He rita ge W
St J ose ph Rd
Ma d illCr
Ad e la id e St S
d Lof R
Dorm e rRd
L11
Sim pson Rd
De rm ot St
Da nie lCt
is St Fra nc
Sylva n Cr
82ha
W a lla c e Dr
25ha
Eglington St
6-4
Howa rd Av
Ma ple Cr
6ha
* ,
Mid la nd Dr
Re ge nt St
Broa d St
t kS Coo
47ha – ª– L10
Elgin St
SLn Pe e l'
Thrushwood Tl Purple d usk Dr
* ,
– ª– ChurchillCr * ,
He nrySt
Mcd ona gh Dr
Ea kins Cr
47ha
Pa rk R d
– ª–L4
L3
Found Av
Pa rkwa yAv Don Ct
70ha
P * ,
L1
, P* * , – ª– * , Ka re n Dr L2 – – ª * ,
Bond St
Ke nt St W
La ure nt Bv
Bv
Corne ilSt Sinc la irSt
Fa irvie wCt
71ha
Round Tre e Rd
O rcha rd
Fa irAv
Com m e rce Pl
7
Com m e rce Rd
y
– ª– , * L9
Ad e la id e St N
Birc h Ct
Ce d a r Ct
W a lke r St
Ange line St N
Highwa y35
Highway 35
84ha Mcla ughlin Rd
Hi gh wa
Elm Ct
Colborne St W
35 7Highwa y
De wDrop
72ha
O a k St
– ª– L8 * ,
Gre e nfie ld Rd
Mona rch Rd
ste lve Sy
P * ,
Colborne St W
Dew Drop
* ,
la in
W illia m St N – ª–
Ed win St
La ngton Pl Da vid Dr W e stw – – ood ªC t Rd L12 k r a P n i l North La ng Ct
r rD
Monarch Rd
Rich a rd A v
mp Cha
Sa nd e rlingCr
Ela ine Dr
Ed ge wood Dr
Purd yAv 43ha
Lind sa ySt N
Springd a le Dr
Moha wk Dr
W illia m St N
Ca re wBv
O rcha rd Dr
p
Ü
Thunder Bridge Rd
Thund e r Brid ge Rd
Dra wn By:J. H.
Gold e n Mile Rd
Highwa y7
Tra c e y' SHillRd
0
250
500
Da te :Ma y31,2024
1, 000 Me te rs
Kn ox Cr
Legend
Louisa St
Ü
Rd ve o r G ry o ct Vi
St dan Jor
– ª– , *
San i taryFlowMon i tori ng Locati on s ( 3)
P * ,
San i taryPumpi n g Stati on s
Pr i nc es s
St
n eRd North li
rc h
St
ed y D r Ke nn D ea ne St
Elg i n St
sdaDr an li J 10ha
y W
St E
WestStS
RockSt
Elli c eSt
M ur ra y St
C ou n
12 1 yR d Co un t
ch woodCr Wy
St er
P * ,
p ni Ju
ª * ,
t rS pe i
ty R oa d
n Ju
F3
––
F2
––
, * P , * ª
Concession Rd
ns ra te Ve
Wychwood Cr
F3
C li fto n
El li ot tS t
67ha G re en
County R d 121
on Rd essi Con c
r C re oo M
St W
Li nd sa y St
St No rth
G re en
F2
C hu
M ar ke tS t
C ol bo rn e St
Jo hn M ay St
Ki n g St Ci rcl eD r
Bass St
P , *
Helen St
Ev a St
Sh ortSt Pr i nc es s St E
tE sS ci an Fr
Redwi n g Av
ª * ,
Sub-Drainage Areas:
St d ea H
F1
––
Forcemai ns
F1
St
E St nd Bo
St
Coun ty Rd 8
St W
er at W
Cou n tyR oad
Rd ole i r O
O ak St
WestStN
GroveRd
Fr an ci s
Lo ui sa St 96ha
St W
San i tarySewers
St
Q ue en
Bo nd St W
C ol bo rn e
St
DoddSt
Al be rt
St
San i taryMan h oles
Kawartha Lakes Water & Wastewater Servicing and Capacity Master Plan Update Figure 1-2 Study Area - Fenelon Falls
Drawn By:J. H.
0
75
150
Date:May31,2024
300 Meters
ad Ea stStN
Ba la c la v a St
27ha
* , Pª , *
––
Ri v ersi deDr
Forc em a i ns
Fi reRo ute
Sub-Drainage Areas:
St An ne St
He le n
Sna keP oi ntR d
yD r
East St S
Dr
ªP Na v i ga tors Tl , * ––
P , *
* ,
a Pl ci P a tri
B9 B10
ªP , * , * ––
na Dr Ma ri
South Ha rb our Dr 40ha
B9
ª , * P , *
11 ha
CountyRoa d
B8
P orts Dr
Ki ng sw a
36ha
B6
Sa i li ng Cl ub
ngwoodCr Hunti
–– ª , *
B6
––
32ha Ra nc h Rd
KenstoneBea c h Rd
B10
Sa ni ta rySewers
St
ngStE Ki
P * ,
NeedSt
Bolton St
B2
BoydSt
Ea stStS
rk St Pa
tE a lS
ttleBob Dr Li
Rd rk
Ma nc h ester Tl
Rd
d kR Par
a rk
Pa
BerryLn
Sa ni ta ryMa nh oles
B5
t llS Mi
k Oa
a rP Ced
m lsa Ba
d Roa nty u o d C yR k Roc
r Tl Fi
4 d2 R y nt Cou
Sa ni ta ryP um pi ngSta ti ons
B4
B8
d anR ri Estu
P * ,
P –– * ª, * ,
Pa rk
Av
68ha
Front StE
Ca n
B5
Dr y Ba d
St
Ki ngStW
rk R d
n sla I
Mi P nns * ,
Pa
Sa ni ta ryFlowMoni tori ng Loc a ti ons ( 7)
B2
st re Fo e ld O
t er C i Va n
Dr tus c e rf Pe
Ella rdCt
StW Ca na l
M ai n
J oh n St
Hea dSt
Rokeb ySt
Sh ea St
P * ,
DukeSt
a m St lli Wi
Hi llv i ewDr
llRd RussellHi
Rei dSt
WestSt
Cosh'S Rd SRd Cosh '
P , *
a neSt J
rc h Cr Bi
– * , Pª * ,
Queen St
eeLn Ceda rtr
Ct
B4 FrontStW –
Ti nneySt
176ha
St eph Jos
50ha
Wi lde rne ss
Dunn St
North St
P ri nc eStW
lor St ay T
– ª– , *
Hem loc k Cr
Rd 8
Tusc a n Ct
per uni J
Co unt y
West St
Bi c k St
Cou nty Roa d
Legend
Co un ty Ro
Alm a Rd
Ü
Mea dowla rk Cr
La kewoodCr n Bv Austi
Sy lv a n C t
Kawartha Lakes Water & Wastewater Servicing and Capacity Master Plan Update Figure 1-3 Study Area - Bobcaygeon
Dra wn By:J. H.
0
125
250
Da te:Ma y31,2024
500 Meters
City of Kawartha Lakes Kawartha Lakes Master Plan – Flow Monitoring Report June 4, 2024
Table 1-1: Flow Monitoring and Rain Gauge Locations – Lindsay (2023) Station
Address
Lindsay St N, Lindsay, ON Lindsay St N, Lindsay, L2 ON Lindsay St N, Lindsay, L3 ON Barron Blvd, Lindsay, L4 ON 205 Logie St, Lindsay, L5 ON 50 Wolfe St, Lindsay, L6 ON 30 Mary St E, Lindsay, L7 ON 235 Colborne St W, L8 Lindsay, ON 68 McLaughlin Rd, L9 Lindsay, ON 188 Orchard Park Rd, L10 Lindsay, ON 225 Victoria Ave, L11 Lindsay, ON 45 Northlin Park Rd, L12 Lindsay, ON 33 Mary St E, Lindsay, RG1 – Lindsay ON 429 Kent St, Lindsay, RG2 – Lindsay ON 51 Eglinton St, RG3 – Lindsay Lindsay, ON L1
Start Date January 2023
Finish Date October 2023
January 2023
October 2023
January 2023
October 2023
January 2023
October 2023
January 2023
October 2023
January 2023
October 2023
January 2023
October 2023
January 2023
July 2023
January 2023
October 2023
January 2023
October 2023
January 2023
October 2023
January 2023
October 2023
January 2023
October 2023
January 2023
October 2023
January 2023
October 2023
1-1
17 Riverview Rd
December, 2021
June, 2022
1-2
6 Logie St
November, 2021
November, 2022
2-1
76 St David St
April, 2022
October, 2022
2-2
1 Colborne St E
November, 2021
November, 2022
2-3
87 Lindsay St N
November, 2021
November, 2022
4-1
60 Kent St E
December, 2021
November, 2022
5-1a
2 Georgian St
December, 2021
November, 2022
5-2
20 Simcoe St
November, 2021
November, 2022
6-1
4 Colborne St W
November, 2021
August, 2022
Land Use
Equipment Installed
Detec AV + Downward Sensor Residential and Detec AV + ICI Downward Sensor Residential and Detec AV + ICI Downward Sensor Residential and Detec + Downward ICI Sensor and Flume Residential and Detec AV + ICI Downward Sensor Detec AV + Residential Downward Sensor Residential and Detec + Downward ICI Sensor and Flume Residential and Detec AV + ICI Downward Sensor Residential and Detec AV + ICI Downward Sensor Residential and Detec AV + ICI Downward Sensor Residential and Detec AV + ICI Downward Sensor Residential and Detec AV + ICI Downward Sensor Residential and Detec ICI Residential and Detec ICI Residential and Detec ICI Residential and Detec AV + ICI Downward Sensor Residential and Detec AV + ICI Downward Sensor Residential and Detec AV + ICI Downward Sensor Residential and Detec AV + ICI Downward Sensor Residential and Detec AV + ICI Downward Sensor Residential and Detec AV + ICI Downward Sensor Detec AV + Residential Downward Sensor Residential and Detec AV + ICI Downward Sensor Residential Detec AV + Residential
Page 1
Civica Infrastructure Inc. • 330 Rodinea Road, Unit 3, Vaughan, Ontario, Canada, L6A 4P5 • 905-417-9792 | www.civi.ca | info@civi.ca
City of Kawartha Lakes Kawartha Lakes Master Plan – Flow Monitoring Report June 4, 2024
Station
Address
Start Date
Finish Date
Land Use
Residential and 6-21 130 William St N February, 2022 November, 2022 ICI Residential and 6-3 115 William St N November, 2021 November, 2023 ICI Residential and 6-4 30 Cambridge St N November, 2021 November, 2022 ICI Residential and 6-5 9 Sussex St S November, 2021 November, 2022 ICI Residential and 6-6 122 Adelaide St S February, 2022 November, 2022 ICI Residential and 6-7 118 Adelaide St S November, 2021 November, 2022 ICI RG01 (2022) – Residential and 89 St David St May, 2022 February, 2023 Lindsay ICI RG02 (2022) – Residential and 9 York St N October, 2021 February, 2023 Lindsay ICI 1 - Station moved from MH111 to MH (unknown ID) downstream. Same manhole as 6-1
Equipment Installed
Downward Sensor Detec AV + Downward Sensor Detec AV + Downward Sensor Detec AV + Downward Sensor Detec AV + Downward Sensor Detec AV + Downward Sensor Detec AV + Downward Sensor Detec Detec
Table 1-2: Flow Monitoring and Rain Gauge Locations – Fenelon Falls (2023) Station
Address
8 Colborne St, Fenelon Falls, ON 162 Francis St E, F2 Fenelon Falls, ON 33 Ellice St, Fenelon F3 Falls, ON RG1 – Fenelon 69 Ellice St, Fenelon Falls Falls, ON RG2 – Fenelon 19 Market St, Falls Fenelon Falls, ON F1
Start Date
Finish Date
January 2023
October 2023
January 2023
October 2023
January 2023
October 2023
January 2023
October 2023
January 2023
October 2023
Land Use
Equipment Installed
Residential and Detec AV + ICI Downward Sensor Residential and Detec AV + ICI Downward Sensor Residential and Detec AV + ICI Downward Sensor Residential and Detec ICI Residential and Detec ICI
Page 2
Civica Infrastructure Inc. • 330 Rodinea Road, Unit 3, Vaughan, Ontario, Canada, L6A 4P5 • 905-417-9792 | www.civi.ca | info@civi.ca
City of Kawartha Lakes Kawartha Lakes Master Plan – Flow Monitoring Report June 4, 2024
Table 1-3: Flow Monitoring and Rain Gauge Locations – Bobcaygeon (2023) Station B2 B4 B5 B6 B8 B9 B10 RG1 – Bobcaygeon RG2 – Bobcaygeon
Address 8 Need St, Bobcaygeon, ON Front St W, Bobcaygeon, ON 21 Anne St, Bobcaygeon, ON 13 Navigators Trail, Bobcaygeon, ON 53 Mill St, Bobcaygeon, ON 54 Little Bob Dr, Bobcaygeon, ON 162 Riverside Dr, Bobcaygeon, ON 11 Bolton St, Bobcaygeon, ON 1 Duke St, Bobcaygeon, ON
Start Date
Finish Date
Land Use
January 2023
October 2023
January 2023
October 2023
January 2023
October 2023
January 2023
October 2023
January 2023
October 2023
January 2023
October 2023
January 2023
October 2023
January 2023
October 2023
January 2023
October 2023
Residential and ICI Residential and ICI Residential and ICI Residential and ICI Residential and ICI Residential and ICI Residential and ICI Residential and ICI Residential and ICI
Equipment Installed
Detec AV + Downward Sensor Detec AV + Downward Sensor Detec AV + Downward Sensor Detec AV + Downward Sensor Detec AV + Downward Sensor Detec AV + Downward Sensor Detec AV + Downward Sensor Detec Detec
Page 3
Civica Infrastructure Inc. • 330 Rodinea Road, Unit 3, Vaughan, Ontario, Canada, L6A 4P5 • 905-417-9792 | www.civi.ca | info@civi.ca
City of Kawartha Lakes Kawartha Lakes – Flow Monitoring Report June 4, 2024
2.0 Methodology Collected flow and rainfall data assists in characterizing general flow conditions of the catchment areas and provides an understanding of flow metrics and flow conditions of the monitoring location from January 2023 to October 2023 for the primary flow monitoring period, and November 2021 to November 2022, for the additional flow monitoring period. Monitoring equipment which captures flow, using area velocity meters, or depth sensors are used for calculating the flow metrics. The data collected during the monitoring period will be displayed, managed, and analyzed using Civica’s DataCurrent system.
2.1
Rainfall Monitoring
Civica used nine of its own rain gauges (RG1 – Lindsay, RG2 – Lindsay, RG3 – Lindsay, RG01 (2022) – Lindsay, RG02 (2022) – Lindsay, RG1 – Fenelon Falls, RG2 – Fenelon Falls, RG1 – Bobcaygeon, and RG2 – Bobcaygeon) to collect rainfall data. The Lindsay rain gauges (RG1, RG2, RG3, RG01 (2022), and RG02 (2022)) are located at 33 Mary St E, 429 Kent St, 51 Eglinton St, 89 David St, and 9 York St, Lindsay, ON, respectively. These rain gauges are equal to or less than 0.45 km, 0.74 km, and 1.15 km away, respectively, from the 27 Lindsay flow meters (L1 to L12 and 1-1 to 6-7). The Fenelon Falls rain gauges (RG1 and RG2) are located at 69 Ellice St and 19 Market St, Fenelon Falls, ON, respectively. These rain gauges are equal to or less than 0.53 km and 0.29 km away, respectively, from the three Fenelon falls flow meters (F1-F3). The Bobcaygeon rain gauges (RG1 and RG2) are located at 11 Bolton St and 1 Duke St, Bobcaygeon, ON, respectively. These rain gauges are equal to or less than 1.31 km and 0.65 km away, respectively, from the seven Bobcaygeon flow meters (B2-B10). The data downloaded from the Civica rain gauges was used to support the wet-weather flow data analysis. An Intensity- Duration-Frequency (IDF) analysis was performed to classify and compare the measured storms to the Town of Lindsay design storm.
2.2
Flow Monitoring
As previously stated, Detectronic (Detec) flow meters were used at all the thirty-seven (37) stations. The Detect Area/Velocity (A/V) sensors were installed in the inlets/outlets of the pipe at the selected locations along with a Downward sensor to provide redundancy. The flumes, if required due to low flows, were installed at the inlets of the sites. The flow meters collected data in a 5-minute interval to ensure highresolution flow data was recorded. The flow meters were calibrated after installation for quality assurance purposes. Data collected from the meters was sent four times daily through telemetry. An automated alarm system alerted Civica staff of potential flow meter issues. The data collected during this project was collected, managed, and analyzed using the DataCurrent software system.
2.3
Data QA/QC and Process
The data retrieved remotely from the on-site data loggers is immediately sent through a comprehensive data screening and QA/QC process and stored in a database on the cloud. The real-time data will be organized and presented through Civica’s DataCurrent software. The data screening applies real-time verification of the data by testing values of velocities, levels, and flow against:
Page 4
Civica Infrastructure Inc. • 330 Rodinea Road, Unit 3, Vaughan, Ontario, Canada, L6A 4P5 • 905-417-9792 | www.civi.ca | info@civi.ca
City of Kawartha Lakes Kawartha Lakes – Flow Monitoring Report June 4, 2024
•
Trend analysis for identifying debris build up.
•
Dry weather flow confidence limits (e.g., 99% confidence limits)
•
Dry weather flow trends for average, peak, and minimum
•
Manning’s value of velocity (scatter-point analysis)
•
Response during wet weather conditions (rainfall and snowmelt)
Confidence limits and trend analysis will incorporate statistics previously collected by Civica. These verification tests ensure that data which measures outside of normal limits can be evaluated prior to data certification and application to further analysis. This methodology ensures the best data reliability and accuracy of coverage. Quality Assurance and Quality Control (QA/QC) of monitoring data is critical to ensure accurate and reliable analysis results.
2.4
Analysis of Flow Monitoring Data
A sanitary sewer system receives two (2) flow components that have been analyzed during this project: 1) Dry- Weather Flow (DWF); and 2) Wet-Weather Flow (WWF). The DWF component is separated into population- generated sewage wastewater flow and groundwater infiltration (GWI). Population sewage wastewater flow is produced by routine water usage in the residential, commercial, and industrial areas of a given sanitary collection system. Dry- weather GWI will enter the collection system when the relative depth of the groundwater table is higher than the elevation of the pipeline, and when the condition of the sanitary sewer pipe allows infiltration through defects, such as cracks, misaligned joints, and broken pipelines. GWI is not specific to a single rainfall event. Instead, it affects the collection system over an entire year (including the dry-weather season). The data collected was analyzed for rainfall-derived inflow and infiltration (RDII) and DWF metrics. The WWF component includes stormwater inflow, trench infiltration, and groundwater infiltration. WWF is generally a response to a meteorological change within the study area. There are several physical and residual factors that impact the rate of extraneous flow into the sanitary flow after a WWF event. The analysis completed within the study focuses on the factors that are easily measured and quantifiable, such as sanitary flow and rainfall. Figure 2-1 below illustrates a typical flow monitoring response to rainfall.
Page 5
Civica Infrastructure Inc. • 330 Rodinea Road, Unit 3, Vaughan, Ontario, Canada, L6A 4P5 • 905-417-9792 | www.civi.ca | info@civi.ca
City of Kawartha Lakes Kawartha Lakes – Flow Monitoring Report June 4, 2024
Figure 2-1: Sanitary Flow Components
Peak I/I per hectare is the main metric used to assess the overall I/I condition of a catchment and is based off the peak RDII flow measured at a flow monitoring station divided by the area upstream. This metric is useful for comparing the I/I between two catchments and to prioritize field investigations aimed at identifying sources of I/I. The wet-weather analysis separates the dry and wet-weather contributions. The peak wet-weather response is then compared with the peak rainfall intensity. The events have been “normalized” by correlating storm intensities over the time of concentration of the catchment with measured peak I/I flow rates during events with greater than 15 mm of rainfall.
2.5
Inflow and Infiltration (I/I) Analysis
The rainfall derived inflow and infiltration (RDII) is inflow and infiltration (I/I) directly influenced by the intensity and duration of a storm event. An I/I analysis is completed for all storms greater than or equal to 15 mm during the monitoring period and analyzes the peak RDII flow captured. For accurate correlation, both rainfall and the flow data sets are presented in the same time zone and do not apply any daylight savings time changes. The estimated DWF for each storm event is calculated using the average dry- weather flow data captured 30 days prior to and 30 days following the storm event. The RDII flow is the difference captured between measured flow and estimated DWF during a wet-weather event. The floating and suspended debris in sanitary flow is expected to build up on A/V sensors and flumes and create spikes and noise in flow data. To mitigate this concern, cleaning and manual calibrations were carried out every 6 to 10 weeks, as needed. The sensors were calibrated on-site by Civica staff using Page 6
Civica Infrastructure Inc. • 330 Rodinea Road, Unit 3, Vaughan, Ontario, Canada, L6A 4P5 • 905-417-9792 | www.civi.ca | info@civi.ca
City of Kawartha Lakes Kawartha Lakes – Flow Monitoring Report June 4, 2024
independent manual depth and velocity probes during these maintenance visits. These visits also included: • • • • • •
Debris and sedimentation clean up Invasive manual depth checks on a known frequency Independent velocity checks Battery level checks Telemetry checks Manual data download
The peak RDII flow value is the greatest difference between the 5-minute incremental measured flow and estimated DWF. To ensure the RDII flow value selected is from the RDII response, only spikes in flow occurring during the captured rainfall or within three (3) iterations of the station’s Tc of peak rainfall intensity are selected for RDII analysis. Spikes in the flow occurring outside of the captured rainfall are not selected as it can be a non- RDII related response for a catchment.
3.0 Summary of Results 3.1
Rainfall Analysis
The number and magnitude of significant storms are important for assessing the suitability of the data for model calibration. The greater the number and larger the magnitude of storms, the more reliable and accurate the I/I flow assessment. Events greater than 15 mm are generally considered to be significant, as these are roughly twice the size of an average storm and are used as the minimum cut-off point for events included in an RDII analysis. The rain gauges used for the flow monitoring stations in Lindsay, Fenelon Falls, and Bobcaygeon can be found in Table 3-1, Table 3-2, and Table 3-3, respectively. Table 3-1: Rain Gauges Assigned to Flow Monitoring Stations – Lindsay FM Station
Assigned Rain Gauge
Distance (km) from Assigned Rain Gauge to the Station
L1
RG3 - Lindsay
1.02
L2
RG3 - Lindsay
0.85
L3
RG3 - Lindsay
0.7
L4
RG3 - Lindsay
1.15
L5
RG1 - Lindsay
0.45
L6
RG1 - Lindsay
0.04
L7
RG1 - Lindsay
0.05
L8
RG2 - Lindsay
0.74
L9
RG2 - Lindsay
0.19
L10
RG3 - Lindsay
0.31
L11
RG3 - Lindsay
0.26
L12
RG3 - Lindsay
0.81
Page 7
Civica Infrastructure Inc. • 330 Rodinea Road, Unit 3, Vaughan, Ontario, Canada, L6A 4P5 • 905-417-9792 | www.civi.ca | info@civi.ca
City of Kawartha Lakes Kawartha Lakes – Flow Monitoring Report June 4, 2024
FM Station
Assigned Rain Gauge
Distance (km) from Assigned Rain Gauge to the Station
1-1
RG02 (2022) – Lindsay
0.96
1-2
RG02 (2022) – Lindsay
0.98
2-1
RG02 (2022) – Lindsay
0.90
2-2
RG02 (2022) – Lindsay
0.60
2-3
RG02 (2022) – Lindsay
0.49
4-1
RG02 (2022) – Lindsay
0.58
5-1a
RG02 (2022) – Lindsay
0.75
5-2
RG02 (2022) – Lindsay
0.67
6-1
RG02 (2022) – Lindsay
0.60
6-2
RG02 (2022) – Lindsay
0.60
6-3
RG02 (2022) – Lindsay
0.48
6-4
RG02 (2022) – Lindsay
0.28
6-5
RG02 (2022) – Lindsay
0.51
6-6
RG02 (2022) – Lindsay
1.46
6-7
RG02 (2022) – Lindsay
1.46
Table 3-2: Rain Gauges Assigned to Flow Monitoring Stations – Fenelon Falls FM Station
Assigned Rain Gauge
Distance (km) from Assigned Rain Gauge to the Station
F1
RG2 – Fenelon Falls
0.29
F2
RG1 – Fenelon Falls
0.53
F3
RG1 – Fenelon Falls
0.07
Table 3-3: Rain Gauges Assigned to Flow Monitoring Stations – Bobcaygeon FM Station
Assigned Rain Gauge
Distance (km) from Assigned Rain Gauge to the Station
B2
RG1 - Bobcaygeon
0.45
B4
RG1 - Bobcaygeon
0.69
B5
RG2 - Bobcaygeon
0.38
B6
RG1 - Bobcaygeon
0.96
Page 8
Civica Infrastructure Inc. • 330 Rodinea Road, Unit 3, Vaughan, Ontario, Canada, L6A 4P5 • 905-417-9792 | www.civi.ca | info@civi.ca
City of Kawartha Lakes Kawartha Lakes – Flow Monitoring Report June 4, 2024
FM Station
Assigned Rain Gauge
Distance (km) from Assigned Rain Gauge to the Station
B8
RG1 - Bobcaygeon
1.18
B9
RG1 - Bobcaygeon
1.31
B10
RG2 - Bobcaygeon
0.65
A total of fifteen (15), sixteen (16), ten (10), twelve (12), and eighteen (18) rainfall events greater than 15 mm were captured by the rain gauges RG1, RG2, RG3, RG01_2022, and RG_02_2022 – Lindsay during the monitoring period, respectively. Based on a standard assumption of Time of Concentration (Tc) equal to 60 min, the maximum peak intensity over Tc captured during the monitoring period by the rain gauges RG1, RG2, RG3, RG01 (2022), and RG02 (2022) – Lindsay were 28.8, 38.3, 31.8, 21.0, and 21.0 mm/hr, respectively, which occurred on August 3, 2023, September 3, 2023, and August 3, 2023, August 29, 2022, and August 29, 2022, respectively. A total of fourteen (14) rainfall events greater than 15 mm were captured by each of the rain gauges RG1 and RG2 – Fenelon Falls during the monitoring period. Based on a standard assumption of Time of Concentration (Tc) equal to 60 min, the maximum peak intensity over Tc captured during the monitoring period by the rain gauges RG1 and RG2 – Fenelon Falls was 17 mm/hr, which both occurred on June 25, 2023. A total of fourteen (14) and eleven (11) rainfall events greater than 15 mm were captured by the rain gauges RG1 and RG2 – Bobcaygeon during the monitoring period, respectively. Based on a standard assumption of Time of Concentration (Tc) equal to 60 min, the maximum peak intensity over Tc captured during the monitoring period by the rain gauges RG1 and RG2 – Bobcaygeon were 12.5 and 14.5 mm/hr, respectively, which occurred on August 12, 2023. Table 3-4 through Table 3-12 represents the summary of the rainfall amount and peak intensity for events greater than 15 mm captured by the rain gauges in the study area. Table 3-4: Rainfall Event Characteristics for RG1 – Lindsay Event
Duration (hr)
Total Precipitation (mm)
Recorded Peak Intensity over Tc = 60 min (mm/hr)
Return Period of Peak Intensity (Tc = 60 min)
Mar 16, 2023
12.67
19
3.0
<2 Years
Mar 31, 2023
18.25
27
5.5
<2 Years
Apr 05, 2023
10.58
24.5
7.3
<2 Years
Apr 16, 2023
4.5
16.3
6.8
<2 Years
Apr 30, 2023
11.42
22
5.8
<2 Years
May 19, 2023
18.75
42
8.8
<2 Years
Jun 11, 20231
25.25
48.5
7.3
<2 Years
Jun 23, 2023
32.08
19.8
11.3
<2 Years
Jun 27, 2023
5.75
30.5
12.3
<2 Years
Page 9
Civica Infrastructure Inc. • 330 Rodinea Road, Unit 3, Vaughan, Ontario, Canada, L6A 4P5 • 905-417-9792 | www.civi.ca | info@civi.ca
City of Kawartha Lakes Kawartha Lakes – Flow Monitoring Report June 4, 2024
Event
Duration (hr)
Total Precipitation (mm)
Recorded Peak Intensity over Tc = 60 min (mm/hr)
Return Period of Peak Intensity (Tc = 60 min)
Jul 13, 2023
4.08
15
7.3
<2 Years
Jul 15, 2023
18.67
16.3
10.3
<2 Years
Jul 20, 2023
2
19.8
17.0
<2 Years
Aug 03, 20232
11.25
39.3
28.8
2-5 Years
Aug 17, 2023
21.83
19.8
14.0
<2 Years
Sep 07, 2023
0.67
24.5
24.5
<2 Years
1Largest volume
2Peak Intensity over Tc
Table 3-5: Rainfall Event Characteristics for RG2 – Lindsay Event
Duration (hr)
Total Precipitation (mm)
Recorded Peak Intensity over Tc = 60 min (mm/hr)
Return Period of Peak Intensity (Tc = 60 min)
Feb 09, 2023
21.58
35.8
5.8
<2 Years
Mar 16, 2023
20.17
20.8
3.3
<2 Years
Mar 31, 2023
16
29.3
6.3
<2 Years
Apr 05, 2023
16.42
21.8
5.5
<2 Years
Apr 16, 2023
4.08
17.3
7.8
<2 Years
Apr 28, 2023
51.42
40.3
5.5
<2 Years
May 19, 2023
19.33
47.5
9.3
<2 Years
Jun 11, 20231
25.17
55.3
8.3
<2 Years
Jun 26, 2023
8.33
41.5
26.0
<2 Years
Jun 27, 2023
5.92
27.8
7.3
<2 Years
Jul 13, 2023
4.17
20.3
10.0
<2 Years
Jul 20, 2023
2.33
16.5
15.0
<2 Years
Aug 03, 2023
4.67
28.8
16.8
<2 Years
Aug 17, 2023
21.5
22.5
15.3
<2 Years
Sep 07, 20232
0.75
38.3
38.3
5-10 Years
Sep 12, 2023
7.83
18
7.5
<2 Years
1Largest volume
2Peak Intensity over Tc
Page 10
Civica Infrastructure Inc. • 330 Rodinea Road, Unit 3, Vaughan, Ontario, Canada, L6A 4P5 • 905-417-9792 | www.civi.ca | info@civi.ca
City of Kawartha Lakes Kawartha Lakes – Flow Monitoring Report June 4, 2024
Table 3-6: Rainfall Event Characteristics for RG3 – Lindsay Recorded Peak Intensity over Tc = 60 min (mm/hr)
Return Period of Peak Intensity (Tc = 60 min)
23.33
Total Precipitation (mm) 19
5.0
<2 Years
Apr 05, 2023
12.5
18
6.0
<2 Years
Apr 30, 2023
9.5
16.4
4.2
<2 Years
May 19, 2023
18.92
32
6.8
<2 Years
Jun 11, 2023
25.75
35.4
5.6
<2 Years
Jun 26, 2023
8.42
18.4
9.0
<2 Years
Jun 27, 2023
5.42
24.2
7.4
<2 Years
Aug 03, 20231,2
4.83
41.4
31.8
2-5 Years
Sep 07, 2023
0.83
21.8
21.8
<2 Years
Event
Duration (hr)
Mar 31, 2023
1Largest volume
2Peak Intensity over Tc
Table 3-7: Rainfall Event Characteristics for RG01_2022 – Lindsay Event
Duration (hr)
Total Precipitation (mm)
Recorded Peak Intensity over Tc = 60 min (mm/hr)
Return Period of Peak Intensity (Tc = 60 min)
Jun 6, 2022
31.92
30.3
6.8
<2 Years
Jun 11, 2022
25
39
19.3
<2 Years
Aug 25, 2022
15.33
15
13.3
<2 Years
Aug 29, 20222
2.83
29.8
21.0
<2 Years
Sep 12, 2022
25
27.3
8.0
<2 Years
Sep 18, 2022
5.75
20.8
9.8
<2 Years
Oct 12, 2022
15
21
5.3
<2 Years
Nov 30, 2022
10.92
24
4.5
<2 Years
Dec 22, 2022
16.42
15.8
3.5
<2 Years
Dec 30, 2022
30.58
25.8
2.5
<2 Years
Jan 03, 2023
51.42
29
8.0
<2 Years
Feb 09, 20231
14.42
39.8
6.3
<2 Years
1Largest volume
2Peak Intensity over Tc
Page 11
Civica Infrastructure Inc. • 330 Rodinea Road, Unit 3, Vaughan, Ontario, Canada, L6A 4P5 • 905-417-9792 | www.civi.ca | info@civi.ca
City of Kawartha Lakes Kawartha Lakes – Flow Monitoring Report June 4, 2024
Table 3-8: Rainfall Event Characteristics for RG02_2022 – Lindsay Event
Duration (hr)
Total Precipitation (mm)
Recorded Peak Intensity over Tc = 60 min (mm/hr)
Return Period of Peak Intensity (Tc = 60 min)
Oct 25, 2021
36.42
30.8
3.0
<2 Years
Feb 16, 2022
12.67
18
3.0
<2 Years
Apr 13, 2022
28.67
17.3
5.8
<2 Years
May 26, 2022
27.5
20.3
8.0
<2 Years
Jun 06, 2022
32.42
30
6.5
<2 Years
Jun 11, 20221
25.08
41.5
19.5
<2 Years
Jul 12, 2022
7.75
15.5
12.3
<2 Years
Jul 18, 2022
43.25
21.5
1.0
<2 Years
Aug 17, 2022
1.83
17.5
14.8
<2 Years
Aug 21, 2022
30.5
17.5
7.0
<2 Years
Aug 25, 2022
8.58
16.3
14.3
<2 Years
Aug 29, 20222
2.5
29
21.0
<2 Years
Sep 12, 2022
25.08
21.8
6.3
<2 Years
Sep 18, 2022
5.58
24.5
14.0
<2 Years
Oct 12, 2022
15.25
20.8
5.0
<2 Years
Nov 30, 2022
10.83
21
4.0
<2 Years
Jan 03, 2023
43.42
27.3
7.3
<2 Years
Feb 09, 2023
21.58
35.8
5.8
<2 Years
1Largest volume
2Peak Intensity over Tc
Table 3-9: Rainfall Event Characteristics for RG1 – Fenelon Falls Event
Duration (hr)
Total Precipitation (mm)
Recorded Peak Intensity over Tc = 60 min (mm/hr)
Mar 31, 2023
18.08
22.3
4.5
<2 Years
Apr 05, 2023
10.58
33.8
11.3
<2 Years
Apr 30, 2023
7.92
24.8
6.0
<2 Years
May 19, 2023
14.75
38.8
9.3
<2 Years
Jun 11, 20231
25.92
46.5
5.3
<2 Years
Return Period of Peak Intensity (Tc = 60 min)
Page 12
Civica Infrastructure Inc. • 330 Rodinea Road, Unit 3, Vaughan, Ontario, Canada, L6A 4P5 • 905-417-9792 | www.civi.ca | info@civi.ca
City of Kawartha Lakes Kawartha Lakes – Flow Monitoring Report June 4, 2024
Event
Duration (hr)
Total Precipitation (mm)
Recorded Peak Intensity over Tc = 60 min (mm/hr)
Mar 31, 2023
18.08
22.3
4.5
<2 Years
Jun 23, 2023
38.25
20.5
15.0
<2 Years
Jun 25, 20232
1.42
18.3
17.0
<2 Years
Jun 26, 2023
8.5
20.3
10.5
<2 Years
Jun 27, 2023
7.92
15
6.3
<2 Years
Jul 13, 2023
4.33
19
7.5
<2 Years
Jul 29, 2023
2.08
17.5
13.8
<2 Years
Aug 12, 2023
13.17
23.8
13.8
<2 Years
Oct 05, 2023
23.58
23.1
6.4
<2 Years
Oct 08, 2023
34.17
29.5
5.8
<2 Years
Return Period of Peak Intensity (Tc = 60 min)
1Largest volume
2Peak Intensity over Tc
Table 3-10: Rainfall Event Characteristics for RG2 – Fenelon Falls Event
Duration (hr)
Total Precipitation (mm)
Recorded Peak Intensity over Tc = 60 min (mm/hr)
Return Period of Peak Intensity (Tc = 60 min)
Mar 31, 2023
18.08
22.3
4.5
<2 Years
Apr 05, 2023
10.58
33.8
11.3
<2 Years
Apr 30, 2023
7.92
24.8
6.0
<2 Years
May 19, 2023
14.75
38.8
9.3
<2 Years
Jun 11, 20231
25.92
46.5
5.3
<2 Years
Jun 23, 2023
38.25
20.5
15.0
<2 Years
Jun 25, 20232
1.42
18.3
17.0
<2 Years
Jun 26, 2023
8.50
20.3
10.5
<2 Years
Jun 27, 2023
7.92
15.0
6.3
<2 Years
Jul 13, 2023
4.33
19.0
7.5
<2 Years
Jul 29, 2023
3.08
19.1
15.5
<2 Years
Aug 12, 2023
10.50
23.1
16.3
<2 Years
Oct 05, 2023
23.58
23.1
6.4
<2 Years
Oct 08, 2023
34.17
29.5
5.8
<2 Years
1Largest volume
Page 13
Civica Infrastructure Inc. • 330 Rodinea Road, Unit 3, Vaughan, Ontario, Canada, L6A 4P5 • 905-417-9792 | www.civi.ca | info@civi.ca
City of Kawartha Lakes Kawartha Lakes – Flow Monitoring Report June 4, 2024 2Peak Intensity over Tc
Table 3-11: Rainfall Event Characteristics for RG1 – Bobcaygeon Event
Duration (hr)
Total Precipitation (mm)
Recorded Peak Intensity over Tc = 60 min (mm/hr)
Feb 09, 2023
14.42
39.8
4.4
<2 Years
Mar 16, 2023
12.75
19.5
1.7
<2 Years
Mar 31, 2023
16.5
22
2.1
<2 Years
Apr 05, 2023
10.67
28.8
4.1
<2 Years
Apr 28, 2023
52.92
34
2.8
<2 Years
May 19, 2023
17.92
35
3.9
<2 Years
Jun 11, 20231,2
28.58
51
4.6
<2 Years
Jun 27, 2023
10.67
15.3
2.2
<2 Years
Jul 13, 2023
4.08
16.3
2.7
<2 Years
Jul 20, 2023
18.75
17.5
2.1
<2 Years
Jul 29, 2023
3.42
16.5
2.8
<2 Years
Aug 12, 2023
25.58
15
2.2
<2 Years
Oct 05, 2023
34.67
35.8
2.6
<2 Years
Oct 08, 2023
81.08
28.8
2.2
<2 Years
Return Period of Peak Intensity (Tc = 60 min)
1Largest volume
2Peak Intensity over Tc
Table 3-12: Rainfall Event Characteristics for RG2 – Bobcaygeon Event
Duration (hr)
Total Precipitation (mm)
Recorded Peak Intensity over Tc = 60 min (mm/hr)
Return Period of Peak Intensity (Tc = 60 min)
Mar 31, 2023
29.0
22.8
5.3
<2 Years
Apr 05, 2023
11.3
33.3
10.8
<2 Years
Apr 29, 2023
46.9
23.3
5.3
<2 Years
May 19, 2023
19.5
35.5
6.0
<2 Years
Jun 11, 20231
35.4
48.3
7.0
<2 Years
Jun 27, 2023
11.3
16.0
5.0
<2 Years
Jul 13, 2023
6.1
16.8
6.5
<2 Years
Jul 29, 2023
3.7
20.5
9.3
<2 Years
Aug 12, 20232
25.7
17.0
14.5
<2 Years
Page 14
Civica Infrastructure Inc. • 330 Rodinea Road, Unit 3, Vaughan, Ontario, Canada, L6A 4P5 • 905-417-9792 | www.civi.ca | info@civi.ca
City of Kawartha Lakes Kawartha Lakes – Flow Monitoring Report June 4, 2024
Event
Duration (hr)
Total Precipitation (mm)
Recorded Peak Intensity over Tc = 60 min (mm/hr)
Return Period of Peak Intensity (Tc = 60 min)
Oct 05, 2023
34.7
35.8
10.8
<2 Years
Oct 08, 2023
81.1
28.8
3.3
<2 Years
1Largest volume
2Peak Intensity over Tc
The IDF analysis performed for the rain events captured by the rain gauges can be seen in Appendix A. All events presented in the IDFs chart are above 15 mm.
3.2
Dry-Weather Flow Analysis
Flows during dry days outside of the recessive influence of past rain events were selected to characterize the dry- weather flow generation rates. The following dry-weather flow (DWF) parameters have been calculated: Average Dry-Weather Flow (L/s) Average Daily Maximum Dry-Weather Flow (L/s) Average Daily Minimum Dry-Weather Flow (L/s) Dry-Weather Groundwater Infiltration (L/s/ha)
• • • •
The average DWF is a combination of sewage and groundwater infiltration, with sewage typically being the largest proportion. The Minimum DWF typically occurs at night-time (between 1:00 am and 3:00 am), and for smaller sewer sheds it is typically 70-90% groundwater infiltration (GWI). (The percentage of GWI is typically less in large sewer sheds, due to a larger proportion of the customer sewage flow arriving at the basin outlet after a longer delay in transit). For the purposes of this study, the GWI is 85% of the minimum DWF. Dry-weather GWI will enter the sewer system when the depth of the groundwater table is higher than the elevation of the pipeline, and reaches joint, or pipe defects; as well as, when the condition of the sewer pipe allows for infiltration (e.g., water level outside of the pipe is higher than inside). Seasonal variations of GWI occur due to changes in groundwater table elevations and soil saturation. Typically, rates increase during springtime after snowmelt, and can remain relatively constant over weeks, and months thereafter. The DWF results for the flow monitors are presented in Table 3-13, Table 3-14, and Table 3-15, for Lindsay, Fenelon Falls, and Bobcaygeon, respectively. Table 3-13: Dry-Weather Flow Analysis – Lindsay Minimum DWF2 (L/s)
Average DWF (L/c/d)
Design DWF Criteria (L/c/d)
GWI3 (L/s)
4.180
1.075
302
450
0.914
2640
15.452
3.912
319
450
3.325
3314
17.007
8.489
324
450
7.215
Flow Monitor
Catchment Area (ha)
Population Maximum DWF1 (L/s)
L1
42.80
711
L2
116.50
L3
58.03
Page 15
Civica Infrastructure Inc. • 330 Rodinea Road, Unit 3, Vaughan, Ontario, Canada, L6A 4P5 • 905-417-9792 | www.civi.ca | info@civi.ca
City of Kawartha Lakes Kawartha Lakes – Flow Monitoring Report June 4, 2024 Minimum DWF2 (L/s)
Average DWF (L/c/d)
Design DWF Criteria (L/c/d)
GWI3 (L/s)
1.694
0.019
198
450
0.017
232
3.086
0.558
590
450
0.474
6.10
113
2.094
0.575
807
450
0.489
L7
11.50
575
2.139
0.558
162
450
0.522
L8
155.60
738
14.346
2.172
786
450
1.847
L9
71.30
736
6.868
0.909
368
450
0.773
L10
118.70
2650
14.067
6.342
322
450
5.390
L11
69.80
1318
13.199
1.828
470
450
1.554
L12
71.50
1677
8.757
3.480
312
450
2.958
1-1
44.80
561
6.777
4.221
837
450
3.588
1-2
74.60
1173
7.588
3.497
384
450
2.973
2-1
50.70
384
7.439
1.433
817
450
1.218
2-2
99.20
989
15.235
4.272
779
450
3.631
2-3
24.30
1120
3.679
1.533
176
450
1.303
4-1
54.50
1582
9.479
3.016
333
450
2.564
5-1a
5.80
110
1.903
0.737
874
450
0.626
5-2
37.70
1120
5.266
2.268
274
450
1.927
6-1
12.50
311
6.357
0.855
671
450
0.727
6-2
421.00
7687
83.487
51.978
757
450
44.181
6-3
380.80
6820
44.412
21.506
40
450
18.280
6-4
342.90
6001
7.893
1.941
70
450
1.650
6-5
275.30
4354
28.156
12.703
393
450
10.798
6-6
156.70
1260
17.501
4.863
708
450
4.134
6-7
36.70
662
7.795
3.046
620
450
2.589
Flow Monitor
Catchment Area (ha)
Population Maximum DWF1 (L/s)
L4
5.70
87
L5
27.80
L6
1 Average Daily Dry-Weather Flow Maximum 2 Average Daily Dry-Weather Flow Minimum
3 Dry-Weather Groundwater Infiltration: 85% of Average Daily Dry-Weather Flow Minimum
In Lindsay, the flow monitoring stations L1, L2, L3, L4, L7, L9, L10, L12, 1-2, 2-3, 4-1, 5-2, 6-3, 6-4, and 6-5 were below the City’s peak design flow criteria, 450 L/c/d. The stations L5, L6, L8, L11, 1-1, 2-1, 2-2, 5-1a, 6-1, 6-2, 6-6, and 6-7 were above the criteria. Considering the total average normalized DWF results for Lindsay, 470 L/c/d, the community results are above the design criteria. Populations for the catchment areas were calculated based on residential landuse only, which excludes ICI or other types of properties
Page 16
Civica Infrastructure Inc. • 330 Rodinea Road, Unit 3, Vaughan, Ontario, Canada, L6A 4P5 • 905-417-9792 | www.civi.ca | info@civi.ca
City of Kawartha Lakes Kawartha Lakes – Flow Monitoring Report June 4, 2024
that may be present in the catchment area, which can affect the expected results. It is noted that for the station L8, the average normalized DWF, 786 L/c/d, is considerably higher than the City’s design criteria, 450 L/c/d. In the case for station L8, in which the total upstream population includes L9, there appears to be a higher, almost exclusive amount, of ICI properties present, which would increase the expected amount of flows. Table 3-14: Dry-Weather Flow Analysis – Fenelon Falls
Maximum Population DWF1 (L/s)
Minimum DWF2 (L/s)
Average normalized DWF (L/c/d)
Peak Design Flow Criteria (L/c/d)
GWI3 (L/s)
Flow Monitor
Catchment Area (ha)
F1
106.01
1654
37.928
1.827
462
450
1.553
F2
9.50
152
2.245
0.622
610
450
0.529
F3
173.00
2254
40.028
4.186
653
450
3.558
1 Average Daily Dry-Weather Flow Maximum 2 Average Daily Dry-Weather Flow Minimum
3 Dry-Weather Groundwater Infiltration: 85% of Average Daily Dry-Weather Flow Minimum
In Fenelon Falls, the flow monitoring stations F1, F2, and F3 were above the City’s peak design flow criteria, 450 L/c/d. Considering the total average normalized DWF results for Fenelon Falls, 575 L/c/d, the community results are above the design criteria. Populations for the catchment areas were calculated based on residential landuse only, which excludes ICI or other types of properties that may be present in the catchment area, which can affect the expected results. It is noted that for the station F3, the average normalized DWF, 653 L/c/d, is considerably higher than the City’s design criteria, 450 L/c/d. In the case for station F3, there appears to be a higher amount of ICI properties present than for the other catchment areas, which would increase the expected amount of flows. Table 3-15: Dry-Weather Flow Analysis – Bobcaygeon
Maximum Population DWF1 (L/s)
Minimum DWF2 (L/s)
Average normalized DWF (L/c/d)
Peak Design Flow Criteria (L/c/d)
GWI3 (L/s)
Flow Monitor
Catchment Area (ha)
B2
99.50
1017
11.707
2.949
483
450
2.507
B4
49.60
221
2.020
0.177
266
450
0.151
B5
225.00
1932
41.142
8.981
939
450
7.634
B6
76.00
890
14.652
0.065
109
450
0.055
B8
40.00
575
3.153
0.238
164
450
0.202
B9
31.60
94
1.619
0.112
401
450
0.095
B10
27.50
239
2.541
0.244
290
450
0.207
1 Average Daily Dry-Weather Flow Maximum 2 Average Daily Dry-Weather Flow Minimum
3 Dry-Weather Groundwater Infiltration: 85% of Average Daily Dry-Weather Flow Minimum
Page 17
Civica Infrastructure Inc. • 330 Rodinea Road, Unit 3, Vaughan, Ontario, Canada, L6A 4P5 • 905-417-9792 | www.civi.ca | info@civi.ca
City of Kawartha Lakes Kawartha Lakes – Flow Monitoring Report June 4, 2024
In Bobcaygeon, the flow monitoring stations B4, B6, B8, B9, and B10 were below the City’s peak design flow criteria, 450 L/c/d. The stations B2 and B5, were above the criteria. Considering the total average normalized DWF results for Bobcaygeon, 379 L/c/d, the community results are below the design criteria. Populations for the catchment areas were calculated based on residential landuse only, which excludes ICI or other types of properties that may be present in the catchment area, which can affect the expected results. It is noted that for the stations B2 and B5, the average normalized DWF, 483 and 939 L/c/d, respectively, are both higher than the City’s design criteria, 450 L/c/d. In the case for the stations B2 and B5, there appears to be a higher amount of ICI properties present, which would increase the expected amount of flows. Monthly data charts and sanitary reports can be found in Appendix A.
3.3
Wet-Weather Flow Analysis
Wet-weather flow (WWF) includes stormwater runoff inflow, trench infiltration, and groundwater infiltration, and is generally a response to a rain event within the study area. The wet-weather flow response for the flow monitors have been reviewed and analyzed to estimate the peak I/I rate during each storm. The peak I/I flow values selected are the highest reported I/I flow value occurring during the rain event or within three (3) iterations of the station’s Tc. The WWF results for the flow monitors in Lindsay, Fenelon Falls, and Bocaygeon are presented in Table 3-16, Table 3-17, and Table 3-18, respectively. Table 3-16: Wet-Weather Flow Analysis – Lindsay
FM ID
Peak 1:25 year I/I Total Peak Peak measured Station Precipitation Peak Measured I/I rate Precipitation Measured I/I Rate Tc Intensity Over Event Date projection (mm) I/I Flow (L/s) (L/s/ha) (min) Tc during Event (L/s/ha) (mm/hr)
L1
Aug 3, 2023
41
15.38
0.36
0.44
35
54.2
L2
Aug 3, 2023
41
50.29
0.43
0.82
65
29.4
L3
Aug 3, 2023
41
55.31
0.39
0.79
75
25.4
L4
Sept 7, 2023
22
0.17
1.14
1.12
15
40.8
L5
Mar 31, 2023
25
6.44
0.23
0.19
35
6.9
L6
Mar 31, 2023
25
5.38
0.88
1.44
25
7.2
L7
Mar 31, 2023
25
3.31
0.29
0.18
20
21.8
L8
Jun 26, 2023
42
27.66
0.18
0.39
40
39.0
L9
Jun 26, 2023
42
10.30
0.14
0.23
25
58.2
Page 18
Civica Infrastructure Inc. • 330 Rodinea Road, Unit 3, Vaughan, Ontario, Canada, L6A 4P5 • 905-417-9792 | www.civi.ca | info@civi.ca
City of Kawartha Lakes Kawartha Lakes – Flow Monitoring Report June 4, 2024
FM ID
Peak 1:25 year I/I Total Peak Peak measured Station Precipitation Peak Measured I/I rate Precipitation Measured I/I Rate Tc Intensity Over Event Date projection (mm) I/I Flow (L/s) (L/s/ha) (min) Tc during Event (L/s/ha) (mm/hr)
L10
Aug 3, 2023
41
50.77
0.43
1.85
65
29.4
L11
Aug 3, 2023
41
41.28
0.59
0.95
45
42.4
L12
Feb 9, 2023
40
36.78
0.51
0.60
50
6.3
1-1
Jun 11, 2022
42
34.19
0.76
1.84
20
32.3
1-2
Jun 11, 2022
42
17.90
0.24
0.26
25
27.0
2-1
Jun 11, 2022
42
50.19
0.67
1.40
30
24.0
2-2
Jun 11, 2022
42
82.24
0.83
1.12
35
23.6
2-3
Jun 11, 2022
42
13.54
0.56
0.74
30
24.0
4-1
Aug 29, 2022
29
58.51
1.07
2.39
40
31.5
5-1a
Jun 11, 2022
42
8.11
1.40
1.70
25
27.0
5-2
Jun 11, 2022
42
18.06
0.48
0.56
35
23.6
6-1
Jul 12, 2022
16
7.66
0.61
1.81
20
31.5
6-2
Feb 16, 2022
16
99.25
0.24
0.57
100
2.7
6-3
Aug 29, 2022
29
109.90
0.29
0.47
80
16.1
6-4
Jul 12, 2022
16
41.36
0.12
0.24
40
17.6
6-5
Jun 11, 2022
42
78.88
0.29
0.46
60
19.5
6-6
Aug 17, 2022
18
19.11
0.12
0.20
35
25.3
6-7
Aug 29, 2022
29
8.17
0.22
0.48
30
39.5
Table 3-17: Wet-Weather Flow Analysis – Fenelon Falls
FM ID
F1
Peak 1:25 year I/I Total Peak Peak measured Station Precipitation Peak measured I/I rate Precipitation Measured I/I Rate Tc Intensity Over event date projection (mm) I/I Flow (L/s) (L/s/ha) (min) Tc during Event (L/s/ha) (mm/hr) Apr 5, 2023
34
44.58
0.42
0.55
30
16.0
Page 19
Civica Infrastructure Inc. • 330 Rodinea Road, Unit 3, Vaughan, Ontario, Canada, L6A 4P5 • 905-417-9792 | www.civi.ca | info@civi.ca
City of Kawartha Lakes Kawartha Lakes – Flow Monitoring Report June 4, 2024
FM ID
Peak 1:25 year I/I Total Peak Peak measured Station Precipitation Peak measured I/I rate Precipitation Measured I/I Rate Tc Intensity Over event date projection (mm) I/I Flow (L/s) (L/s/ha) (min) Tc during Event (L/s/ha) (mm/hr)
F2
Apr 5, 2023
34
7.01
0.70
0.73
25
17.4
F3
Apr 5, 2023
34
47.32
0.27
0.29
35
5.6
Table 3-18: Wet-Weather Flow Analysis – Bobcaygeon
FM ID
3.4
Peak 1:25 year I/I Total Peak Peak measured Station Precipitation Peak measured I/I rate Precipitation Measured I/I Rate Tc Intensity Over event date projection (mm) I/I Flow (L/s) (L/s/ha) (min) Tc during Event (L/s/ha) (mm/hr)
B2
Aug 12, 2023
15
17.31
0.25
0.85
30
22.5
B4
Oct 8, 2023
29
2.38
0.05
0.13
30
3.5
B5
Apr 5, 2023
33
44.87
0.26
0.64
35
16.7
B6
Oct 5, 2023
36
24.02
0.32
0.97
20
22.5
B8
May 19, 2023
35
2.52
0.06
0.15
20
33.0
B9
Mar 16, 2023
20
1.36
0.04
0.12
15
4.0
B10
Jun 27, 2023
16
3.10
0.11
0.17
25
30.0
I/I Projections
Once the peak I/I rates captured are plotted against the peak rainfall intensity for all storms greater than or equal to 15 mm, a linear line of best fit through zero will be established. The relationship found between the peak rainfall intensity for the flow meter and the RDII rate is used to extrapolate the projected peak RDII flow. The 25-year I/I projection results for the Lindsay, Fenelon Falls, and Bobcaygeon FMs can be found in Table 3-19, Table 3-20, and Table 3-21, respectively. Table 3-19: Flow Monitoring I/I Projection Results – Lindsay
FM Station
Total Station Catchment Area (ha)
Station Tc (min)
L1
42.8
35
1:25 Year I/I Rate Design Criteria for Projection 25-Year Projection (L/s/ha) (L/s/ha) 0.44
0.26
Maximum Peak Precipitation Intensity Over Tc (mm/hr) 54.2
Page 20
Civica Infrastructure Inc. • 330 Rodinea Road, Unit 3, Vaughan, Ontario, Canada, L6A 4P5 • 905-417-9792 | www.civi.ca | info@civi.ca
City of Kawartha Lakes Kawartha Lakes – Flow Monitoring Report June 4, 2024
1:25 Year I/I Rate Design Criteria for Projection 25-Year Projection (L/s/ha) (L/s/ha)
Maximum Peak Precipitation Intensity Over Tc (mm/hr)
FM Station
Total Station Catchment Area (ha)
Station Tc (min)
L2
116.5
65
0.82
0.26
29.4
L3
143.4
75
0.79
0.26
25.4
L4
5.7
15
1.12
0.26
101.6
L5
27.8
35
0.19
0.26
49.3
L6
6.1
25
1.44
0.26
67.8
L7
11.5
20
0.18
0.26
83.3
L8
155.6
40
0.39
0.26
39.0
L9
71.3
25
0.23
0.26
60.6
L10
118.7
65
1.85
0.26
29.4
L11
69.8
45
0.95
0.26
42.4
L12
71.5
50
0.60
0.26
38.2
1-1
44.8
20
1.84
0.26
32.3
1-2
74.6
25
0.26
0.26
41.4
2-1
50.7
30
1.40
0.26
39.5
2-2
99.2
35
1.12
0.26
35.6
2-3
24.3
30
0.74
0.26
39.5
4-1
54.5
40
2.39
0.26
31.5
5-1a
5.8
25
1.70
0.26
41.4
5-2
37.7
35
0.56
0.26
35.6
6-1
12.5
20
1.81
0.26
31.5
6-2
421.0
100
0.57
0.26
59.5
6-3
380.8
80
0.47
0.26
16.1
6-4
342.9
40
0.24
0.26
31.5
Page 21
Civica Infrastructure Inc. • 330 Rodinea Road, Unit 3, Vaughan, Ontario, Canada, L6A 4P5 • 905-417-9792 | www.civi.ca | info@civi.ca
City of Kawartha Lakes Kawartha Lakes – Flow Monitoring Report June 4, 2024
1:25 Year I/I Rate Design Criteria for Projection 25-Year Projection (L/s/ha) (L/s/ha)
Maximum Peak Precipitation Intensity Over Tc (mm/hr)
FM Station
Total Station Catchment Area (ha)
Station Tc (min)
6-5
275.3
60
0.46
0.26
21.0
6-6
156.7
35
0.20
0.26
35.6
6-7
36.7
30
0.48
0.26
39.5
In Lindsay, the flow monitoring stations L5, L7, L9, 6-4, and 6-6 were below the City’s design criteria, 0.26 L/s/ha. The stations L1, L2, L3, L4, L6, L8, L10, L11, L12, 1-1, 1-2, 2-1, 2-2, 2-3, 4-1, 5-1a, 5-2, 6-1, 6-2, 6-3, 6-5, and 6-7 were above the criteria. Table 3-20: Flow Monitoring I/I Projection Results – Fenelon Falls Design Criteria for 1:25 year I/I rate 25-Year Projection projection (L/s/ha) (L/s/ha)
Maximum Peak Precipitation Intensity Over Tc (mm/hr)
FM Station
Station Catchment Area (ha)
Station Tc (min)
F1
106.0
30
0.55
0.26
31.5
F2
10.0
25
0.73
0.26
28.8
F3
173.0
35
0.29
0.26
22.3
In Fenelon Falls, the flow monitoring stations F1, F2, and F3 were above the City’s design criteria, 0.26 L/s/ha. Table 3-21: Flow Monitoring I/I Projection Results – Bobcaygeon Design Criteria for 1:25 year I/I rate 25-Year Projection projection (L/s/ha) (L/s/ha)
Maximum Peak Precipitation Intensity Over Tc (mm/hr)
FM Station
Station Catchment Area (ha)
Station Tc (min)
B2
99.5
30
0.60
0.26
22.5
B4
49.6
30
0.13
0.26
22.5
B5
225.0
35
0.55
0.26
24.4
B6
76.0
20
0.97
0.26
33.0
B8
40.0
20
0.15
0.26
33.0
Page 22
Civica Infrastructure Inc. • 330 Rodinea Road, Unit 3, Vaughan, Ontario, Canada, L6A 4P5 • 905-417-9792 | www.civi.ca | info@civi.ca
City of Kawartha Lakes Kawartha Lakes – Flow Monitoring Report June 4, 2024
Design Criteria for 1:25 year I/I rate 25-Year Projection projection (L/s/ha) (L/s/ha)
Maximum Peak Precipitation Intensity Over Tc (mm/hr)
FM Station
Station Catchment Area (ha)
Station Tc (min)
B9
31.6
15
0.12
0.26
39.0
B10
27.5
25
0.17
0.26
30.0
In Bobcaygeon, the flow monitoring stations B4, B8, B9, and B10 were below the City’s peak design flow criteria, 0.26 L/s/ha. The stations B2, B5 , and B6 were above the criteria. Results for the 25-year I/I projections for each station can be found in Appendix B.
Page 23
Civica Infrastructure Inc. • 330 Rodinea Road, Unit 3, Vaughan, Ontario, Canada, L6A 4P5 • 905-417-9792 | www.civi.ca | info@civi.ca
City of Kawartha Lakes Kawartha Lakes Master Plan – Flow Monitoring Report June 4, 2024
4.0 Conclusions Based on the findings of this report, the following conclusions can be made: 1. Flow monitoring data was collected for one nine-month period from January 2023 to October 2023. Additional data from a previous flow monitoring period in Lindsay, covering November 2021 to November 2022, was included in this analysis. A total of thirty-seven (37) flow monitoring stations were installed across the three communities of Lindsay, Fenelon Falls, and Bobcaygeon in the 37 selected manholes to determine dry-weather flow metrics and wet-weather flow analysis. Of the total flow monitoring stations, twenty-seven (27) were installed in Lindsay, three (3) were installed in Fenelon Falls, and seven (7) were installed in Bobcaygeon. 2. The flow meters captured consistent daily dry-weather patterns, exhibiting, on average, lower per capita average daily dry-weather flows in residential areas, and higher in ICI areas. In residential areas, peaks coincided with typical residential daily routines, with higher flows during mornings and evenings, correponding to peak water usage. In ICI areas, higher variability in dry-weather flow is expected, with noticeable flow increases during business hours and decreases during nonoperational times. 3. High I/I was observed in a majority of the monitoring sites, with 21/26 sites in Lindsay, 3/3 sites in Fenelon Falls, and 3/7 sites in Bobcayegon displaying a 25-year I/I rate projection greater than 0.26 L/s/ha, the City’s design criteria. It is noted that in general, high I/I rates were observed in monitoring sites with a higher number of ICI properties, which is to be expected due to potential industrial processes, larger impervious surface areas, variability in water use, and complex infrastructure networks. These wet-weather analysis findings are consistent with the dry-weather results, with properties consisting of a higher ICI count displaying average per capita dry-weather flows greater than 450 L/c/d, the City’s design criteria. Some monitoring areas with a majority residential landuse also displayed higher per capita rates, and should be investigated in the future. 4. Based on the findings, areas that have been identified to have high I/I are recommended to continue flow monitoring programs to further investigate the extent of the I/I present in the system. Identification of I/I hotspots during wet-weather events can also be enhanced through smoke and dye testing, CCTV, and manhole inspections. Additionally, the establishment of a wetweather flow reduction program can help to reduce surface runoff entering the sewer system during wet-weather. The prioritization of rehabilitation and maintenance programs can help establish a comprehensive and adaptive approach to manage and reduce I/I in areas with observed high infiltration. 5. Implementing I/I reduction measures can have significant benefits for improving the capacity of the existing sewer pipes and minimizing the need for extensive expansion or upgrades. I/I reduction contributes to the efficient use of existing infrastructure, enabling sewer systems to handle the growing demands of an existing population without the immediate necessity for extensive pipe expansions, supporting a sustainable approach to any planned growth of the City.
Page 24
Civica Infrastructure Inc. • 330 Rodinea Road, Unit 3, Vaughan, Ontario, Canada, L6A 4P5 • 905-417-9792 | www.civi.ca | info@civi.ca
APPENDIX A Flow Monitoring Report
Appendix A – Flow Monitoring Report Kawartha Lakes Water & Wastewater Servicing and Capacity Master Plan Update Monitoring Jan 01, 2023 – Nov 1, 2023 Generated on: Jun 03, 2024
www.civi.ca
Civica Infrastructures Inc. Kawartha Lakes Flow Monitoring Report
Appendix - A June 03, 2024
Table of Contents
Monitoring Station List .................................................................................................................................................................................................................... 6 Report Summary .............................................................................................................................................................................................................................. 8 Aggregate Data Station: B2 ........................................................................................................................................................................................................... 10 Data Chart Station: B2 ................................................................................................................................................................................................................... 11 Sanitary Report Station: B2 ........................................................................................................................................................................................................... 21 I/I Analysis Table Station: B2 ......................................................................................................................................................................................................... 22 I/I Analysis Graph Station: B2 ........................................................................................................................................................................................................ 23 Activity Log Station: B2.................................................................................................................................................................................................................. 51 Aggregate Data Station: B4 ........................................................................................................................................................................................................... 52 Data Chart Station: B4 ................................................................................................................................................................................................................... 53 Sanitary Report Station: B4 ........................................................................................................................................................................................................... 63 I/I Analysis Table Station: B4 ......................................................................................................................................................................................................... 64 I/I Analysis Graph Station: B4 ........................................................................................................................................................................................................ 65 Activity Log Station: B4.................................................................................................................................................................................................................. 93 Aggregate Data Station: B5 ........................................................................................................................................................................................................... 94 Data Chart Station: B5 ................................................................................................................................................................................................................... 95 Sanitary Report Station: B5 ......................................................................................................................................................................................................... 105 I/I Analysis Table Station: B5 ....................................................................................................................................................................................................... 106 I/I Analysis Graph Station: B5 ...................................................................................................................................................................................................... 107 Activity Log Station: B5................................................................................................................................................................................................................ 133 Aggregate Data Station: B6 ......................................................................................................................................................................................................... 134 Data Chart Station: B6 ................................................................................................................................................................................................................. 135 Sanitary Report Station: B6 ......................................................................................................................................................................................................... 145 I/I Analysis Table Station: B6 ....................................................................................................................................................................................................... 146 I/I Analysis Graph Station: B6 ...................................................................................................................................................................................................... 147 Activity Log Station: B6................................................................................................................................................................................................................ 175 Aggregate Data Station: B8 ......................................................................................................................................................................................................... 176 Data Chart Station: B8 ................................................................................................................................................................................................................. 177 Sanitary Report Station: B8 ......................................................................................................................................................................................................... 186 I/I Analysis Table Station: B8 ....................................................................................................................................................................................................... 187 I/I Analysis Graph Station: B8 ...................................................................................................................................................................................................... 188 Activity Log Station: B8................................................................................................................................................................................................................ 214 Aggregate Data Station: B9 ......................................................................................................................................................................................................... 215 Data Chart Station: B9 ................................................................................................................................................................................................................. 216 Sanitary Report Station: B9 ......................................................................................................................................................................................................... 226 I/I Analysis Table Station: B9 ....................................................................................................................................................................................................... 227 I/I Analysis Graph Station: B9 ...................................................................................................................................................................................................... 228 Activity Log Station: B9................................................................................................................................................................................................................ 256 Aggregate Data Station: B10 ....................................................................................................................................................................................................... 257 Data Chart Station: B10 ............................................................................................................................................................................................................... 258 Sanitary Report Station: B10 ....................................................................................................................................................................................................... 268 I/I Analysis Table Station: B10 ..................................................................................................................................................................................................... 269 I/I Analysis Graph Station: B10 .................................................................................................................................................................................................... 270 Activity Log Station: B10.............................................................................................................................................................................................................. 296 Aggregate Data Station: Bobcaygeon ......................................................................................................................................................................................... 297 Data Chart Station: Bobcaygeon ................................................................................................................................................................................................. 298 Activity Log Station: Bobcaygeon................................................................................................................................................................................................ 309 Aggregate Data Station: F1.......................................................................................................................................................................................................... 310 Data Chart Station: F1.................................................................................................................................................................................................................. 311 Sanitary Report Station: F1.......................................................................................................................................................................................................... 321 I/I Analysis Table Station: F1........................................................................................................................................................................................................ 322
1 Civica Infrastructure Inc. www.civi.ca
Civica Infrastructures Inc. Appendix - A Kawartha Lakes Flow Monitoring Report June 03, 2024 I/I Analysis Graph Station: F1 ...................................................................................................................................................................................................... 323 Activity Log Station: F1 ................................................................................................................................................................................................................ 345 Aggregate Data Station: F2.......................................................................................................................................................................................................... 346 Data Chart Station: F2.................................................................................................................................................................................................................. 347 Sanitary Report Station: F2.......................................................................................................................................................................................................... 357 I/I Analysis Table Station: F2........................................................................................................................................................................................................ 358 I/I Analysis Graph Station: F2 ...................................................................................................................................................................................................... 359 Activity Log Station: F2 ................................................................................................................................................................................................................ 373 Aggregate Data Station: F3.......................................................................................................................................................................................................... 374 Data Chart Station: F3.................................................................................................................................................................................................................. 375 Sanitary Report Station: F3.......................................................................................................................................................................................................... 385 I/I Analysis Table Station: F3........................................................................................................................................................................................................ 386 I/I Analysis Graph Station: F3 ...................................................................................................................................................................................................... 387 Activity Log Station: F3 ................................................................................................................................................................................................................ 409 Aggregate Data Station: Fenelon Falls ........................................................................................................................................................................................ 410 Data Chart Station: Fenelon Falls ................................................................................................................................................................................................ 411 Activity Log Station: Fenelon Falls............................................................................................................................................................................................... 421 Aggregate Data Station: L1 .......................................................................................................................................................................................................... 422 Data Chart Station: L1.................................................................................................................................................................................................................. 423 Sanitary Report Station: L1.......................................................................................................................................................................................................... 433 I/I Analysis Table Station: L1........................................................................................................................................................................................................ 434 I/I Analysis Graph Station: L1....................................................................................................................................................................................................... 435 Activity Log Station: L1 ................................................................................................................................................................................................................ 455 Aggregate Data Station: L2 .......................................................................................................................................................................................................... 456 Data Chart Station: L2.................................................................................................................................................................................................................. 457 Sanitary Report Station: L2.......................................................................................................................................................................................................... 467 I/I Analysis Table Station: L2........................................................................................................................................................................................................ 468 I/I Analysis Graph Station: L2....................................................................................................................................................................................................... 469 Activity Log Station: L2 ................................................................................................................................................................................................................ 489 Aggregate Data Station: L3 .......................................................................................................................................................................................................... 490 Data Chart Station: L3.................................................................................................................................................................................................................. 491 Sanitary Report Station: L3.......................................................................................................................................................................................................... 501 I/I Analysis Table Station: L3........................................................................................................................................................................................................ 502 I/I Analysis Graph Station: L3....................................................................................................................................................................................................... 503 Activity Log Station: L3 ................................................................................................................................................................................................................ 523 Aggregate Data Station: L4 .......................................................................................................................................................................................................... 524 Data Chart Station: L4.................................................................................................................................................................................................................. 525 Sanitary Report Station: L4.......................................................................................................................................................................................................... 535 I/I Analysis Table Station: L4........................................................................................................................................................................................................ 536 I/I Analysis Graph Station: L4....................................................................................................................................................................................................... 537 Activity Log Station: L4 ................................................................................................................................................................................................................ 557 Aggregate Data Station: L5 .......................................................................................................................................................................................................... 558 Data Chart Station: L5.................................................................................................................................................................................................................. 559 Sanitary Report Station: L5.......................................................................................................................................................................................................... 569 I/I Analysis Table Station: L5........................................................................................................................................................................................................ 570 I/I Analysis Graph Station: L5....................................................................................................................................................................................................... 571 Activity Log Station: L5 ................................................................................................................................................................................................................ 603 Aggregate Data Station: L6 .......................................................................................................................................................................................................... 604 Data Chart Station: L6.................................................................................................................................................................................................................. 605 Sanitary Report Station: L6.......................................................................................................................................................................................................... 615 I/I Analysis Table Station: L6........................................................................................................................................................................................................ 616 I/I Analysis Graph Station: L6....................................................................................................................................................................................................... 617 Activity Log Station: L6 ................................................................................................................................................................................................................ 647 Aggregate Data Station: L7 .......................................................................................................................................................................................................... 648 Data Chart Station: L7.................................................................................................................................................................................................................. 649 Sanitary Report Station: L7.......................................................................................................................................................................................................... 659 2 Civica Infrastructure Inc. www.civi.ca
Civica Infrastructures Inc. Appendix - A Kawartha Lakes Flow Monitoring Report June 03, 2024 I/I Analysis Table Station: L7........................................................................................................................................................................................................ 660 I/I Analysis Graph Station: L7....................................................................................................................................................................................................... 661 Activity Log Station: L7 ................................................................................................................................................................................................................ 693 Aggregate Data Station: L8 .......................................................................................................................................................................................................... 694 Data Chart Station: L8.................................................................................................................................................................................................................. 695 Sanitary Report Station: L8.......................................................................................................................................................................................................... 702 I/I Analysis Table Station: L8........................................................................................................................................................................................................ 703 I/I Analysis Graph Station: L8....................................................................................................................................................................................................... 704 Activity Log Station: L8 ................................................................................................................................................................................................................ 728 Aggregate Data Station: L9 .......................................................................................................................................................................................................... 729 Data Chart Station: L9.................................................................................................................................................................................................................. 730 Sanitary Report Station: L9.......................................................................................................................................................................................................... 740 I/I Analysis Table Station: L9........................................................................................................................................................................................................ 741 I/I Analysis Graph Station: L9....................................................................................................................................................................................................... 742 Activity Log Station: L9 ................................................................................................................................................................................................................ 774 Aggregate Data Station: L10 ........................................................................................................................................................................................................ 775 Data Chart Station: L10................................................................................................................................................................................................................ 776 Sanitary Report Station: L10........................................................................................................................................................................................................ 786 I/I Analysis Table Station: L10...................................................................................................................................................................................................... 787 I/I Analysis Graph Station: L10..................................................................................................................................................................................................... 788 Activity Log Station: L10 .............................................................................................................................................................................................................. 806 Aggregate Data Station: L11 ........................................................................................................................................................................................................ 807 Data Chart Station: L11................................................................................................................................................................................................................ 808 Sanitary Report Station: L11........................................................................................................................................................................................................ 818 I/I Analysis Table Station: L11...................................................................................................................................................................................................... 819 I/I Analysis Graph Station: L11..................................................................................................................................................................................................... 820 Activity Log Station: L11 .............................................................................................................................................................................................................. 840 Aggregate Data Station: L12 ........................................................................................................................................................................................................ 841 Data Chart Station: L12................................................................................................................................................................................................................ 842 Sanitary Report Station: L12........................................................................................................................................................................................................ 852 I/I Analysis Table Station: L12...................................................................................................................................................................................................... 853 I/I Analysis Graph Station: L12..................................................................................................................................................................................................... 854 Activity Log Station: L12 .............................................................................................................................................................................................................. 874 Aggregate Data Station: 1-1 ........................................................................................................................................................................................................ 875 Sanitary Report Station: 1-1 ........................................................................................................................................................................................................ 876 Data Chart Station: 1-1 ................................................................................................................................................................................................................ 877 I/I Analysis Table Station: 1-1 ...................................................................................................................................................................................................... 884 I/I Analysis Graph Station: 1-1 ..................................................................................................................................................................................................... 885 Activity Log Station: 1-1............................................................................................................................................................................................................... 893 Aggregate Data Station: 1-2 ........................................................................................................................................................................................................ 894 Sanitary Report Station: 1-2 ........................................................................................................................................................................................................ 895 Data Chart Station: 1-2 ................................................................................................................................................................................................................ 896 I/I Analysis Table Station: 1-2 ...................................................................................................................................................................................................... 909 I/I Analysis Graph Station: 1-2 ..................................................................................................................................................................................................... 910 Activity Log Station: 1-2............................................................................................................................................................................................................... 938 Aggregate Data Station: 2-1 ........................................................................................................................................................................................................ 940 Sanitary Report Station: 2-1 ........................................................................................................................................................................................................ 941 Data Chart Station: 2-1 ................................................................................................................................................................................................................ 942 I/I Analysis Table Station: 2-1 ...................................................................................................................................................................................................... 949 I/I Analysis Graph Station: 2-1 ..................................................................................................................................................................................................... 950 Activity Log Station: 2-1............................................................................................................................................................................................................... 974 Aggregate Data Station: 2-2 ........................................................................................................................................................................................................ 975 Sanitary Report Station: 2-2 ........................................................................................................................................................................................................ 976 Data Chart Station: 2-2 ................................................................................................................................................................................................................ 977 I/I Analysis Table Station: 2-2 ...................................................................................................................................................................................................... 990 I/I Analysis Graph Station: 2-2 ..................................................................................................................................................................................................... 991 3 Civica Infrastructure Inc. www.civi.ca
Civica Infrastructures Inc. Appendix - A Kawartha Lakes Flow Monitoring Report June 03, 2024 Activity Log Station: 2-2............................................................................................................................................................................................................. 1017 Aggregate Data Station: 2-3 ...................................................................................................................................................................................................... 1019 Sanitary Report Station: 2-3 ...................................................................................................................................................................................................... 1020 Data Chart Station: 2-3 .............................................................................................................................................................................................................. 1021 I/I Analysis Table Station: 2-3 .................................................................................................................................................................................................... 1034 I/I Analysis Graph Station: 2-3 ................................................................................................................................................................................................... 1035 Activity Log Station: 2-3............................................................................................................................................................................................................. 1063 Aggregate Data Station: 4-1 ...................................................................................................................................................................................................... 1065 Sanitary Report Station: 4-1 ...................................................................................................................................................................................................... 1066 Data Chart Station: 4-1 .............................................................................................................................................................................................................. 1067 I/I Analysis Table Station: 4-1 .................................................................................................................................................................................................... 1079 I/I Analysis Graph Station: 4-1 ................................................................................................................................................................................................... 1080 Activity Log Station: 4-1............................................................................................................................................................................................................. 1108 Aggregate Data Station: 5-1a .................................................................................................................................................................................................... 1110 Sanitary Report Station: 5-1a .................................................................................................................................................................................................... 1111 Data Chart Station: 5-1a ............................................................................................................................................................................................................ 1112 I/I Analysis Table Station: 5-1a .................................................................................................................................................................................................. 1124 I/I Analysis Graph Station: 5-1a ................................................................................................................................................................................................. 1125 Activity Log Station: 5-1a........................................................................................................................................................................................................... 1153 Aggregate Data Station: 5-2 ...................................................................................................................................................................................................... 1156 Sanitary Report Station: 5-2 ...................................................................................................................................................................................................... 1157 Data Chart Station: 5-2 .............................................................................................................................................................................................................. 1158 I/I Analysis Table Station: 5-2 .................................................................................................................................................................................................... 1171 I/I Analysis Graph Station: 5-2 ................................................................................................................................................................................................... 1172 Activity Log Station: 5-2............................................................................................................................................................................................................. 1198 Aggregate Data Station: 6-1 ...................................................................................................................................................................................................... 1200 Sanitary Report Station: 6-1 ...................................................................................................................................................................................................... 1201 Data Chart Station: 6-1 .............................................................................................................................................................................................................. 1202 I/I Analysis Table Station: 6-1 .................................................................................................................................................................................................... 1212 I/I Analysis Graph Station: 6-1 ................................................................................................................................................................................................... 1213 Activity Log Station: 6-1............................................................................................................................................................................................................. 1221 Aggregate Data Station: 6-2 ...................................................................................................................................................................................................... 1222 Sanitary Report Station: 6-2 ...................................................................................................................................................................................................... 1223 Data Chart Station: 6-2 .............................................................................................................................................................................................................. 1224 I/I Analysis Table Station: 6-2 .................................................................................................................................................................................................... 1234 I/I Analysis Graph Station: 6-2 ................................................................................................................................................................................................... 1235 Activity Log Station: 6-2............................................................................................................................................................................................................. 1243 Aggregate Data Station: 6-3 ...................................................................................................................................................................................................... 1244 Sanitary Report Station: 6-3 ...................................................................................................................................................................................................... 1245 Data Chart Station: 6-3 .............................................................................................................................................................................................................. 1246 I/I Analysis Table Station: 6-3 .................................................................................................................................................................................................... 1271 I/I Analysis Graph Station: 6-3 ................................................................................................................................................................................................... 1272 Activity Log Station: 6-3............................................................................................................................................................................................................. 1304 Aggregate Data Station: 6-4 ...................................................................................................................................................................................................... 1306 Sanitary Report Station: 6-4 ...................................................................................................................................................................................................... 1307 Data Chart Station: 6-4 .............................................................................................................................................................................................................. 1308 I/I Analysis Table Station: 6-4 .................................................................................................................................................................................................... 1321 I/I Analysis Graph Station: 6-4 ................................................................................................................................................................................................... 1322 Activity Log Station: 6-4............................................................................................................................................................................................................. 1350 Aggregate Data Station: 6-5 ...................................................................................................................................................................................................... 1352 Sanitary Report Station: 6-5 ...................................................................................................................................................................................................... 1353 Data Chart Station: 6-5 .............................................................................................................................................................................................................. 1354 I/I Analysis Table Station: 6-5 .................................................................................................................................................................................................... 1367 I/I Analysis Graph Station: 6-5 ................................................................................................................................................................................................... 1368 Activity Log Station: 6-5............................................................................................................................................................................................................. 1396 Aggregate Data Station: 6-6 ...................................................................................................................................................................................................... 1398 4 Civica Infrastructure Inc. www.civi.ca
Civica Infrastructures Inc. Appendix - A Kawartha Lakes Flow Monitoring Report June 03, 2024 Sanitary Report Station: 6-6 ...................................................................................................................................................................................................... 1399 Data Chart Station: 6-6 .............................................................................................................................................................................................................. 1400 I/I Analysis Table Station: 6-6 .................................................................................................................................................................................................... 1410 I/I Analysis Graph Station: 6-6 ................................................................................................................................................................................................... 1411 Activity Log Station: 6-6............................................................................................................................................................................................................. 1439 Aggregate Data Station: 6-7 ...................................................................................................................................................................................................... 1441 Sanitary Report Station: 6-7 ...................................................................................................................................................................................................... 1442 Data Chart Station: 6-7 .............................................................................................................................................................................................................. 1443 I/I Analysis Table Station: 6-7 .................................................................................................................................................................................................... 1456 I/I Analysis Graph Station: 6-7 ................................................................................................................................................................................................... 1457 Activity Log Station: 6-7............................................................................................................................................................................................................. 1485 Data Chart Station: Bobcaygeon ............................................................................................................................................................................................... 1486 Data Chart Station: Fenelon Falls .............................................................................................................................................................................................. 1497 Data Chart Station: Lindsay ....................................................................................................................................................................................................... 1507 Data Chart Station: Lindsay - RG01 (2022)................................................................................................................................................................................ 1518 Data Chart Station: Lindsay - RG02 (2022)................................................................................................................................................................................ 1528
5 Civica Infrastructure Inc. www.civi.ca
Civica Infrastructures Inc. Kawartha Lakes Flow Monitoring Report
Appendix - A June 03, 2024
Monitoring Station List Station Name
Station Type
Latitude
Longitude
Start Date
End Date
B2
Sanitary Flow
44.5387451
-78.54156203
Jan 12, 2023 00:00
Oct 17, 2023 11:20
B4
Sanitary Flow
44.53667936
-78.55548917
Jan 24, 2023 00:00
Oct 17, 2023 12:05
B5
Sanitary Flow
44.54196629
-78.54168529
Jan 09, 2023 00:00
Oct 17, 2023 12:05
B6
Sanitary Flow
44.53983786
-78.53525636
Jan 09, 2023 00:00
Oct 24, 2023 11:30
B8
Sanitary Flow
44.53433559
-78.53276562
Feb 15, 2023 00:00
Oct 24, 2023 12:00
B9
Sanitary Flow
44.53098347
-78.53323873
Jan 24, 2023 14:30
Oct 24, 2023 12:30
B10
Sanitary Flow
44.54687348
-78.53446781
Jan 31, 2023 12:00
Oct 24, 2023 13:00
F1
Sanitary Flow
44.53599036
-78.73660363
Jan 16, 2023 00:00
Oct 17, 2023 15:00
F2
Sanitary Flow
44.53143513
-78.72744483
Jan 17, 2023 00:00
Oct 17, 2023 16:00
F3
Sanitary Flow
44.53056102
-78.73432009
Jan 17, 2023 00:00
Oct 17, 2023 16:00
L1
Sanitary Flow
44.37612602
-78.74429639
Jan 11, 2023 00:00
Oct 03, 2023 12:00
L2
Sanitary Flow
44.37459806
-78.74363111
Jan 12, 2023 00:00
Oct 03, 2023 15:00
L3
Sanitary Flow
44.37318035
-78.74286038
Jan 12, 2023 00:00
Oct 03, 2023 16:00
L4
Sanitary Flow
44.37545899
-78.73576035
Jan 10, 2023 00:00
Oct 03, 2023 16:00
L5
Sanitary Flow
44.35004966
-78.72353045
Jan 12, 2023 00:00
Oct 03, 2023 16:00
L6
Sanitary Flow
44.34766252
-78.72751132
Jan 10, 2023 00:00
Oct 03, 2023 14:30
L7
Sanitary Flow
44.34749115
-78.72829514
Jan 23, 2023 00:00
Oct 04, 2023 14:00
L8
Sanitary Flow
44.35511886
-78.76611703
Jan 11, 2023 00:00
Jul 21, 2023 16:30
L9
Sanitary Flow
44.34717591
-78.76273193
Jan 10, 2023 00:00
Oct 04, 2023 14:00
L10
Sanitary Flow
44.36969037
-78.74447601
Jan 09, 2023 00:00
Oct 04, 2023 16:00
L11
Sanitary Flow
44.36497616
-78.74580547
Jan 17, 2023 00:00
Oct 04, 2023 16:00
L12
Sanitary Flow
44.36652574
-78.75415338
Jan 09, 2023 00:00
Oct 04, 2023 16:00
1-1
Sanitary Flow
44.358295
-78.725132
Dec 05, 2021 09:15
Jun 23, 2022 00:00
1-2
Sanitary Flow
44.35794373
-78.72479734
Nov 19, 2021 04:30
Nov 05, 2022 00:00
2-1
Sanitary Flow
44.362802
-78.730903
Apr 28, 2022 11:00
Oct 23, 2022 00:00
2-2
Sanitary Flow
44.36133893
-78.73694996
Nov 25, 2021 08:30
Nov 05, 2022 00:00
2-3
Sanitary Flow
44.359978
-78.736767
Nov 18, 2021 10:15
Nov 05, 2022 00:00
4-1
Sanitary Flow
44.3571639
-78.7298248
Dec 16, 2021 12:00
Nov 05, 2022 00:00
5-1a
Sanitary Flow
44.357086
-78.727512
Dec 01, 2021 23:30
Nov 05, 2022 00:00
6 Civica Infrastructure Inc. www.civi.ca
Civica Infrastructures Inc. Kawartha Lakes Flow Monitoring Report
1
Appendix - A June 03, 2024
Station Name
Station Type
Latitude
Longitude
Start Date
End Date
5-2
Sanitary Flow
44.35561108
-78.72840276
Nov 25, 2021 00:00
Nov 05, 2022 00:00
6-1
Sanitary Flow
44.361256
-78.738428
Nov 18, 2021 14:00
Aug 03, 2022 00:00
6-21
Sanitary Flow
44.361233
-78.738367
Feb 07, 2022 19:00
Nov 05, 2022 00:00
6-3
Sanitary Flow
44.36000146
-78.73901963
Nov 25, 2021 00:00
Nov 05, 2023 00:00
6-4
Sanitary Flow
44.35654373
-78.74024819
Nov 19, 2021 08:30
Nov 05, 2022 00:00
6-5
Sanitary Flow
44.353513
-78.742297
Nov 25, 2021 07:30
Nov 05, 2022 00:00
6-6
Sanitary Flow
44.34375411
-78.7437854
Feb 07, 2022 00:00
Nov 05, 2022 00:00
6-7
Sanitary Flow
44.343764
-78.743803
Nov 25, 2021 00:00
Nov 05, 2022 00:00
Lindsay - RG01 (2021)
Rain Gauge
44.36723034
-78.73085488
May 11, 2022 00:00
Feb 21, 2023 00:00
Lindsay - RG02 (2021)
Rain Gauge
44.3559414
-78.73680639
Oct 14, 2021 00:00
Feb 21, 2023 00:00
RG1 - Bobcaygeon
Rain Gauge
44.53758735
-78.54693927
Jan 01, 2023 00:00
Nov 02, 2023 16:00
RG2 - Bobcaygeon
Rain Gauge
44.54533329
-78.54232068
Feb 22, 2023 00:00
Nov 02, 2023 16:00
RG2 - Fenelon Falls
Rain Gauge
44.53845912
-78.73778421
Feb 21, 2023 00:00
Nov 02, 2023 16:00
RG1 - Fenelon Falls
Rain Gauge
44.52999802
-78.73383612
Feb 21, 2023 00:00
Nov 02, 2023 16:00
RG1 - Lindsay
Rain Gauge
44.34738886
-78.72773955
Jan 01, 2023 00:00
Nov 01, 2023 10:00
RG2 - Lindsay
Rain Gauge
44.34882123
-78.76308262
Jan 09, 2023 00:00
Nov 01, 2023 12:00
RG3 - Lindsay
Rain Gauge
44.36691992
-78.74402304
Jan 09, 2023 00:00
Nov 01, 2023 14:00
6-2: Station moved from MH111 to MH (unknown ID) downstream. Same manhole as 6-1
7 Civica Infrastructure Inc. www.civi.ca
Civica Infrastructures Inc. Kawartha Lakes Flow Monitoring Report
Appendix - A June 03, 2024
Report Summary Station Name
Station Population
Rain Gauge Station Name
Station Tc (min)
Station Pipe Diameter (mm)
Station Area (ha)
Start Date
End Date
Normalized Dry Weather Flow (L/c/d)
Avg Dry Weather Flow (L/s)
GWI (L/s)
Avg Peak I/I Rate (L/s/ha)
Max Peak I/I Rate (L/s/ha)
B2
1017
RG1 - Bobcaygeon
30
450
99.50
Jan 12, 2023
Oct 17, 2023
482.52
5.68
2.51
0.10
0.18
B4
221
RG1 - Bobcaygeon
30
250
49.60
Jan 24, 2023
Oct 17, 2023
266.37
0.68
0.15
0.03
0.07
B5
1932
RG2 - Bobcaygeon
35
750
225.00
Jan 09, 2023
Oct 17, 2023
938.66
20.99
7.63
0.12
0.28
B6
890
RG1 - Bobcaygeon
20
300
76.00
Jan 09, 2023
Oct 24, 2023
108.57
1.12
0.05
0.19
0.32
B8
575
RG1 - Bobcaygeon
20
250
40.00
Feb 15, 2023
Oct 24, 2023
163.93
1.09
0.20
0.07
0.39
B9
94
RG1 - Bobcaygeon
15
300
31.60
Jan 24, 2023
Oct 24, 2023
400.92
0.44
0.10
0.04
0.11
B10
239
RG2 - Bobcaygeon
25
250
27.50
Jan 31, 2023
Oct 24, 2023
289.51
0.80
0.21
0.09
0.17
F1
1654
RG2 - Fenelon Falls
30
300
106.01
Jan 16, 2023
Oct 17, 2023
461.99
8.84
1.55
0.32
0.57
F2
152
RG1 - Fenelon Falls
25
200
9.50
Jan 17, 2023
Oct 17, 2023
610.14
1.07
0.53
0.34
1.17
F3
2254
RG1 - Fenelon Falls
35
450
173.00
Jan 17, 2023
Oct 17, 2023
653.17
17.04
3.56
0.19
0.32
L1
711
RG3 - Lindsay
35
250
42.80
Jan 11, 2023
Oct 03, 2023
302.32
2.49
0.91
0.13
0.36
L2
2640
RG3 - Lindsay
65
525
116.50
Jan 12, 2023
Oct 03, 2023
319.01
9.75
3.33
0.32
0.43
L3
3314
RG3 - Lindsay
75
500
58.03
Jan 12, 2023
Oct 03, 2023
323.84
12.42
7.22
0.71
1.15
L4
87
RG3 - Lindsay
15
300
5.70
Jan 10, 2023
Oct 03, 2023
197.54
0.20
0.02
0.37
1.14
L5
232
RG1 - Lindsay
35
525
27.80
Jan 12, 2023
Oct 03, 2023
590.13
1.58
0.47
0.20
0.70
L6
113
RG - Lindsay
25
200
6.10
Jan 10, 2023
Oct 03, 2023
807.20
1.06
0.49
0.58
1.09
L7
575
RG - Lindsay
20
300
11.50
Jan 23, 2023
Oct 04, 2023
162.26
1.08
0.52
0.22
0.41
L8
738
RG2 - Lindsay
40
525
155.60
Jan 11, 2023
Jul 21, 2023
785.90
6.71
1.85
0.12
0.18
L9
736
RG2 - Lindsay
25
375
71.30
Jan 10, 2023
Oct 04, 2023
367.79
3.13
0.77
0.10
0.16
L10
2650
RG3 - Lindsay
65
400
118.70
Jan 09, 2023
Oct 04, 2023
322.26
9.88
5.39
0.35
0.43
L11
1318
RG3 - Lindsay
45
250
69.80
Jan 17, 2023
Oct 04, 2023
469.51
7.16
1.55
0.34
0.59
L12
1677
RG3 - Lindsay
50
300
71.50
Jan 09, 2023
Oct 04, 2023
311.63
6.05
2.96
0.39
0.71
1-1
561
Lindsay - RG02 (2022)
20
300
44.80
Dec 05, 2021
Jun 22, 2022
837.44
5.44
3.59
18.47
34.53
1-2
1173
Lindsay - RG02 (2022)
25
450
74.60
Nov 19, 2021
Nov 04, 2022
384.31
5.22
2.97
5.95
17.90
2-1
384
Lindsay - RG02 (2022)
30
375
50.70
Apr 28, 2022
Oct 22, 2022
816.67
3.63
1.22
28.47
50.19
2-2
989
Lindsay - RG02 (2022)
35
575
99.20
Nov 25, 2021
Nov 04, 2022
779.10
8.92
3.63
32.98
82.24
2-3
1120
Lindsay - RG02 (2022)
30
375
24.30
Nov 18, 2021
Nov 04, 2022
176.23
2.28
1.30
6.02
16.72
4-1
1582
Lindsay - RG02 (2022)
40
525
54.50
Dec 16, 2021
Nov 04, 2022
332.65
6.09
2.56
32.74
58.51
5-1a
110
Lindsay - RG02 (2022)
25
300
5.80
Dec 01, 2021
Nov 04, 2022
874.26
1.11
0.63
2.76
8.11
8 Civica Infrastructure Inc. www.civi.ca
Civica Infrastructures Inc. Kawartha Lakes Flow Monitoring Report
Appendix - A June 03, 2024
Station Name
Station Population
Rain Gauge Station Name
Station Tc (min)
Station Pipe Diameter (mm)
Station Area (ha)
Start Date
End Date
Normalized Dry Weather Flow (L/c/d)
Avg Dry Weather Flow (L/s)
GWI (L/s)
Avg Peak I/I Rate (L/s/ha)
Max Peak I/I Rate (L/s/ha)
5-2
1120
Lindsay - RG02 (2022)
35
300
37.70
Nov 25, 2021
Nov 04, 2022
274.30
3.56
1.93
6.25
18.06
6-1
311
Lindsay - RG02 (2022)
20
275
12.50
Nov 18, 2021
Aug 02, 2022
671.00
2.42
0.73
6.96
11.14
6-2
7687
Lindsay - RG02 (2022)
100
600
421.00
Feb 07, 2022
Nov 04, 2022
757.09
67.36
44.18
72.51
117.85
6-3
6820
Lindsay - RG02 (2022)
80
500
380.80
Nov 25, 2021
Nov 04, 2023
406.45
32.08
18.28
49.56
131.82
6-4
6001
Lindsay - RG02 (2022)
40
500
342.90
Nov 19, 2021
Nov 04, 2022
69.70
4.84
1.65
22.48
41.36
6-5
4354
Lindsay - RG02 (2022)
60
525
275.30
Nov 25, 2021
Nov 04, 2022
392.60
19.78
10.80
28.55
78.88
6-6
1260
Lindsay - RG02 (2022)
35
300
156.70
Feb 07, 2022
Nov 04, 2022
708.19
10.33
4.13
9.43
19.11
6-7
662
Lindsay - RG02 (2022)
30
225
36.70
Nov 25, 2021
Nov 04, 2022
620.36
4.75
2.59
4.81
9.00
9 Civica Infrastructure Inc. www.civi.ca
Civica Infrastructures Inc. Kawartha Lakes Flow Monitoring Report
Appendix - A June 03, 2024
Aggregate Data Station: B2
Precipitation Date From
Date To
Days
Min (mm)
Avg (mm)
Max (mm)
Sum (mm)
Count
Time of Min1
Time of Max1
Jan 12, 2023
Oct 17, 2023
279
0.00
0.01
5.00
639.00
80,085
Thu Jan 12, 2023 00:00
Fri Oct 06, 2023 18:10
Level Date From
Date To
Days
Min (m)
Avg (m)
Max (m)
Count
Time of Min1
Time of Max1
Jan 12, 2023
Oct 17, 2023
279
0.06
0.07
0.11
80,020
Thu Sep 21, 2023 00:10
Sat Aug 12, 2023 11:10
Velocity Date From
Date To
Days
Min (m/s)
Avg (m/s)
Max (m/s)
Count
Time of Min1
Time of Max1
Jan 12, 2023
Oct 17, 2023
279
0.03
0.38
0.89
80,020
Fri Jun 02, 2023 18:15
Sat Aug 12, 2023 11:15
Flow
1
Date From
Date To
Days
Min (L/s)
Avg (L/s)
Max (L/s)
Total Volume (1,000,000 L)
Count
Time of Min1
Time of Max1
Jan 12, 2023
Oct 17, 2023
279
0.47
6.02
24.58
144.54
80,020
Fri Jun 02, 2023 18:15
Sat Aug 12, 2023 11:15
Time of Min and Time of Max will be displayed by first occurrence
10 Civica Infrastructure Inc. www.civi.ca
Civica Infrastructures Inc. Kawartha Lakes Flow Monitoring Report
Appendix - A June 03, 2024
Data Chart Station: B2 Jan 12, 2023 – Jan 31, 2023
11 Civica Infrastructure Inc. www.civi.ca
Civica Infrastructures Inc. Kawartha Lakes Flow Monitoring Report
Appendix - A June 03, 2024
Data Chart Station: B2 Feb 01, 2023 – Feb 28, 2023
12 Civica Infrastructure Inc. www.civi.ca
Civica Infrastructures Inc. Kawartha Lakes Flow Monitoring Report
Appendix - A June 03, 2024
Data Chart Station: B2 Mar 01, 2023 – Mar 31, 2023
13 Civica Infrastructure Inc. www.civi.ca
Civica Infrastructures Inc. Kawartha Lakes Flow Monitoring Report
Appendix - A June 03, 2024
Data Chart Station: B2 Apr 01, 2023 – Apr 30, 2023
14 Civica Infrastructure Inc. www.civi.ca
Civica Infrastructures Inc. Kawartha Lakes Flow Monitoring Report
Appendix - A June 03, 2024
Data Chart Station: B2 May 01, 2023 – May 31, 2023
15 Civica Infrastructure Inc. www.civi.ca
Civica Infrastructures Inc. Kawartha Lakes Flow Monitoring Report
Appendix - A June 03, 2024
Data Chart Station: B2 Jun 01, 2023 – Jun 30, 2023
16 Civica Infrastructure Inc. www.civi.ca
Civica Infrastructures Inc. Kawartha Lakes Flow Monitoring Report
Appendix - A June 03, 2024
Data Chart Station: B2 Jul 01, 2023 – Jul 31, 2023
17 Civica Infrastructure Inc. www.civi.ca
Civica Infrastructures Inc. Kawartha Lakes Flow Monitoring Report
Appendix - A June 03, 2024
Data Chart Station: B2 Aug 01, 2023 – Aug 31, 2023
18 Civica Infrastructure Inc. www.civi.ca
Civica Infrastructures Inc. Kawartha Lakes Flow Monitoring Report
Appendix - A June 03, 2024
Data Chart Station: B2 Sep 01, 2023 – Sep 30, 2023
19 Civica Infrastructure Inc. www.civi.ca
Civica Infrastructures Inc. Kawartha Lakes Flow Monitoring Report
Appendix - A June 03, 2024
Data Chart Station: B2 Oct 01, 2023 – Oct 17, 2023
20 Civica Infrastructure Inc. www.civi.ca
Civica Infrastructures Inc. Kawartha Lakes Flow Monitoring Report
Appendix - A June 03, 2024
Sanitary Report Station: B2
1
Average Dry Weather Flow (L/s)
Average Dry Weather Flow (L/c/d)
Average Daily Minimum Dry Weather Flow (L/s)
Average Daily Peak Dry Weather Flow (L/s)
5.680
482.520
2.949
11.717
Peaking Factor
Groundwater Infiltration (L/s)1
Groundwater Infiltration (L/ha/d)
% of GWI in Average DWF
2.063
2.507
2,176.756
44.136
Groundwater infiltration (GWI) is assumed as 85% of the daily minimum flow averaged over the monitoring period
21 Civica Infrastructure Inc. www.civi.ca
Civica Infrastructures Inc. Kawartha Lakes Flow Monitoring Report
Appendix - A June 03, 2024
I/I Analysis Table
1
Event1
Total Precipitation (mm)
Duration (hours)
Peak Intensity Over Tc at Station (mm/hr)
Feb 09, 2023
39.75
14.42
Mar 16, 2023
19.50
Mar 31, 2023
B2 Measured Peak Flow (L/s)
Peak I/I Flow (L/s)
Peak I/I Rate (L/s/ha)
Volumetric Runoff Coefficient (CV%)
Peaking Factor (PF)
9.00
20.44
14.91
0.15
1.48 %
2.68
12.75
3.00
15.90
8.88
0.09
1.35 %
1.55
22.00
16.50
7.00
17.14
8.86
0.09
0.90 %
1.20
Apr 05, 2023
28.75
10.67
17.50
24.31
15.80
0.16
1.72 %
2.25
Apr 28, 2023
34.00
52.92
8.50
16.19
8.38
0.08
0.64 %
1.45
May 19, 2023
35.00
17.92
7.00
16.40
9.56
0.10
0.53 %
1.72
Jun 11, 2023
51.00
28.58
10.50
15.03
8.08
0.08
0.61 %
1.58
Jun 27, 2023
15.25
10.67
8.50
12.08
4.94
0.05
0.38 %
0.96
Jul 13, 2023
16.25
4.08
7.00
12.12
6.33
0.06
0.37 %
1.12
Jul 20, 2023
17.50
18.75
8.50
13.00
6.95
0.07
0.50 %
1.36
Jul 29, 2023
16.50
3.42
13.00
15.98
8.19
0.08
0.41 %
1.30
Aug 12, 2023
15.00
25.58
22.50
24.58
17.40
0.18
0.75 %
3.13
Oct 05, 2023
35.75
34.67
16.50
13.91
8.41
0.09
0.43 %
1.76
Oct 08, 2023
28.75
81.08
3.50
12.94
7.15
0.07
1.00 %
1.51
Average
26.79
23.72
10.14
16.43
9.56
0.10
0.79 %
1.68
Maximum
51.00
81.08
22.50
24.58
17.40
0.18
1.72 %
3.13
Flow KPIs
Measured Storms
Station: B2
An event is a storm with a minimum volume of 15mm and a minimum inter-event dry period of 12 hours
22 Civica Infrastructure Inc. www.civi.ca
Civica Infrastructures Inc. Kawartha Lakes Flow Monitoring Report
Appendix - A June 03, 2024
I/I Analysis Graph Station: B2
23 Civica Infrastructure Inc. www.civi.ca
Civica Infrastructures Inc. Kawartha Lakes Flow Monitoring Report
Appendix - A June 03, 2024
Infiltration/Inflow Event Analysis Station: B2 Feb 08, 2023 21:00 – Feb 10, 2023 11:25, Total Precipitation: 39.75 mm (39,551,250.00 L) Station Details
Storm Details
Catchment Area
99.50 ha
Total Precipitation
39.75 mm (39,551,250.00 L)
Duration of Storm
14.42 hr
Time of Concentration (Tc) 1
30 min
Peak Precipitation Intensity Over Tc 2
9.00 mm/hr
Return Period over Tc 3
< 2 Yr
Measured Flow
I/I Flow
Time of Peak Measured Flow
Feb 09, 2023 18:00
Time of Peak I/I Flow (TD)
Feb 09, 2023 18:00
Estimated Dry Weather Flow at TD
5.53 L/s
Peak Measured Flow
20.44 L/s
Peak I/I Flow 4
14.91 L/s
Peak I/I Rate 5
0.15 L/s/ha
Peak Measured Depth
107.00 mm
Total I/I Flow Volume during event
584,415.00 L
Volumetric Coefficient (Cv%) 6
1.48%
Total Measured Flow Volume during Event
1,115,116.70 L
Peak I/I Coefficient 7
0.0060
Hourly Wet-Weather Peaking Factor 8
3.25
Instantaneous Wet-Weather Peaking Factor 9
3.67
1
Time of Concentration (Tc): The estimated time for the flow to travel from the furthest point in the upstream area to the point of monitoring, assume flow is travelling at 1.00 m/s Peak Precipitation Intensity Over Tc: The peak rainfall intensity for the duration of the storm with the time interval defined by time of concentration 3 Return Period over Tc: The estimated time to elapse before a storm of equal or greater intensity will likely occur again, based on design storm criteria 4 Peak I/I Flow: The greatest difference captured between measured flow and estimated dry weather flow, Peak I/I Flow = Maximum (Measured Flow – Estimated Dry Weather Flow) 5 Peak I/I Rate: A normalized peak I/I flow based on catchment area size, Peak I/I Rate = Peak I/I Flow / Catchment Area 6 Volumetric Coefficient (Cv%): The ratio of total I/I volume and total rainfall volume, Cv% = Total I/I Flow Volume / Total Precipitation Volume * 100% 7 Peak I/ I Coefficient: The ratio of peak I/I flow and peak rainfall intensity, Peak I/ I Coefficient = Peak I/I Flow / (Peak Rainfall Intensity over Tc * Catchment Area) 8 Hourly Wet‐Weather Peaking Factor: The ratio of peak hourly wet‐weather measured flow and average dry‐weather flow, Wet‐Weather Peaking Factor = Peak Hourly Wet‐Weather Measured Flow / Average Dry-Weather Flow 9 Instantaneous Wet‐Weather Peaking Factor: The ratio of peak wet‐weather measured flow and average dry‐weather flow, Wet‐Weather Peaking Factor = Peak Wet‐Weather Measured Flow / Average Dry-Weather Flow 2
24 Civica Infrastructure Inc. www.civi.ca
Civica Infrastructures Inc. Kawartha Lakes Flow Monitoring Report
Appendix - A June 03, 2024
I/I Analysis Graph Station: B2
25 Civica Infrastructure Inc. www.civi.ca
Civica Infrastructures Inc. Kawartha Lakes Flow Monitoring Report
Appendix - A June 03, 2024
Infiltration/Inflow Event Analysis Station: B2 Mar 16, 2023 11:05 – Mar 17, 2023 23:50, Total Precipitation: 19.50 mm (19,402,500.00 L) Station Details
Storm Details
Catchment Area
99.50 ha
Total Precipitation
19.50 mm (19,402,500.00 L)
Duration of Storm
12.75 hr
Time of Concentration (Tc) 1
30 min
Peak Precipitation Intensity Over Tc 2
3.00 mm/hr
Return Period over Tc 3
< 2 Yr
Measured Flow
I/I Flow
Time of Peak Measured Flow
Mar 17, 2023 16:30
Time of Peak I/I Flow (TD)
Mar 17, 2023 16:30
Estimated Dry Weather Flow at TD
7.02 L/s
Peak Measured Flow
15.90 L/s
Peak I/I Flow 4
8.88 L/s
Peak I/I Rate 5
0.09 L/s/ha
Peak Measured Depth
92.00 mm
Total I/I Flow Volume during event
261,705.20 L
Volumetric Coefficient (Cv%) 6
1.35%
Total Measured Flow Volume during Event
773,268.80 L
Peak I/I Coefficient 7
0.0107
Hourly Wet-Weather Peaking Factor 8
2.11
Instantaneous Wet-Weather Peaking Factor 9
2.78
1
Time of Concentration (Tc): The estimated time for the flow to travel from the furthest point in the upstream area to the point of monitoring, assume flow is travelling at 1.00 m/s Peak Precipitation Intensity Over Tc: The peak rainfall intensity for the duration of the storm with the time interval defined by time of concentration 3 Return Period over Tc: The estimated time to elapse before a storm of equal or greater intensity will likely occur again, based on design storm criteria 4 Peak I/I Flow: The greatest difference captured between measured flow and estimated dry weather flow, Peak I/I Flow = Maximum (Measured Flow – Estimated Dry Weather Flow) 5 Peak I/I Rate: A normalized peak I/I flow based on catchment area size, Peak I/I Rate = Peak I/I Flow / Catchment Area 6 Volumetric Coefficient (Cv%): The ratio of total I/I volume and total rainfall volume, Cv% = Total I/I Flow Volume / Total Precipitation Volume * 100% 7 Peak I/ I Coefficient: The ratio of peak I/I flow and peak rainfall intensity, Peak I/ I Coefficient = Peak I/I Flow / (Peak Rainfall Intensity over Tc * Catchment Area) 8 Hourly Wet‐Weather Peaking Factor: The ratio of peak hourly wet‐weather measured flow and average dry‐weather flow, Wet‐Weather Peaking Factor = Peak Hourly Wet‐Weather Measured Flow / Average Dry-Weather Flow 9 Instantaneous Wet‐Weather Peaking Factor: The ratio of peak wet‐weather measured flow and average dry‐weather flow, Wet‐Weather Peaking Factor = Peak Wet‐Weather Measured Flow / Average Dry-Weather Flow 2
26 Civica Infrastructure Inc. www.civi.ca
Civica Infrastructures Inc. Kawartha Lakes Flow Monitoring Report
Appendix - A June 03, 2024
I/I Analysis Graph Station: B2
27 Civica Infrastructure Inc. www.civi.ca
Civica Infrastructures Inc. Kawartha Lakes Flow Monitoring Report
Appendix - A June 03, 2024
Infiltration/Inflow Event Analysis Station: B2 Mar 31, 2023 00:55 – Apr 01, 2023 17:25, Total Precipitation: 22.00 mm (21,890,000.00 L) Station Details
Storm Details
Catchment Area
99.50 ha
Total Precipitation
22.00 mm (21,890,000.00 L)
Duration of Storm
16.50 hr
Time of Concentration (Tc) 1
30 min
Peak Precipitation Intensity Over Tc 2
7.00 mm/hr
Return Period over Tc 3
< 2 Yr
Measured Flow
I/I Flow
Time of Peak Measured Flow
Apr 01, 2023 11:55
Time of Peak I/I Flow (TD)
Apr 01, 2023 11:55
Estimated Dry Weather Flow at TD
8.28 L/s
Peak Measured Flow
17.14 L/s
Peak I/I Flow 4
8.86 L/s
Peak I/I Rate 5
0.09 L/s/ha
Peak Measured Depth
95.00 mm
Total I/I Flow Volume during event
197,769.70 L
Volumetric Coefficient (Cv%) 6
0.90%
Total Measured Flow Volume during Event
958,818.90 L
Peak I/I Coefficient 7
0.0046
Hourly Wet-Weather Peaking Factor 8
1.68
Instantaneous Wet-Weather Peaking Factor 9
2.32
1
Time of Concentration (Tc): The estimated time for the flow to travel from the furthest point in the upstream area to the point of monitoring, assume flow is travelling at 1.00 m/s Peak Precipitation Intensity Over Tc: The peak rainfall intensity for the duration of the storm with the time interval defined by time of concentration 3 Return Period over Tc: The estimated time to elapse before a storm of equal or greater intensity will likely occur again, based on design storm criteria 4 Peak I/I Flow: The greatest difference captured between measured flow and estimated dry weather flow, Peak I/I Flow = Maximum (Measured Flow – Estimated Dry Weather Flow) 5 Peak I/I Rate: A normalized peak I/I flow based on catchment area size, Peak I/I Rate = Peak I/I Flow / Catchment Area 6 Volumetric Coefficient (Cv%): The ratio of total I/I volume and total rainfall volume, Cv% = Total I/I Flow Volume / Total Precipitation Volume * 100% 7 Peak I/ I Coefficient: The ratio of peak I/I flow and peak rainfall intensity, Peak I/ I Coefficient = Peak I/I Flow / (Peak Rainfall Intensity over Tc * Catchment Area) 8 Hourly Wet‐Weather Peaking Factor: The ratio of peak hourly wet‐weather measured flow and average dry‐weather flow, Wet‐Weather Peaking Factor = Peak Hourly Wet‐Weather Measured Flow / Average Dry-Weather Flow 9 Instantaneous Wet‐Weather Peaking Factor: The ratio of peak wet‐weather measured flow and average dry‐weather flow, Wet‐Weather Peaking Factor = Peak Wet‐Weather Measured Flow / Average Dry-Weather Flow 2
28 Civica Infrastructure Inc. www.civi.ca
Civica Infrastructures Inc. Kawartha Lakes Flow Monitoring Report
Appendix - A June 03, 2024
I/I Analysis Graph Station: B2
29 Civica Infrastructure Inc. www.civi.ca
Civica Infrastructures Inc. Kawartha Lakes Flow Monitoring Report
Appendix - A June 03, 2024
Infiltration/Inflow Event Analysis Station: B2 Apr 04, 2023 17:50 – Apr 06, 2023 04:30, Total Precipitation: 28.75 mm (28,606,250.00 L) Station Details
Storm Details
Catchment Area
99.50 ha
Total Precipitation
28.75 mm (28,606,250.00 L)
Duration of Storm
10.67 hr
Time of Concentration (Tc) 1
30 min
Peak Precipitation Intensity Over Tc 2
17.50 mm/hr
Return Period over Tc 3
< 2 Yr
Measured Flow
I/I Flow
Time of Peak Measured Flow
Apr 05, 2023 12:05
Time of Peak I/I Flow (TD)
Apr 05, 2023 14:20
Estimated Dry Weather Flow at TD
7.37 L/s
Peak Measured Flow
24.31 L/s
Peak I/I Flow 4
15.80 L/s
Peak I/I Rate 5
0.16 L/s/ha
Peak Measured Depth
110.50 mm
Total I/I Flow Volume during event
490,910.80 L
Volumetric Coefficient (Cv%) 6
1.72%
Total Measured Flow Volume during Event
1,066,787.70 L
Peak I/I Coefficient 7
0.0033
Hourly Wet-Weather Peaking Factor 8
2.44
Instantaneous Wet-Weather Peaking Factor 9
3.46
1
Time of Concentration (Tc): The estimated time for the flow to travel from the furthest point in the upstream area to the point of monitoring, assume flow is travelling at 1.00 m/s Peak Precipitation Intensity Over Tc: The peak rainfall intensity for the duration of the storm with the time interval defined by time of concentration 3 Return Period over Tc: The estimated time to elapse before a storm of equal or greater intensity will likely occur again, based on design storm criteria 4 Peak I/I Flow: The greatest difference captured between measured flow and estimated dry weather flow, Peak I/I Flow = Maximum (Measured Flow – Estimated Dry Weather Flow) 5 Peak I/I Rate: A normalized peak I/I flow based on catchment area size, Peak I/I Rate = Peak I/I Flow / Catchment Area 6 Volumetric Coefficient (Cv%): The ratio of total I/I volume and total rainfall volume, Cv% = Total I/I Flow Volume / Total Precipitation Volume * 100% 7 Peak I/ I Coefficient: The ratio of peak I/I flow and peak rainfall intensity, Peak I/ I Coefficient = Peak I/I Flow / (Peak Rainfall Intensity over Tc * Catchment Area) 8 Hourly Wet‐Weather Peaking Factor: The ratio of peak hourly wet‐weather measured flow and average dry‐weather flow, Wet‐Weather Peaking Factor = Peak Hourly Wet‐Weather Measured Flow / Average Dry-Weather Flow 9 Instantaneous Wet‐Weather Peaking Factor: The ratio of peak wet‐weather measured flow and average dry‐weather flow, Wet‐Weather Peaking Factor = Peak Wet‐Weather Measured Flow / Average Dry-Weather Flow 2
30 Civica Infrastructure Inc. www.civi.ca
Civica Infrastructures Inc. Kawartha Lakes Flow Monitoring Report
Appendix - A June 03, 2024
I/I Analysis Graph Station: B2
31 Civica Infrastructure Inc. www.civi.ca
Civica Infrastructures Inc. Kawartha Lakes Flow Monitoring Report
Appendix - A June 03, 2024
Infiltration/Inflow Event Analysis Station: B2 Apr 28, 2023 08:40 – May 01, 2023 13:35, Total Precipitation: 34.00 mm (33,830,000.00 L) Station Details
Storm Details
Catchment Area
99.50 ha
Total Precipitation
34.00 mm (33,830,000.00 L)
Duration of Storm
52.92 hr
Time of Concentration (Tc) 1
30 min
Peak Precipitation Intensity Over Tc 2
8.50 mm/hr
Return Period over Tc 3
< 2 Yr
Measured Flow
I/I Flow
Time of Peak Measured Flow
May 01, 2023 09:25
Time of Peak I/I Flow (TD)
May 01, 2023 09:25
Estimated Dry Weather Flow at TD
7.81 L/s
Peak Measured Flow
16.19 L/s
Peak I/I Flow 4
8.38 L/s
Peak I/I Rate 5
0.08 L/s/ha
Peak Measured Depth
98.00 mm
Total I/I Flow Volume during event
217,777.80 L
Volumetric Coefficient (Cv%) 6
0.64%
Total Measured Flow Volume during Event
1,574,727.70 L
Peak I/I Coefficient 7
0.0036
Hourly Wet-Weather Peaking Factor 8
2.00
Instantaneous Wet-Weather Peaking Factor 9
2.79
1
Time of Concentration (Tc): The estimated time for the flow to travel from the furthest point in the upstream area to the point of monitoring, assume flow is travelling at 1.00 m/s Peak Precipitation Intensity Over Tc: The peak rainfall intensity for the duration of the storm with the time interval defined by time of concentration 3 Return Period over Tc: The estimated time to elapse before a storm of equal or greater intensity will likely occur again, based on design storm criteria 4 Peak I/I Flow: The greatest difference captured between measured flow and estimated dry weather flow, Peak I/I Flow = Maximum (Measured Flow – Estimated Dry Weather Flow) 5 Peak I/I Rate: A normalized peak I/I flow based on catchment area size, Peak I/I Rate = Peak I/I Flow / Catchment Area 6 Volumetric Coefficient (Cv%): The ratio of total I/I volume and total rainfall volume, Cv% = Total I/I Flow Volume / Total Precipitation Volume * 100% 7 Peak I/ I Coefficient: The ratio of peak I/I flow and peak rainfall intensity, Peak I/ I Coefficient = Peak I/I Flow / (Peak Rainfall Intensity over Tc * Catchment Area) 8 Hourly Wet‐Weather Peaking Factor: The ratio of peak hourly wet‐weather measured flow and average dry‐weather flow, Wet‐Weather Peaking Factor = Peak Hourly Wet‐Weather Measured Flow / Average Dry-Weather Flow 9 Instantaneous Wet‐Weather Peaking Factor: The ratio of peak wet‐weather measured flow and average dry‐weather flow, Wet‐Weather Peaking Factor = Peak Wet‐Weather Measured Flow / Average Dry-Weather Flow 2
32 Civica Infrastructure Inc. www.civi.ca
Civica Infrastructures Inc. Kawartha Lakes Flow Monitoring Report
Appendix - A June 03, 2024
I/I Analysis Graph Station: B2
33 Civica Infrastructure Inc. www.civi.ca
Civica Infrastructures Inc. Kawartha Lakes Flow Monitoring Report
Appendix - A June 03, 2024
Infiltration/Inflow Event Analysis Station: B2 May 19, 2023 09:15 – May 21, 2023 03:10, Total Precipitation: 35.00 mm (34,825,000.00 L) Station Details
Storm Details
Catchment Area
99.50 ha
Total Precipitation
35.00 mm (34,825,000.00 L)
Duration of Storm
17.92 hr
Time of Concentration (Tc) 1
30 min
Peak Precipitation Intensity Over Tc 2
7.00 mm/hr
Return Period over Tc 3
< 2 Yr
Measured Flow
I/I Flow
Time of Peak Measured Flow
May 20, 2023 11:45
Time of Peak I/I Flow (TD)
May 20, 2023 11:45
Estimated Dry Weather Flow at TD
6.83 L/s
Peak Measured Flow
16.40 L/s
Peak I/I Flow 4
9.56 L/s
Peak I/I Rate 5
0.10 L/s/ha
Peak Measured Depth
92.00 mm
Total I/I Flow Volume during event
185,959.60 L
Volumetric Coefficient (Cv%) 6
0.53%
Total Measured Flow Volume during Event
786,717.20 L
Peak I/I Coefficient 7
0.0049
Hourly Wet-Weather Peaking Factor 8
2.13
Instantaneous Wet-Weather Peaking Factor 9
2.95
1
Time of Concentration (Tc): The estimated time for the flow to travel from the furthest point in the upstream area to the point of monitoring, assume flow is travelling at 1.00 m/s Peak Precipitation Intensity Over Tc: The peak rainfall intensity for the duration of the storm with the time interval defined by time of concentration 3 Return Period over Tc: The estimated time to elapse before a storm of equal or greater intensity will likely occur again, based on design storm criteria 4 Peak I/I Flow: The greatest difference captured between measured flow and estimated dry weather flow, Peak I/I Flow = Maximum (Measured Flow – Estimated Dry Weather Flow) 5 Peak I/I Rate: A normalized peak I/I flow based on catchment area size, Peak I/I Rate = Peak I/I Flow / Catchment Area 6 Volumetric Coefficient (Cv%): The ratio of total I/I volume and total rainfall volume, Cv% = Total I/I Flow Volume / Total Precipitation Volume * 100% 7 Peak I/ I Coefficient: The ratio of peak I/I flow and peak rainfall intensity, Peak I/ I Coefficient = Peak I/I Flow / (Peak Rainfall Intensity over Tc * Catchment Area) 8 Hourly Wet‐Weather Peaking Factor: The ratio of peak hourly wet‐weather measured flow and average dry‐weather flow, Wet‐Weather Peaking Factor = Peak Hourly Wet‐Weather Measured Flow / Average Dry-Weather Flow 9 Instantaneous Wet‐Weather Peaking Factor: The ratio of peak wet‐weather measured flow and average dry‐weather flow, Wet‐Weather Peaking Factor = Peak Wet‐Weather Measured Flow / Average Dry-Weather Flow 2
34 Civica Infrastructure Inc. www.civi.ca
Civica Infrastructures Inc. Kawartha Lakes Flow Monitoring Report
Appendix - A June 03, 2024
I/I Analysis Graph Station: B2
35 Civica Infrastructure Inc. www.civi.ca
Civica Infrastructures Inc. Kawartha Lakes Flow Monitoring Report
Appendix - A June 03, 2024
Infiltration/Inflow Event Analysis Station: B2 Jun 11, 2023 06:00 – Jun 13, 2023 10:35, Total Precipitation: 51.00 mm (50,745,000.00 L) Station Details
Storm Details
Catchment Area
99.50 ha
Total Precipitation
51.00 mm (50,745,000.00 L)
Duration of Storm
28.58 hr
Time of Concentration (Tc) 1
30 min
Peak Precipitation Intensity Over Tc 2
10.50 mm/hr
Return Period over Tc 3
< 2 Yr
Measured Flow
I/I Flow
Time of Peak Measured Flow
Jun 12, 2023 09:55
Time of Peak I/I Flow (TD)
Jun 12, 2023 13:05
Estimated Dry Weather Flow at TD
5.65 L/s
Peak Measured Flow
15.03 L/s
Peak I/I Flow 4
8.08 L/s
Peak I/I Rate 5
0.08 L/s/ha
Peak Measured Depth
97.97 mm
Total I/I Flow Volume during event
310,775.10 L
Volumetric Coefficient (Cv%) 6
0.61%
Total Measured Flow Volume during Event
1,059,291.50 L
Peak I/I Coefficient 7
0.0028
Hourly Wet-Weather Peaking Factor 8
2.24
Instantaneous Wet-Weather Peaking Factor 9
2.94
1
Time of Concentration (Tc): The estimated time for the flow to travel from the furthest point in the upstream area to the point of monitoring, assume flow is travelling at 1.00 m/s Peak Precipitation Intensity Over Tc: The peak rainfall intensity for the duration of the storm with the time interval defined by time of concentration 3 Return Period over Tc: The estimated time to elapse before a storm of equal or greater intensity will likely occur again, based on design storm criteria 4 Peak I/I Flow: The greatest difference captured between measured flow and estimated dry weather flow, Peak I/I Flow = Maximum (Measured Flow – Estimated Dry Weather Flow) 5 Peak I/I Rate: A normalized peak I/I flow based on catchment area size, Peak I/I Rate = Peak I/I Flow / Catchment Area 6 Volumetric Coefficient (Cv%): The ratio of total I/I volume and total rainfall volume, Cv% = Total I/I Flow Volume / Total Precipitation Volume * 100% 7 Peak I/ I Coefficient: The ratio of peak I/I flow and peak rainfall intensity, Peak I/ I Coefficient = Peak I/I Flow / (Peak Rainfall Intensity over Tc * Catchment Area) 8 Hourly Wet‐Weather Peaking Factor: The ratio of peak hourly wet‐weather measured flow and average dry‐weather flow, Wet‐Weather Peaking Factor = Peak Hourly Wet‐Weather Measured Flow / Average Dry-Weather Flow 9 Instantaneous Wet‐Weather Peaking Factor: The ratio of peak wet‐weather measured flow and average dry‐weather flow, Wet‐Weather Peaking Factor = Peak Wet‐Weather Measured Flow / Average Dry-Weather Flow 2
36 Civica Infrastructure Inc. www.civi.ca
Civica Infrastructures Inc. Kawartha Lakes Flow Monitoring Report
Appendix - A June 03, 2024
I/I Analysis Graph Station: B2
37 Civica Infrastructure Inc. www.civi.ca
Civica Infrastructures Inc. Kawartha Lakes Flow Monitoring Report
Appendix - A June 03, 2024
Infiltration/Inflow Event Analysis Station: B2 Jun 26, 2023 22:25 – Jun 28, 2023 09:05, Total Precipitation: 15.25 mm (15,173,750.00 L) Station Details
Storm Details
Catchment Area
99.50 ha
Total Precipitation
15.25 mm (15,173,750.00 L)
Duration of Storm
10.67 hr
Time of Concentration (Tc) 1
30 min
Peak Precipitation Intensity Over Tc 2
8.50 mm/hr
Return Period over Tc 3
< 2 Yr
Measured Flow
I/I Flow
Time of Peak Measured Flow
Jun 27, 2023 10:50
Time of Peak I/I Flow (TD)
Jun 27, 2023 14:45
Estimated Dry Weather Flow at TD
6.49 L/s
Peak Measured Flow
12.08 L/s
Peak I/I Flow 4
4.94 L/s
Peak I/I Rate 5
0.05 L/s/ha
Peak Measured Depth
84.81 mm
Total I/I Flow Volume during event
58,163.30 L
Volumetric Coefficient (Cv%) 6
0.38%
Total Measured Flow Volume during Event
480,678.00 L
Peak I/I Coefficient 7
0.0021
Hourly Wet-Weather Peaking Factor 8
1.87
Instantaneous Wet-Weather Peaking Factor 9
2.34
1
Time of Concentration (Tc): The estimated time for the flow to travel from the furthest point in the upstream area to the point of monitoring, assume flow is travelling at 1.00 m/s Peak Precipitation Intensity Over Tc: The peak rainfall intensity for the duration of the storm with the time interval defined by time of concentration 3 Return Period over Tc: The estimated time to elapse before a storm of equal or greater intensity will likely occur again, based on design storm criteria 4 Peak I/I Flow: The greatest difference captured between measured flow and estimated dry weather flow, Peak I/I Flow = Maximum (Measured Flow – Estimated Dry Weather Flow) 5 Peak I/I Rate: A normalized peak I/I flow based on catchment area size, Peak I/I Rate = Peak I/I Flow / Catchment Area 6 Volumetric Coefficient (Cv%): The ratio of total I/I volume and total rainfall volume, Cv% = Total I/I Flow Volume / Total Precipitation Volume * 100% 7 Peak I/ I Coefficient: The ratio of peak I/I flow and peak rainfall intensity, Peak I/ I Coefficient = Peak I/I Flow / (Peak Rainfall Intensity over Tc * Catchment Area) 8 Hourly Wet‐Weather Peaking Factor: The ratio of peak hourly wet‐weather measured flow and average dry‐weather flow, Wet‐Weather Peaking Factor = Peak Hourly Wet‐Weather Measured Flow / Average Dry-Weather Flow 9 Instantaneous Wet‐Weather Peaking Factor: The ratio of peak wet‐weather measured flow and average dry‐weather flow, Wet‐Weather Peaking Factor = Peak Wet‐Weather Measured Flow / Average Dry-Weather Flow 2
38 Civica Infrastructure Inc. www.civi.ca
Civica Infrastructures Inc. Kawartha Lakes Flow Monitoring Report
Appendix - A June 03, 2024
I/I Analysis Graph Station: B2
39 Civica Infrastructure Inc. www.civi.ca
Civica Infrastructures Inc. Kawartha Lakes Flow Monitoring Report
Appendix - A June 03, 2024
Infiltration/Inflow Event Analysis Station: B2 Jul 12, 2023 14:55 – Jul 13, 2023 19:00, Total Precipitation: 16.25 mm (16,168,750.00 L) Station Details
Storm Details
Catchment Area
99.50 ha
Total Precipitation
16.25 mm (16,168,750.00 L)
Duration of Storm
4.08 hr
Time of Concentration (Tc) 1
30 min
Peak Precipitation Intensity Over Tc 2
7.00 mm/hr
Return Period over Tc 3
< 2 Yr
Measured Flow
I/I Flow
Time of Peak Measured Flow
Jul 13, 2023 17:30
Time of Peak I/I Flow (TD)
Jul 13, 2023 17:30
Estimated Dry Weather Flow at TD
5.79 L/s
Peak Measured Flow
12.12 L/s
Peak I/I Flow 4
6.33 L/s
Peak I/I Rate 5
0.06 L/s/ha
Peak Measured Depth
89.92 mm
Total I/I Flow Volume during event
59,833.80 L
Volumetric Coefficient (Cv%) 6
0.37%
Total Measured Flow Volume during Event
390,108.80 L
Peak I/I Coefficient 7
0.0033
Hourly Wet-Weather Peaking Factor 8
1.45
Instantaneous Wet-Weather Peaking Factor 9
2.14
1
Time of Concentration (Tc): The estimated time for the flow to travel from the furthest point in the upstream area to the point of monitoring, assume flow is travelling at 1.00 m/s Peak Precipitation Intensity Over Tc: The peak rainfall intensity for the duration of the storm with the time interval defined by time of concentration 3 Return Period over Tc: The estimated time to elapse before a storm of equal or greater intensity will likely occur again, based on design storm criteria 4 Peak I/I Flow: The greatest difference captured between measured flow and estimated dry weather flow, Peak I/I Flow = Maximum (Measured Flow – Estimated Dry Weather Flow) 5 Peak I/I Rate: A normalized peak I/I flow based on catchment area size, Peak I/I Rate = Peak I/I Flow / Catchment Area 6 Volumetric Coefficient (Cv%): The ratio of total I/I volume and total rainfall volume, Cv% = Total I/I Flow Volume / Total Precipitation Volume * 100% 7 Peak I/ I Coefficient: The ratio of peak I/I flow and peak rainfall intensity, Peak I/ I Coefficient = Peak I/I Flow / (Peak Rainfall Intensity over Tc * Catchment Area) 8 Hourly Wet‐Weather Peaking Factor: The ratio of peak hourly wet‐weather measured flow and average dry‐weather flow, Wet‐Weather Peaking Factor = Peak Hourly Wet‐Weather Measured Flow / Average Dry-Weather Flow 9 Instantaneous Wet‐Weather Peaking Factor: The ratio of peak wet‐weather measured flow and average dry‐weather flow, Wet‐Weather Peaking Factor = Peak Wet‐Weather Measured Flow / Average Dry-Weather Flow 2
40 Civica Infrastructure Inc. www.civi.ca
Civica Infrastructures Inc. Kawartha Lakes Flow Monitoring Report
Appendix - A June 03, 2024
I/I Analysis Graph Station: B2
41 Civica Infrastructure Inc. www.civi.ca
Civica Infrastructures Inc. Kawartha Lakes Flow Monitoring Report
Appendix - A June 03, 2024
Infiltration/Inflow Event Analysis Station: B2 Jul 20, 2023 07:25 – Jul 22, 2023 02:10, Total Precipitation: 17.50 mm (17,412,500.00 L) Station Details
Storm Details
Catchment Area
99.50 ha
Total Precipitation
17.50 mm (17,412,500.00 L)
Duration of Storm
18.75 hr
Time of Concentration (Tc) 1
30 min
Peak Precipitation Intensity Over Tc 2
8.50 mm/hr
Return Period over Tc 3
< 2 Yr
Measured Flow
I/I Flow
Time of Peak Measured Flow
Jul 21, 2023 11:55
Time of Peak I/I Flow (TD)
Jul 21, 2023 22:25
Estimated Dry Weather Flow at TD
5.03 L/s
Peak Measured Flow
13.00 L/s
Peak I/I Flow 4
6.95 L/s
Peak I/I Rate 5
0.07 L/s/ha
Peak Measured Depth
86.33 mm
Total I/I Flow Volume during event
86,411.50 L
Volumetric Coefficient (Cv%) 6
0.50%
Total Measured Flow Volume during Event
651,688.10 L
Peak I/I Coefficient 7
0.0030
Hourly Wet-Weather Peaking Factor 8
1.75
Instantaneous Wet-Weather Peaking Factor 9
2.55
1
Time of Concentration (Tc): The estimated time for the flow to travel from the furthest point in the upstream area to the point of monitoring, assume flow is travelling at 1.00 m/s Peak Precipitation Intensity Over Tc: The peak rainfall intensity for the duration of the storm with the time interval defined by time of concentration 3 Return Period over Tc: The estimated time to elapse before a storm of equal or greater intensity will likely occur again, based on design storm criteria 4 Peak I/I Flow: The greatest difference captured between measured flow and estimated dry weather flow, Peak I/I Flow = Maximum (Measured Flow – Estimated Dry Weather Flow) 5 Peak I/I Rate: A normalized peak I/I flow based on catchment area size, Peak I/I Rate = Peak I/I Flow / Catchment Area 6 Volumetric Coefficient (Cv%): The ratio of total I/I volume and total rainfall volume, Cv% = Total I/I Flow Volume / Total Precipitation Volume * 100% 7 Peak I/ I Coefficient: The ratio of peak I/I flow and peak rainfall intensity, Peak I/ I Coefficient = Peak I/I Flow / (Peak Rainfall Intensity over Tc * Catchment Area) 8 Hourly Wet‐Weather Peaking Factor: The ratio of peak hourly wet‐weather measured flow and average dry‐weather flow, Wet‐Weather Peaking Factor = Peak Hourly Wet‐Weather Measured Flow / Average Dry-Weather Flow 9 Instantaneous Wet‐Weather Peaking Factor: The ratio of peak wet‐weather measured flow and average dry‐weather flow, Wet‐Weather Peaking Factor = Peak Wet‐Weather Measured Flow / Average Dry-Weather Flow 2
42 Civica Infrastructure Inc. www.civi.ca
Civica Infrastructures Inc. Kawartha Lakes Flow Monitoring Report
Appendix - A June 03, 2024
I/I Analysis Graph Station: B2
43 Civica Infrastructure Inc. www.civi.ca
Civica Infrastructures Inc. Kawartha Lakes Flow Monitoring Report
Appendix - A June 03, 2024
Infiltration/Inflow Event Analysis Station: B2 Jul 28, 2023 20:30 – Jul 29, 2023 23:55, Total Precipitation: 16.50 mm (16,417,500.00 L) Station Details
Storm Details
Catchment Area
99.50 ha
Total Precipitation
16.50 mm (16,417,500.00 L)
Duration of Storm
3.42 hr
Time of Concentration (Tc) 1
30 min
Peak Precipitation Intensity Over Tc 2
13.00 mm/hr
Return Period over Tc 3
< 2 Yr
Measured Flow
I/I Flow
Time of Peak Measured Flow
Jul 29, 2023 09:55
Time of Peak I/I Flow (TD)
Jul 29, 2023 09:55
Estimated Dry Weather Flow at TD
7.80 L/s
Peak Measured Flow
15.98 L/s
Peak I/I Flow 4
8.19 L/s
Peak I/I Rate 5
0.08 L/s/ha
Peak Measured Depth
91.70 mm
Total I/I Flow Volume during event
67,926.10 L
Volumetric Coefficient (Cv%) 6
0.41%
Total Measured Flow Volume during Event
419,386.20 L
Peak I/I Coefficient 7
0.0023
Hourly Wet-Weather Peaking Factor 8
1.90
Instantaneous Wet-Weather Peaking Factor 9
2.54
1
Time of Concentration (Tc): The estimated time for the flow to travel from the furthest point in the upstream area to the point of monitoring, assume flow is travelling at 1.00 m/s Peak Precipitation Intensity Over Tc: The peak rainfall intensity for the duration of the storm with the time interval defined by time of concentration 3 Return Period over Tc: The estimated time to elapse before a storm of equal or greater intensity will likely occur again, based on design storm criteria 4 Peak I/I Flow: The greatest difference captured between measured flow and estimated dry weather flow, Peak I/I Flow = Maximum (Measured Flow – Estimated Dry Weather Flow) 5 Peak I/I Rate: A normalized peak I/I flow based on catchment area size, Peak I/I Rate = Peak I/I Flow / Catchment Area 6 Volumetric Coefficient (Cv%): The ratio of total I/I volume and total rainfall volume, Cv% = Total I/I Flow Volume / Total Precipitation Volume * 100% 7 Peak I/ I Coefficient: The ratio of peak I/I flow and peak rainfall intensity, Peak I/ I Coefficient = Peak I/I Flow / (Peak Rainfall Intensity over Tc * Catchment Area) 8 Hourly Wet‐Weather Peaking Factor: The ratio of peak hourly wet‐weather measured flow and average dry‐weather flow, Wet‐Weather Peaking Factor = Peak Hourly Wet‐Weather Measured Flow / Average Dry-Weather Flow 9 Instantaneous Wet‐Weather Peaking Factor: The ratio of peak wet‐weather measured flow and average dry‐weather flow, Wet‐Weather Peaking Factor = Peak Wet‐Weather Measured Flow / Average Dry-Weather Flow 2
44 Civica Infrastructure Inc. www.civi.ca
Civica Infrastructures Inc. Kawartha Lakes Flow Monitoring Report
Appendix - A June 03, 2024
I/I Analysis Graph Station: B2
45 Civica Infrastructure Inc. www.civi.ca
Civica Infrastructures Inc. Kawartha Lakes Flow Monitoring Report
Appendix - A June 03, 2024
Infiltration/Inflow Event Analysis Station: B2 Aug 11, 2023 21:30 – Aug 13, 2023 23:05, Total Precipitation: 15.00 mm (14,925,000.00 L) Station Details
Storm Details
Catchment Area
99.50 ha
Total Precipitation
15.00 mm (14,925,000.00 L)
Duration of Storm
25.58 hr
Time of Concentration (Tc) 1
30 min
Peak Precipitation Intensity Over Tc 2
22.50 mm/hr
Return Period over Tc 3
< 2 Yr
Measured Flow
I/I Flow
Time of Peak Measured Flow
Aug 12, 2023 11:15
Time of Peak I/I Flow (TD)
Aug 12, 2023 11:15
Estimated Dry Weather Flow at TD
7.18 L/s
Peak Measured Flow
24.58 L/s
Peak I/I Flow 4
17.40 L/s
Peak I/I Rate 5
0.18 L/s/ha
Peak Measured Depth
111.43 mm
Total I/I Flow Volume during event
112,469.10 L
Volumetric Coefficient (Cv%) 6
0.75%
Total Measured Flow Volume during Event
865,238.20 L
Peak I/I Coefficient 7
0.0028
Hourly Wet-Weather Peaking Factor 8
3.12
Instantaneous Wet-Weather Peaking Factor 9
4.43
1
Time of Concentration (Tc): The estimated time for the flow to travel from the furthest point in the upstream area to the point of monitoring, assume flow is travelling at 1.00 m/s Peak Precipitation Intensity Over Tc: The peak rainfall intensity for the duration of the storm with the time interval defined by time of concentration 3 Return Period over Tc: The estimated time to elapse before a storm of equal or greater intensity will likely occur again, based on design storm criteria 4 Peak I/I Flow: The greatest difference captured between measured flow and estimated dry weather flow, Peak I/I Flow = Maximum (Measured Flow – Estimated Dry Weather Flow) 5 Peak I/I Rate: A normalized peak I/I flow based on catchment area size, Peak I/I Rate = Peak I/I Flow / Catchment Area 6 Volumetric Coefficient (Cv%): The ratio of total I/I volume and total rainfall volume, Cv% = Total I/I Flow Volume / Total Precipitation Volume * 100% 7 Peak I/ I Coefficient: The ratio of peak I/I flow and peak rainfall intensity, Peak I/ I Coefficient = Peak I/I Flow / (Peak Rainfall Intensity over Tc * Catchment Area) 8 Hourly Wet‐Weather Peaking Factor: The ratio of peak hourly wet‐weather measured flow and average dry‐weather flow, Wet‐Weather Peaking Factor = Peak Hourly Wet‐Weather Measured Flow / Average Dry-Weather Flow 9 Instantaneous Wet‐Weather Peaking Factor: The ratio of peak wet‐weather measured flow and average dry‐weather flow, Wet‐Weather Peaking Factor = Peak Wet‐Weather Measured Flow / Average Dry-Weather Flow 2
46 Civica Infrastructure Inc. www.civi.ca
Civica Infrastructures Inc. Kawartha Lakes Flow Monitoring Report
Appendix - A June 03, 2024
I/I Analysis Graph Station: B2
47 Civica Infrastructure Inc. www.civi.ca
Civica Infrastructures Inc. Kawartha Lakes Flow Monitoring Report
Appendix - A June 03, 2024
Infiltration/Inflow Event Analysis Station: B2 Oct 05, 2023 08:40 – Oct 07, 2023 19:20, Total Precipitation: 35.75 mm (35,571,250.00 L) Station Details
Storm Details
Catchment Area
99.50 ha
Total Precipitation
35.75 mm (35,571,250.00 L)
Duration of Storm
34.67 hr
Time of Concentration (Tc) 1
30 min
Peak Precipitation Intensity Over Tc 2
16.50 mm/hr
Return Period over Tc 3
< 2 Yr
Measured Flow
I/I Flow
Time of Peak Measured Flow
Oct 07, 2023 09:55
Time of Peak I/I Flow (TD)
Oct 06, 2023 06:15
Estimated Dry Weather Flow at TD
4.75 L/s
Peak Measured Flow
13.91 L/s
Peak I/I Flow 4
8.41 L/s
Peak I/I Rate 5
0.09 L/s/ha
Peak Measured Depth
94.56 mm
Total I/I Flow Volume during event
152,658.70 L
Volumetric Coefficient (Cv%) 6
0.43%
Total Measured Flow Volume during Event
957,826.60 L
Peak I/I Coefficient 7
0.0018
Hourly Wet-Weather Peaking Factor 8
2.13
Instantaneous Wet-Weather Peaking Factor 9
2.91
1
Time of Concentration (Tc): The estimated time for the flow to travel from the furthest point in the upstream area to the point of monitoring, assume flow is travelling at 1.00 m/s Peak Precipitation Intensity Over Tc: The peak rainfall intensity for the duration of the storm with the time interval defined by time of concentration 3 Return Period over Tc: The estimated time to elapse before a storm of equal or greater intensity will likely occur again, based on design storm criteria 4 Peak I/I Flow: The greatest difference captured between measured flow and estimated dry weather flow, Peak I/I Flow = Maximum (Measured Flow – Estimated Dry Weather Flow) 5 Peak I/I Rate: A normalized peak I/I flow based on catchment area size, Peak I/I Rate = Peak I/I Flow / Catchment Area 6 Volumetric Coefficient (Cv%): The ratio of total I/I volume and total rainfall volume, Cv% = Total I/I Flow Volume / Total Precipitation Volume * 100% 7 Peak I/ I Coefficient: The ratio of peak I/I flow and peak rainfall intensity, Peak I/ I Coefficient = Peak I/I Flow / (Peak Rainfall Intensity over Tc * Catchment Area) 8 Hourly Wet‐Weather Peaking Factor: The ratio of peak hourly wet‐weather measured flow and average dry‐weather flow, Wet‐Weather Peaking Factor = Peak Hourly Wet‐Weather Measured Flow / Average Dry-Weather Flow 9 Instantaneous Wet‐Weather Peaking Factor: The ratio of peak wet‐weather measured flow and average dry‐weather flow, Wet‐Weather Peaking Factor = Peak Wet‐Weather Measured Flow / Average Dry-Weather Flow 2
48 Civica Infrastructure Inc. www.civi.ca
Civica Infrastructures Inc. Kawartha Lakes Flow Monitoring Report
Appendix - A June 03, 2024
I/I Analysis Graph Station: B2
49 Civica Infrastructure Inc. www.civi.ca
Civica Infrastructures Inc. Kawartha Lakes Flow Monitoring Report
Appendix - A June 03, 2024
Infiltration/Inflow Event Analysis Station: B2 Oct 08, 2023 02:50 – Oct 12, 2023 11:55, Total Precipitation: 28.75 mm (28,606,250.00 L) Station Details
Storm Details
Catchment Area
99.50 ha
Total Precipitation
28.75 mm (28,606,250.00 L)
Duration of Storm
81.08 hr
Time of Concentration (Tc) 1
30 min
Peak Precipitation Intensity Over Tc 2
3.50 mm/hr
Return Period over Tc 3
< 2 Yr
Measured Flow
I/I Flow
Time of Peak Measured Flow
Oct 09, 2023 14:15
Time of Peak I/I Flow (TD)
Oct 09, 2023 19:35
Estimated Dry Weather Flow at TD
5.65 L/s
Peak Measured Flow
12.94 L/s
Peak I/I Flow 4
7.15 L/s
Peak I/I Rate 5
0.07 L/s/ha
Peak Measured Depth
95.72 mm
Total I/I Flow Volume during event
287,179.30 L
Volumetric Coefficient (Cv%) 6
1.00%
Total Measured Flow Volume during Event
1,878,979.30 L
Peak I/I Coefficient 7
0.0074
Hourly Wet-Weather Peaking Factor 8
1.81
Instantaneous Wet-Weather Peaking Factor 9
2.73
1
Time of Concentration (Tc): The estimated time for the flow to travel from the furthest point in the upstream area to the point of monitoring, assume flow is travelling at 1.00 m/s Peak Precipitation Intensity Over Tc: The peak rainfall intensity for the duration of the storm with the time interval defined by time of concentration 3 Return Period over Tc: The estimated time to elapse before a storm of equal or greater intensity will likely occur again, based on design storm criteria 4 Peak I/I Flow: The greatest difference captured between measured flow and estimated dry weather flow, Peak I/I Flow = Maximum (Measured Flow – Estimated Dry Weather Flow) 5 Peak I/I Rate: A normalized peak I/I flow based on catchment area size, Peak I/I Rate = Peak I/I Flow / Catchment Area 6 Volumetric Coefficient (Cv%): The ratio of total I/I volume and total rainfall volume, Cv% = Total I/I Flow Volume / Total Precipitation Volume * 100% 7 Peak I/ I Coefficient: The ratio of peak I/I flow and peak rainfall intensity, Peak I/ I Coefficient = Peak I/I Flow / (Peak Rainfall Intensity over Tc * Catchment Area) 8 Hourly Wet‐Weather Peaking Factor: The ratio of peak hourly wet‐weather measured flow and average dry‐weather flow, Wet‐Weather Peaking Factor = Peak Hourly Wet‐Weather Measured Flow / Average Dry-Weather Flow 9 Instantaneous Wet‐Weather Peaking Factor: The ratio of peak wet‐weather measured flow and average dry‐weather flow, Wet‐Weather Peaking Factor = Peak Wet‐Weather Measured Flow / Average Dry-Weather Flow 2
50 Civica Infrastructure Inc. www.civi.ca
Civica Infrastructures Inc. Kawartha Lakes Flow Monitoring Report
Appendix - A June 03, 2024
Activity Log Station: B2 Date Time
Type
Purpose of Visit
Comment
Calibration Measurement
12-Jan-2023 02:57:00 PM
Installation Log
INSTALLATION
MEASUREMENTS TAKEN, PHOTOS TAKEN, LOGGER INSTALLED, SITE CALIBRATED
Yes
02-Mar-2023 10:50:00 AM
Maintenance Log
CALIBRATION
TC SET,DATA DOWNLOADED,TELEMETRY SENT,DEBRIS AND SILT REMOVED,SITE CALIBRATED,ANTENNA IN GOOD CONDITION,PHOTOS AND VIDEOS TAKEN
Yes
10-May-2023 11:45:00 AM
Maintenance Log
CALIBRATION
WNLOADED DATA, SENT TELEMETRY, MADE ENTRY, TOOK PHOTOS/VIDEOS, ANTENNA GOOD,DESSICANT REPLACED,TOOK MEASUREMENTS,DEBRIS AND SILT CLEARED, CALIBRATED SITE,SITE CLEARED
Yes
Yes
Yes
22-Jun-2023 02:00:00 PM
Maintenance Log
CALIBRATION
DATA DOWNLOADED, TELEMETRY SENT ENTRY MADE BATTERY REPLACD PHOTOS/VIDEOS TAKEN, MEASUREMENTS TAKEN, SITE CALIBRATED
22-Aug-2023 01:25:00 PM
Maintenance Log
DATA DOWNLOAD
TC SET,DATA DOWNLOADED,TELEMETRY SENT,DESSICANT CHECKED,ANTENNA CHECKED,SITE CLEARED
51 Civica Infrastructure Inc. www.civi.ca
Civica Infrastructures Inc. Kawartha Lakes Flow Monitoring Report
Appendix - A June 03, 2024
Aggregate Data Station: B4
Precipitation Date From
Date To
Days
Min (mm)
Avg (mm)
Max (mm)
Sum (mm)
Count
Time of Min1
Time of Max1
Jan 24, 2023
Oct 17, 2023
267
0.00
0.01
5.00
628.00
76,638
Tue Jan 24, 2023 00:00
Fri Oct 06, 2023 18:10
Level Date From
Date To
Days
Min (m)
Avg (m)
Max (m)
Count
Time of Min1
Time of Max1
Jan 24, 2023
Oct 17, 2023
267
0.01
0.03
0.08
76,605
Tue Feb 07, 2023 03:15
Fri Jun 02, 2023 21:00
Flow
1
Date From
Date To
Days
Min (L/s)
Avg (L/s)
Max (L/s)
Total Volume (1,000,000 L)
Count
Time of Min1
Time of Max1
Jan 24, 2023
Oct 17, 2023
267
0.02
0.76
4.35
17.46
76,605
Tue Feb 07, 2023 03:15
Fri Jun 02, 2023 21:00
Time of Min and Time of Max will be displayed by first occurrence
52 Civica Infrastructure Inc. www.civi.ca
Civica Infrastructures Inc. Kawartha Lakes Flow Monitoring Report
Appendix - A June 03, 2024
Data Chart Station: B4 Jan 24, 2023 – Jan 31, 2023
53 Civica Infrastructure Inc. www.civi.ca
Civica Infrastructures Inc. Kawartha Lakes Flow Monitoring Report
Appendix - A June 03, 2024
Data Chart Station: B4 Feb 01, 2023 – Feb 28, 2023
54 Civica Infrastructure Inc. www.civi.ca
Civica Infrastructures Inc. Kawartha Lakes Flow Monitoring Report
Appendix - A June 03, 2024
Data Chart Station: B4 Mar 01, 2023 – Mar 31, 2023
55 Civica Infrastructure Inc. www.civi.ca
Civica Infrastructures Inc. Kawartha Lakes Flow Monitoring Report
Appendix - A June 03, 2024
Data Chart Station: B4 Apr 01, 2023 – Apr 30, 2023
56 Civica Infrastructure Inc. www.civi.ca
Civica Infrastructures Inc. Kawartha Lakes Flow Monitoring Report
Appendix - A June 03, 2024
Data Chart Station: B4 May 01, 2023 – May 31, 2023
57 Civica Infrastructure Inc. www.civi.ca
Civica Infrastructures Inc. Kawartha Lakes Flow Monitoring Report
Appendix - A June 03, 2024
Data Chart Station: B4 Jun 01, 2023 – Jun 30, 2023
58 Civica Infrastructure Inc. www.civi.ca
Civica Infrastructures Inc. Kawartha Lakes Flow Monitoring Report
Appendix - A June 03, 2024
Data Chart Station: B4 Jul 01, 2023 – Jul 31, 2023
59 Civica Infrastructure Inc. www.civi.ca
Civica Infrastructures Inc. Kawartha Lakes Flow Monitoring Report
Appendix - A June 03, 2024
Data Chart Station: B4 Aug 01, 2023 – Aug 31, 2023
60 Civica Infrastructure Inc. www.civi.ca
Civica Infrastructures Inc. Kawartha Lakes Flow Monitoring Report
Appendix - A June 03, 2024
Data Chart Station: B4 Sep 01, 2023 – Sep 30, 2023
61 Civica Infrastructure Inc. www.civi.ca
Civica Infrastructures Inc. Kawartha Lakes Flow Monitoring Report
Appendix - A June 03, 2024
Data Chart Station: B4 Oct 01, 2023 – Oct 17, 2023
62 Civica Infrastructure Inc. www.civi.ca
Civica Infrastructures Inc. Kawartha Lakes Flow Monitoring Report
Appendix - A June 03, 2024
Sanitary Report Station: B4
1
Average Dry Weather Flow (L/s)
Average Dry Weather Flow (L/c/d)
Average Daily Minimum Dry Weather Flow (L/s)
Average Daily Peak Dry Weather Flow (L/s)
0.681
266.371
0.177
2.022
Peaking Factor
Groundwater Infiltration (L/s)1
Groundwater Infiltration (L/ha/d)
% of GWI in Average DWF
2.968
0.151
262.631
22.128
Groundwater infiltration (GWI) is assumed as 85% of the daily minimum flow averaged over the monitoring period
63 Civica Infrastructure Inc. www.civi.ca
Civica Infrastructures Inc. Kawartha Lakes Flow Monitoring Report
Appendix - A June 03, 2024
I/I Analysis Table
1
Event1
Total Precipitation (mm)
Duration (hours)
Peak Intensity Over Tc at Station (mm/hr)
Feb 09, 2023
39.75
14.42
Mar 16, 2023
19.50
Mar 31, 2023
B4 Measured Peak Flow (L/s)
Peak I/I Flow (L/s)
Peak I/I Rate (L/s/ha)
Volumetric Runoff Coefficient (CV%)
Peaking Factor (PF)
9.00
2.76
2.06
0.04
0.31 %
4.58
12.75
3.00
1.96
1.25
0.03
0.31 %
2.55
22.00
16.50
7.00
2.38
1.27
0.03
0.24 %
1.81
Apr 05, 2023
28.75
10.67
17.50
4.10
3.38
0.07
0.95 %
4.81
Apr 28, 2023
34.00
52.92
8.50
2.57
1.59
0.03
0.33 %
2.32
May 19, 2023
35.00
17.92
7.00
2.57
1.76
0.04
0.23 %
2.58
Jun 11, 2023
51.00
28.58
10.50
2.76
1.77
0.04
0.28 %
3.18
Jun 27, 2023
15.25
10.67
8.50
2.57
1.52
0.03
0.19 %
2.48
Jul 13, 2023
16.25
4.08
7.00
2.04
0.79
0.02
0.07 %
1.05
Jul 20, 2023
17.50
18.75
8.50
2.57
1.44
0.03
0.28 %
2.00
Jul 29, 2023
16.50
3.42
13.00
3.39
1.85
0.04
0.55 %
1.73
Aug 12, 2023
15.00
25.58
22.50
2.86
1.81
0.04
0.45 %
1.81
Oct 05, 2023
35.75
34.67
16.50
2.51
1.35
0.03
0.17 %
1.81
Oct 08, 2023
28.75
81.08
3.50
3.44
2.38
0.05
0.45 %
3.57
Average
26.79
23.72
10.14
2.75
1.73
0.04
0.34 %
2.59
Maximum
51.00
81.08
22.50
4.10
3.38
0.07
0.95 %
4.81
Flow KPIs
Measured Storms
Station: B4
An event is a storm with a minimum volume of 15mm and a minimum inter-event dry period of 12 hours
64 Civica Infrastructure Inc. www.civi.ca
Civica Infrastructures Inc. Kawartha Lakes Flow Monitoring Report
Appendix - A June 03, 2024
I/I Analysis Graph Station: B4
65 Civica Infrastructure Inc. www.civi.ca
Civica Infrastructures Inc. Kawartha Lakes Flow Monitoring Report
Appendix - A June 03, 2024
Infiltration/Inflow Event Analysis Station: B4 Feb 08, 2023 21:00 – Feb 10, 2023 11:25, Total Precipitation: 39.75 mm (19,716,000.00 L) Station Details
Storm Details
Catchment Area
49.60 ha
Total Precipitation
39.75 mm (19,716,000.00 L)
Duration of Storm
14.42 hr
Time of Concentration (Tc) 1
30 min
Peak Precipitation Intensity Over Tc 2
9.00 mm/hr
Return Period over Tc 3
< 2 Yr
Measured Flow
I/I Flow
Time of Peak Measured Flow
Feb 09, 2023 18:05
Time of Peak I/I Flow (TD)
Feb 09, 2023 18:05
Estimated Dry Weather Flow at TD
0.70 L/s
Peak Measured Flow
2.76 L/s
Peak I/I Flow 4
2.06 L/s
Peak I/I Rate 5
0.04 L/s/ha
Peak Measured Depth
63.50 mm
Total I/I Flow Volume during event
60,215.20 L
Volumetric Coefficient (Cv%) 6
0.31%
Total Measured Flow Volume during Event
103,149.70 L
Peak I/I Coefficient 7
0.0017
Hourly Wet-Weather Peaking Factor 8
3.90
Instantaneous Wet-Weather Peaking Factor 9
6.13
1
Time of Concentration (Tc): The estimated time for the flow to travel from the furthest point in the upstream area to the point of monitoring, assume flow is travelling at 1.00 m/s Peak Precipitation Intensity Over Tc: The peak rainfall intensity for the duration of the storm with the time interval defined by time of concentration 3 Return Period over Tc: The estimated time to elapse before a storm of equal or greater intensity will likely occur again, based on design storm criteria 4 Peak I/I Flow: The greatest difference captured between measured flow and estimated dry weather flow, Peak I/I Flow = Maximum (Measured Flow – Estimated Dry Weather Flow) 5 Peak I/I Rate: A normalized peak I/I flow based on catchment area size, Peak I/I Rate = Peak I/I Flow / Catchment Area 6 Volumetric Coefficient (Cv%): The ratio of total I/I volume and total rainfall volume, Cv% = Total I/I Flow Volume / Total Precipitation Volume * 100% 7 Peak I/ I Coefficient: The ratio of peak I/I flow and peak rainfall intensity, Peak I/ I Coefficient = Peak I/I Flow / (Peak Rainfall Intensity over Tc * Catchment Area) 8 Hourly Wet‐Weather Peaking Factor: The ratio of peak hourly wet‐weather measured flow and average dry‐weather flow, Wet‐Weather Peaking Factor = Peak Hourly Wet‐Weather Measured Flow / Average Dry-Weather Flow 9 Instantaneous Wet‐Weather Peaking Factor: The ratio of peak wet‐weather measured flow and average dry‐weather flow, Wet‐Weather Peaking Factor = Peak Wet‐Weather Measured Flow / Average Dry-Weather Flow 2
66 Civica Infrastructure Inc. www.civi.ca
Civica Infrastructures Inc. Kawartha Lakes Flow Monitoring Report
Appendix - A June 03, 2024
I/I Analysis Graph Station: B4
67 Civica Infrastructure Inc. www.civi.ca
Civica Infrastructures Inc. Kawartha Lakes Flow Monitoring Report
Appendix - A June 03, 2024
Infiltration/Inflow Event Analysis Station: B4 Mar 16, 2023 11:05 – Mar 17, 2023 23:50, Total Precipitation: 19.50 mm (9,672,000.00 L) Station Details
Storm Details
Catchment Area
49.60 ha
Total Precipitation
19.50 mm (9,672,000.00 L)
Duration of Storm
12.75 hr
Time of Concentration (Tc) 1
30 min
Peak Precipitation Intensity Over Tc 2
3.00 mm/hr
Return Period over Tc 3
< 2 Yr
Measured Flow
I/I Flow
Time of Peak Measured Flow
Mar 17, 2023 09:05
Time of Peak I/I Flow (TD)
Mar 17, 2023 09:30
Estimated Dry Weather Flow at TD
0.63 L/s
Peak Measured Flow
1.96 L/s
Peak I/I Flow 4
1.25 L/s
Peak I/I Rate 5
0.03 L/s/ha
Peak Measured Depth
54.50 mm
Total I/I Flow Volume during event
29,936.50 L
Volumetric Coefficient (Cv%) 6
0.31%
Total Measured Flow Volume during Event
73,678.60 L
Peak I/I Coefficient 7
0.0030
Hourly Wet-Weather Peaking Factor 8
3.10
Instantaneous Wet-Weather Peaking Factor 9
3.99
1
Time of Concentration (Tc): The estimated time for the flow to travel from the furthest point in the upstream area to the point of monitoring, assume flow is travelling at 1.00 m/s Peak Precipitation Intensity Over Tc: The peak rainfall intensity for the duration of the storm with the time interval defined by time of concentration 3 Return Period over Tc: The estimated time to elapse before a storm of equal or greater intensity will likely occur again, based on design storm criteria 4 Peak I/I Flow: The greatest difference captured between measured flow and estimated dry weather flow, Peak I/I Flow = Maximum (Measured Flow – Estimated Dry Weather Flow) 5 Peak I/I Rate: A normalized peak I/I flow based on catchment area size, Peak I/I Rate = Peak I/I Flow / Catchment Area 6 Volumetric Coefficient (Cv%): The ratio of total I/I volume and total rainfall volume, Cv% = Total I/I Flow Volume / Total Precipitation Volume * 100% 7 Peak I/ I Coefficient: The ratio of peak I/I flow and peak rainfall intensity, Peak I/ I Coefficient = Peak I/I Flow / (Peak Rainfall Intensity over Tc * Catchment Area) 8 Hourly Wet‐Weather Peaking Factor: The ratio of peak hourly wet‐weather measured flow and average dry‐weather flow, Wet‐Weather Peaking Factor = Peak Hourly Wet‐Weather Measured Flow / Average Dry-Weather Flow 9 Instantaneous Wet‐Weather Peaking Factor: The ratio of peak wet‐weather measured flow and average dry‐weather flow, Wet‐Weather Peaking Factor = Peak Wet‐Weather Measured Flow / Average Dry-Weather Flow 2
68 Civica Infrastructure Inc. www.civi.ca
Civica Infrastructures Inc. Kawartha Lakes Flow Monitoring Report
Appendix - A June 03, 2024
I/I Analysis Graph Station: B4
69 Civica Infrastructure Inc. www.civi.ca
Civica Infrastructures Inc. Kawartha Lakes Flow Monitoring Report
Appendix - A June 03, 2024
Infiltration/Inflow Event Analysis Station: B4 Mar 31, 2023 00:55 – Apr 01, 2023 17:25, Total Precipitation: 22.00 mm (10,912,000.00 L) Station Details
Storm Details
Catchment Area
49.60 ha
Total Precipitation
22.00 mm (10,912,000.00 L)
Duration of Storm
16.50 hr
Time of Concentration (Tc) 1
30 min
Peak Precipitation Intensity Over Tc 2
7.00 mm/hr
Return Period over Tc 3
< 2 Yr
Measured Flow
I/I Flow
Time of Peak Measured Flow
Apr 01, 2023 08:45
Time of Peak I/I Flow (TD)
Apr 01, 2023 08:45
Estimated Dry Weather Flow at TD
1.11 L/s
Peak Measured Flow
2.38 L/s
Peak I/I Flow 4
1.27 L/s
Peak I/I Rate 5
0.03 L/s/ha
Peak Measured Depth
59.50 mm
Total I/I Flow Volume during event
25,750.90 L
Volumetric Coefficient (Cv%) 6
0.24%
Total Measured Flow Volume during Event
98,000.10 L
Peak I/I Coefficient 7
0.0013
Hourly Wet-Weather Peaking Factor 8
2.91
Instantaneous Wet-Weather Peaking Factor 9
3.39
1
Time of Concentration (Tc): The estimated time for the flow to travel from the furthest point in the upstream area to the point of monitoring, assume flow is travelling at 1.00 m/s Peak Precipitation Intensity Over Tc: The peak rainfall intensity for the duration of the storm with the time interval defined by time of concentration 3 Return Period over Tc: The estimated time to elapse before a storm of equal or greater intensity will likely occur again, based on design storm criteria 4 Peak I/I Flow: The greatest difference captured between measured flow and estimated dry weather flow, Peak I/I Flow = Maximum (Measured Flow – Estimated Dry Weather Flow) 5 Peak I/I Rate: A normalized peak I/I flow based on catchment area size, Peak I/I Rate = Peak I/I Flow / Catchment Area 6 Volumetric Coefficient (Cv%): The ratio of total I/I volume and total rainfall volume, Cv% = Total I/I Flow Volume / Total Precipitation Volume * 100% 7 Peak I/ I Coefficient: The ratio of peak I/I flow and peak rainfall intensity, Peak I/ I Coefficient = Peak I/I Flow / (Peak Rainfall Intensity over Tc * Catchment Area) 8 Hourly Wet‐Weather Peaking Factor: The ratio of peak hourly wet‐weather measured flow and average dry‐weather flow, Wet‐Weather Peaking Factor = Peak Hourly Wet‐Weather Measured Flow / Average Dry-Weather Flow 9 Instantaneous Wet‐Weather Peaking Factor: The ratio of peak wet‐weather measured flow and average dry‐weather flow, Wet‐Weather Peaking Factor = Peak Wet‐Weather Measured Flow / Average Dry-Weather Flow 2
70 Civica Infrastructure Inc. www.civi.ca
Civica Infrastructures Inc. Kawartha Lakes Flow Monitoring Report
Appendix - A June 03, 2024
I/I Analysis Graph Station: B4
71 Civica Infrastructure Inc. www.civi.ca
Civica Infrastructures Inc. Kawartha Lakes Flow Monitoring Report
Appendix - A June 03, 2024
Infiltration/Inflow Event Analysis Station: B4 Apr 04, 2023 17:50 – Apr 06, 2023 04:30, Total Precipitation: 28.75 mm (14,260,000.00 L) Station Details
Storm Details
Catchment Area
49.60 ha
Total Precipitation
28.75 mm (14,260,000.00 L)
Duration of Storm
10.67 hr
Time of Concentration (Tc) 1
30 min
Peak Precipitation Intensity Over Tc 2
17.50 mm/hr
Return Period over Tc 3
< 2 Yr
Measured Flow
I/I Flow
Time of Peak Measured Flow
Apr 05, 2023 19:50
Time of Peak I/I Flow (TD)
Apr 05, 2023 20:35
Estimated Dry Weather Flow at TD
0.72 L/s
Peak Measured Flow
4.10 L/s
Peak I/I Flow 4
3.38 L/s
Peak I/I Rate 5
0.07 L/s/ha
Peak Measured Depth
75.50 mm
Total I/I Flow Volume during event
135,916.80 L
Volumetric Coefficient (Cv%) 6
0.95%
Total Measured Flow Volume during Event
193,350.40 L
Peak I/I Coefficient 7
0.0014
Hourly Wet-Weather Peaking Factor 8
4.83
Instantaneous Wet-Weather Peaking Factor 9
5.84
1
Time of Concentration (Tc): The estimated time for the flow to travel from the furthest point in the upstream area to the point of monitoring, assume flow is travelling at 1.00 m/s Peak Precipitation Intensity Over Tc: The peak rainfall intensity for the duration of the storm with the time interval defined by time of concentration 3 Return Period over Tc: The estimated time to elapse before a storm of equal or greater intensity will likely occur again, based on design storm criteria 4 Peak I/I Flow: The greatest difference captured between measured flow and estimated dry weather flow, Peak I/I Flow = Maximum (Measured Flow – Estimated Dry Weather Flow) 5 Peak I/I Rate: A normalized peak I/I flow based on catchment area size, Peak I/I Rate = Peak I/I Flow / Catchment Area 6 Volumetric Coefficient (Cv%): The ratio of total I/I volume and total rainfall volume, Cv% = Total I/I Flow Volume / Total Precipitation Volume * 100% 7 Peak I/ I Coefficient: The ratio of peak I/I flow and peak rainfall intensity, Peak I/ I Coefficient = Peak I/I Flow / (Peak Rainfall Intensity over Tc * Catchment Area) 8 Hourly Wet‐Weather Peaking Factor: The ratio of peak hourly wet‐weather measured flow and average dry‐weather flow, Wet‐Weather Peaking Factor = Peak Hourly Wet‐Weather Measured Flow / Average Dry-Weather Flow 9 Instantaneous Wet‐Weather Peaking Factor: The ratio of peak wet‐weather measured flow and average dry‐weather flow, Wet‐Weather Peaking Factor = Peak Wet‐Weather Measured Flow / Average Dry-Weather Flow 2
72 Civica Infrastructure Inc. www.civi.ca
Civica Infrastructures Inc. Kawartha Lakes Flow Monitoring Report
Appendix - A June 03, 2024
I/I Analysis Graph Station: B4
73 Civica Infrastructure Inc. www.civi.ca
Civica Infrastructures Inc. Kawartha Lakes Flow Monitoring Report
Appendix - A June 03, 2024
Infiltration/Inflow Event Analysis Station: B4 Apr 28, 2023 08:40 – May 01, 2023 13:35, Total Precipitation: 34.00 mm (16,864,000.00 L) Station Details
Storm Details
Catchment Area
49.60 ha
Total Precipitation
34.00 mm (16,864,000.00 L)
Duration of Storm
52.92 hr
Time of Concentration (Tc) 1
30 min
Peak Precipitation Intensity Over Tc 2
8.50 mm/hr
Return Period over Tc 3
< 2 Yr
Measured Flow
I/I Flow
Time of Peak Measured Flow
May 01, 2023 06:55
Time of Peak I/I Flow (TD)
May 01, 2023 09:25
Estimated Dry Weather Flow at TD
0.88 L/s
Peak Measured Flow
2.57 L/s
Peak I/I Flow 4
1.59 L/s
Peak I/I Rate 5
0.03 L/s/ha
Peak Measured Depth
61.50 mm
Total I/I Flow Volume during event
55,019.10 L
Volumetric Coefficient (Cv%) 6
0.33%
Total Measured Flow Volume during Event
215,493.40 L
Peak I/I Coefficient 7
0.0014
Hourly Wet-Weather Peaking Factor 8
2.71
Instantaneous Wet-Weather Peaking Factor 9
3.74
1
Time of Concentration (Tc): The estimated time for the flow to travel from the furthest point in the upstream area to the point of monitoring, assume flow is travelling at 1.00 m/s Peak Precipitation Intensity Over Tc: The peak rainfall intensity for the duration of the storm with the time interval defined by time of concentration 3 Return Period over Tc: The estimated time to elapse before a storm of equal or greater intensity will likely occur again, based on design storm criteria 4 Peak I/I Flow: The greatest difference captured between measured flow and estimated dry weather flow, Peak I/I Flow = Maximum (Measured Flow – Estimated Dry Weather Flow) 5 Peak I/I Rate: A normalized peak I/I flow based on catchment area size, Peak I/I Rate = Peak I/I Flow / Catchment Area 6 Volumetric Coefficient (Cv%): The ratio of total I/I volume and total rainfall volume, Cv% = Total I/I Flow Volume / Total Precipitation Volume * 100% 7 Peak I/ I Coefficient: The ratio of peak I/I flow and peak rainfall intensity, Peak I/ I Coefficient = Peak I/I Flow / (Peak Rainfall Intensity over Tc * Catchment Area) 8 Hourly Wet‐Weather Peaking Factor: The ratio of peak hourly wet‐weather measured flow and average dry‐weather flow, Wet‐Weather Peaking Factor = Peak Hourly Wet‐Weather Measured Flow / Average Dry-Weather Flow 9 Instantaneous Wet‐Weather Peaking Factor: The ratio of peak wet‐weather measured flow and average dry‐weather flow, Wet‐Weather Peaking Factor = Peak Wet‐Weather Measured Flow / Average Dry-Weather Flow 2
74 Civica Infrastructure Inc. www.civi.ca
Civica Infrastructures Inc. Kawartha Lakes Flow Monitoring Report
Appendix - A June 03, 2024
I/I Analysis Graph Station: B4
75 Civica Infrastructure Inc. www.civi.ca
Civica Infrastructures Inc. Kawartha Lakes Flow Monitoring Report
Appendix - A June 03, 2024
Infiltration/Inflow Event Analysis Station: B4 May 19, 2023 09:15 – May 21, 2023 03:10, Total Precipitation: 35.00 mm (17,360,000.00 L) Station Details
Storm Details
Catchment Area
49.60 ha
Total Precipitation
35.00 mm (17,360,000.00 L)
Duration of Storm
17.92 hr
Time of Concentration (Tc) 1
30 min
Peak Precipitation Intensity Over Tc 2
7.00 mm/hr
Return Period over Tc 3
< 2 Yr
Measured Flow
I/I Flow
Time of Peak Measured Flow
May 20, 2023 12:55
Time of Peak I/I Flow (TD)
May 20, 2023 12:55
Estimated Dry Weather Flow at TD
0.81 L/s
Peak Measured Flow
2.57 L/s
Peak I/I Flow 4
1.76 L/s
Peak I/I Rate 5
0.04 L/s/ha
Peak Measured Depth
61.50 mm
Total I/I Flow Volume during event
40,644.70 L
Volumetric Coefficient (Cv%) 6
0.23%
Total Measured Flow Volume during Event
114,377.20 L
Peak I/I Coefficient 7
0.0018
Hourly Wet-Weather Peaking Factor 8
2.83
Instantaneous Wet-Weather Peaking Factor 9
3.76
1
Time of Concentration (Tc): The estimated time for the flow to travel from the furthest point in the upstream area to the point of monitoring, assume flow is travelling at 1.00 m/s Peak Precipitation Intensity Over Tc: The peak rainfall intensity for the duration of the storm with the time interval defined by time of concentration 3 Return Period over Tc: The estimated time to elapse before a storm of equal or greater intensity will likely occur again, based on design storm criteria 4 Peak I/I Flow: The greatest difference captured between measured flow and estimated dry weather flow, Peak I/I Flow = Maximum (Measured Flow – Estimated Dry Weather Flow) 5 Peak I/I Rate: A normalized peak I/I flow based on catchment area size, Peak I/I Rate = Peak I/I Flow / Catchment Area 6 Volumetric Coefficient (Cv%): The ratio of total I/I volume and total rainfall volume, Cv% = Total I/I Flow Volume / Total Precipitation Volume * 100% 7 Peak I/ I Coefficient: The ratio of peak I/I flow and peak rainfall intensity, Peak I/ I Coefficient = Peak I/I Flow / (Peak Rainfall Intensity over Tc * Catchment Area) 8 Hourly Wet‐Weather Peaking Factor: The ratio of peak hourly wet‐weather measured flow and average dry‐weather flow, Wet‐Weather Peaking Factor = Peak Hourly Wet‐Weather Measured Flow / Average Dry-Weather Flow 9 Instantaneous Wet‐Weather Peaking Factor: The ratio of peak wet‐weather measured flow and average dry‐weather flow, Wet‐Weather Peaking Factor = Peak Wet‐Weather Measured Flow / Average Dry-Weather Flow 2
76 Civica Infrastructure Inc. www.civi.ca
Civica Infrastructures Inc. Kawartha Lakes Flow Monitoring Report
Appendix - A June 03, 2024
I/I Analysis Graph Station: B4
77 Civica Infrastructure Inc. www.civi.ca
Civica Infrastructures Inc. Kawartha Lakes Flow Monitoring Report
Appendix - A June 03, 2024
Infiltration/Inflow Event Analysis Station: B4 Jun 11, 2023 06:00 – Jun 13, 2023 10:35, Total Precipitation: 51.00 mm (25,296,000.00 L) Station Details
Storm Details
Catchment Area
49.60 ha
Total Precipitation
51.00 mm (25,296,000.00 L)
Duration of Storm
28.58 hr
Time of Concentration (Tc) 1
30 min
Peak Precipitation Intensity Over Tc 2
10.50 mm/hr
Return Period over Tc 3
< 2 Yr
Measured Flow
I/I Flow
Time of Peak Measured Flow
Jun 13, 2023 07:50
Time of Peak I/I Flow (TD)
Jun 13, 2023 07:50
Estimated Dry Weather Flow at TD
0.99 L/s
Peak Measured Flow
2.76 L/s
Peak I/I Flow 4
1.77 L/s
Peak I/I Rate 5
0.04 L/s/ha
Peak Measured Depth
63.50 mm
Total I/I Flow Volume during event
70,856.80 L
Volumetric Coefficient (Cv%) 6
0.28%
Total Measured Flow Volume during Event
152,288.10 L
Peak I/I Coefficient 7
0.0012
Hourly Wet-Weather Peaking Factor 8
3.37
Instantaneous Wet-Weather Peaking Factor 9
4.96
1
Time of Concentration (Tc): The estimated time for the flow to travel from the furthest point in the upstream area to the point of monitoring, assume flow is travelling at 1.00 m/s Peak Precipitation Intensity Over Tc: The peak rainfall intensity for the duration of the storm with the time interval defined by time of concentration 3 Return Period over Tc: The estimated time to elapse before a storm of equal or greater intensity will likely occur again, based on design storm criteria 4 Peak I/I Flow: The greatest difference captured between measured flow and estimated dry weather flow, Peak I/I Flow = Maximum (Measured Flow – Estimated Dry Weather Flow) 5 Peak I/I Rate: A normalized peak I/I flow based on catchment area size, Peak I/I Rate = Peak I/I Flow / Catchment Area 6 Volumetric Coefficient (Cv%): The ratio of total I/I volume and total rainfall volume, Cv% = Total I/I Flow Volume / Total Precipitation Volume * 100% 7 Peak I/ I Coefficient: The ratio of peak I/I flow and peak rainfall intensity, Peak I/ I Coefficient = Peak I/I Flow / (Peak Rainfall Intensity over Tc * Catchment Area) 8 Hourly Wet‐Weather Peaking Factor: The ratio of peak hourly wet‐weather measured flow and average dry‐weather flow, Wet‐Weather Peaking Factor = Peak Hourly Wet‐Weather Measured Flow / Average Dry-Weather Flow 9 Instantaneous Wet‐Weather Peaking Factor: The ratio of peak wet‐weather measured flow and average dry‐weather flow, Wet‐Weather Peaking Factor = Peak Wet‐Weather Measured Flow / Average Dry-Weather Flow 2
78 Civica Infrastructure Inc. www.civi.ca
Civica Infrastructures Inc. Kawartha Lakes Flow Monitoring Report
Appendix - A June 03, 2024
I/I Analysis Graph Station: B4
79 Civica Infrastructure Inc. www.civi.ca
Civica Infrastructures Inc. Kawartha Lakes Flow Monitoring Report
Appendix - A June 03, 2024
Infiltration/Inflow Event Analysis Station: B4 Jun 26, 2023 22:25 – Jun 28, 2023 09:05, Total Precipitation: 15.25 mm (7,564,000.00 L) Station Details
Storm Details
Catchment Area
49.60 ha
Total Precipitation
15.25 mm (7,564,000.00 L)
Duration of Storm
10.67 hr
Time of Concentration (Tc) 1
30 min
Peak Precipitation Intensity Over Tc 2
8.50 mm/hr
Return Period over Tc 3
< 2 Yr
Measured Flow
I/I Flow
Time of Peak Measured Flow
Jun 28, 2023 07:00
Time of Peak I/I Flow (TD)
Jun 28, 2023 07:00
Estimated Dry Weather Flow at TD
1.04 L/s
Peak Measured Flow
2.57 L/s
Peak I/I Flow 4
1.52 L/s
Peak I/I Rate 5
0.03 L/s/ha
Peak Measured Depth
61.50 mm
Total I/I Flow Volume during event
14,164.80 L
Volumetric Coefficient (Cv%) 6
0.19%
Total Measured Flow Volume during Event
64,417.50 L
Peak I/I Coefficient 7
0.0013
Hourly Wet-Weather Peaking Factor 8
2.21
Instantaneous Wet-Weather Peaking Factor 9
4.18
1
Time of Concentration (Tc): The estimated time for the flow to travel from the furthest point in the upstream area to the point of monitoring, assume flow is travelling at 1.00 m/s Peak Precipitation Intensity Over Tc: The peak rainfall intensity for the duration of the storm with the time interval defined by time of concentration 3 Return Period over Tc: The estimated time to elapse before a storm of equal or greater intensity will likely occur again, based on design storm criteria 4 Peak I/I Flow: The greatest difference captured between measured flow and estimated dry weather flow, Peak I/I Flow = Maximum (Measured Flow – Estimated Dry Weather Flow) 5 Peak I/I Rate: A normalized peak I/I flow based on catchment area size, Peak I/I Rate = Peak I/I Flow / Catchment Area 6 Volumetric Coefficient (Cv%): The ratio of total I/I volume and total rainfall volume, Cv% = Total I/I Flow Volume / Total Precipitation Volume * 100% 7 Peak I/ I Coefficient: The ratio of peak I/I flow and peak rainfall intensity, Peak I/ I Coefficient = Peak I/I Flow / (Peak Rainfall Intensity over Tc * Catchment Area) 8 Hourly Wet‐Weather Peaking Factor: The ratio of peak hourly wet‐weather measured flow and average dry‐weather flow, Wet‐Weather Peaking Factor = Peak Hourly Wet‐Weather Measured Flow / Average Dry-Weather Flow 9 Instantaneous Wet‐Weather Peaking Factor: The ratio of peak wet‐weather measured flow and average dry‐weather flow, Wet‐Weather Peaking Factor = Peak Wet‐Weather Measured Flow / Average Dry-Weather Flow 2
80 Civica Infrastructure Inc. www.civi.ca
Civica Infrastructures Inc. Kawartha Lakes Flow Monitoring Report
Appendix - A June 03, 2024
I/I Analysis Graph Station: B4
81 Civica Infrastructure Inc. www.civi.ca
Civica Infrastructures Inc. Kawartha Lakes Flow Monitoring Report
Appendix - A June 03, 2024
Infiltration/Inflow Event Analysis Station: B4 Jul 12, 2023 14:55 – Jul 13, 2023 19:00, Total Precipitation: 16.25 mm (8,060,000.00 L) Station Details
Storm Details
Catchment Area
49.60 ha
Total Precipitation
16.25 mm (8,060,000.00 L)
Duration of Storm
4.08 hr
Time of Concentration (Tc) 1
30 min
Peak Precipitation Intensity Over Tc 2
7.00 mm/hr
Return Period over Tc 3
< 2 Yr
Measured Flow
I/I Flow
Time of Peak Measured Flow
Jul 13, 2023 08:10
Time of Peak I/I Flow (TD)
Jul 13, 2023 18:30
Estimated Dry Weather Flow at TD
0.93 L/s
Peak Measured Flow
2.04 L/s
Peak I/I Flow 4
0.79 L/s
Peak I/I Rate 5
0.02 L/s/ha
Peak Measured Depth
55.50 mm
Total I/I Flow Volume during event
5,942.40 L
Volumetric Coefficient (Cv%) 6
0.07%
Total Measured Flow Volume during Event
49,779.20 L
Peak I/I Coefficient 7
0.0008
Hourly Wet-Weather Peaking Factor 8
1.86
Instantaneous Wet-Weather Peaking Factor 9
2.70
1
Time of Concentration (Tc): The estimated time for the flow to travel from the furthest point in the upstream area to the point of monitoring, assume flow is travelling at 1.00 m/s Peak Precipitation Intensity Over Tc: The peak rainfall intensity for the duration of the storm with the time interval defined by time of concentration 3 Return Period over Tc: The estimated time to elapse before a storm of equal or greater intensity will likely occur again, based on design storm criteria 4 Peak I/I Flow: The greatest difference captured between measured flow and estimated dry weather flow, Peak I/I Flow = Maximum (Measured Flow – Estimated Dry Weather Flow) 5 Peak I/I Rate: A normalized peak I/I flow based on catchment area size, Peak I/I Rate = Peak I/I Flow / Catchment Area 6 Volumetric Coefficient (Cv%): The ratio of total I/I volume and total rainfall volume, Cv% = Total I/I Flow Volume / Total Precipitation Volume * 100% 7 Peak I/ I Coefficient: The ratio of peak I/I flow and peak rainfall intensity, Peak I/ I Coefficient = Peak I/I Flow / (Peak Rainfall Intensity over Tc * Catchment Area) 8 Hourly Wet‐Weather Peaking Factor: The ratio of peak hourly wet‐weather measured flow and average dry‐weather flow, Wet‐Weather Peaking Factor = Peak Hourly Wet‐Weather Measured Flow / Average Dry-Weather Flow 9 Instantaneous Wet‐Weather Peaking Factor: The ratio of peak wet‐weather measured flow and average dry‐weather flow, Wet‐Weather Peaking Factor = Peak Wet‐Weather Measured Flow / Average Dry-Weather Flow 2
82 Civica Infrastructure Inc. www.civi.ca
Civica Infrastructures Inc. Kawartha Lakes Flow Monitoring Report
Appendix - A June 03, 2024
I/I Analysis Graph Station: B4
83 Civica Infrastructure Inc. www.civi.ca
Civica Infrastructures Inc. Kawartha Lakes Flow Monitoring Report
Appendix - A June 03, 2024
Infiltration/Inflow Event Analysis Station: B4 Jul 20, 2023 07:25 – Jul 22, 2023 02:10, Total Precipitation: 17.50 mm (8,680,000.00 L) Station Details
Storm Details
Catchment Area
49.60 ha
Total Precipitation
17.50 mm (8,680,000.00 L)
Duration of Storm
18.75 hr
Time of Concentration (Tc) 1
30 min
Peak Precipitation Intensity Over Tc 2
8.50 mm/hr
Return Period over Tc 3
< 2 Yr
Measured Flow
I/I Flow
Time of Peak Measured Flow
Jul 21, 2023 09:40
Time of Peak I/I Flow (TD)
Jul 21, 2023 09:40
Estimated Dry Weather Flow at TD
1.13 L/s
Peak Measured Flow
2.57 L/s
Peak I/I Flow 4
1.44 L/s
Peak I/I Rate 5
0.03 L/s/ha
Peak Measured Depth
61.50 mm
Total I/I Flow Volume during event
23,900.80 L
Volumetric Coefficient (Cv%) 6
0.28%
Total Measured Flow Volume during Event
103,652.20 L
Peak I/I Coefficient 7
0.0012
Hourly Wet-Weather Peaking Factor 8
2.63
Instantaneous Wet-Weather Peaking Factor 9
3.57
1
Time of Concentration (Tc): The estimated time for the flow to travel from the furthest point in the upstream area to the point of monitoring, assume flow is travelling at 1.00 m/s Peak Precipitation Intensity Over Tc: The peak rainfall intensity for the duration of the storm with the time interval defined by time of concentration 3 Return Period over Tc: The estimated time to elapse before a storm of equal or greater intensity will likely occur again, based on design storm criteria 4 Peak I/I Flow: The greatest difference captured between measured flow and estimated dry weather flow, Peak I/I Flow = Maximum (Measured Flow – Estimated Dry Weather Flow) 5 Peak I/I Rate: A normalized peak I/I flow based on catchment area size, Peak I/I Rate = Peak I/I Flow / Catchment Area 6 Volumetric Coefficient (Cv%): The ratio of total I/I volume and total rainfall volume, Cv% = Total I/I Flow Volume / Total Precipitation Volume * 100% 7 Peak I/ I Coefficient: The ratio of peak I/I flow and peak rainfall intensity, Peak I/ I Coefficient = Peak I/I Flow / (Peak Rainfall Intensity over Tc * Catchment Area) 8 Hourly Wet‐Weather Peaking Factor: The ratio of peak hourly wet‐weather measured flow and average dry‐weather flow, Wet‐Weather Peaking Factor = Peak Hourly Wet‐Weather Measured Flow / Average Dry-Weather Flow 9 Instantaneous Wet‐Weather Peaking Factor: The ratio of peak wet‐weather measured flow and average dry‐weather flow, Wet‐Weather Peaking Factor = Peak Wet‐Weather Measured Flow / Average Dry-Weather Flow 2
84 Civica Infrastructure Inc. www.civi.ca
Civica Infrastructures Inc. Kawartha Lakes Flow Monitoring Report
Appendix - A June 03, 2024
I/I Analysis Graph Station: B4
85 Civica Infrastructure Inc. www.civi.ca
Civica Infrastructures Inc. Kawartha Lakes Flow Monitoring Report
Appendix - A June 03, 2024
Infiltration/Inflow Event Analysis Station: B4 Jul 28, 2023 20:30 – Jul 29, 2023 23:55, Total Precipitation: 16.50 mm (8,184,000.00 L) Station Details
Storm Details
Catchment Area
49.60 ha
Total Precipitation
16.50 mm (8,184,000.00 L)
Duration of Storm
3.42 hr
Time of Concentration (Tc) 1
30 min
Peak Precipitation Intensity Over Tc 2
13.00 mm/hr
Return Period over Tc 3
< 2 Yr
Measured Flow
I/I Flow
Time of Peak Measured Flow
Jul 29, 2023 10:40
Time of Peak I/I Flow (TD)
Jul 29, 2023 10:40
Estimated Dry Weather Flow at TD
1.54 L/s
Peak Measured Flow
3.39 L/s
Peak I/I Flow 4
1.85 L/s
Peak I/I Rate 5
0.04 L/s/ha
Peak Measured Depth
69.50 mm
Total I/I Flow Volume during event
44,837.90 L
Volumetric Coefficient (Cv%) 6
0.55%
Total Measured Flow Volume during Event
104,504.90 L
Peak I/I Coefficient 7
0.0010
Hourly Wet-Weather Peaking Factor 8
2.49
Instantaneous Wet-Weather Peaking Factor 9
3.17
1
Time of Concentration (Tc): The estimated time for the flow to travel from the furthest point in the upstream area to the point of monitoring, assume flow is travelling at 1.00 m/s Peak Precipitation Intensity Over Tc: The peak rainfall intensity for the duration of the storm with the time interval defined by time of concentration 3 Return Period over Tc: The estimated time to elapse before a storm of equal or greater intensity will likely occur again, based on design storm criteria 4 Peak I/I Flow: The greatest difference captured between measured flow and estimated dry weather flow, Peak I/I Flow = Maximum (Measured Flow – Estimated Dry Weather Flow) 5 Peak I/I Rate: A normalized peak I/I flow based on catchment area size, Peak I/I Rate = Peak I/I Flow / Catchment Area 6 Volumetric Coefficient (Cv%): The ratio of total I/I volume and total rainfall volume, Cv% = Total I/I Flow Volume / Total Precipitation Volume * 100% 7 Peak I/ I Coefficient: The ratio of peak I/I flow and peak rainfall intensity, Peak I/ I Coefficient = Peak I/I Flow / (Peak Rainfall Intensity over Tc * Catchment Area) 8 Hourly Wet‐Weather Peaking Factor: The ratio of peak hourly wet‐weather measured flow and average dry‐weather flow, Wet‐Weather Peaking Factor = Peak Hourly Wet‐Weather Measured Flow / Average Dry-Weather Flow 9 Instantaneous Wet‐Weather Peaking Factor: The ratio of peak wet‐weather measured flow and average dry‐weather flow, Wet‐Weather Peaking Factor = Peak Wet‐Weather Measured Flow / Average Dry-Weather Flow 2
86 Civica Infrastructure Inc. www.civi.ca
Civica Infrastructures Inc. Kawartha Lakes Flow Monitoring Report
Appendix - A June 03, 2024
I/I Analysis Graph Station: B4
87 Civica Infrastructure Inc. www.civi.ca
Civica Infrastructures Inc. Kawartha Lakes Flow Monitoring Report
Appendix - A June 03, 2024
Infiltration/Inflow Event Analysis Station: B4 Aug 11, 2023 21:30 – Aug 13, 2023 23:05, Total Precipitation: 15.00 mm (7,440,000.00 L) Station Details
Storm Details
Catchment Area
49.60 ha
Total Precipitation
15.00 mm (7,440,000.00 L)
Duration of Storm
25.58 hr
Time of Concentration (Tc) 1
30 min
Peak Precipitation Intensity Over Tc 2
22.50 mm/hr
Return Period over Tc 3
< 2 Yr
Measured Flow
I/I Flow
Time of Peak Measured Flow
Aug 13, 2023 06:10
Time of Peak I/I Flow (TD)
Aug 13, 2023 06:10
Estimated Dry Weather Flow at TD
1.05 L/s
Peak Measured Flow
2.86 L/s
Peak I/I Flow 4
1.81 L/s
Peak I/I Rate 5
0.04 L/s/ha
Peak Measured Depth
64.50 mm
Total I/I Flow Volume during event
33,216.20 L
Volumetric Coefficient (Cv%) 6
0.45%
Total Measured Flow Volume during Event
168,875.60 L
Peak I/I Coefficient 7
0.0006
Hourly Wet-Weather Peaking Factor 8
2.36
Instantaneous Wet-Weather Peaking Factor 9
2.86
1
Time of Concentration (Tc): The estimated time for the flow to travel from the furthest point in the upstream area to the point of monitoring, assume flow is travelling at 1.00 m/s Peak Precipitation Intensity Over Tc: The peak rainfall intensity for the duration of the storm with the time interval defined by time of concentration 3 Return Period over Tc: The estimated time to elapse before a storm of equal or greater intensity will likely occur again, based on design storm criteria 4 Peak I/I Flow: The greatest difference captured between measured flow and estimated dry weather flow, Peak I/I Flow = Maximum (Measured Flow – Estimated Dry Weather Flow) 5 Peak I/I Rate: A normalized peak I/I flow based on catchment area size, Peak I/I Rate = Peak I/I Flow / Catchment Area 6 Volumetric Coefficient (Cv%): The ratio of total I/I volume and total rainfall volume, Cv% = Total I/I Flow Volume / Total Precipitation Volume * 100% 7 Peak I/ I Coefficient: The ratio of peak I/I flow and peak rainfall intensity, Peak I/ I Coefficient = Peak I/I Flow / (Peak Rainfall Intensity over Tc * Catchment Area) 8 Hourly Wet‐Weather Peaking Factor: The ratio of peak hourly wet‐weather measured flow and average dry‐weather flow, Wet‐Weather Peaking Factor = Peak Hourly Wet‐Weather Measured Flow / Average Dry-Weather Flow 9 Instantaneous Wet‐Weather Peaking Factor: The ratio of peak wet‐weather measured flow and average dry‐weather flow, Wet‐Weather Peaking Factor = Peak Wet‐Weather Measured Flow / Average Dry-Weather Flow 2
88 Civica Infrastructure Inc. www.civi.ca
Civica Infrastructures Inc. Kawartha Lakes Flow Monitoring Report
Appendix - A June 03, 2024
I/I Analysis Graph Station: B4
89 Civica Infrastructure Inc. www.civi.ca
Civica Infrastructures Inc. Kawartha Lakes Flow Monitoring Report
Appendix - A June 03, 2024
Infiltration/Inflow Event Analysis Station: B4 Oct 05, 2023 08:40 – Oct 07, 2023 19:20, Total Precipitation: 35.75 mm (17,732,000.00 L) Station Details
Storm Details
Catchment Area
49.60 ha
Total Precipitation
35.75 mm (17,732,000.00 L)
Duration of Storm
34.67 hr
Time of Concentration (Tc) 1
30 min
Peak Precipitation Intensity Over Tc 2
16.50 mm/hr
Return Period over Tc 3
< 2 Yr
Measured Flow
I/I Flow
Time of Peak Measured Flow
Oct 06, 2023 08:50
Time of Peak I/I Flow (TD)
Oct 06, 2023 08:50
Estimated Dry Weather Flow at TD
1.17 L/s
Peak Measured Flow
2.51 L/s
Peak I/I Flow 4
1.35 L/s
Peak I/I Rate 5
0.03 L/s/ha
Peak Measured Depth
60.93 mm
Total I/I Flow Volume during event
29,545.90 L
Volumetric Coefficient (Cv%) 6
0.17%
Total Measured Flow Volume during Event
154,584.30 L
Peak I/I Coefficient 7
0.0006
Hourly Wet-Weather Peaking Factor 8
2.62
Instantaneous Wet-Weather Peaking Factor 9
3.38
1
Time of Concentration (Tc): The estimated time for the flow to travel from the furthest point in the upstream area to the point of monitoring, assume flow is travelling at 1.00 m/s Peak Precipitation Intensity Over Tc: The peak rainfall intensity for the duration of the storm with the time interval defined by time of concentration 3 Return Period over Tc: The estimated time to elapse before a storm of equal or greater intensity will likely occur again, based on design storm criteria 4 Peak I/I Flow: The greatest difference captured between measured flow and estimated dry weather flow, Peak I/I Flow = Maximum (Measured Flow – Estimated Dry Weather Flow) 5 Peak I/I Rate: A normalized peak I/I flow based on catchment area size, Peak I/I Rate = Peak I/I Flow / Catchment Area 6 Volumetric Coefficient (Cv%): The ratio of total I/I volume and total rainfall volume, Cv% = Total I/I Flow Volume / Total Precipitation Volume * 100% 7 Peak I/ I Coefficient: The ratio of peak I/I flow and peak rainfall intensity, Peak I/ I Coefficient = Peak I/I Flow / (Peak Rainfall Intensity over Tc * Catchment Area) 8 Hourly Wet‐Weather Peaking Factor: The ratio of peak hourly wet‐weather measured flow and average dry‐weather flow, Wet‐Weather Peaking Factor = Peak Hourly Wet‐Weather Measured Flow / Average Dry-Weather Flow 9 Instantaneous Wet‐Weather Peaking Factor: The ratio of peak wet‐weather measured flow and average dry‐weather flow, Wet‐Weather Peaking Factor = Peak Wet‐Weather Measured Flow / Average Dry-Weather Flow 2
90 Civica Infrastructure Inc. www.civi.ca
Civica Infrastructures Inc. Kawartha Lakes Flow Monitoring Report
Appendix - A June 03, 2024
I/I Analysis Graph Station: B4
91 Civica Infrastructure Inc. www.civi.ca
Civica Infrastructures Inc. Kawartha Lakes Flow Monitoring Report
Appendix - A June 03, 2024
Infiltration/Inflow Event Analysis Station: B4 Oct 08, 2023 02:50 – Oct 12, 2023 11:55, Total Precipitation: 28.75 mm (14,260,000.00 L) Station Details
Storm Details
Catchment Area
49.60 ha
Total Precipitation
28.75 mm (14,260,000.00 L)
Duration of Storm
81.08 hr
Time of Concentration (Tc) 1
30 min
Peak Precipitation Intensity Over Tc 2
3.50 mm/hr
Return Period over Tc 3
< 2 Yr
Measured Flow
I/I Flow
Time of Peak Measured Flow
Oct 09, 2023 09:35
Time of Peak I/I Flow (TD)
Oct 09, 2023 09:35
Estimated Dry Weather Flow at TD
1.06 L/s
Peak Measured Flow
3.44 L/s
Peak I/I Flow 4
2.38 L/s
Peak I/I Rate 5
0.05 L/s/ha
Peak Measured Depth
69.93 mm
Total I/I Flow Volume during event
64,206.10 L
Volumetric Coefficient (Cv%) 6
0.45%
Total Measured Flow Volume during Event
287,686.20 L
Peak I/I Coefficient 7
0.0049
Hourly Wet-Weather Peaking Factor 8
3.79
Instantaneous Wet-Weather Peaking Factor 9
5.16
1
Time of Concentration (Tc): The estimated time for the flow to travel from the furthest point in the upstream area to the point of monitoring, assume flow is travelling at 1.00 m/s Peak Precipitation Intensity Over Tc: The peak rainfall intensity for the duration of the storm with the time interval defined by time of concentration 3 Return Period over Tc: The estimated time to elapse before a storm of equal or greater intensity will likely occur again, based on design storm criteria 4 Peak I/I Flow: The greatest difference captured between measured flow and estimated dry weather flow, Peak I/I Flow = Maximum (Measured Flow – Estimated Dry Weather Flow) 5 Peak I/I Rate: A normalized peak I/I flow based on catchment area size, Peak I/I Rate = Peak I/I Flow / Catchment Area 6 Volumetric Coefficient (Cv%): The ratio of total I/I volume and total rainfall volume, Cv% = Total I/I Flow Volume / Total Precipitation Volume * 100% 7 Peak I/ I Coefficient: The ratio of peak I/I flow and peak rainfall intensity, Peak I/ I Coefficient = Peak I/I Flow / (Peak Rainfall Intensity over Tc * Catchment Area) 8 Hourly Wet‐Weather Peaking Factor: The ratio of peak hourly wet‐weather measured flow and average dry‐weather flow, Wet‐Weather Peaking Factor = Peak Hourly Wet‐Weather Measured Flow / Average Dry-Weather Flow 9 Instantaneous Wet‐Weather Peaking Factor: The ratio of peak wet‐weather measured flow and average dry‐weather flow, Wet‐Weather Peaking Factor = Peak Wet‐Weather Measured Flow / Average Dry-Weather Flow 2
92 Civica Infrastructure Inc. www.civi.ca
Civica Infrastructures Inc. Kawartha Lakes Flow Monitoring Report
Appendix - A June 03, 2024
Activity Log Station: B4 Date Time
Type
Purpose of Visit
Comment
Calibration Measurement
24-Jan-2023 12:17:00 PM
Installation Log
INSTALLATION
TC SETUP, PHOTOS TAKEN,VIDEOS TAKEN,SENSOR INSTALLED,FLUME INSTALLLED,LOGGER STARTED
Yes
02-Mar-2023 11:24:00 AM
Maintenance Log
CALIBRATION
TC SET,DATA DOWNLOADED,TELEMETRY SENT,DEBRIS AND SILT REMOVED,SITE CALIBRATED,ANTENNA IN GOOD CONDITION,PHOTOS AND VIDEOS TAKEN
Yes
10-May-2023 12:25:00 PM
Maintenance Log
CALIBRATION
C SET,SURVEY SENT,DOWNLOADED DATA, SENT TELEMETRY, MADE ENTRY, TOOK PHOTOS/VIDEOS, TOOK MEASUREMENTS,DEBRIS AND SILT CLEARED, CALIBRATED SITE,SITE CLEARED
Yes
Yes
Yes
22-Jun-2023 02:35:00 PM
Maintenance Log
CALIBRATION
DATA DOWNLOADED, TELEMETRY SENT ENTRY MADE PHOTOS/VIDEOS TAKEN, MEASUREMENTS TAKEN, SITE CALIBRATED
17-Oct-2023 12:00:00 PM
Removal Log
REMOVAL
SET UP TC/CSE, DOWNLOADED DATA, SENT TELEMETRY, TOOK MEASUREMENTS, CALIBRATED SITE, REMOVED ALL EQUIPMENT, REMOVAL COMPLETE, PMAC: 8375, LIDOTT BOTTOM BROKE AND WAS HANGING SO THE READINGS BEFORE THE CALIBRATION WERE BAD
93 Civica Infrastructure Inc. www.civi.ca
Civica Infrastructures Inc. Kawartha Lakes Flow Monitoring Report
Appendix - A June 03, 2024
Aggregate Data Station: B5
Precipitation Date From
Date To
Days
Min (mm)
Avg (mm)
Max (mm)
Sum (mm)
Count
Time of Min1
Time of Max1
Jan 09, 2023
Oct 17, 2023
282
0.00
0.01
5.50
644.75
78,278
Mon Jan 09, 2023 00:05
Wed Apr 05, 2023 10:40
Level Date From
Date To
Days
Min (m)
Avg (m)
Max (m)
Count
Time of Min1
Time of Max1
Jan 09, 2023
Oct 17, 2023
260
0.06
0.12
0.27
74,518
Fri Feb 03, 2023 07:55
Wed Apr 05, 2023 18:45
Velocity Date From
Date To
Days
Min (m/s)
Avg (m/s)
Max (m/s)
Count
Time of Min1
Time of Max1
Jan 09, 2023
Oct 17, 2023
260
0.21
0.92
1.68
74,538
Sat Mar 11, 2023 10:20
Sat Feb 11, 2023 03:15
Flow
1
Date From
Date To
Days
Min (L/s)
Avg (L/s)
Max (L/s)
Total Volume (1,000,000 L)
Count
Time of Min1
Time of Max1
Jan 09, 2023
Oct 17, 2023
260
2.78
22.39
93.45
500.58
74,518
Fri Feb 03, 2023 07:55
Mon Mar 27, 2023 04:05
Time of Min and Time of Max will be displayed by first occurrence
94 Civica Infrastructure Inc. www.civi.ca
Civica Infrastructures Inc. Kawartha Lakes Flow Monitoring Report
Appendix - A June 03, 2024
Data Chart Station: B5 Jan 09, 2023 – Jan 31, 2023
95 Civica Infrastructure Inc. www.civi.ca
Civica Infrastructures Inc. Kawartha Lakes Flow Monitoring Report
Appendix - A June 03, 2024
Data Chart Station: B5 Feb 01, 2023 – Feb 28, 2023
96 Civica Infrastructure Inc. www.civi.ca
Civica Infrastructures Inc. Kawartha Lakes Flow Monitoring Report
Appendix - A June 03, 2024
Data Chart Station: B5 Mar 01, 2023 – Mar 31, 2023
97 Civica Infrastructure Inc. www.civi.ca
Civica Infrastructures Inc. Kawartha Lakes Flow Monitoring Report
Appendix - A June 03, 2024
Data Chart Station: B5 Apr 01, 2023 – Apr 30, 2023
98 Civica Infrastructure Inc. www.civi.ca
Civica Infrastructures Inc. Kawartha Lakes Flow Monitoring Report
Appendix - A June 03, 2024
Data Chart Station: B5 May 01, 2023 – May 31, 2023
99 Civica Infrastructure Inc. www.civi.ca
Civica Infrastructures Inc. Kawartha Lakes Flow Monitoring Report
Appendix - A June 03, 2024
Data Chart Station: B5 Jun 01, 2023 – Jun 30, 2023
100 Civica Infrastructure Inc. www.civi.ca
Civica Infrastructures Inc. Kawartha Lakes Flow Monitoring Report
Appendix - A June 03, 2024
Data Chart Station: B5 Jul 01, 2023 – Jul 31, 2023
101 Civica Infrastructure Inc. www.civi.ca
Civica Infrastructures Inc. Kawartha Lakes Flow Monitoring Report
Appendix - A June 03, 2024
Data Chart Station: B5 Aug 01, 2023 – Aug 31, 2023
102 Civica Infrastructure Inc. www.civi.ca
Civica Infrastructures Inc. Kawartha Lakes Flow Monitoring Report
Appendix - A June 03, 2024
Data Chart Station: B5 Sep 01, 2023 – Sep 30, 2023
103 Civica Infrastructure Inc. www.civi.ca
Civica Infrastructures Inc. Kawartha Lakes Flow Monitoring Report
Appendix - A June 03, 2024
Data Chart Station: B5 Oct 01, 2023 – Oct 17, 2023
104 Civica Infrastructure Inc. www.civi.ca
Civica Infrastructures Inc. Kawartha Lakes Flow Monitoring Report
Appendix - A June 03, 2024
Sanitary Report Station: B5
1
Average Dry Weather Flow (L/s)
Average Dry Weather Flow (L/c/d)
Average Daily Minimum Dry Weather Flow (L/s)
Average Daily Peak Dry Weather Flow (L/s)
20.989
938.657
8.981
41.142
Peaking Factor
Groundwater Infiltration (L/s)1
Groundwater Infiltration (L/ha/d)
% of GWI in Average DWF
1.960
7.634
2,931.458
36.371
Groundwater infiltration (GWI) is assumed as 85% of the daily minimum flow averaged over the monitoring period
105 Civica Infrastructure Inc. www.civi.ca
Civica Infrastructures Inc. Kawartha Lakes Flow Monitoring Report
Appendix - A June 03, 2024
I/I Analysis Table
1
Event1
Total Precipitation (mm)
Duration (hours)
Peak Intensity Over Tc at Station (mm/hr)
Feb 09, 2023
39.75
14.42
Mar 16, 2023
19.25
Mar 31, 2023
B5 Measured Peak Flow (L/s)
Peak I/I Flow (L/s)
Peak I/I Rate (L/s/ha)
Volumetric Runoff Coefficient (CV%)
Peaking Factor (PF)
8.10
54.48
38.05
0.17
0.77 %
2.26
15.33
3.00
48.02
29.86
0.13
1.05 %
1.65
22.75
29.00
9.00
66.32
32.16
0.14
1.02 %
1.05
Apr 05, 2023
33.25
11.33
16.70
92.72
62.01
0.28
1.80 %
1.93
Apr 29, 2023
23.00
46.92
6.40
72.79
42.83
0.19
3.07 %
1.54
May 19, 2023
35.50
19.50
7.30
47.57
23.04
0.10
0.75 %
1.19
Jun 11, 2023
48.25
35.42
8.60
35.66
17.24
0.08
0.42 %
0.96
Jun 27, 2023
16.00
11.25
6.00
37.38
15.51
0.07
0.35 %
0.87
Jul 13, 2023
16.75
6.08
7.30
28.77
9.50
0.04
0.29 %
0.57
Jul 29, 2023
20.50
3.67
14.10
40.68
22.15
0.10
0.31 %
1.43
Aug 12, 2023
17.00
25.67
24.40
38.74
21.44
0.10
1.39 %
1.39
Oct 05, 2023
35.75
34.67
15.00
40.60
21.69
0.10
0.31 %
1.32
Oct 08, 2023
28.75
81.08
3.40
44.86
22.77
0.10
2.16 %
1.20
Average
27.42
25.72
9.95
49.89
27.56
0.12
1.05 %
1.34
Maximum
48.25
81.08
24.40
92.72
62.01
0.28
3.07 %
2.26
Flow KPIs
Measured Storms
Station: B5
An event is a storm with a minimum volume of 15mm and a minimum inter-event dry period of 12 hours
106 Civica Infrastructure Inc. www.civi.ca
Civica Infrastructures Inc. Kawartha Lakes Flow Monitoring Report
Appendix - A June 03, 2024
I/I Analysis Graph Station: B5
107 Civica Infrastructure Inc. www.civi.ca
Civica Infrastructures Inc. Kawartha Lakes Flow Monitoring Report
Appendix - A June 03, 2024
Infiltration/Inflow Event Analysis Station: B5 Feb 08, 2023 21:00 – Feb 10, 2023 11:25, Total Precipitation: 39.75 mm (89,437,500.00 L) Station Details
Storm Details
Catchment Area
225.00 ha
Total Precipitation
39.75 mm (89,437,500.00 L)
Duration of Storm
14.42 hr
Time of Concentration (Tc) 1
35 min
Peak Precipitation Intensity Over Tc 2
8.10 mm/hr
Return Period over Tc 3
< 2 Yr
Measured Flow
I/I Flow
Time of Peak Measured Flow
Feb 10, 2023 02:55
Time of Peak I/I Flow (TD)
Feb 10, 2023 02:55
Estimated Dry Weather Flow at TD
16.43 L/s
Peak Measured Flow
54.48 L/s
Peak I/I Flow 4
38.05 L/s
Peak I/I Rate 5
0.17 L/s/ha
Peak Measured Depth
139.00 mm
Total I/I Flow Volume during event
685,830.00 L
Volumetric Coefficient (Cv%) 6
0.77%
Total Measured Flow Volume during Event
2,291,888.70 L
Peak I/I Coefficient 7
0.0075
Hourly Wet-Weather Peaking Factor 8
2.37
Instantaneous Wet-Weather Peaking Factor 9
3.24
1
Time of Concentration (Tc): The estimated time for the flow to travel from the furthest point in the upstream area to the point of monitoring, assume flow is travelling at 1.00 m/s Peak Precipitation Intensity Over Tc: The peak rainfall intensity for the duration of the storm with the time interval defined by time of concentration 3 Return Period over Tc: The estimated time to elapse before a storm of equal or greater intensity will likely occur again, based on design storm criteria 4 Peak I/I Flow: The greatest difference captured between measured flow and estimated dry weather flow, Peak I/I Flow = Maximum (Measured Flow – Estimated Dry Weather Flow) 5 Peak I/I Rate: A normalized peak I/I flow based on catchment area size, Peak I/I Rate = Peak I/I Flow / Catchment Area 6 Volumetric Coefficient (Cv%): The ratio of total I/I volume and total rainfall volume, Cv% = Total I/I Flow Volume / Total Precipitation Volume * 100% 7 Peak I/ I Coefficient: The ratio of peak I/I flow and peak rainfall intensity, Peak I/ I Coefficient = Peak I/I Flow / (Peak Rainfall Intensity over Tc * Catchment Area) 8 Hourly Wet‐Weather Peaking Factor: The ratio of peak hourly wet‐weather measured flow and average dry‐weather flow, Wet‐Weather Peaking Factor = Peak Hourly Wet‐Weather Measured Flow / Average Dry-Weather Flow 9 Instantaneous Wet‐Weather Peaking Factor: The ratio of peak wet‐weather measured flow and average dry‐weather flow, Wet‐Weather Peaking Factor = Peak Wet‐Weather Measured Flow / Average Dry-Weather Flow 2
108 Civica Infrastructure Inc. www.civi.ca
Civica Infrastructures Inc. Kawartha Lakes Flow Monitoring Report
Appendix - A June 03, 2024
I/I Analysis Graph Station: B5
109 Civica Infrastructure Inc. www.civi.ca
Civica Infrastructures Inc. Kawartha Lakes Flow Monitoring Report
Appendix - A June 03, 2024
Infiltration/Inflow Event Analysis Station: B5 Mar 16, 2023 11:10 – Mar 18, 2023 02:30, Total Precipitation: 19.25 mm (43,312,500.00 L) Station Details
Storm Details
Catchment Area
225.00 ha
Total Precipitation
19.25 mm (43,312,500.00 L)
Duration of Storm
15.33 hr
Time of Concentration (Tc) 1
35 min
Peak Precipitation Intensity Over Tc 2
3.00 mm/hr
Return Period over Tc 3
< 2 Yr
Measured Flow
I/I Flow
Time of Peak Measured Flow
Mar 17, 2023 22:00
Time of Peak I/I Flow (TD)
Mar 17, 2023 22:00
Estimated Dry Weather Flow at TD
18.16 L/s
Peak Measured Flow
48.02 L/s
Peak I/I Flow 4
29.86 L/s
Peak I/I Rate 5
0.13 L/s/ha
Peak Measured Depth
190.00 mm
Total I/I Flow Volume during event
452,788.90 L
Volumetric Coefficient (Cv%) 6
1.05%
Total Measured Flow Volume during Event
2,243,704.90 L
Peak I/I Coefficient 7
0.0159
Hourly Wet-Weather Peaking Factor 8
1.94
Instantaneous Wet-Weather Peaking Factor 9
2.65
1
Time of Concentration (Tc): The estimated time for the flow to travel from the furthest point in the upstream area to the point of monitoring, assume flow is travelling at 1.00 m/s Peak Precipitation Intensity Over Tc: The peak rainfall intensity for the duration of the storm with the time interval defined by time of concentration 3 Return Period over Tc: The estimated time to elapse before a storm of equal or greater intensity will likely occur again, based on design storm criteria 4 Peak I/I Flow: The greatest difference captured between measured flow and estimated dry weather flow, Peak I/I Flow = Maximum (Measured Flow – Estimated Dry Weather Flow) 5 Peak I/I Rate: A normalized peak I/I flow based on catchment area size, Peak I/I Rate = Peak I/I Flow / Catchment Area 6 Volumetric Coefficient (Cv%): The ratio of total I/I volume and total rainfall volume, Cv% = Total I/I Flow Volume / Total Precipitation Volume * 100% 7 Peak I/ I Coefficient: The ratio of peak I/I flow and peak rainfall intensity, Peak I/ I Coefficient = Peak I/I Flow / (Peak Rainfall Intensity over Tc * Catchment Area) 8 Hourly Wet‐Weather Peaking Factor: The ratio of peak hourly wet‐weather measured flow and average dry‐weather flow, Wet‐Weather Peaking Factor = Peak Hourly Wet‐Weather Measured Flow / Average Dry-Weather Flow 9 Instantaneous Wet‐Weather Peaking Factor: The ratio of peak wet‐weather measured flow and average dry‐weather flow, Wet‐Weather Peaking Factor = Peak Wet‐Weather Measured Flow / Average Dry-Weather Flow 2
110 Civica Infrastructure Inc. www.civi.ca
Civica Infrastructures Inc. Kawartha Lakes Flow Monitoring Report
Appendix - A June 03, 2024
I/I Analysis Graph Station: B5
111 Civica Infrastructure Inc. www.civi.ca
Civica Infrastructures Inc. Kawartha Lakes Flow Monitoring Report
Appendix - A June 03, 2024
Infiltration/Inflow Event Analysis Station: B5 Mar 31, 2023 01:00 – Apr 02, 2023 06:00, Total Precipitation: 22.75 mm (51,187,500.00 L) Station Details
Storm Details
Catchment Area
225.00 ha
Total Precipitation
22.75 mm (51,187,500.00 L)
Duration of Storm
29.00 hr
Time of Concentration (Tc) 1
35 min
Peak Precipitation Intensity Over Tc 2
9.00 mm/hr
Return Period over Tc 3
< 2 Yr
Measured Flow
I/I Flow
Time of Peak Measured Flow
Apr 02, 2023 03:00
Time of Peak I/I Flow (TD)
Apr 01, 2023 10:25
Estimated Dry Weather Flow at TD
29.85 L/s
Peak Measured Flow
66.32 L/s
Peak I/I Flow 4
32.16 L/s
Peak I/I Rate 5
0.14 L/s/ha
Peak Measured Depth
226.00 mm
Total I/I Flow Volume during event
521,892.90 L
Volumetric Coefficient (Cv%) 6
1.02%
Total Measured Flow Volume during Event
5,047,816.90 L
Peak I/I Coefficient 7
0.0057
Hourly Wet-Weather Peaking Factor 8
1.69
Instantaneous Wet-Weather Peaking Factor 9
2.17
1
Time of Concentration (Tc): The estimated time for the flow to travel from the furthest point in the upstream area to the point of monitoring, assume flow is travelling at 1.00 m/s Peak Precipitation Intensity Over Tc: The peak rainfall intensity for the duration of the storm with the time interval defined by time of concentration 3 Return Period over Tc: The estimated time to elapse before a storm of equal or greater intensity will likely occur again, based on design storm criteria 4 Peak I/I Flow: The greatest difference captured between measured flow and estimated dry weather flow, Peak I/I Flow = Maximum (Measured Flow – Estimated Dry Weather Flow) 5 Peak I/I Rate: A normalized peak I/I flow based on catchment area size, Peak I/I Rate = Peak I/I Flow / Catchment Area 6 Volumetric Coefficient (Cv%): The ratio of total I/I volume and total rainfall volume, Cv% = Total I/I Flow Volume / Total Precipitation Volume * 100% 7 Peak I/ I Coefficient: The ratio of peak I/I flow and peak rainfall intensity, Peak I/ I Coefficient = Peak I/I Flow / (Peak Rainfall Intensity over Tc * Catchment Area) 8 Hourly Wet‐Weather Peaking Factor: The ratio of peak hourly wet‐weather measured flow and average dry‐weather flow, Wet‐Weather Peaking Factor = Peak Hourly Wet‐Weather Measured Flow / Average Dry-Weather Flow 9 Instantaneous Wet‐Weather Peaking Factor: The ratio of peak wet‐weather measured flow and average dry‐weather flow, Wet‐Weather Peaking Factor = Peak Wet‐Weather Measured Flow / Average Dry-Weather Flow 2
112 Civica Infrastructure Inc. www.civi.ca
Civica Infrastructures Inc. Kawartha Lakes Flow Monitoring Report
Appendix - A June 03, 2024
I/I Analysis Graph Station: B5
113 Civica Infrastructure Inc. www.civi.ca
Civica Infrastructures Inc. Kawartha Lakes Flow Monitoring Report
Appendix - A June 03, 2024
Infiltration/Inflow Event Analysis Station: B5 Apr 04, 2023 17:40 – Apr 06, 2023 05:00, Total Precipitation: 33.25 mm (74,812,500.00 L) Station Details
Storm Details
Catchment Area
225.00 ha
Total Precipitation
33.25 mm (74,812,500.00 L)
Duration of Storm
11.33 hr
Time of Concentration (Tc) 1
35 min
Peak Precipitation Intensity Over Tc 2
16.70 mm/hr
Return Period over Tc 3
< 2 Yr
Measured Flow
I/I Flow
Time of Peak Measured Flow
Apr 06, 2023 00:40
Time of Peak I/I Flow (TD)
Apr 06, 2023 00:40
Estimated Dry Weather Flow at TD
30.71 L/s
Peak Measured Flow
92.72 L/s
Peak I/I Flow 4
62.01 L/s
Peak I/I Rate 5
0.28 L/s/ha
Peak Measured Depth
274.00 mm
Total I/I Flow Volume during event
1,345,525.60 L
Volumetric Coefficient (Cv%) 6
1.80%
Total Measured Flow Volume during Event
4,052,498.30 L
Peak I/I Coefficient 7
0.0059
Hourly Wet-Weather Peaking Factor 8
2.31
Instantaneous Wet-Weather Peaking Factor 9
2.89
1
Time of Concentration (Tc): The estimated time for the flow to travel from the furthest point in the upstream area to the point of monitoring, assume flow is travelling at 1.00 m/s Peak Precipitation Intensity Over Tc: The peak rainfall intensity for the duration of the storm with the time interval defined by time of concentration 3 Return Period over Tc: The estimated time to elapse before a storm of equal or greater intensity will likely occur again, based on design storm criteria 4 Peak I/I Flow: The greatest difference captured between measured flow and estimated dry weather flow, Peak I/I Flow = Maximum (Measured Flow – Estimated Dry Weather Flow) 5 Peak I/I Rate: A normalized peak I/I flow based on catchment area size, Peak I/I Rate = Peak I/I Flow / Catchment Area 6 Volumetric Coefficient (Cv%): The ratio of total I/I volume and total rainfall volume, Cv% = Total I/I Flow Volume / Total Precipitation Volume * 100% 7 Peak I/ I Coefficient: The ratio of peak I/I flow and peak rainfall intensity, Peak I/ I Coefficient = Peak I/I Flow / (Peak Rainfall Intensity over Tc * Catchment Area) 8 Hourly Wet‐Weather Peaking Factor: The ratio of peak hourly wet‐weather measured flow and average dry‐weather flow, Wet‐Weather Peaking Factor = Peak Hourly Wet‐Weather Measured Flow / Average Dry-Weather Flow 9 Instantaneous Wet‐Weather Peaking Factor: The ratio of peak wet‐weather measured flow and average dry‐weather flow, Wet‐Weather Peaking Factor = Peak Wet‐Weather Measured Flow / Average Dry-Weather Flow 2
114 Civica Infrastructure Inc. www.civi.ca
Civica Infrastructures Inc. Kawartha Lakes Flow Monitoring Report
Appendix - A June 03, 2024
I/I Analysis Graph Station: B5
115 Civica Infrastructure Inc. www.civi.ca
Civica Infrastructures Inc. Kawartha Lakes Flow Monitoring Report
Appendix - A June 03, 2024
Infiltration/Inflow Event Analysis Station: B5 Apr 29, 2023 06:55 – May 02, 2023 05:50, Total Precipitation: 23.00 mm (51,750,000.00 L) Station Details
Storm Details
Catchment Area
225.00 ha
Total Precipitation
23.00 mm (51,750,000.00 L)
Duration of Storm
46.92 hr
Time of Concentration (Tc) 1
35 min
Peak Precipitation Intensity Over Tc 2
6.40 mm/hr
Return Period over Tc 3
< 2 Yr
Measured Flow
I/I Flow
Time of Peak Measured Flow
May 01, 2023 04:45
Time of Peak I/I Flow (TD)
May 01, 2023 04:45
Estimated Dry Weather Flow at TD
29.96 L/s
Peak Measured Flow
72.79 L/s
Peak I/I Flow 4
42.83 L/s
Peak I/I Rate 5
0.19 L/s/ha
Peak Measured Depth
227.00 mm
Total I/I Flow Volume during event
1,587,627.50 L
Volumetric Coefficient (Cv%) 6
3.07%
Total Measured Flow Volume during Event
7,507,600.50 L
Peak I/I Coefficient 7
0.0107
Hourly Wet-Weather Peaking Factor 8
2.19
Instantaneous Wet-Weather Peaking Factor 9
2.61
1
Time of Concentration (Tc): The estimated time for the flow to travel from the furthest point in the upstream area to the point of monitoring, assume flow is travelling at 1.00 m/s Peak Precipitation Intensity Over Tc: The peak rainfall intensity for the duration of the storm with the time interval defined by time of concentration 3 Return Period over Tc: The estimated time to elapse before a storm of equal or greater intensity will likely occur again, based on design storm criteria 4 Peak I/I Flow: The greatest difference captured between measured flow and estimated dry weather flow, Peak I/I Flow = Maximum (Measured Flow – Estimated Dry Weather Flow) 5 Peak I/I Rate: A normalized peak I/I flow based on catchment area size, Peak I/I Rate = Peak I/I Flow / Catchment Area 6 Volumetric Coefficient (Cv%): The ratio of total I/I volume and total rainfall volume, Cv% = Total I/I Flow Volume / Total Precipitation Volume * 100% 7 Peak I/ I Coefficient: The ratio of peak I/I flow and peak rainfall intensity, Peak I/ I Coefficient = Peak I/I Flow / (Peak Rainfall Intensity over Tc * Catchment Area) 8 Hourly Wet‐Weather Peaking Factor: The ratio of peak hourly wet‐weather measured flow and average dry‐weather flow, Wet‐Weather Peaking Factor = Peak Hourly Wet‐Weather Measured Flow / Average Dry-Weather Flow 9 Instantaneous Wet‐Weather Peaking Factor: The ratio of peak wet‐weather measured flow and average dry‐weather flow, Wet‐Weather Peaking Factor = Peak Wet‐Weather Measured Flow / Average Dry-Weather Flow 2
116 Civica Infrastructure Inc. www.civi.ca
Civica Infrastructures Inc. Kawartha Lakes Flow Monitoring Report
Appendix - A June 03, 2024
I/I Analysis Graph Station: B5
117 Civica Infrastructure Inc. www.civi.ca
Civica Infrastructures Inc. Kawartha Lakes Flow Monitoring Report
Appendix - A June 03, 2024
Infiltration/Inflow Event Analysis Station: B5 May 19, 2023 08:30 – May 21, 2023 04:00, Total Precipitation: 35.50 mm (79,875,000.00 L) Station Details
Storm Details
Catchment Area
225.00 ha
Total Precipitation
35.50 mm (79,875,000.00 L)
Duration of Storm
19.50 hr
Time of Concentration (Tc) 1
35 min
Peak Precipitation Intensity Over Tc 2
7.30 mm/hr
Return Period over Tc 3
< 2 Yr
Measured Flow
I/I Flow
Time of Peak Measured Flow
May 21, 2023 03:55
Time of Peak I/I Flow (TD)
May 21, 2023 03:55
Estimated Dry Weather Flow at TD
24.53 L/s
Peak Measured Flow
47.57 L/s
Peak I/I Flow 4
23.04 L/s
Peak I/I Rate 5
0.10 L/s/ha
Peak Measured Depth
227.00 mm
Total I/I Flow Volume during event
596,718.00 L
Volumetric Coefficient (Cv%) 6
0.75%
Total Measured Flow Volume during Event
2,805,659.50 L
Peak I/I Coefficient 7
0.0051
Hourly Wet-Weather Peaking Factor 8
1.94
Instantaneous Wet-Weather Peaking Factor 9
2.45
1
Time of Concentration (Tc): The estimated time for the flow to travel from the furthest point in the upstream area to the point of monitoring, assume flow is travelling at 1.00 m/s Peak Precipitation Intensity Over Tc: The peak rainfall intensity for the duration of the storm with the time interval defined by time of concentration 3 Return Period over Tc: The estimated time to elapse before a storm of equal or greater intensity will likely occur again, based on design storm criteria 4 Peak I/I Flow: The greatest difference captured between measured flow and estimated dry weather flow, Peak I/I Flow = Maximum (Measured Flow – Estimated Dry Weather Flow) 5 Peak I/I Rate: A normalized peak I/I flow based on catchment area size, Peak I/I Rate = Peak I/I Flow / Catchment Area 6 Volumetric Coefficient (Cv%): The ratio of total I/I volume and total rainfall volume, Cv% = Total I/I Flow Volume / Total Precipitation Volume * 100% 7 Peak I/ I Coefficient: The ratio of peak I/I flow and peak rainfall intensity, Peak I/ I Coefficient = Peak I/I Flow / (Peak Rainfall Intensity over Tc * Catchment Area) 8 Hourly Wet‐Weather Peaking Factor: The ratio of peak hourly wet‐weather measured flow and average dry‐weather flow, Wet‐Weather Peaking Factor = Peak Hourly Wet‐Weather Measured Flow / Average Dry-Weather Flow 9 Instantaneous Wet‐Weather Peaking Factor: The ratio of peak wet‐weather measured flow and average dry‐weather flow, Wet‐Weather Peaking Factor = Peak Wet‐Weather Measured Flow / Average Dry-Weather Flow 2
118 Civica Infrastructure Inc. www.civi.ca
Civica Infrastructures Inc. Kawartha Lakes Flow Monitoring Report
Appendix - A June 03, 2024
I/I Analysis Graph Station: B5
119 Civica Infrastructure Inc. www.civi.ca
Civica Infrastructures Inc. Kawartha Lakes Flow Monitoring Report
Appendix - A June 03, 2024
Infiltration/Inflow Event Analysis Station: B5 Jun 11, 2023 08:25 – Jun 13, 2023 19:50, Total Precipitation: 48.25 mm (108,562,500.00 L) Station Details
Storm Details
Catchment Area
225.00 ha
Total Precipitation
48.25 mm (108,562,500.00 L)
Duration of Storm
35.42 hr
Time of Concentration (Tc) 1
35 min
Peak Precipitation Intensity Over Tc 2
8.60 mm/hr
Return Period over Tc 3
< 2 Yr
Measured Flow
I/I Flow
Time of Peak Measured Flow
Jun 13, 2023 19:35
Time of Peak I/I Flow (TD)
Jun 13, 2023 19:35
Estimated Dry Weather Flow at TD
18.41 L/s
Peak Measured Flow
35.66 L/s
Peak I/I Flow 4
17.24 L/s
Peak I/I Rate 5
0.08 L/s/ha
Peak Measured Depth
149.00 mm
Total I/I Flow Volume during event
450,273.20 L
Volumetric Coefficient (Cv%) 6
0.42%
Total Measured Flow Volume during Event
3,532,298.80 L
Peak I/I Coefficient 7
0.0032
Hourly Wet-Weather Peaking Factor 8
1.60
Instantaneous Wet-Weather Peaking Factor 9
1.98
1
Time of Concentration (Tc): The estimated time for the flow to travel from the furthest point in the upstream area to the point of monitoring, assume flow is travelling at 1.00 m/s Peak Precipitation Intensity Over Tc: The peak rainfall intensity for the duration of the storm with the time interval defined by time of concentration 3 Return Period over Tc: The estimated time to elapse before a storm of equal or greater intensity will likely occur again, based on design storm criteria 4 Peak I/I Flow: The greatest difference captured between measured flow and estimated dry weather flow, Peak I/I Flow = Maximum (Measured Flow – Estimated Dry Weather Flow) 5 Peak I/I Rate: A normalized peak I/I flow based on catchment area size, Peak I/I Rate = Peak I/I Flow / Catchment Area 6 Volumetric Coefficient (Cv%): The ratio of total I/I volume and total rainfall volume, Cv% = Total I/I Flow Volume / Total Precipitation Volume * 100% 7 Peak I/ I Coefficient: The ratio of peak I/I flow and peak rainfall intensity, Peak I/ I Coefficient = Peak I/I Flow / (Peak Rainfall Intensity over Tc * Catchment Area) 8 Hourly Wet‐Weather Peaking Factor: The ratio of peak hourly wet‐weather measured flow and average dry‐weather flow, Wet‐Weather Peaking Factor = Peak Hourly Wet‐Weather Measured Flow / Average Dry-Weather Flow 9 Instantaneous Wet‐Weather Peaking Factor: The ratio of peak wet‐weather measured flow and average dry‐weather flow, Wet‐Weather Peaking Factor = Peak Wet‐Weather Measured Flow / Average Dry-Weather Flow 2
120 Civica Infrastructure Inc. www.civi.ca
Civica Infrastructures Inc. Kawartha Lakes Flow Monitoring Report
Appendix - A June 03, 2024
I/I Analysis Graph Station: B5
121 Civica Infrastructure Inc. www.civi.ca
Civica Infrastructures Inc. Kawartha Lakes Flow Monitoring Report
Appendix - A June 03, 2024
Infiltration/Inflow Event Analysis Station: B5 Jun 26, 2023 22:35 – Jun 28, 2023 09:50, Total Precipitation: 16.00 mm (36,000,000.00 L) Station Details
Storm Details
Catchment Area
225.00 ha
Total Precipitation
16.00 mm (36,000,000.00 L)
Duration of Storm
11.25 hr
Time of Concentration (Tc) 1
35 min
Peak Precipitation Intensity Over Tc 2
6.00 mm/hr
Return Period over Tc 3
< 2 Yr
Measured Flow
I/I Flow
Time of Peak Measured Flow
Jun 27, 2023 10:00
Time of Peak I/I Flow (TD)
Jun 28, 2023 05:35
Estimated Dry Weather Flow at TD
21.53 L/s
Peak Measured Flow
37.38 L/s
Peak I/I Flow 4
15.51 L/s
Peak I/I Rate 5
0.07 L/s/ha
Peak Measured Depth
148.00 mm
Total I/I Flow Volume during event
125,096.50 L
Volumetric Coefficient (Cv%) 6
0.35%
Total Measured Flow Volume during Event
1,624,438.60 L
Peak I/I Coefficient 7
0.0041
Hourly Wet-Weather Peaking Factor 8
1.64
Instantaneous Wet-Weather Peaking Factor 9
2.09
1
Time of Concentration (Tc): The estimated time for the flow to travel from the furthest point in the upstream area to the point of monitoring, assume flow is travelling at 1.00 m/s Peak Precipitation Intensity Over Tc: The peak rainfall intensity for the duration of the storm with the time interval defined by time of concentration 3 Return Period over Tc: The estimated time to elapse before a storm of equal or greater intensity will likely occur again, based on design storm criteria 4 Peak I/I Flow: The greatest difference captured between measured flow and estimated dry weather flow, Peak I/I Flow = Maximum (Measured Flow – Estimated Dry Weather Flow) 5 Peak I/I Rate: A normalized peak I/I flow based on catchment area size, Peak I/I Rate = Peak I/I Flow / Catchment Area 6 Volumetric Coefficient (Cv%): The ratio of total I/I volume and total rainfall volume, Cv% = Total I/I Flow Volume / Total Precipitation Volume * 100% 7 Peak I/ I Coefficient: The ratio of peak I/I flow and peak rainfall intensity, Peak I/ I Coefficient = Peak I/I Flow / (Peak Rainfall Intensity over Tc * Catchment Area) 8 Hourly Wet‐Weather Peaking Factor: The ratio of peak hourly wet‐weather measured flow and average dry‐weather flow, Wet‐Weather Peaking Factor = Peak Hourly Wet‐Weather Measured Flow / Average Dry-Weather Flow 9 Instantaneous Wet‐Weather Peaking Factor: The ratio of peak wet‐weather measured flow and average dry‐weather flow, Wet‐Weather Peaking Factor = Peak Wet‐Weather Measured Flow / Average Dry-Weather Flow 2
122 Civica Infrastructure Inc. www.civi.ca
Civica Infrastructures Inc. Kawartha Lakes Flow Monitoring Report
Appendix - A June 03, 2024
I/I Analysis Graph Station: B5
123 Civica Infrastructure Inc. www.civi.ca
Civica Infrastructures Inc. Kawartha Lakes Flow Monitoring Report
Appendix - A June 03, 2024
Infiltration/Inflow Event Analysis Station: B5 Jul 12, 2023 14:55 – Jul 13, 2023 21:00, Total Precipitation: 16.75 mm (37,687,500.00 L) Station Details
Storm Details
Catchment Area
225.00 ha
Total Precipitation
16.75 mm (37,687,500.00 L)
Duration of Storm
6.08 hr
Time of Concentration (Tc) 1
35 min
Peak Precipitation Intensity Over Tc 2
7.30 mm/hr
Return Period over Tc 3
< 2 Yr
Measured Flow
I/I Flow
Time of Peak Measured Flow
Jul 13, 2023 07:10
Time of Peak I/I Flow (TD)
Jul 13, 2023 15:10
Estimated Dry Weather Flow at TD
17.92 L/s
Peak Measured Flow
28.77 L/s
Peak I/I Flow 4
9.50 L/s
Peak I/I Rate 5
0.04 L/s/ha
Peak Measured Depth
144.00 mm
Total I/I Flow Volume during event
109,805.00 L
Volumetric Coefficient (Cv%) 6
0.29%
Total Measured Flow Volume during Event
1,193,808.80 L
Peak I/I Coefficient 7
0.0021
Hourly Wet-Weather Peaking Factor 8
1.53
Instantaneous Wet-Weather Peaking Factor 9
1.74
1
Time of Concentration (Tc): The estimated time for the flow to travel from the furthest point in the upstream area to the point of monitoring, assume flow is travelling at 1.00 m/s Peak Precipitation Intensity Over Tc: The peak rainfall intensity for the duration of the storm with the time interval defined by time of concentration 3 Return Period over Tc: The estimated time to elapse before a storm of equal or greater intensity will likely occur again, based on design storm criteria 4 Peak I/I Flow: The greatest difference captured between measured flow and estimated dry weather flow, Peak I/I Flow = Maximum (Measured Flow – Estimated Dry Weather Flow) 5 Peak I/I Rate: A normalized peak I/I flow based on catchment area size, Peak I/I Rate = Peak I/I Flow / Catchment Area 6 Volumetric Coefficient (Cv%): The ratio of total I/I volume and total rainfall volume, Cv% = Total I/I Flow Volume / Total Precipitation Volume * 100% 7 Peak I/ I Coefficient: The ratio of peak I/I flow and peak rainfall intensity, Peak I/ I Coefficient = Peak I/I Flow / (Peak Rainfall Intensity over Tc * Catchment Area) 8 Hourly Wet‐Weather Peaking Factor: The ratio of peak hourly wet‐weather measured flow and average dry‐weather flow, Wet‐Weather Peaking Factor = Peak Hourly Wet‐Weather Measured Flow / Average Dry-Weather Flow 9 Instantaneous Wet‐Weather Peaking Factor: The ratio of peak wet‐weather measured flow and average dry‐weather flow, Wet‐Weather Peaking Factor = Peak Wet‐Weather Measured Flow / Average Dry-Weather Flow 2
124 Civica Infrastructure Inc. www.civi.ca
Civica Infrastructures Inc. Kawartha Lakes Flow Monitoring Report
Appendix - A June 03, 2024
I/I Analysis Graph Station: B5
125 Civica Infrastructure Inc. www.civi.ca
Civica Infrastructures Inc. Kawartha Lakes Flow Monitoring Report
Appendix - A June 03, 2024
Infiltration/Inflow Event Analysis Station: B5 Jul 28, 2023 20:05 – Jul 29, 2023 23:45, Total Precipitation: 20.50 mm (46,125,000.00 L) Station Details
Storm Details
Catchment Area
225.00 ha
Total Precipitation
20.50 mm (46,125,000.00 L)
Duration of Storm
3.67 hr
Time of Concentration (Tc) 1
35 min
Peak Precipitation Intensity Over Tc 2
14.10 mm/hr
Return Period over Tc 3
< 2 Yr
Measured Flow
I/I Flow
Time of Peak Measured Flow
Jul 29, 2023 22:45
Time of Peak I/I Flow (TD)
Jul 29, 2023 22:45
Estimated Dry Weather Flow at TD
18.52 L/s
Peak Measured Flow
40.68 L/s
Peak I/I Flow 4
22.15 L/s
Peak I/I Rate 5
0.10 L/s/ha
Peak Measured Depth
133.00 mm
Total I/I Flow Volume during event
142,814.40 L
Volumetric Coefficient (Cv%) 6
0.31%
Total Measured Flow Volume during Event
1,021,277.20 L
Peak I/I Coefficient 7
0.0025
Hourly Wet-Weather Peaking Factor 8
1.71
Instantaneous Wet-Weather Peaking Factor 9
2.63
1
Time of Concentration (Tc): The estimated time for the flow to travel from the furthest point in the upstream area to the point of monitoring, assume flow is travelling at 1.00 m/s Peak Precipitation Intensity Over Tc: The peak rainfall intensity for the duration of the storm with the time interval defined by time of concentration 3 Return Period over Tc: The estimated time to elapse before a storm of equal or greater intensity will likely occur again, based on design storm criteria 4 Peak I/I Flow: The greatest difference captured between measured flow and estimated dry weather flow, Peak I/I Flow = Maximum (Measured Flow – Estimated Dry Weather Flow) 5 Peak I/I Rate: A normalized peak I/I flow based on catchment area size, Peak I/I Rate = Peak I/I Flow / Catchment Area 6 Volumetric Coefficient (Cv%): The ratio of total I/I volume and total rainfall volume, Cv% = Total I/I Flow Volume / Total Precipitation Volume * 100% 7 Peak I/ I Coefficient: The ratio of peak I/I flow and peak rainfall intensity, Peak I/ I Coefficient = Peak I/I Flow / (Peak Rainfall Intensity over Tc * Catchment Area) 8 Hourly Wet‐Weather Peaking Factor: The ratio of peak hourly wet‐weather measured flow and average dry‐weather flow, Wet‐Weather Peaking Factor = Peak Hourly Wet‐Weather Measured Flow / Average Dry-Weather Flow 9 Instantaneous Wet‐Weather Peaking Factor: The ratio of peak wet‐weather measured flow and average dry‐weather flow, Wet‐Weather Peaking Factor = Peak Wet‐Weather Measured Flow / Average Dry-Weather Flow 2
126 Civica Infrastructure Inc. www.civi.ca
Civica Infrastructures Inc. Kawartha Lakes Flow Monitoring Report
Appendix - A June 03, 2024
I/I Analysis Graph Station: B5
127 Civica Infrastructure Inc. www.civi.ca
Civica Infrastructures Inc. Kawartha Lakes Flow Monitoring Report
Appendix - A June 03, 2024
Infiltration/Inflow Event Analysis Station: B5 Aug 11, 2023 21:25 – Aug 13, 2023 23:05, Total Precipitation: 17.00 mm (38,250,000.00 L) Station Details
Storm Details
Catchment Area
225.00 ha
Total Precipitation
17.00 mm (38,250,000.00 L)
Duration of Storm
25.67 hr
Time of Concentration (Tc) 1
35 min
Peak Precipitation Intensity Over Tc 2
24.40 mm/hr
Return Period over Tc 3
< 2 Yr
Measured Flow
I/I Flow
Time of Peak Measured Flow
Aug 12, 2023 23:45
Time of Peak I/I Flow (TD)
Aug 12, 2023 23:45
Estimated Dry Weather Flow at TD
17.30 L/s
Peak Measured Flow
38.74 L/s
Peak I/I Flow 4
21.44 L/s
Peak I/I Rate 5
0.10 L/s/ha
Peak Measured Depth
134.00 mm
Total I/I Flow Volume during event
532,392.80 L
Volumetric Coefficient (Cv%) 6
1.39%
Total Measured Flow Volume during Event
2,628,707.80 L
Peak I/I Coefficient 7
0.0014
Hourly Wet-Weather Peaking Factor 8
2.04
Instantaneous Wet-Weather Peaking Factor 9
2.51
1
Time of Concentration (Tc): The estimated time for the flow to travel from the furthest point in the upstream area to the point of monitoring, assume flow is travelling at 1.00 m/s Peak Precipitation Intensity Over Tc: The peak rainfall intensity for the duration of the storm with the time interval defined by time of concentration 3 Return Period over Tc: The estimated time to elapse before a storm of equal or greater intensity will likely occur again, based on design storm criteria 4 Peak I/I Flow: The greatest difference captured between measured flow and estimated dry weather flow, Peak I/I Flow = Maximum (Measured Flow – Estimated Dry Weather Flow) 5 Peak I/I Rate: A normalized peak I/I flow based on catchment area size, Peak I/I Rate = Peak I/I Flow / Catchment Area 6 Volumetric Coefficient (Cv%): The ratio of total I/I volume and total rainfall volume, Cv% = Total I/I Flow Volume / Total Precipitation Volume * 100% 7 Peak I/ I Coefficient: The ratio of peak I/I flow and peak rainfall intensity, Peak I/ I Coefficient = Peak I/I Flow / (Peak Rainfall Intensity over Tc * Catchment Area) 8 Hourly Wet‐Weather Peaking Factor: The ratio of peak hourly wet‐weather measured flow and average dry‐weather flow, Wet‐Weather Peaking Factor = Peak Hourly Wet‐Weather Measured Flow / Average Dry-Weather Flow 9 Instantaneous Wet‐Weather Peaking Factor: The ratio of peak wet‐weather measured flow and average dry‐weather flow, Wet‐Weather Peaking Factor = Peak Wet‐Weather Measured Flow / Average Dry-Weather Flow 2
128 Civica Infrastructure Inc. www.civi.ca
Civica Infrastructures Inc. Kawartha Lakes Flow Monitoring Report
Appendix - A June 03, 2024
I/I Analysis Graph Station: B5
129 Civica Infrastructure Inc. www.civi.ca
Civica Infrastructures Inc. Kawartha Lakes Flow Monitoring Report
Appendix - A June 03, 2024
Infiltration/Inflow Event Analysis Station: B5 Oct 05, 2023 08:40 – Oct 07, 2023 19:20, Total Precipitation: 35.75 mm (80,437,500.00 L) Station Details
Storm Details
Catchment Area
225.00 ha
Total Precipitation
35.75 mm (80,437,500.00 L)
Duration of Storm
34.67 hr
Time of Concentration (Tc) 1
35 min
Peak Precipitation Intensity Over Tc 2
15.00 mm/hr
Return Period over Tc 3
< 2 Yr
Measured Flow
I/I Flow
Time of Peak Measured Flow
Oct 06, 2023 20:55
Time of Peak I/I Flow (TD)
Oct 06, 2023 20:55
Estimated Dry Weather Flow at TD
18.91 L/s
Peak Measured Flow
40.60 L/s
Peak I/I Flow 4
21.69 L/s
Peak I/I Rate 5
0.10 L/s/ha
Peak Measured Depth
147.00 mm
Total I/I Flow Volume during event
245,149.40 L
Volumetric Coefficient (Cv%) 6
0.31%
Total Measured Flow Volume during Event
3,006,385.70 L
Peak I/I Coefficient 7
0.0023
Hourly Wet-Weather Peaking Factor 8
1.92
Instantaneous Wet-Weather Peaking Factor 9
2.47
1
Time of Concentration (Tc): The estimated time for the flow to travel from the furthest point in the upstream area to the point of monitoring, assume flow is travelling at 1.00 m/s Peak Precipitation Intensity Over Tc: The peak rainfall intensity for the duration of the storm with the time interval defined by time of concentration 3 Return Period over Tc: The estimated time to elapse before a storm of equal or greater intensity will likely occur again, based on design storm criteria 4 Peak I/I Flow: The greatest difference captured between measured flow and estimated dry weather flow, Peak I/I Flow = Maximum (Measured Flow – Estimated Dry Weather Flow) 5 Peak I/I Rate: A normalized peak I/I flow based on catchment area size, Peak I/I Rate = Peak I/I Flow / Catchment Area 6 Volumetric Coefficient (Cv%): The ratio of total I/I volume and total rainfall volume, Cv% = Total I/I Flow Volume / Total Precipitation Volume * 100% 7 Peak I/ I Coefficient: The ratio of peak I/I flow and peak rainfall intensity, Peak I/ I Coefficient = Peak I/I Flow / (Peak Rainfall Intensity over Tc * Catchment Area) 8 Hourly Wet‐Weather Peaking Factor: The ratio of peak hourly wet‐weather measured flow and average dry‐weather flow, Wet‐Weather Peaking Factor = Peak Hourly Wet‐Weather Measured Flow / Average Dry-Weather Flow 9 Instantaneous Wet‐Weather Peaking Factor: The ratio of peak wet‐weather measured flow and average dry‐weather flow, Wet‐Weather Peaking Factor = Peak Wet‐Weather Measured Flow / Average Dry-Weather Flow 2
130 Civica Infrastructure Inc. www.civi.ca
Civica Infrastructures Inc. Kawartha Lakes Flow Monitoring Report
Appendix - A June 03, 2024
I/I Analysis Graph Station: B5
131 Civica Infrastructure Inc. www.civi.ca
Civica Infrastructures Inc. Kawartha Lakes Flow Monitoring Report
Appendix - A June 03, 2024
Infiltration/Inflow Event Analysis Station: B5 Oct 08, 2023 02:50 – Oct 12, 2023 11:55, Total Precipitation: 28.75 mm (64,687,500.00 L) Station Details
Storm Details
Catchment Area
225.00 ha
Total Precipitation
28.75 mm (64,687,500.00 L)
Duration of Storm
81.08 hr
Time of Concentration (Tc) 1
35 min
Peak Precipitation Intensity Over Tc 2
3.40 mm/hr
Return Period over Tc 3
< 2 Yr
Measured Flow
I/I Flow
Time of Peak Measured Flow
Oct 11, 2023 23:20
Time of Peak I/I Flow (TD)
Oct 12, 2023 05:35
Estimated Dry Weather Flow at TD
18.69 L/s
Peak Measured Flow
44.86 L/s
Peak I/I Flow 4
22.77 L/s
Peak I/I Rate 5
0.10 L/s/ha
Peak Measured Depth
157.00 mm
Total I/I Flow Volume during event
1,396,510.00 L
Volumetric Coefficient (Cv%) 6
2.16%
Total Measured Flow Volume during Event
7,749,648.50 L
Peak I/I Coefficient 7
0.0106
Hourly Wet-Weather Peaking Factor 8
2.01
Instantaneous Wet-Weather Peaking Factor 9
2.37
1
Time of Concentration (Tc): The estimated time for the flow to travel from the furthest point in the upstream area to the point of monitoring, assume flow is travelling at 1.00 m/s Peak Precipitation Intensity Over Tc: The peak rainfall intensity for the duration of the storm with the time interval defined by time of concentration 3 Return Period over Tc: The estimated time to elapse before a storm of equal or greater intensity will likely occur again, based on design storm criteria 4 Peak I/I Flow: The greatest difference captured between measured flow and estimated dry weather flow, Peak I/I Flow = Maximum (Measured Flow – Estimated Dry Weather Flow) 5 Peak I/I Rate: A normalized peak I/I flow based on catchment area size, Peak I/I Rate = Peak I/I Flow / Catchment Area 6 Volumetric Coefficient (Cv%): The ratio of total I/I volume and total rainfall volume, Cv% = Total I/I Flow Volume / Total Precipitation Volume * 100% 7 Peak I/ I Coefficient: The ratio of peak I/I flow and peak rainfall intensity, Peak I/ I Coefficient = Peak I/I Flow / (Peak Rainfall Intensity over Tc * Catchment Area) 8 Hourly Wet‐Weather Peaking Factor: The ratio of peak hourly wet‐weather measured flow and average dry‐weather flow, Wet‐Weather Peaking Factor = Peak Hourly Wet‐Weather Measured Flow / Average Dry-Weather Flow 9 Instantaneous Wet‐Weather Peaking Factor: The ratio of peak wet‐weather measured flow and average dry‐weather flow, Wet‐Weather Peaking Factor = Peak Wet‐Weather Measured Flow / Average Dry-Weather Flow 2
132 Civica Infrastructure Inc. www.civi.ca
Civica Infrastructures Inc. Kawartha Lakes Flow Monitoring Report
Appendix - A June 03, 2024
Activity Log Station: B5 Date Time
Type
Purpose of Visit
31-Jan-2023 03:57:00 PM
Installation Log
INSTALL
06-Mar-2023 11:42:00 AM
Maintenance Log
CALIBRATION
Comment ITE ASSESSED, MEASUREMENTS TAKEN,TRAFFIC CONTROL & CSE SET,BEFORE AND AFTER INSTALL PHOTOS TAKEN,LOGGER CALIBRATED AND STARTED,LIDOTT INSTALLED,BEFORE AND AFTER MEASUREMENTS TAKEN,VIDEOS TAKEN TC SET,DATA DOWNLOADED,TELEMETRY SENT, SITE CALIBRATED, ANTENNA IN GOOD CONDITION, PHOTOS AND VIDEOS TAKEN, BATTERY SWAPPED
Calibration Measurement Yes Yes
14-Mar-2023 04:40:00 PM
Maintenance Log
CALIBRATION
DATA DOWNLOADED, TELEMETRY SENT AND CHECKED, ENTRY MADE, SITE CALIBRATED, PHOTO AND VIDEO TAKEN BATTERY IS NOT READING PROPERLY, MEASUREMENT MANUALLY (12.3 V) LOGGER WAS RECONF. WITH THE WRONG FILES
03-Apr-2023 09:26:00 AM
Maintenance Log
DATA DOWNLOAD
DATA DOWNLOADED, PHOTOS TAKEN, TELEMETRY SENT
No
10-May-2023 01:41:00 PM
Removal Log
REMOVAL
SET UP TC, DOWNLOADED DATA, SENT TELEMETRY,FLUME DISLODGED TOOK MEASUREMENTS, TOOK PHOTOS, REMOVED EQUIPMENT, REMOVAL COMPLETED.
Yes
11-May-2023 11:15:00 AM
Maintenance Log
CALIBRATION
TC SET,SURVEY SENT,DOWNLOADED DATA, SENT TELEMETRY , MADE ENTRY, TOOK PHOTOS/VIDEOS, TOOK MEASUREMENTS,DEBRIS AND SILT CLEARED, CALIBRATED SITE
Yes
CALIBRATION
DATA DOWNLOADED, TELEMETRY SENT ENTRY MADE PHOTOS/VIDEOS TAKEN, MEASUREMENTS TAKEN, SITE CALIBRATED
Yes
22-Jun-2023 03:10:00 PM
Maintenance Log
133 Civica Infrastructure Inc. www.civi.ca
Yes
Civica Infrastructures Inc. Kawartha Lakes Flow Monitoring Report
Appendix - A June 03, 2024
Aggregate Data Station: B6
Precipitation Date From
Date To
Days
Min (mm)
Avg (mm)
Max (mm)
Sum (mm)
Count
Time of Min1
Time of Max1
Jan 09, 2023
Oct 24, 2023
289
0.00
0.01
5.00
647.00
82,966
Mon Jan 09, 2023 00:05
Fri Oct 06, 2023 18:10
Level Date From
Date To
Days
Min (m)
Avg (m)
Max (m)
Count
Time of Min1
Time of Max1
Jan 09, 2023
Oct 24, 2023
273
0.00
0.03
0.12
78,297
Thu Oct 12, 2023 02:30
Thu Oct 05, 2023 06:45
Velocity Date From
Date To
Days
Min (m/s)
Avg (m/s)
Max (m/s)
Count
Time of Min1
Time of Max1
Jan 09, 2023
Oct 24, 2023
273
0.00
0.22
0.97
78,297
Wed Feb 15, 2023 02:30
Sun Oct 01, 2023 11:15
Flow
1
Date From
Date To
Days
Min (L/s)
Avg (L/s)
Max (L/s)
Total Volume (1,000,000 L)
Count
Time of Min1
Time of Max1
Jan 09, 2023
Oct 24, 2023
273
0.00
1.65
27.82
38.75
78,297
Wed Feb 15, 2023 02:30
Thu Oct 05, 2023 06:45
Time of Min and Time of Max will be displayed by first occurrence
134 Civica Infrastructure Inc. www.civi.ca
Civica Infrastructures Inc. Kawartha Lakes Flow Monitoring Report
Appendix - A June 03, 2024
Data Chart Station: B6 Jan 09, 2023 – Jan 31, 2023
135 Civica Infrastructure Inc. www.civi.ca
Civica Infrastructures Inc. Kawartha Lakes Flow Monitoring Report
Appendix - A June 03, 2024
Data Chart Station: B6 Feb 01, 2023 – Feb 28, 2023
136 Civica Infrastructure Inc. www.civi.ca
Civica Infrastructures Inc. Kawartha Lakes Flow Monitoring Report
Appendix - A June 03, 2024
Data Chart Station: B6 Mar 01, 2023 – Mar 31, 2023
137 Civica Infrastructure Inc. www.civi.ca
Civica Infrastructures Inc. Kawartha Lakes Flow Monitoring Report
Appendix - A June 03, 2024
Data Chart Station: B6 Apr 01, 2023 – Apr 30, 2023
138 Civica Infrastructure Inc. www.civi.ca
Civica Infrastructures Inc. Kawartha Lakes Flow Monitoring Report
Appendix - A June 03, 2024
Data Chart Station: B6 May 01, 2023 – May 31, 2023
139 Civica Infrastructure Inc. www.civi.ca
Civica Infrastructures Inc. Kawartha Lakes Flow Monitoring Report
Appendix - A June 03, 2024
Data Chart Station: B6 Jun 01, 2023 – Jun 30, 2023
140 Civica Infrastructure Inc. www.civi.ca
Civica Infrastructures Inc. Kawartha Lakes Flow Monitoring Report
Appendix - A June 03, 2024
Data Chart Station: B6 Jul 01, 2023 – Jul 31, 2023
141 Civica Infrastructure Inc. www.civi.ca
Civica Infrastructures Inc. Kawartha Lakes Flow Monitoring Report
Appendix - A June 03, 2024
Data Chart Station: B6 Aug 01, 2023 – Aug 31, 2023
142 Civica Infrastructure Inc. www.civi.ca
Civica Infrastructures Inc. Kawartha Lakes Flow Monitoring Report
Appendix - A June 03, 2024
Data Chart Station: B6 Sep 01, 2023 – Sep 30, 2023
143 Civica Infrastructure Inc. www.civi.ca
Civica Infrastructures Inc. Kawartha Lakes Flow Monitoring Report
Appendix - A June 03, 2024
Data Chart Station: B6 Oct 01, 2023 – Oct 24, 2023
144 Civica Infrastructure Inc. www.civi.ca
Civica Infrastructures Inc. Kawartha Lakes Flow Monitoring Report
Appendix - A June 03, 2024
Sanitary Report Station: B6
1
Average Dry Weather Flow (L/s)
Average Dry Weather Flow (L/c/d)
Average Daily Minimum Dry Weather Flow (L/s)
Average Daily Peak Dry Weather Flow (L/s)
1.118
108.568
0.065
14.652
Peaking Factor
Groundwater Infiltration (L/s)1
Groundwater Infiltration (L/ha/d)
% of GWI in Average DWF
13.101
0.055
62.502
4.916
Groundwater infiltration (GWI) is assumed as 85% of the daily minimum flow averaged over the monitoring period
145 Civica Infrastructure Inc. www.civi.ca
Civica Infrastructures Inc. Kawartha Lakes Flow Monitoring Report
Appendix - A June 03, 2024
I/I Analysis Table
1
Event1
Total Precipitation (mm)
Duration (hours)
Peak Intensity Over Tc at Station (mm/hr)
Feb 09, 2023
39.75
14.42
Mar 16, 2023
19.50
Mar 31, 2023
B6 Measured Peak Flow (L/s)
Peak I/I Flow (L/s)
Peak I/I Rate (L/s/ha)
Volumetric Runoff Coefficient (CV%)
Peaking Factor (PF)
11.20
13.27
11.50
0.15
0.43 %
10.41
12.75
3.00
11.95
11.19
0.15
0.76 %
14.18
22.00
16.50
7.50
12.85
11.29
0.15
0.60 %
13.31
Apr 05, 2023
28.75
10.67
26.20
12.38
11.32
0.15
0.46 %
14.09
Apr 28, 2023
34.00
52.92
9.00
13.62
12.47
0.16
0.78 %
13.39
May 19, 2023
35.00
17.92
7.50
14.46
13.44
0.18
0.41 %
15.78
Jun 11, 2023
51.00
28.58
10.50
16.47
14.88
0.20
0.48 %
16.26
Jun 27, 2023
15.25
10.67
12.00
14.63
12.94
0.17
0.63 %
22.11
Jul 13, 2023
16.25
4.08
8.20
16.56
14.91
0.20
0.57 %
16.29
Jul 20, 2023
17.50
18.75
9.80
18.08
16.55
0.22
0.85 %
21.15
Jul 29, 2023
16.50
3.42
18.00
16.08
12.52
0.17
0.49 %
11.27
Aug 12, 2023
15.00
25.58
33.00
17.03
16.00
0.21
1.26 %
16.14
Oct 05, 2023
35.75
34.67
22.50
26.02
24.02
0.32
0.48 %
37.35
Oct 08, 2023
28.75
81.08
3.80
19.26
18.21
0.24
1.47 %
31.28
Average
26.79
23.72
13.01
15.90
14.37
0.19
0.69 %
18.07
Maximum
51.00
81.08
33.00
26.02
24.02
0.32
1.47 %
37.35
Flow KPIs
Measured Storms
Station: B6
An event is a storm with a minimum volume of 15mm and a minimum inter-event dry period of 12 hours
146 Civica Infrastructure Inc. www.civi.ca
Civica Infrastructures Inc. Kawartha Lakes Flow Monitoring Report
Appendix - A June 03, 2024
I/I Analysis Graph Station: B6
147 Civica Infrastructure Inc. www.civi.ca
Civica Infrastructures Inc. Kawartha Lakes Flow Monitoring Report
Appendix - A June 03, 2024
Infiltration/Inflow Event Analysis Station: B6 Feb 08, 2023 21:00 – Feb 10, 2023 11:25, Total Precipitation: 39.75 mm (30,210,000.00 L) Station Details
Storm Details
Catchment Area
76.00 ha
Total Precipitation
39.75 mm (30,210,000.00 L)
Duration of Storm
14.42 hr
Time of Concentration (Tc) 1
20 min
Peak Precipitation Intensity Over Tc 2
11.20 mm/hr
Return Period over Tc 3
< 2 Yr
Measured Flow
I/I Flow
Time of Peak Measured Flow
Feb 09, 2023 10:10
Time of Peak I/I Flow (TD)
Feb 09, 2023 10:10
Estimated Dry Weather Flow at TD
1.78 L/s
Peak Measured Flow
13.27 L/s
Peak I/I Flow 4
11.50 L/s
Peak I/I Rate 5
0.15 L/s/ha
Peak Measured Depth
88.00 mm
Total I/I Flow Volume during event
128,260.30 L
Volumetric Coefficient (Cv%) 6
0.43%
Total Measured Flow Volume during Event
233,558.80 L
Peak I/I Coefficient 7
0.0048
Hourly Wet-Weather Peaking Factor 8
4.08
Instantaneous Wet-Weather Peaking Factor 9
12.02
1
Time of Concentration (Tc): The estimated time for the flow to travel from the furthest point in the upstream area to the point of monitoring, assume flow is travelling at 1.00 m/s Peak Precipitation Intensity Over Tc: The peak rainfall intensity for the duration of the storm with the time interval defined by time of concentration 3 Return Period over Tc: The estimated time to elapse before a storm of equal or greater intensity will likely occur again, based on design storm criteria 4 Peak I/I Flow: The greatest difference captured between measured flow and estimated dry weather flow, Peak I/I Flow = Maximum (Measured Flow – Estimated Dry Weather Flow) 5 Peak I/I Rate: A normalized peak I/I flow based on catchment area size, Peak I/I Rate = Peak I/I Flow / Catchment Area 6 Volumetric Coefficient (Cv%): The ratio of total I/I volume and total rainfall volume, Cv% = Total I/I Flow Volume / Total Precipitation Volume * 100% 7 Peak I/ I Coefficient: The ratio of peak I/I flow and peak rainfall intensity, Peak I/ I Coefficient = Peak I/I Flow / (Peak Rainfall Intensity over Tc * Catchment Area) 8 Hourly Wet‐Weather Peaking Factor: The ratio of peak hourly wet‐weather measured flow and average dry‐weather flow, Wet‐Weather Peaking Factor = Peak Hourly Wet‐Weather Measured Flow / Average Dry-Weather Flow 9 Instantaneous Wet‐Weather Peaking Factor: The ratio of peak wet‐weather measured flow and average dry‐weather flow, Wet‐Weather Peaking Factor = Peak Wet‐Weather Measured Flow / Average Dry-Weather Flow 2
148 Civica Infrastructure Inc. www.civi.ca
Civica Infrastructures Inc. Kawartha Lakes Flow Monitoring Report
Appendix - A June 03, 2024
I/I Analysis Graph Station: B6
149 Civica Infrastructure Inc. www.civi.ca
Civica Infrastructures Inc. Kawartha Lakes Flow Monitoring Report
Appendix - A June 03, 2024
Infiltration/Inflow Event Analysis Station: B6 Mar 16, 2023 11:05 – Mar 17, 2023 23:50, Total Precipitation: 19.50 mm (14,820,000.00 L) Station Details
Storm Details
Catchment Area
76.00 ha
Total Precipitation
19.50 mm (14,820,000.00 L)
Duration of Storm
12.75 hr
Time of Concentration (Tc) 1
20 min
Peak Precipitation Intensity Over Tc 2
3.00 mm/hr
Return Period over Tc 3
< 2 Yr
Measured Flow
I/I Flow
Time of Peak Measured Flow
Mar 17, 2023 15:45
Time of Peak I/I Flow (TD)
Mar 17, 2023 15:45
Estimated Dry Weather Flow at TD
0.77 L/s
Peak Measured Flow
11.95 L/s
Peak I/I Flow 4
11.19 L/s
Peak I/I Rate 5
0.15 L/s/ha
Peak Measured Depth
81.00 mm
Total I/I Flow Volume during event
112,055.90 L
Volumetric Coefficient (Cv%) 6
0.76%
Total Measured Flow Volume during Event
182,569.20 L
Peak I/I Coefficient 7
0.0177
Hourly Wet-Weather Peaking Factor 8
5.78
Instantaneous Wet-Weather Peaking Factor 9
15.16
1
Time of Concentration (Tc): The estimated time for the flow to travel from the furthest point in the upstream area to the point of monitoring, assume flow is travelling at 1.00 m/s Peak Precipitation Intensity Over Tc: The peak rainfall intensity for the duration of the storm with the time interval defined by time of concentration 3 Return Period over Tc: The estimated time to elapse before a storm of equal or greater intensity will likely occur again, based on design storm criteria 4 Peak I/I Flow: The greatest difference captured between measured flow and estimated dry weather flow, Peak I/I Flow = Maximum (Measured Flow – Estimated Dry Weather Flow) 5 Peak I/I Rate: A normalized peak I/I flow based on catchment area size, Peak I/I Rate = Peak I/I Flow / Catchment Area 6 Volumetric Coefficient (Cv%): The ratio of total I/I volume and total rainfall volume, Cv% = Total I/I Flow Volume / Total Precipitation Volume * 100% 7 Peak I/ I Coefficient: The ratio of peak I/I flow and peak rainfall intensity, Peak I/ I Coefficient = Peak I/I Flow / (Peak Rainfall Intensity over Tc * Catchment Area) 8 Hourly Wet‐Weather Peaking Factor: The ratio of peak hourly wet‐weather measured flow and average dry‐weather flow, Wet‐Weather Peaking Factor = Peak Hourly Wet‐Weather Measured Flow / Average Dry-Weather Flow 9 Instantaneous Wet‐Weather Peaking Factor: The ratio of peak wet‐weather measured flow and average dry‐weather flow, Wet‐Weather Peaking Factor = Peak Wet‐Weather Measured Flow / Average Dry-Weather Flow 2
150 Civica Infrastructure Inc. www.civi.ca
Civica Infrastructures Inc. Kawartha Lakes Flow Monitoring Report
Appendix - A June 03, 2024
I/I Analysis Graph Station: B6
151 Civica Infrastructure Inc. www.civi.ca
Civica Infrastructures Inc. Kawartha Lakes Flow Monitoring Report
Appendix - A June 03, 2024
Infiltration/Inflow Event Analysis Station: B6 Mar 31, 2023 00:55 – Apr 01, 2023 17:25, Total Precipitation: 22.00 mm (16,720,000.00 L) Station Details
Storm Details
Catchment Area
76.00 ha
Total Precipitation
22.00 mm (16,720,000.00 L)
Duration of Storm
16.50 hr
Time of Concentration (Tc) 1
20 min
Peak Precipitation Intensity Over Tc 2
7.50 mm/hr
Return Period over Tc 3
< 2 Yr
Measured Flow
I/I Flow
Time of Peak Measured Flow
Apr 01, 2023 11:10
Time of Peak I/I Flow (TD)
Apr 01, 2023 11:50
Estimated Dry Weather Flow at TD
1.39 L/s
Peak Measured Flow
12.85 L/s
Peak I/I Flow 4
11.29 L/s
Peak I/I Rate 5
0.15 L/s/ha
Peak Measured Depth
87.00 mm
Total I/I Flow Volume during event
100,998.10 L
Volumetric Coefficient (Cv%) 6
0.60%
Total Measured Flow Volume during Event
188,288.00 L
Peak I/I Coefficient 7
0.0071
Hourly Wet-Weather Peaking Factor 8
5.16
Instantaneous Wet-Weather Peaking Factor 9
15.15
1
Time of Concentration (Tc): The estimated time for the flow to travel from the furthest point in the upstream area to the point of monitoring, assume flow is travelling at 1.00 m/s Peak Precipitation Intensity Over Tc: The peak rainfall intensity for the duration of the storm with the time interval defined by time of concentration 3 Return Period over Tc: The estimated time to elapse before a storm of equal or greater intensity will likely occur again, based on design storm criteria 4 Peak I/I Flow: The greatest difference captured between measured flow and estimated dry weather flow, Peak I/I Flow = Maximum (Measured Flow – Estimated Dry Weather Flow) 5 Peak I/I Rate: A normalized peak I/I flow based on catchment area size, Peak I/I Rate = Peak I/I Flow / Catchment Area 6 Volumetric Coefficient (Cv%): The ratio of total I/I volume and total rainfall volume, Cv% = Total I/I Flow Volume / Total Precipitation Volume * 100% 7 Peak I/ I Coefficient: The ratio of peak I/I flow and peak rainfall intensity, Peak I/ I Coefficient = Peak I/I Flow / (Peak Rainfall Intensity over Tc * Catchment Area) 8 Hourly Wet‐Weather Peaking Factor: The ratio of peak hourly wet‐weather measured flow and average dry‐weather flow, Wet‐Weather Peaking Factor = Peak Hourly Wet‐Weather Measured Flow / Average Dry-Weather Flow 9 Instantaneous Wet‐Weather Peaking Factor: The ratio of peak wet‐weather measured flow and average dry‐weather flow, Wet‐Weather Peaking Factor = Peak Wet‐Weather Measured Flow / Average Dry-Weather Flow 2
152 Civica Infrastructure Inc. www.civi.ca
Civica Infrastructures Inc. Kawartha Lakes Flow Monitoring Report
Appendix - A June 03, 2024
I/I Analysis Graph Station: B6
153 Civica Infrastructure Inc. www.civi.ca
Civica Infrastructures Inc. Kawartha Lakes Flow Monitoring Report
Appendix - A June 03, 2024
Infiltration/Inflow Event Analysis Station: B6 Apr 04, 2023 17:50 – Apr 06, 2023 04:30, Total Precipitation: 28.75 mm (21,850,000.00 L) Station Details
Storm Details
Catchment Area
76.00 ha
Total Precipitation
28.75 mm (21,850,000.00 L)
Duration of Storm
10.67 hr
Time of Concentration (Tc) 1
20 min
Peak Precipitation Intensity Over Tc 2
26.20 mm/hr
Return Period over Tc 3
< 2 Yr
Measured Flow
I/I Flow
Time of Peak Measured Flow
Apr 05, 2023 18:35
Time of Peak I/I Flow (TD)
Apr 05, 2023 19:10
Estimated Dry Weather Flow at TD
0.85 L/s
Peak Measured Flow
12.38 L/s
Peak I/I Flow 4
11.32 L/s
Peak I/I Rate 5
0.15 L/s/ha
Peak Measured Depth
85.00 mm
Total I/I Flow Volume during event
100,148.50 L
Volumetric Coefficient (Cv%) 6
0.46%
Total Measured Flow Volume during Event
165,937.90 L
Peak I/I Coefficient 7
0.0020
Hourly Wet-Weather Peaking Factor 8
4.87
Instantaneous Wet-Weather Peaking Factor 9
15.41
1
Time of Concentration (Tc): The estimated time for the flow to travel from the furthest point in the upstream area to the point of monitoring, assume flow is travelling at 1.00 m/s Peak Precipitation Intensity Over Tc: The peak rainfall intensity for the duration of the storm with the time interval defined by time of concentration 3 Return Period over Tc: The estimated time to elapse before a storm of equal or greater intensity will likely occur again, based on design storm criteria 4 Peak I/I Flow: The greatest difference captured between measured flow and estimated dry weather flow, Peak I/I Flow = Maximum (Measured Flow – Estimated Dry Weather Flow) 5 Peak I/I Rate: A normalized peak I/I flow based on catchment area size, Peak I/I Rate = Peak I/I Flow / Catchment Area 6 Volumetric Coefficient (Cv%): The ratio of total I/I volume and total rainfall volume, Cv% = Total I/I Flow Volume / Total Precipitation Volume * 100% 7 Peak I/ I Coefficient: The ratio of peak I/I flow and peak rainfall intensity, Peak I/ I Coefficient = Peak I/I Flow / (Peak Rainfall Intensity over Tc * Catchment Area) 8 Hourly Wet‐Weather Peaking Factor: The ratio of peak hourly wet‐weather measured flow and average dry‐weather flow, Wet‐Weather Peaking Factor = Peak Hourly Wet‐Weather Measured Flow / Average Dry-Weather Flow 9 Instantaneous Wet‐Weather Peaking Factor: The ratio of peak wet‐weather measured flow and average dry‐weather flow, Wet‐Weather Peaking Factor = Peak Wet‐Weather Measured Flow / Average Dry-Weather Flow 2
154 Civica Infrastructure Inc. www.civi.ca
Civica Infrastructures Inc. Kawartha Lakes Flow Monitoring Report
Appendix - A June 03, 2024
I/I Analysis Graph Station: B6
155 Civica Infrastructure Inc. www.civi.ca
Civica Infrastructures Inc. Kawartha Lakes Flow Monitoring Report
Appendix - A June 03, 2024
Infiltration/Inflow Event Analysis Station: B6 Apr 28, 2023 08:40 – May 01, 2023 13:35, Total Precipitation: 34.00 mm (25,840,000.00 L) Station Details
Storm Details
Catchment Area
76.00 ha
Total Precipitation
34.00 mm (25,840,000.00 L)
Duration of Storm
52.92 hr
Time of Concentration (Tc) 1
20 min
Peak Precipitation Intensity Over Tc 2
9.00 mm/hr
Return Period over Tc 3
< 2 Yr
Measured Flow
I/I Flow
Time of Peak Measured Flow
Apr 29, 2023 12:10
Time of Peak I/I Flow (TD)
Apr 29, 2023 17:25
Estimated Dry Weather Flow at TD
0.71 L/s
Peak Measured Flow
13.62 L/s
Peak I/I Flow 4
12.47 L/s
Peak I/I Rate 5
0.16 L/s/ha
Peak Measured Depth
99.00 mm
Total I/I Flow Volume during event
202,524.50 L
Volumetric Coefficient (Cv%) 6
0.78%
Total Measured Flow Volume during Event
420,527.90 L
Peak I/I Coefficient 7
0.0066
Hourly Wet-Weather Peaking Factor 8
4.57
Instantaneous Wet-Weather Peaking Factor 9
14.62
1
Time of Concentration (Tc): The estimated time for the flow to travel from the furthest point in the upstream area to the point of monitoring, assume flow is travelling at 1.00 m/s Peak Precipitation Intensity Over Tc: The peak rainfall intensity for the duration of the storm with the time interval defined by time of concentration 3 Return Period over Tc: The estimated time to elapse before a storm of equal or greater intensity will likely occur again, based on design storm criteria 4 Peak I/I Flow: The greatest difference captured between measured flow and estimated dry weather flow, Peak I/I Flow = Maximum (Measured Flow – Estimated Dry Weather Flow) 5 Peak I/I Rate: A normalized peak I/I flow based on catchment area size, Peak I/I Rate = Peak I/I Flow / Catchment Area 6 Volumetric Coefficient (Cv%): The ratio of total I/I volume and total rainfall volume, Cv% = Total I/I Flow Volume / Total Precipitation Volume * 100% 7 Peak I/ I Coefficient: The ratio of peak I/I flow and peak rainfall intensity, Peak I/ I Coefficient = Peak I/I Flow / (Peak Rainfall Intensity over Tc * Catchment Area) 8 Hourly Wet‐Weather Peaking Factor: The ratio of peak hourly wet‐weather measured flow and average dry‐weather flow, Wet‐Weather Peaking Factor = Peak Hourly Wet‐Weather Measured Flow / Average Dry-Weather Flow 9 Instantaneous Wet‐Weather Peaking Factor: The ratio of peak wet‐weather measured flow and average dry‐weather flow, Wet‐Weather Peaking Factor = Peak Wet‐Weather Measured Flow / Average Dry-Weather Flow 2
156 Civica Infrastructure Inc. www.civi.ca
Civica Infrastructures Inc. Kawartha Lakes Flow Monitoring Report
Appendix - A June 03, 2024
I/I Analysis Graph Station: B6
157 Civica Infrastructure Inc. www.civi.ca
Civica Infrastructures Inc. Kawartha Lakes Flow Monitoring Report
Appendix - A June 03, 2024
Infiltration/Inflow Event Analysis Station: B6 May 19, 2023 09:15 – May 21, 2023 03:10, Total Precipitation: 35.00 mm (26,600,000.00 L) Station Details
Storm Details
Catchment Area
76.00 ha
Total Precipitation
35.00 mm (26,600,000.00 L)
Duration of Storm
17.92 hr
Time of Concentration (Tc) 1
20 min
Peak Precipitation Intensity Over Tc 2
7.50 mm/hr
Return Period over Tc 3
< 2 Yr
Measured Flow
I/I Flow
Time of Peak Measured Flow
May 20, 2023 14:20
Time of Peak I/I Flow (TD)
May 20, 2023 14:20
Estimated Dry Weather Flow at TD
1.02 L/s
Peak Measured Flow
14.46 L/s
Peak I/I Flow 4
13.44 L/s
Peak I/I Rate 5
0.18 L/s/ha
Peak Measured Depth
91.00 mm
Total I/I Flow Volume during event
108,188.70 L
Volumetric Coefficient (Cv%) 6
0.41%
Total Measured Flow Volume during Event
200,117.20 L
Peak I/I Coefficient 7
0.0085
Hourly Wet-Weather Peaking Factor 8
4.99
Instantaneous Wet-Weather Peaking Factor 9
16.99
1
Time of Concentration (Tc): The estimated time for the flow to travel from the furthest point in the upstream area to the point of monitoring, assume flow is travelling at 1.00 m/s Peak Precipitation Intensity Over Tc: The peak rainfall intensity for the duration of the storm with the time interval defined by time of concentration 3 Return Period over Tc: The estimated time to elapse before a storm of equal or greater intensity will likely occur again, based on design storm criteria 4 Peak I/I Flow: The greatest difference captured between measured flow and estimated dry weather flow, Peak I/I Flow = Maximum (Measured Flow – Estimated Dry Weather Flow) 5 Peak I/I Rate: A normalized peak I/I flow based on catchment area size, Peak I/I Rate = Peak I/I Flow / Catchment Area 6 Volumetric Coefficient (Cv%): The ratio of total I/I volume and total rainfall volume, Cv% = Total I/I Flow Volume / Total Precipitation Volume * 100% 7 Peak I/ I Coefficient: The ratio of peak I/I flow and peak rainfall intensity, Peak I/ I Coefficient = Peak I/I Flow / (Peak Rainfall Intensity over Tc * Catchment Area) 8 Hourly Wet‐Weather Peaking Factor: The ratio of peak hourly wet‐weather measured flow and average dry‐weather flow, Wet‐Weather Peaking Factor = Peak Hourly Wet‐Weather Measured Flow / Average Dry-Weather Flow 9 Instantaneous Wet‐Weather Peaking Factor: The ratio of peak wet‐weather measured flow and average dry‐weather flow, Wet‐Weather Peaking Factor = Peak Wet‐Weather Measured Flow / Average Dry-Weather Flow 2
158 Civica Infrastructure Inc. www.civi.ca
Civica Infrastructures Inc. Kawartha Lakes Flow Monitoring Report
Appendix - A June 03, 2024
I/I Analysis Graph Station: B6
159 Civica Infrastructure Inc. www.civi.ca
Civica Infrastructures Inc. Kawartha Lakes Flow Monitoring Report
Appendix - A June 03, 2024
Infiltration/Inflow Event Analysis Station: B6 Jun 11, 2023 06:00 – Jun 13, 2023 10:35, Total Precipitation: 51.00 mm (38,760,000.00 L) Station Details
Storm Details
Catchment Area
76.00 ha
Total Precipitation
51.00 mm (38,760,000.00 L)
Duration of Storm
28.58 hr
Time of Concentration (Tc) 1
20 min
Peak Precipitation Intensity Over Tc 2
10.50 mm/hr
Return Period over Tc 3
< 2 Yr
Measured Flow
I/I Flow
Time of Peak Measured Flow
Jun 13, 2023 07:50
Time of Peak I/I Flow (TD)
Jun 12, 2023 18:20
Estimated Dry Weather Flow at TD
1.33 L/s
Peak Measured Flow
16.47 L/s
Peak I/I Flow 4
14.88 L/s
Peak I/I Rate 5
0.20 L/s/ha
Peak Measured Depth
94.00 mm
Total I/I Flow Volume during event
183,917.30 L
Volumetric Coefficient (Cv%) 6
0.48%
Total Measured Flow Volume during Event
317,857.10 L
Peak I/I Coefficient 7
0.0067
Hourly Wet-Weather Peaking Factor 8
5.25
Instantaneous Wet-Weather Peaking Factor 9
18.00
1
Time of Concentration (Tc): The estimated time for the flow to travel from the furthest point in the upstream area to the point of monitoring, assume flow is travelling at 1.00 m/s Peak Precipitation Intensity Over Tc: The peak rainfall intensity for the duration of the storm with the time interval defined by time of concentration 3 Return Period over Tc: The estimated time to elapse before a storm of equal or greater intensity will likely occur again, based on design storm criteria 4 Peak I/I Flow: The greatest difference captured between measured flow and estimated dry weather flow, Peak I/I Flow = Maximum (Measured Flow – Estimated Dry Weather Flow) 5 Peak I/I Rate: A normalized peak I/I flow based on catchment area size, Peak I/I Rate = Peak I/I Flow / Catchment Area 6 Volumetric Coefficient (Cv%): The ratio of total I/I volume and total rainfall volume, Cv% = Total I/I Flow Volume / Total Precipitation Volume * 100% 7 Peak I/ I Coefficient: The ratio of peak I/I flow and peak rainfall intensity, Peak I/ I Coefficient = Peak I/I Flow / (Peak Rainfall Intensity over Tc * Catchment Area) 8 Hourly Wet‐Weather Peaking Factor: The ratio of peak hourly wet‐weather measured flow and average dry‐weather flow, Wet‐Weather Peaking Factor = Peak Hourly Wet‐Weather Measured Flow / Average Dry-Weather Flow 9 Instantaneous Wet‐Weather Peaking Factor: The ratio of peak wet‐weather measured flow and average dry‐weather flow, Wet‐Weather Peaking Factor = Peak Wet‐Weather Measured Flow / Average Dry-Weather Flow 2
160 Civica Infrastructure Inc. www.civi.ca
Civica Infrastructures Inc. Kawartha Lakes Flow Monitoring Report
Appendix - A June 03, 2024
I/I Analysis Graph Station: B6
161 Civica Infrastructure Inc. www.civi.ca
Civica Infrastructures Inc. Kawartha Lakes Flow Monitoring Report
Appendix - A June 03, 2024
Infiltration/Inflow Event Analysis Station: B6 Jun 26, 2023 22:25 – Jun 28, 2023 09:05, Total Precipitation: 15.25 mm (11,590,000.00 L) Station Details
Storm Details
Catchment Area
76.00 ha
Total Precipitation
15.25 mm (11,590,000.00 L)
Duration of Storm
10.67 hr
Time of Concentration (Tc) 1
20 min
Peak Precipitation Intensity Over Tc 2
12.00 mm/hr
Return Period over Tc 3
< 2 Yr
Measured Flow
I/I Flow
Time of Peak Measured Flow
Jun 27, 2023 10:00
Time of Peak I/I Flow (TD)
Jun 28, 2023 07:10
Estimated Dry Weather Flow at TD
1.24 L/s
Peak Measured Flow
14.63 L/s
Peak I/I Flow 4
12.94 L/s
Peak I/I Rate 5
0.17 L/s/ha
Peak Measured Depth
83.99 mm
Total I/I Flow Volume during event
73,069.90 L
Volumetric Coefficient (Cv%) 6
0.63%
Total Measured Flow Volume during Event
121,022.70 L
Peak I/I Coefficient 7
0.0051
Hourly Wet-Weather Peaking Factor 8
7.44
Instantaneous Wet-Weather Peaking Factor 9
24.98
1
Time of Concentration (Tc): The estimated time for the flow to travel from the furthest point in the upstream area to the point of monitoring, assume flow is travelling at 1.00 m/s Peak Precipitation Intensity Over Tc: The peak rainfall intensity for the duration of the storm with the time interval defined by time of concentration 3 Return Period over Tc: The estimated time to elapse before a storm of equal or greater intensity will likely occur again, based on design storm criteria 4 Peak I/I Flow: The greatest difference captured between measured flow and estimated dry weather flow, Peak I/I Flow = Maximum (Measured Flow – Estimated Dry Weather Flow) 5 Peak I/I Rate: A normalized peak I/I flow based on catchment area size, Peak I/I Rate = Peak I/I Flow / Catchment Area 6 Volumetric Coefficient (Cv%): The ratio of total I/I volume and total rainfall volume, Cv% = Total I/I Flow Volume / Total Precipitation Volume * 100% 7 Peak I/ I Coefficient: The ratio of peak I/I flow and peak rainfall intensity, Peak I/ I Coefficient = Peak I/I Flow / (Peak Rainfall Intensity over Tc * Catchment Area) 8 Hourly Wet‐Weather Peaking Factor: The ratio of peak hourly wet‐weather measured flow and average dry‐weather flow, Wet‐Weather Peaking Factor = Peak Hourly Wet‐Weather Measured Flow / Average Dry-Weather Flow 9 Instantaneous Wet‐Weather Peaking Factor: The ratio of peak wet‐weather measured flow and average dry‐weather flow, Wet‐Weather Peaking Factor = Peak Wet‐Weather Measured Flow / Average Dry-Weather Flow 2
162 Civica Infrastructure Inc. www.civi.ca
Civica Infrastructures Inc. Kawartha Lakes Flow Monitoring Report
Appendix - A June 03, 2024
I/I Analysis Graph Station: B6
163 Civica Infrastructure Inc. www.civi.ca
Civica Infrastructures Inc. Kawartha Lakes Flow Monitoring Report
Appendix - A June 03, 2024
Infiltration/Inflow Event Analysis Station: B6 Jul 12, 2023 14:55 – Jul 13, 2023 19:00, Total Precipitation: 16.25 mm (12,350,000.00 L) Station Details
Storm Details
Catchment Area
76.00 ha
Total Precipitation
16.25 mm (12,350,000.00 L)
Duration of Storm
4.08 hr
Time of Concentration (Tc) 1
20 min
Peak Precipitation Intensity Over Tc 2
8.20 mm/hr
Return Period over Tc 3
< 2 Yr
Measured Flow
I/I Flow
Time of Peak Measured Flow
Jul 13, 2023 09:40
Time of Peak I/I Flow (TD)
Jul 13, 2023 09:40
Estimated Dry Weather Flow at TD
1.65 L/s
Peak Measured Flow
16.56 L/s
Peak I/I Flow 4
14.91 L/s
Peak I/I Rate 5
0.20 L/s/ha
Peak Measured Depth
93.00 mm
Total I/I Flow Volume during event
70,554.40 L
Volumetric Coefficient (Cv%) 6
0.57%
Total Measured Flow Volume during Event
123,844.00 L
Peak I/I Coefficient 7
0.0086
Hourly Wet-Weather Peaking Factor 8
6.15
Instantaneous Wet-Weather Peaking Factor 9
18.09
1
Time of Concentration (Tc): The estimated time for the flow to travel from the furthest point in the upstream area to the point of monitoring, assume flow is travelling at 1.00 m/s Peak Precipitation Intensity Over Tc: The peak rainfall intensity for the duration of the storm with the time interval defined by time of concentration 3 Return Period over Tc: The estimated time to elapse before a storm of equal or greater intensity will likely occur again, based on design storm criteria 4 Peak I/I Flow: The greatest difference captured between measured flow and estimated dry weather flow, Peak I/I Flow = Maximum (Measured Flow – Estimated Dry Weather Flow) 5 Peak I/I Rate: A normalized peak I/I flow based on catchment area size, Peak I/I Rate = Peak I/I Flow / Catchment Area 6 Volumetric Coefficient (Cv%): The ratio of total I/I volume and total rainfall volume, Cv% = Total I/I Flow Volume / Total Precipitation Volume * 100% 7 Peak I/ I Coefficient: The ratio of peak I/I flow and peak rainfall intensity, Peak I/ I Coefficient = Peak I/I Flow / (Peak Rainfall Intensity over Tc * Catchment Area) 8 Hourly Wet‐Weather Peaking Factor: The ratio of peak hourly wet‐weather measured flow and average dry‐weather flow, Wet‐Weather Peaking Factor = Peak Hourly Wet‐Weather Measured Flow / Average Dry-Weather Flow 9 Instantaneous Wet‐Weather Peaking Factor: The ratio of peak wet‐weather measured flow and average dry‐weather flow, Wet‐Weather Peaking Factor = Peak Wet‐Weather Measured Flow / Average Dry-Weather Flow 2
164 Civica Infrastructure Inc. www.civi.ca
Civica Infrastructures Inc. Kawartha Lakes Flow Monitoring Report
Appendix - A June 03, 2024
I/I Analysis Graph Station: B6
165 Civica Infrastructure Inc. www.civi.ca
Civica Infrastructures Inc. Kawartha Lakes Flow Monitoring Report
Appendix - A June 03, 2024
Infiltration/Inflow Event Analysis Station: B6 Jul 20, 2023 07:25 – Jul 22, 2023 02:10, Total Precipitation: 17.50 mm (13,300,000.00 L) Station Details
Storm Details
Catchment Area
76.00 ha
Total Precipitation
17.50 mm (13,300,000.00 L)
Duration of Storm
18.75 hr
Time of Concentration (Tc) 1
20 min
Peak Precipitation Intensity Over Tc 2
9.80 mm/hr
Return Period over Tc 3
< 2 Yr
Measured Flow
I/I Flow
Time of Peak Measured Flow
Jul 21, 2023 08:25
Time of Peak I/I Flow (TD)
Jul 21, 2023 07:05
Estimated Dry Weather Flow at TD
1.25 L/s
Peak Measured Flow
18.08 L/s
Peak I/I Flow 4
16.55 L/s
Peak I/I Rate 5
0.22 L/s/ha
Peak Measured Depth
99.00 mm
Total I/I Flow Volume during event
112,346.60 L
Volumetric Coefficient (Cv%) 6
0.85%
Total Measured Flow Volume during Event
199,204.00 L
Peak I/I Coefficient 7
0.0080
Hourly Wet-Weather Peaking Factor 8
6.36
Instantaneous Wet-Weather Peaking Factor 9
23.11
1
Time of Concentration (Tc): The estimated time for the flow to travel from the furthest point in the upstream area to the point of monitoring, assume flow is travelling at 1.00 m/s Peak Precipitation Intensity Over Tc: The peak rainfall intensity for the duration of the storm with the time interval defined by time of concentration 3 Return Period over Tc: The estimated time to elapse before a storm of equal or greater intensity will likely occur again, based on design storm criteria 4 Peak I/I Flow: The greatest difference captured between measured flow and estimated dry weather flow, Peak I/I Flow = Maximum (Measured Flow – Estimated Dry Weather Flow) 5 Peak I/I Rate: A normalized peak I/I flow based on catchment area size, Peak I/I Rate = Peak I/I Flow / Catchment Area 6 Volumetric Coefficient (Cv%): The ratio of total I/I volume and total rainfall volume, Cv% = Total I/I Flow Volume / Total Precipitation Volume * 100% 7 Peak I/ I Coefficient: The ratio of peak I/I flow and peak rainfall intensity, Peak I/ I Coefficient = Peak I/I Flow / (Peak Rainfall Intensity over Tc * Catchment Area) 8 Hourly Wet‐Weather Peaking Factor: The ratio of peak hourly wet‐weather measured flow and average dry‐weather flow, Wet‐Weather Peaking Factor = Peak Hourly Wet‐Weather Measured Flow / Average Dry-Weather Flow 9 Instantaneous Wet‐Weather Peaking Factor: The ratio of peak wet‐weather measured flow and average dry‐weather flow, Wet‐Weather Peaking Factor = Peak Wet‐Weather Measured Flow / Average Dry-Weather Flow 2
166 Civica Infrastructure Inc. www.civi.ca
Civica Infrastructures Inc. Kawartha Lakes Flow Monitoring Report
Appendix - A June 03, 2024
I/I Analysis Graph Station: B6
167 Civica Infrastructure Inc. www.civi.ca
Civica Infrastructures Inc. Kawartha Lakes Flow Monitoring Report
Appendix - A June 03, 2024
Infiltration/Inflow Event Analysis Station: B6 Jul 28, 2023 20:30 – Jul 29, 2023 23:55, Total Precipitation: 16.50 mm (12,540,000.00 L) Station Details
Storm Details
Catchment Area
76.00 ha
Total Precipitation
16.50 mm (12,540,000.00 L)
Duration of Storm
3.42 hr
Time of Concentration (Tc) 1
20 min
Peak Precipitation Intensity Over Tc 2
18.00 mm/hr
Return Period over Tc 3
< 2 Yr
Measured Flow
I/I Flow
Time of Peak Measured Flow
Jul 29, 2023 09:00
Time of Peak I/I Flow (TD)
Jul 29, 2023 09:00
Estimated Dry Weather Flow at TD
3.55 L/s
Peak Measured Flow
16.08 L/s
Peak I/I Flow 4
12.52 L/s
Peak I/I Rate 5
0.17 L/s/ha
Peak Measured Depth
94.00 mm
Total I/I Flow Volume during event
61,302.10 L
Volumetric Coefficient (Cv%) 6
0.49%
Total Measured Flow Volume during Event
123,334.00 L
Peak I/I Coefficient 7
0.0033
Hourly Wet-Weather Peaking Factor 8
3.70
Instantaneous Wet-Weather Peaking Factor 9
14.46
1
Time of Concentration (Tc): The estimated time for the flow to travel from the furthest point in the upstream area to the point of monitoring, assume flow is travelling at 1.00 m/s Peak Precipitation Intensity Over Tc: The peak rainfall intensity for the duration of the storm with the time interval defined by time of concentration 3 Return Period over Tc: The estimated time to elapse before a storm of equal or greater intensity will likely occur again, based on design storm criteria 4 Peak I/I Flow: The greatest difference captured between measured flow and estimated dry weather flow, Peak I/I Flow = Maximum (Measured Flow – Estimated Dry Weather Flow) 5 Peak I/I Rate: A normalized peak I/I flow based on catchment area size, Peak I/I Rate = Peak I/I Flow / Catchment Area 6 Volumetric Coefficient (Cv%): The ratio of total I/I volume and total rainfall volume, Cv% = Total I/I Flow Volume / Total Precipitation Volume * 100% 7 Peak I/ I Coefficient: The ratio of peak I/I flow and peak rainfall intensity, Peak I/ I Coefficient = Peak I/I Flow / (Peak Rainfall Intensity over Tc * Catchment Area) 8 Hourly Wet‐Weather Peaking Factor: The ratio of peak hourly wet‐weather measured flow and average dry‐weather flow, Wet‐Weather Peaking Factor = Peak Hourly Wet‐Weather Measured Flow / Average Dry-Weather Flow 9 Instantaneous Wet‐Weather Peaking Factor: The ratio of peak wet‐weather measured flow and average dry‐weather flow, Wet‐Weather Peaking Factor = Peak Wet‐Weather Measured Flow / Average Dry-Weather Flow 2
168 Civica Infrastructure Inc. www.civi.ca
Civica Infrastructures Inc. Kawartha Lakes Flow Monitoring Report
Appendix - A June 03, 2024
I/I Analysis Graph Station: B6
169 Civica Infrastructure Inc. www.civi.ca
Civica Infrastructures Inc. Kawartha Lakes Flow Monitoring Report
Appendix - A June 03, 2024
Infiltration/Inflow Event Analysis Station: B6 Aug 11, 2023 21:30 – Aug 13, 2023 23:05, Total Precipitation: 15.00 mm (11,400,000.00 L) Station Details
Storm Details
Catchment Area
76.00 ha
Total Precipitation
15.00 mm (11,400,000.00 L)
Duration of Storm
25.58 hr
Time of Concentration (Tc) 1
20 min
Peak Precipitation Intensity Over Tc 2
33.00 mm/hr
Return Period over Tc 3
< 2 Yr
Measured Flow
I/I Flow
Time of Peak Measured Flow
Aug 13, 2023 18:40
Time of Peak I/I Flow (TD)
Aug 13, 2023 18:40
Estimated Dry Weather Flow at TD
1.03 L/s
Peak Measured Flow
17.03 L/s
Peak I/I Flow 4
16.00 L/s
Peak I/I Rate 5
0.21 L/s/ha
Peak Measured Depth
95.00 mm
Total I/I Flow Volume during event
143,933.80 L
Volumetric Coefficient (Cv%) 6
1.26%
Total Measured Flow Volume during Event
278,340.30 L
Peak I/I Coefficient 7
0.0023
Hourly Wet-Weather Peaking Factor 8
4.47
Instantaneous Wet-Weather Peaking Factor 9
17.18
1
Time of Concentration (Tc): The estimated time for the flow to travel from the furthest point in the upstream area to the point of monitoring, assume flow is travelling at 1.00 m/s Peak Precipitation Intensity Over Tc: The peak rainfall intensity for the duration of the storm with the time interval defined by time of concentration 3 Return Period over Tc: The estimated time to elapse before a storm of equal or greater intensity will likely occur again, based on design storm criteria 4 Peak I/I Flow: The greatest difference captured between measured flow and estimated dry weather flow, Peak I/I Flow = Maximum (Measured Flow – Estimated Dry Weather Flow) 5 Peak I/I Rate: A normalized peak I/I flow based on catchment area size, Peak I/I Rate = Peak I/I Flow / Catchment Area 6 Volumetric Coefficient (Cv%): The ratio of total I/I volume and total rainfall volume, Cv% = Total I/I Flow Volume / Total Precipitation Volume * 100% 7 Peak I/ I Coefficient: The ratio of peak I/I flow and peak rainfall intensity, Peak I/ I Coefficient = Peak I/I Flow / (Peak Rainfall Intensity over Tc * Catchment Area) 8 Hourly Wet‐Weather Peaking Factor: The ratio of peak hourly wet‐weather measured flow and average dry‐weather flow, Wet‐Weather Peaking Factor = Peak Hourly Wet‐Weather Measured Flow / Average Dry-Weather Flow 9 Instantaneous Wet‐Weather Peaking Factor: The ratio of peak wet‐weather measured flow and average dry‐weather flow, Wet‐Weather Peaking Factor = Peak Wet‐Weather Measured Flow / Average Dry-Weather Flow 2
170 Civica Infrastructure Inc. www.civi.ca
Civica Infrastructures Inc. Kawartha Lakes Flow Monitoring Report
Appendix - A June 03, 2024
I/I Analysis Graph Station: B6
171 Civica Infrastructure Inc. www.civi.ca
Civica Infrastructures Inc. Kawartha Lakes Flow Monitoring Report
Appendix - A June 03, 2024
Infiltration/Inflow Event Analysis Station: B6 Oct 05, 2023 08:40 – Oct 07, 2023 19:20, Total Precipitation: 35.75 mm (27,170,000.00 L) Station Details
Storm Details
Catchment Area
76.00 ha
Total Precipitation
35.75 mm (27,170,000.00 L)
Duration of Storm
34.67 hr
Time of Concentration (Tc) 1
20 min
Peak Precipitation Intensity Over Tc 2
22.50 mm/hr
Return Period over Tc 3
< 2 Yr
Measured Flow
I/I Flow
Time of Peak Measured Flow
Oct 06, 2023 08:35
Time of Peak I/I Flow (TD)
Oct 06, 2023 06:45
Estimated Dry Weather Flow at TD
1.38 L/s
Peak Measured Flow
26.02 L/s
Peak I/I Flow 4
24.02 L/s
Peak I/I Rate 5
0.32 L/s/ha
Peak Measured Depth
120.00 mm
Total I/I Flow Volume during event
129,268.70 L
Volumetric Coefficient (Cv%) 6
0.48%
Total Measured Flow Volume during Event
237,472.80 L
Peak I/I Coefficient 7
0.0051
Hourly Wet-Weather Peaking Factor 8
7.59
Instantaneous Wet-Weather Peaking Factor 9
40.48
1
Time of Concentration (Tc): The estimated time for the flow to travel from the furthest point in the upstream area to the point of monitoring, assume flow is travelling at 1.00 m/s Peak Precipitation Intensity Over Tc: The peak rainfall intensity for the duration of the storm with the time interval defined by time of concentration 3 Return Period over Tc: The estimated time to elapse before a storm of equal or greater intensity will likely occur again, based on design storm criteria 4 Peak I/I Flow: The greatest difference captured between measured flow and estimated dry weather flow, Peak I/I Flow = Maximum (Measured Flow – Estimated Dry Weather Flow) 5 Peak I/I Rate: A normalized peak I/I flow based on catchment area size, Peak I/I Rate = Peak I/I Flow / Catchment Area 6 Volumetric Coefficient (Cv%): The ratio of total I/I volume and total rainfall volume, Cv% = Total I/I Flow Volume / Total Precipitation Volume * 100% 7 Peak I/ I Coefficient: The ratio of peak I/I flow and peak rainfall intensity, Peak I/ I Coefficient = Peak I/I Flow / (Peak Rainfall Intensity over Tc * Catchment Area) 8 Hourly Wet‐Weather Peaking Factor: The ratio of peak hourly wet‐weather measured flow and average dry‐weather flow, Wet‐Weather Peaking Factor = Peak Hourly Wet‐Weather Measured Flow / Average Dry-Weather Flow 9 Instantaneous Wet‐Weather Peaking Factor: The ratio of peak wet‐weather measured flow and average dry‐weather flow, Wet‐Weather Peaking Factor = Peak Wet‐Weather Measured Flow / Average Dry-Weather Flow 2
172 Civica Infrastructure Inc. www.civi.ca
Civica Infrastructures Inc. Kawartha Lakes Flow Monitoring Report
Appendix - A June 03, 2024
I/I Analysis Graph Station: B6
173 Civica Infrastructure Inc. www.civi.ca
Civica Infrastructures Inc. Kawartha Lakes Flow Monitoring Report
Appendix - A June 03, 2024
Infiltration/Inflow Event Analysis Station: B6 Oct 08, 2023 02:50 – Oct 12, 2023 11:55, Total Precipitation: 28.75 mm (21,850,000.00 L) Station Details
Storm Details
Catchment Area
76.00 ha
Total Precipitation
28.75 mm (21,850,000.00 L)
Duration of Storm
81.08 hr
Time of Concentration (Tc) 1
20 min
Peak Precipitation Intensity Over Tc 2
3.80 mm/hr
Return Period over Tc 3
< 2 Yr
Measured Flow
I/I Flow
Time of Peak Measured Flow
Oct 10, 2023 09:40
Time of Peak I/I Flow (TD)
Oct 10, 2023 09:40
Estimated Dry Weather Flow at TD
1.06 L/s
Peak Measured Flow
19.26 L/s
Peak I/I Flow 4
18.21 L/s
Peak I/I Rate 5
0.24 L/s/ha
Peak Measured Depth
96.00 mm
Total I/I Flow Volume during event
321,100.90 L
Volumetric Coefficient (Cv%) 6
1.47%
Total Measured Flow Volume during Event
516,337.90 L
Peak I/I Coefficient 7
0.0230
Hourly Wet-Weather Peaking Factor 8
8.28
Instantaneous Wet-Weather Peaking Factor 9
33.09
1
Time of Concentration (Tc): The estimated time for the flow to travel from the furthest point in the upstream area to the point of monitoring, assume flow is travelling at 1.00 m/s Peak Precipitation Intensity Over Tc: The peak rainfall intensity for the duration of the storm with the time interval defined by time of concentration 3 Return Period over Tc: The estimated time to elapse before a storm of equal or greater intensity will likely occur again, based on design storm criteria 4 Peak I/I Flow: The greatest difference captured between measured flow and estimated dry weather flow, Peak I/I Flow = Maximum (Measured Flow – Estimated Dry Weather Flow) 5 Peak I/I Rate: A normalized peak I/I flow based on catchment area size, Peak I/I Rate = Peak I/I Flow / Catchment Area 6 Volumetric Coefficient (Cv%): The ratio of total I/I volume and total rainfall volume, Cv% = Total I/I Flow Volume / Total Precipitation Volume * 100% 7 Peak I/ I Coefficient: The ratio of peak I/I flow and peak rainfall intensity, Peak I/ I Coefficient = Peak I/I Flow / (Peak Rainfall Intensity over Tc * Catchment Area) 8 Hourly Wet‐Weather Peaking Factor: The ratio of peak hourly wet‐weather measured flow and average dry‐weather flow, Wet‐Weather Peaking Factor = Peak Hourly Wet‐Weather Measured Flow / Average Dry-Weather Flow 9 Instantaneous Wet‐Weather Peaking Factor: The ratio of peak wet‐weather measured flow and average dry‐weather flow, Wet‐Weather Peaking Factor = Peak Wet‐Weather Measured Flow / Average Dry-Weather Flow 2
174 Civica Infrastructure Inc. www.civi.ca
Civica Infrastructures Inc. Kawartha Lakes Flow Monitoring Report
Appendix - A June 03, 2024
Activity Log Station: B6 Date Time
Type
Purpose of Visit
Comment
25-Jan-2023 10:10:00 AM
Installation Log
INSTALLATION
22-Feb-2023 10:58:00 AM
Maintenance Log
MAINTENANCE / CALIBRATION
02-Mar-2023 01:06:00 PM
Maintenance Log
CALIBRATION
TC SET,DATA DOWNLOADED,TELEMETRY SENT,DEBRIS AND SILT REMOVED,SITE CALIBRATED,ANTENNA IN GOOD CONDITION,PHOTOS AND VIDEOS TAKEN
Yes
14-Mar-2023 02:02:00 PM
Maintenance Log
CALIBRATION
DATA DOWNLOADED, TELEMETRY SENT, PHOTOS TAKEN , MEASUREMENTS TAKEN, SITE CALIBRATED, VELOCITY IS VERY LOW, CLOSE TO 0, DEBRIS FOUND ON DOWNWARD SENSOR CLEARED.
Yes
03-Apr-2023 09:50:00 AM
Maintenance Log
DATA DOWNLOAD
PHOTOS TAKEN,DATA DOWNLOADED,TELEMETRY NOT SENT SENT,DESSICANT CHECKED,BATTERY CHECKED,SITE CLEARED,LOGGER TO BE SWAPPED
No
Yes
TC SETUP, PHOTOS TAKEN,VIDEOS TAKEN,SENSOR INSTALLED,AV SENSOR RING MADE,DETEC AV LOGGER SET UP,STARTED AND CALIBRATED, Downloaded Data, Telemetry Sent.
Calibration Measurement Yes Yes
19-Apr-2023 01:02:00 PM
Maintenance Log
CALIBRATION
TC SET,SURVEY SENT,DATA DOWNLOADED, TELEMETRY UNABLE TO SENT IT, DEBRIS CLEARED, PHOTOS AND VIDEOS TAKEN, SITE CALIBRATED,ANTENNA REPLACED,DESSICANT CHECKED,BATTERY CHECKED,SITE CLEARED, TURN OFF THE LOGGER, SIGNAL STRENGTH CHECKED
10-May-2023 10:18:00 AM
Maintenance Log
CALIBRATION
ADE ENTRY, TOOK PHOTOS/VIDEOS, TOOK MEASUREMENTS,DEBRIS AND SILT CLEARED, CALIBRATED SITE,SITE CLEARED
Yes
Yes
23-Jun-2023 02:52:00 PM
Maintenance Log
CALIBRATION
SURVEY SENT,DATA DOWNLOADED,TELEMETRY SNDING FAILED DUE TO SITE POOR NETWORK,SILT AND DEBRIS CLEARED ENTRY MADE, PHOTOS/VIDEOS TAKEN, MEASUREMENTS TAKEN, SITE CALIBRATED,SITE CLEARED
22-Aug-2023 01:40:00 PM
Maintenance Log
DATA DOWNLOAD
TC SET,DATA DOWNLOADED,TELEMETRY SENT NOT REFLECTED IN FZ,DESSICANT CHECKED,ANTENNA CHECKED,SITE CLEARED
Yes
24-Oct-2023 11:05:00 AM
Removal Log
REMOVAL
SET UP CS/TC, DOWNLOAD DATA, TOOK MEASUREMENTS, CALIBRATED SITE, REMOVED ALL EQUIPMENT, REMOVAL COMPLETE
Yes
175 Civica Infrastructure Inc. www.civi.ca
Civica Infrastructures Inc. Kawartha Lakes Flow Monitoring Report
Appendix - A June 03, 2024
Aggregate Data Station: B8
Precipitation Date From
Date To
Days
Min (mm)
Avg (mm)
Max (mm)
Sum (mm)
Count
Time of Min1
Time of Max1
Feb 15, 2023
Oct 24, 2023
252
0.00
0.01
5.00
586.50
72,317
Wed Feb 15, 2023 00:00
Fri Oct 06, 2023 18:10
Level Date From
Date To
Days
Min (m)
Avg (m)
Max (m)
Count
Time of Min1
Time of Max1
Feb 15, 2023
Oct 24, 2023
252
0.00
0.04
0.13
92,536
Sat Sep 09, 2023 04:50
Wed Oct 04, 2023 00:35
Flow
1
Date From
Date To
Days
Min (L/s)
Avg (L/s)
Max (L/s)
Total Volume (1,000,000 L)
Count
Time of Min1
Time of Max1
Feb 15, 2023
Oct 24, 2023
252
0.00
1.15
15.96
32.02
92,536
Sat Sep 09, 2023 04:50
Wed Oct 04, 2023 00:35
Time of Min and Time of Max will be displayed by first occurrence
176 Civica Infrastructure Inc. www.civi.ca
Civica Infrastructures Inc. Kawartha Lakes Flow Monitoring Report
Appendix - A June 03, 2024
Data Chart Station: B8 Feb 15, 2023 – Feb 28, 2023
177 Civica Infrastructure Inc. www.civi.ca
Civica Infrastructures Inc. Kawartha Lakes Flow Monitoring Report
Appendix - A June 03, 2024
Data Chart Station: B8 Mar 01, 2023 – Mar 31, 2023
178 Civica Infrastructure Inc. www.civi.ca
Civica Infrastructures Inc. Kawartha Lakes Flow Monitoring Report
Appendix - A June 03, 2024
Data Chart Station: B8 Apr 01, 2023 – Apr 30, 2023
179 Civica Infrastructure Inc. www.civi.ca
Civica Infrastructures Inc. Kawartha Lakes Flow Monitoring Report
Appendix - A June 03, 2024
Data Chart Station: B8 May 01, 2023 – May 31, 2023
180 Civica Infrastructure Inc. www.civi.ca
Civica Infrastructures Inc. Kawartha Lakes Flow Monitoring Report
Appendix - A June 03, 2024
Data Chart Station: B8 Jun 01, 2023 – Jun 30, 2023
181 Civica Infrastructure Inc. www.civi.ca
Civica Infrastructures Inc. Kawartha Lakes Flow Monitoring Report
Appendix - A June 03, 2024
Data Chart Station: B8 Jul 01, 2023 – Jul 31, 2023
182 Civica Infrastructure Inc. www.civi.ca
Civica Infrastructures Inc. Kawartha Lakes Flow Monitoring Report
Appendix - A June 03, 2024
Data Chart Station: B8 Aug 01, 2023 – Aug 31, 2023
183 Civica Infrastructure Inc. www.civi.ca
Civica Infrastructures Inc. Kawartha Lakes Flow Monitoring Report
Appendix - A June 03, 2024
Data Chart Station: B8 Sep 01, 2023 – Sep 30, 2023
184 Civica Infrastructure Inc. www.civi.ca
Civica Infrastructures Inc. Kawartha Lakes Flow Monitoring Report
Appendix - A June 03, 2024
Data Chart Station: B8 Oct 01, 2023 – Oct 24, 2023
185 Civica Infrastructure Inc. www.civi.ca
Civica Infrastructures Inc. Kawartha Lakes Flow Monitoring Report
Appendix - A June 03, 2024
Sanitary Report Station: B8
1
Average Dry Weather Flow (L/s)
Average Dry Weather Flow (L/c/d)
Average Daily Minimum Dry Weather Flow (L/s)
Average Daily Peak Dry Weather Flow (L/s)
1.091
163.931
0.238
3.153
Peaking Factor
Groundwater Infiltration (L/s)1
Groundwater Infiltration (L/ha/d)
% of GWI in Average DWF
2.890
0.202
436.800
18.536
Groundwater infiltration (GWI) is assumed as 85% of the daily minimum flow averaged over the monitoring period
186 Civica Infrastructure Inc. www.civi.ca
Civica Infrastructures Inc. Kawartha Lakes Flow Monitoring Report
Appendix - A June 03, 2024
I/I Analysis Table
1
Event1
Total Precipitation (mm)
Duration (hours)
Peak Intensity Over Tc at Station (mm/hr)
Mar 16, 2023
19.50
12.75
Mar 31, 2023
22.00
Apr 05, 2023
B8 Measured Peak Flow (L/s)
Peak I/I Flow (L/s)
Peak I/I Rate (L/s/ha)
Volumetric Runoff Coefficient (CV%)
Peaking Factor (PF)
3.00
3.20
1.87
0.05
0.28 %
1.80
16.50
7.50
2.81
1.28
0.03
0.31 %
1.26
28.75
10.67
26.20
2.81
2.10
0.05
0.27 %
2.99
Apr 28, 2023
34.00
52.92
9.00
3.67
1.93
0.05
0.49 %
1.81
May 19, 2023
35.00
17.92
7.50
4.42
2.52
0.06
0.27 %
2.49
Jun 11, 2023
51.00
28.58
10.50
3.22
2.23
0.06
0.28 %
2.21
Jun 27, 2023
15.25
10.67
12.00
2.61
0.90
0.02
0.17 %
0.94
Jul 13, 2023
16.25
4.08
8.20
3.33
1.78
0.05
0.15 %
1.59
Jul 20, 2023
17.50
18.75
9.80
2.71
1.35
0.03
0.18 %
1.48
Jul 29, 2023
16.50
3.42
18.00
3.91
1.97
0.05
0.13 %
1.48
Aug 12, 2023
15.00
25.58
33.00
4.16
2.25
0.06
0.34 %
1.83
Oct 05, 2023
35.75
34.67
22.50
15.96
15.57
0.39
0.44 %
15.15
Oct 08, 2023
28.75
81.08
3.80
3.79
2.06
0.05
0.72 %
2.15
Average
25.79
24.43
13.15
4.35
2.91
0.07
0.31 %
2.86
Maximum
51.00
81.08
33.00
15.96
15.57
0.39
0.72 %
15.15
Flow KPIs
Measured Storms
Station: B8
An event is a storm with a minimum volume of 15mm and a minimum inter-event dry period of 12 hours
187 Civica Infrastructure Inc. www.civi.ca
Civica Infrastructures Inc. Kawartha Lakes Flow Monitoring Report
Appendix - A June 03, 2024
I/I Analysis Graph Station: B8
188 Civica Infrastructure Inc. www.civi.ca
Civica Infrastructures Inc. Kawartha Lakes Flow Monitoring Report
Appendix - A June 03, 2024
Infiltration/Inflow Event Analysis Station: B8 Mar 16, 2023 11:05 – Mar 17, 2023 23:50, Total Precipitation: 19.50 mm (7,800,000.00 L) Station Details
Storm Details
Catchment Area
40.00 ha
Total Precipitation
19.50 mm (7,800,000.00 L)
Duration of Storm
12.75 hr
Time of Concentration (Tc) 1
20 min
Peak Precipitation Intensity Over Tc 2
3.00 mm/hr
Return Period over Tc 3
< 2 Yr
Measured Flow
I/I Flow
Time of Peak Measured Flow
Mar 17, 2023 10:40
Time of Peak I/I Flow (TD)
Mar 17, 2023 10:40
Estimated Dry Weather Flow at TD
1.33 L/s
Peak Measured Flow
3.20 L/s
Peak I/I Flow 4
1.87 L/s
Peak I/I Rate 5
0.05 L/s/ha
Peak Measured Depth
72.00 mm
Total I/I Flow Volume during event
21,745.90 L
Volumetric Coefficient (Cv%) 6
0.28%
Total Measured Flow Volume during Event
114,739.10 L
Peak I/I Coefficient 7
0.0056
Hourly Wet-Weather Peaking Factor 8
2.31
Instantaneous Wet-Weather Peaking Factor 9
3.08
1
Time of Concentration (Tc): The estimated time for the flow to travel from the furthest point in the upstream area to the point of monitoring, assume flow is travelling at 1.00 m/s Peak Precipitation Intensity Over Tc: The peak rainfall intensity for the duration of the storm with the time interval defined by time of concentration 3 Return Period over Tc: The estimated time to elapse before a storm of equal or greater intensity will likely occur again, based on design storm criteria 4 Peak I/I Flow: The greatest difference captured between measured flow and estimated dry weather flow, Peak I/I Flow = Maximum (Measured Flow – Estimated Dry Weather Flow) 5 Peak I/I Rate: A normalized peak I/I flow based on catchment area size, Peak I/I Rate = Peak I/I Flow / Catchment Area 6 Volumetric Coefficient (Cv%): The ratio of total I/I volume and total rainfall volume, Cv% = Total I/I Flow Volume / Total Precipitation Volume * 100% 7 Peak I/ I Coefficient: The ratio of peak I/I flow and peak rainfall intensity, Peak I/ I Coefficient = Peak I/I Flow / (Peak Rainfall Intensity over Tc * Catchment Area) 8 Hourly Wet‐Weather Peaking Factor: The ratio of peak hourly wet‐weather measured flow and average dry‐weather flow, Wet‐Weather Peaking Factor = Peak Hourly Wet‐Weather Measured Flow / Average Dry-Weather Flow 9 Instantaneous Wet‐Weather Peaking Factor: The ratio of peak wet‐weather measured flow and average dry‐weather flow, Wet‐Weather Peaking Factor = Peak Wet‐Weather Measured Flow / Average Dry-Weather Flow 2
189 Civica Infrastructure Inc. www.civi.ca
Civica Infrastructures Inc. Kawartha Lakes Flow Monitoring Report
Appendix - A June 03, 2024
I/I Analysis Graph Station: B8
190 Civica Infrastructure Inc. www.civi.ca
Civica Infrastructures Inc. Kawartha Lakes Flow Monitoring Report
Appendix - A June 03, 2024
Infiltration/Inflow Event Analysis Station: B8 Mar 31, 2023 00:55 – Apr 01, 2023 17:25, Total Precipitation: 22.00 mm (8,800,000.00 L) Station Details
Storm Details
Catchment Area
40.00 ha
Total Precipitation
22.00 mm (8,800,000.00 L)
Duration of Storm
16.50 hr
Time of Concentration (Tc) 1
20 min
Peak Precipitation Intensity Over Tc 2
7.50 mm/hr
Return Period over Tc 3
< 2 Yr
Measured Flow
I/I Flow
Time of Peak Measured Flow
Apr 01, 2023 09:10
Time of Peak I/I Flow (TD)
Apr 01, 2023 10:45
Estimated Dry Weather Flow at TD
1.44 L/s
Peak Measured Flow
2.81 L/s
Peak I/I Flow 4
1.28 L/s
Peak I/I Rate 5
0.03 L/s/ha
Peak Measured Depth
69.00 mm
Total I/I Flow Volume during event
26,925.20 L
Volumetric Coefficient (Cv%) 6
0.31%
Total Measured Flow Volume during Event
131,598.60 L
Peak I/I Coefficient 7
0.0015
Hourly Wet-Weather Peaking Factor 8
2.43
Instantaneous Wet-Weather Peaking Factor 9
2.76
1
Time of Concentration (Tc): The estimated time for the flow to travel from the furthest point in the upstream area to the point of monitoring, assume flow is travelling at 1.00 m/s Peak Precipitation Intensity Over Tc: The peak rainfall intensity for the duration of the storm with the time interval defined by time of concentration 3 Return Period over Tc: The estimated time to elapse before a storm of equal or greater intensity will likely occur again, based on design storm criteria 4 Peak I/I Flow: The greatest difference captured between measured flow and estimated dry weather flow, Peak I/I Flow = Maximum (Measured Flow – Estimated Dry Weather Flow) 5 Peak I/I Rate: A normalized peak I/I flow based on catchment area size, Peak I/I Rate = Peak I/I Flow / Catchment Area 6 Volumetric Coefficient (Cv%): The ratio of total I/I volume and total rainfall volume, Cv% = Total I/I Flow Volume / Total Precipitation Volume * 100% 7 Peak I/ I Coefficient: The ratio of peak I/I flow and peak rainfall intensity, Peak I/ I Coefficient = Peak I/I Flow / (Peak Rainfall Intensity over Tc * Catchment Area) 8 Hourly Wet‐Weather Peaking Factor: The ratio of peak hourly wet‐weather measured flow and average dry‐weather flow, Wet‐Weather Peaking Factor = Peak Hourly Wet‐Weather Measured Flow / Average Dry-Weather Flow 9 Instantaneous Wet‐Weather Peaking Factor: The ratio of peak wet‐weather measured flow and average dry‐weather flow, Wet‐Weather Peaking Factor = Peak Wet‐Weather Measured Flow / Average Dry-Weather Flow 2
191 Civica Infrastructure Inc. www.civi.ca
Civica Infrastructures Inc. Kawartha Lakes Flow Monitoring Report
Appendix - A June 03, 2024
I/I Analysis Graph Station: B8
192 Civica Infrastructure Inc. www.civi.ca
Civica Infrastructures Inc. Kawartha Lakes Flow Monitoring Report
Appendix - A June 03, 2024
Infiltration/Inflow Event Analysis Station: B8 Apr 04, 2023 17:50 – Apr 06, 2023 04:30, Total Precipitation: 28.75 mm (11,500,000.00 L) Station Details
Storm Details
Catchment Area
40.00 ha
Total Precipitation
28.75 mm (11,500,000.00 L)
Duration of Storm
10.67 hr
Time of Concentration (Tc) 1
20 min
Peak Precipitation Intensity Over Tc 2
26.20 mm/hr
Return Period over Tc 3
< 2 Yr
Measured Flow
I/I Flow
Time of Peak Measured Flow
Apr 05, 2023 23:00
Time of Peak I/I Flow (TD)
Apr 05, 2023 23:15
Estimated Dry Weather Flow at TD
0.70 L/s
Peak Measured Flow
2.81 L/s
Peak I/I Flow 4
2.10 L/s
Peak I/I Rate 5
0.05 L/s/ha
Peak Measured Depth
64.00 mm
Total I/I Flow Volume during event
30,882.70 L
Volumetric Coefficient (Cv%) 6
0.27%
Total Measured Flow Volume during Event
88,456.10 L
Peak I/I Coefficient 7
0.0007
Hourly Wet-Weather Peaking Factor 8
3.30
Instantaneous Wet-Weather Peaking Factor 9
3.99
1
Time of Concentration (Tc): The estimated time for the flow to travel from the furthest point in the upstream area to the point of monitoring, assume flow is travelling at 1.00 m/s Peak Precipitation Intensity Over Tc: The peak rainfall intensity for the duration of the storm with the time interval defined by time of concentration 3 Return Period over Tc: The estimated time to elapse before a storm of equal or greater intensity will likely occur again, based on design storm criteria 4 Peak I/I Flow: The greatest difference captured between measured flow and estimated dry weather flow, Peak I/I Flow = Maximum (Measured Flow – Estimated Dry Weather Flow) 5 Peak I/I Rate: A normalized peak I/I flow based on catchment area size, Peak I/I Rate = Peak I/I Flow / Catchment Area 6 Volumetric Coefficient (Cv%): The ratio of total I/I volume and total rainfall volume, Cv% = Total I/I Flow Volume / Total Precipitation Volume * 100% 7 Peak I/ I Coefficient: The ratio of peak I/I flow and peak rainfall intensity, Peak I/ I Coefficient = Peak I/I Flow / (Peak Rainfall Intensity over Tc * Catchment Area) 8 Hourly Wet‐Weather Peaking Factor: The ratio of peak hourly wet‐weather measured flow and average dry‐weather flow, Wet‐Weather Peaking Factor = Peak Hourly Wet‐Weather Measured Flow / Average Dry-Weather Flow 9 Instantaneous Wet‐Weather Peaking Factor: The ratio of peak wet‐weather measured flow and average dry‐weather flow, Wet‐Weather Peaking Factor = Peak Wet‐Weather Measured Flow / Average Dry-Weather Flow 2
193 Civica Infrastructure Inc. www.civi.ca
Civica Infrastructures Inc. Kawartha Lakes Flow Monitoring Report
Appendix - A June 03, 2024
I/I Analysis Graph Station: B8
194 Civica Infrastructure Inc. www.civi.ca
Civica Infrastructures Inc. Kawartha Lakes Flow Monitoring Report
Appendix - A June 03, 2024
Infiltration/Inflow Event Analysis Station: B8 Apr 28, 2023 08:40 – May 01, 2023 13:35, Total Precipitation: 34.00 mm (13,600,000.00 L) Station Details
Storm Details
Catchment Area
40.00 ha
Total Precipitation
34.00 mm (13,600,000.00 L)
Duration of Storm
52.92 hr
Time of Concentration (Tc) 1
20 min
Peak Precipitation Intensity Over Tc 2
9.00 mm/hr
Return Period over Tc 3
< 2 Yr
Measured Flow
I/I Flow
Time of Peak Measured Flow
Apr 30, 2023 08:50
Time of Peak I/I Flow (TD)
Apr 30, 2023 10:30
Estimated Dry Weather Flow at TD
1.63 L/s
Peak Measured Flow
3.67 L/s
Peak I/I Flow 4
1.93 L/s
Peak I/I Rate 5
0.05 L/s/ha
Peak Measured Depth
72.00 mm
Total I/I Flow Volume during event
67,138.70 L
Volumetric Coefficient (Cv%) 6
0.49%
Total Measured Flow Volume during Event
315,786.80 L
Peak I/I Coefficient 7
0.0019
Hourly Wet-Weather Peaking Factor 8
2.59
Instantaneous Wet-Weather Peaking Factor 9
3.46
1
Time of Concentration (Tc): The estimated time for the flow to travel from the furthest point in the upstream area to the point of monitoring, assume flow is travelling at 1.00 m/s Peak Precipitation Intensity Over Tc: The peak rainfall intensity for the duration of the storm with the time interval defined by time of concentration 3 Return Period over Tc: The estimated time to elapse before a storm of equal or greater intensity will likely occur again, based on design storm criteria 4 Peak I/I Flow: The greatest difference captured between measured flow and estimated dry weather flow, Peak I/I Flow = Maximum (Measured Flow – Estimated Dry Weather Flow) 5 Peak I/I Rate: A normalized peak I/I flow based on catchment area size, Peak I/I Rate = Peak I/I Flow / Catchment Area 6 Volumetric Coefficient (Cv%): The ratio of total I/I volume and total rainfall volume, Cv% = Total I/I Flow Volume / Total Precipitation Volume * 100% 7 Peak I/ I Coefficient: The ratio of peak I/I flow and peak rainfall intensity, Peak I/ I Coefficient = Peak I/I Flow / (Peak Rainfall Intensity over Tc * Catchment Area) 8 Hourly Wet‐Weather Peaking Factor: The ratio of peak hourly wet‐weather measured flow and average dry‐weather flow, Wet‐Weather Peaking Factor = Peak Hourly Wet‐Weather Measured Flow / Average Dry-Weather Flow 9 Instantaneous Wet‐Weather Peaking Factor: The ratio of peak wet‐weather measured flow and average dry‐weather flow, Wet‐Weather Peaking Factor = Peak Wet‐Weather Measured Flow / Average Dry-Weather Flow 2
195 Civica Infrastructure Inc. www.civi.ca
Civica Infrastructures Inc. Kawartha Lakes Flow Monitoring Report
Appendix - A June 03, 2024
I/I Analysis Graph Station: B8
196 Civica Infrastructure Inc. www.civi.ca
Civica Infrastructures Inc. Kawartha Lakes Flow Monitoring Report
Appendix - A June 03, 2024
Infiltration/Inflow Event Analysis Station: B8 May 19, 2023 09:15 – May 21, 2023 03:10, Total Precipitation: 35.00 mm (14,000,000.00 L) Station Details
Storm Details
Catchment Area
40.00 ha
Total Precipitation
35.00 mm (14,000,000.00 L)
Duration of Storm
17.92 hr
Time of Concentration (Tc) 1
20 min
Peak Precipitation Intensity Over Tc 2
7.50 mm/hr
Return Period over Tc 3
< 2 Yr
Measured Flow
I/I Flow
Time of Peak Measured Flow
May 20, 2023 07:25
Time of Peak I/I Flow (TD)
May 20, 2023 07:25
Estimated Dry Weather Flow at TD
1.90 L/s
Peak Measured Flow
4.42 L/s
Peak I/I Flow 4
2.52 L/s
Peak I/I Rate 5
0.06 L/s/ha
Peak Measured Depth
78.00 mm
Total I/I Flow Volume during event
37,186.20 L
Volumetric Coefficient (Cv%) 6
0.27%
Total Measured Flow Volume during Event
146,088.10 L
Peak I/I Coefficient 7
0.0030
Hourly Wet-Weather Peaking Factor 8
2.90
Instantaneous Wet-Weather Peaking Factor 9
4.38
1
Time of Concentration (Tc): The estimated time for the flow to travel from the furthest point in the upstream area to the point of monitoring, assume flow is travelling at 1.00 m/s Peak Precipitation Intensity Over Tc: The peak rainfall intensity for the duration of the storm with the time interval defined by time of concentration 3 Return Period over Tc: The estimated time to elapse before a storm of equal or greater intensity will likely occur again, based on design storm criteria 4 Peak I/I Flow: The greatest difference captured between measured flow and estimated dry weather flow, Peak I/I Flow = Maximum (Measured Flow – Estimated Dry Weather Flow) 5 Peak I/I Rate: A normalized peak I/I flow based on catchment area size, Peak I/I Rate = Peak I/I Flow / Catchment Area 6 Volumetric Coefficient (Cv%): The ratio of total I/I volume and total rainfall volume, Cv% = Total I/I Flow Volume / Total Precipitation Volume * 100% 7 Peak I/ I Coefficient: The ratio of peak I/I flow and peak rainfall intensity, Peak I/ I Coefficient = Peak I/I Flow / (Peak Rainfall Intensity over Tc * Catchment Area) 8 Hourly Wet‐Weather Peaking Factor: The ratio of peak hourly wet‐weather measured flow and average dry‐weather flow, Wet‐Weather Peaking Factor = Peak Hourly Wet‐Weather Measured Flow / Average Dry-Weather Flow 9 Instantaneous Wet‐Weather Peaking Factor: The ratio of peak wet‐weather measured flow and average dry‐weather flow, Wet‐Weather Peaking Factor = Peak Wet‐Weather Measured Flow / Average Dry-Weather Flow 2
197 Civica Infrastructure Inc. www.civi.ca
Civica Infrastructures Inc. Kawartha Lakes Flow Monitoring Report
Appendix - A June 03, 2024
I/I Analysis Graph Station: B8
198 Civica Infrastructure Inc. www.civi.ca
Civica Infrastructures Inc. Kawartha Lakes Flow Monitoring Report
Appendix - A June 03, 2024
Infiltration/Inflow Event Analysis Station: B8 Jun 11, 2023 06:00 – Jun 13, 2023 10:35, Total Precipitation: 51.00 mm (20,400,000.00 L) Station Details
Storm Details
Catchment Area
40.00 ha
Total Precipitation
51.00 mm (20,400,000.00 L)
Duration of Storm
28.58 hr
Time of Concentration (Tc) 1
20 min
Peak Precipitation Intensity Over Tc 2
10.50 mm/hr
Return Period over Tc 3
< 2 Yr
Measured Flow
I/I Flow
Time of Peak Measured Flow
Jun 12, 2023 12:55
Time of Peak I/I Flow (TD)
Jun 12, 2023 12:55
Estimated Dry Weather Flow at TD
1.00 L/s
Peak Measured Flow
3.22 L/s
Peak I/I Flow 4
2.23 L/s
Peak I/I Rate 5
0.06 L/s/ha
Peak Measured Depth
68.00 mm
Total I/I Flow Volume during event
56,559.90 L
Volumetric Coefficient (Cv%) 6
0.28%
Total Measured Flow Volume during Event
204,104.90 L
Peak I/I Coefficient 7
0.0019
Hourly Wet-Weather Peaking Factor 8
2.49
Instantaneous Wet-Weather Peaking Factor 9
3.20
1
Time of Concentration (Tc): The estimated time for the flow to travel from the furthest point in the upstream area to the point of monitoring, assume flow is travelling at 1.00 m/s Peak Precipitation Intensity Over Tc: The peak rainfall intensity for the duration of the storm with the time interval defined by time of concentration 3 Return Period over Tc: The estimated time to elapse before a storm of equal or greater intensity will likely occur again, based on design storm criteria 4 Peak I/I Flow: The greatest difference captured between measured flow and estimated dry weather flow, Peak I/I Flow = Maximum (Measured Flow – Estimated Dry Weather Flow) 5 Peak I/I Rate: A normalized peak I/I flow based on catchment area size, Peak I/I Rate = Peak I/I Flow / Catchment Area 6 Volumetric Coefficient (Cv%): The ratio of total I/I volume and total rainfall volume, Cv% = Total I/I Flow Volume / Total Precipitation Volume * 100% 7 Peak I/ I Coefficient: The ratio of peak I/I flow and peak rainfall intensity, Peak I/ I Coefficient = Peak I/I Flow / (Peak Rainfall Intensity over Tc * Catchment Area) 8 Hourly Wet‐Weather Peaking Factor: The ratio of peak hourly wet‐weather measured flow and average dry‐weather flow, Wet‐Weather Peaking Factor = Peak Hourly Wet‐Weather Measured Flow / Average Dry-Weather Flow 9 Instantaneous Wet‐Weather Peaking Factor: The ratio of peak wet‐weather measured flow and average dry‐weather flow, Wet‐Weather Peaking Factor = Peak Wet‐Weather Measured Flow / Average Dry-Weather Flow 2
199 Civica Infrastructure Inc. www.civi.ca
Civica Infrastructures Inc. Kawartha Lakes Flow Monitoring Report
Appendix - A June 03, 2024
I/I Analysis Graph Station: B8
200 Civica Infrastructure Inc. www.civi.ca
Civica Infrastructures Inc. Kawartha Lakes Flow Monitoring Report
Appendix - A June 03, 2024
Infiltration/Inflow Event Analysis Station: B8 Jun 26, 2023 22:25 – Jun 28, 2023 09:05, Total Precipitation: 15.25 mm (6,100,000.00 L) Station Details
Storm Details
Catchment Area
40.00 ha
Total Precipitation
15.25 mm (6,100,000.00 L)
Duration of Storm
10.67 hr
Time of Concentration (Tc) 1
20 min
Peak Precipitation Intensity Over Tc 2
12.00 mm/hr
Return Period over Tc 3
< 2 Yr
Measured Flow
I/I Flow
Time of Peak Measured Flow
Jun 28, 2023 08:05
Time of Peak I/I Flow (TD)
Jun 27, 2023 12:45
Estimated Dry Weather Flow at TD
1.17 L/s
Peak Measured Flow
2.61 L/s
Peak I/I Flow 4
0.90 L/s
Peak I/I Rate 5
0.02 L/s/ha
Peak Measured Depth
62.00 mm
Total I/I Flow Volume during event
10,065.90 L
Volumetric Coefficient (Cv%) 6
0.17%
Total Measured Flow Volume during Event
89,040.50 L
Peak I/I Coefficient 7
0.0007
Hourly Wet-Weather Peaking Factor 8
2.11
Instantaneous Wet-Weather Peaking Factor 9
2.71
1
Time of Concentration (Tc): The estimated time for the flow to travel from the furthest point in the upstream area to the point of monitoring, assume flow is travelling at 1.00 m/s Peak Precipitation Intensity Over Tc: The peak rainfall intensity for the duration of the storm with the time interval defined by time of concentration 3 Return Period over Tc: The estimated time to elapse before a storm of equal or greater intensity will likely occur again, based on design storm criteria 4 Peak I/I Flow: The greatest difference captured between measured flow and estimated dry weather flow, Peak I/I Flow = Maximum (Measured Flow – Estimated Dry Weather Flow) 5 Peak I/I Rate: A normalized peak I/I flow based on catchment area size, Peak I/I Rate = Peak I/I Flow / Catchment Area 6 Volumetric Coefficient (Cv%): The ratio of total I/I volume and total rainfall volume, Cv% = Total I/I Flow Volume / Total Precipitation Volume * 100% 7 Peak I/ I Coefficient: The ratio of peak I/I flow and peak rainfall intensity, Peak I/ I Coefficient = Peak I/I Flow / (Peak Rainfall Intensity over Tc * Catchment Area) 8 Hourly Wet‐Weather Peaking Factor: The ratio of peak hourly wet‐weather measured flow and average dry‐weather flow, Wet‐Weather Peaking Factor = Peak Hourly Wet‐Weather Measured Flow / Average Dry-Weather Flow 9 Instantaneous Wet‐Weather Peaking Factor: The ratio of peak wet‐weather measured flow and average dry‐weather flow, Wet‐Weather Peaking Factor = Peak Wet‐Weather Measured Flow / Average Dry-Weather Flow 2
201 Civica Infrastructure Inc. www.civi.ca
Civica Infrastructures Inc. Kawartha Lakes Flow Monitoring Report
Appendix - A June 03, 2024
I/I Analysis Graph Station: B8
202 Civica Infrastructure Inc. www.civi.ca
Civica Infrastructures Inc. Kawartha Lakes Flow Monitoring Report
Appendix - A June 03, 2024
Infiltration/Inflow Event Analysis Station: B8 Jul 12, 2023 14:55 – Jul 13, 2023 19:00, Total Precipitation: 16.25 mm (6,500,000.00 L) Station Details
Storm Details
Catchment Area
40.00 ha
Total Precipitation
16.25 mm (6,500,000.00 L)
Duration of Storm
4.08 hr
Time of Concentration (Tc) 1
20 min
Peak Precipitation Intensity Over Tc 2
8.20 mm/hr
Return Period over Tc 3
< 2 Yr
Measured Flow
I/I Flow
Time of Peak Measured Flow
Jul 13, 2023 10:05
Time of Peak I/I Flow (TD)
Jul 13, 2023 10:05
Estimated Dry Weather Flow at TD
1.55 L/s
Peak Measured Flow
3.33 L/s
Peak I/I Flow 4
1.78 L/s
Peak I/I Rate 5
0.05 L/s/ha
Peak Measured Depth
69.00 mm
Total I/I Flow Volume during event
9,471.50 L
Volumetric Coefficient (Cv%) 6
0.15%
Total Measured Flow Volume during Event
74,727.20 L
Peak I/I Coefficient 7
0.0019
Hourly Wet-Weather Peaking Factor 8
1.81
Instantaneous Wet-Weather Peaking Factor 9
2.97
1
Time of Concentration (Tc): The estimated time for the flow to travel from the furthest point in the upstream area to the point of monitoring, assume flow is travelling at 1.00 m/s Peak Precipitation Intensity Over Tc: The peak rainfall intensity for the duration of the storm with the time interval defined by time of concentration 3 Return Period over Tc: The estimated time to elapse before a storm of equal or greater intensity will likely occur again, based on design storm criteria 4 Peak I/I Flow: The greatest difference captured between measured flow and estimated dry weather flow, Peak I/I Flow = Maximum (Measured Flow – Estimated Dry Weather Flow) 5 Peak I/I Rate: A normalized peak I/I flow based on catchment area size, Peak I/I Rate = Peak I/I Flow / Catchment Area 6 Volumetric Coefficient (Cv%): The ratio of total I/I volume and total rainfall volume, Cv% = Total I/I Flow Volume / Total Precipitation Volume * 100% 7 Peak I/ I Coefficient: The ratio of peak I/I flow and peak rainfall intensity, Peak I/ I Coefficient = Peak I/I Flow / (Peak Rainfall Intensity over Tc * Catchment Area) 8 Hourly Wet‐Weather Peaking Factor: The ratio of peak hourly wet‐weather measured flow and average dry‐weather flow, Wet‐Weather Peaking Factor = Peak Hourly Wet‐Weather Measured Flow / Average Dry-Weather Flow 9 Instantaneous Wet‐Weather Peaking Factor: The ratio of peak wet‐weather measured flow and average dry‐weather flow, Wet‐Weather Peaking Factor = Peak Wet‐Weather Measured Flow / Average Dry-Weather Flow 2
203 Civica Infrastructure Inc. www.civi.ca
Civica Infrastructures Inc. Kawartha Lakes Flow Monitoring Report
Appendix - A June 03, 2024
I/I Analysis Graph Station: B8
204 Civica Infrastructure Inc. www.civi.ca
Civica Infrastructures Inc. Kawartha Lakes Flow Monitoring Report
Appendix - A June 03, 2024
Infiltration/Inflow Event Analysis Station: B8 Jul 20, 2023 07:25 – Jul 22, 2023 02:10, Total Precipitation: 17.50 mm (7,000,000.00 L) Station Details
Storm Details
Catchment Area
40.00 ha
Total Precipitation
17.50 mm (7,000,000.00 L)
Duration of Storm
18.75 hr
Time of Concentration (Tc) 1
20 min
Peak Precipitation Intensity Over Tc 2
9.80 mm/hr
Return Period over Tc 3
< 2 Yr
Measured Flow
I/I Flow
Time of Peak Measured Flow
Jul 20, 2023 19:20
Time of Peak I/I Flow (TD)
Jul 20, 2023 22:30
Estimated Dry Weather Flow at TD
0.90 L/s
Peak Measured Flow
2.71 L/s
Peak I/I Flow 4
1.35 L/s
Peak I/I Rate 5
0.03 L/s/ha
Peak Measured Depth
82.00 mm
Total I/I Flow Volume during event
12,882.40 L
Volumetric Coefficient (Cv%) 6
0.18%
Total Measured Flow Volume during Event
114,102.00 L
Peak I/I Coefficient 7
0.0013
Hourly Wet-Weather Peaking Factor 8
2.71
Instantaneous Wet-Weather Peaking Factor 9
2.97
1
Time of Concentration (Tc): The estimated time for the flow to travel from the furthest point in the upstream area to the point of monitoring, assume flow is travelling at 1.00 m/s Peak Precipitation Intensity Over Tc: The peak rainfall intensity for the duration of the storm with the time interval defined by time of concentration 3 Return Period over Tc: The estimated time to elapse before a storm of equal or greater intensity will likely occur again, based on design storm criteria 4 Peak I/I Flow: The greatest difference captured between measured flow and estimated dry weather flow, Peak I/I Flow = Maximum (Measured Flow – Estimated Dry Weather Flow) 5 Peak I/I Rate: A normalized peak I/I flow based on catchment area size, Peak I/I Rate = Peak I/I Flow / Catchment Area 6 Volumetric Coefficient (Cv%): The ratio of total I/I volume and total rainfall volume, Cv% = Total I/I Flow Volume / Total Precipitation Volume * 100% 7 Peak I/ I Coefficient: The ratio of peak I/I flow and peak rainfall intensity, Peak I/ I Coefficient = Peak I/I Flow / (Peak Rainfall Intensity over Tc * Catchment Area) 8 Hourly Wet‐Weather Peaking Factor: The ratio of peak hourly wet‐weather measured flow and average dry‐weather flow, Wet‐Weather Peaking Factor = Peak Hourly Wet‐Weather Measured Flow / Average Dry-Weather Flow 9 Instantaneous Wet‐Weather Peaking Factor: The ratio of peak wet‐weather measured flow and average dry‐weather flow, Wet‐Weather Peaking Factor = Peak Wet‐Weather Measured Flow / Average Dry-Weather Flow 2
205 Civica Infrastructure Inc. www.civi.ca
Civica Infrastructures Inc. Kawartha Lakes Flow Monitoring Report
Appendix - A June 03, 2024
I/I Analysis Graph Station: B8
206 Civica Infrastructure Inc. www.civi.ca
Civica Infrastructures Inc. Kawartha Lakes Flow Monitoring Report
Appendix - A June 03, 2024
Infiltration/Inflow Event Analysis Station: B8 Jul 28, 2023 20:30 – Jul 29, 2023 23:55, Total Precipitation: 16.50 mm (6,600,000.00 L) Station Details
Storm Details
Catchment Area
40.00 ha
Total Precipitation
16.50 mm (6,600,000.00 L)
Duration of Storm
3.42 hr
Time of Concentration (Tc) 1
20 min
Peak Precipitation Intensity Over Tc 2
18.00 mm/hr
Return Period over Tc 3
< 2 Yr
Measured Flow
I/I Flow
Time of Peak Measured Flow
Jul 29, 2023 11:10
Time of Peak I/I Flow (TD)
Jul 29, 2023 11:10
Estimated Dry Weather Flow at TD
1.94 L/s
Peak Measured Flow
3.91 L/s
Peak I/I Flow 4
1.97 L/s
Peak I/I Rate 5
0.05 L/s/ha
Peak Measured Depth
74.00 mm
Total I/I Flow Volume during event
8,795.90 L
Volumetric Coefficient (Cv%) 6
0.13%
Total Measured Flow Volume during Event
83,032.40 L
Peak I/I Coefficient 7
0.0010
Hourly Wet-Weather Peaking Factor 8
1.72
Instantaneous Wet-Weather Peaking Factor 9
2.94
1
Time of Concentration (Tc): The estimated time for the flow to travel from the furthest point in the upstream area to the point of monitoring, assume flow is travelling at 1.00 m/s Peak Precipitation Intensity Over Tc: The peak rainfall intensity for the duration of the storm with the time interval defined by time of concentration 3 Return Period over Tc: The estimated time to elapse before a storm of equal or greater intensity will likely occur again, based on design storm criteria 4 Peak I/I Flow: The greatest difference captured between measured flow and estimated dry weather flow, Peak I/I Flow = Maximum (Measured Flow – Estimated Dry Weather Flow) 5 Peak I/I Rate: A normalized peak I/I flow based on catchment area size, Peak I/I Rate = Peak I/I Flow / Catchment Area 6 Volumetric Coefficient (Cv%): The ratio of total I/I volume and total rainfall volume, Cv% = Total I/I Flow Volume / Total Precipitation Volume * 100% 7 Peak I/ I Coefficient: The ratio of peak I/I flow and peak rainfall intensity, Peak I/ I Coefficient = Peak I/I Flow / (Peak Rainfall Intensity over Tc * Catchment Area) 8 Hourly Wet‐Weather Peaking Factor: The ratio of peak hourly wet‐weather measured flow and average dry‐weather flow, Wet‐Weather Peaking Factor = Peak Hourly Wet‐Weather Measured Flow / Average Dry-Weather Flow 9 Instantaneous Wet‐Weather Peaking Factor: The ratio of peak wet‐weather measured flow and average dry‐weather flow, Wet‐Weather Peaking Factor = Peak Wet‐Weather Measured Flow / Average Dry-Weather Flow 2
207 Civica Infrastructure Inc. www.civi.ca
Civica Infrastructures Inc. Kawartha Lakes Flow Monitoring Report
Appendix - A June 03, 2024
I/I Analysis Graph Station: B8
208 Civica Infrastructure Inc. www.civi.ca
Civica Infrastructures Inc. Kawartha Lakes Flow Monitoring Report
Appendix - A June 03, 2024
Infiltration/Inflow Event Analysis Station: B8 Aug 11, 2023 21:30 – Aug 13, 2023 23:05, Total Precipitation: 15.00 mm (6,000,000.00 L) Station Details
Storm Details
Catchment Area
40.00 ha
Total Precipitation
15.00 mm (6,000,000.00 L)
Duration of Storm
25.58 hr
Time of Concentration (Tc) 1
20 min
Peak Precipitation Intensity Over Tc 2
33.00 mm/hr
Return Period over Tc 3
< 2 Yr
Measured Flow
I/I Flow
Time of Peak Measured Flow
Aug 12, 2023 11:20
Time of Peak I/I Flow (TD)
Aug 12, 2023 11:20
Estimated Dry Weather Flow at TD
1.91 L/s
Peak Measured Flow
4.16 L/s
Peak I/I Flow 4
2.25 L/s
Peak I/I Rate 5
0.06 L/s/ha
Peak Measured Depth
76.00 mm
Total I/I Flow Volume during event
20,612.50 L
Volumetric Coefficient (Cv%) 6
0.34%
Total Measured Flow Volume during Event
187,601.00 L
Peak I/I Coefficient 7
0.0006
Hourly Wet-Weather Peaking Factor 8
2.18
Instantaneous Wet-Weather Peaking Factor 9
3.38
1
Time of Concentration (Tc): The estimated time for the flow to travel from the furthest point in the upstream area to the point of monitoring, assume flow is travelling at 1.00 m/s Peak Precipitation Intensity Over Tc: The peak rainfall intensity for the duration of the storm with the time interval defined by time of concentration 3 Return Period over Tc: The estimated time to elapse before a storm of equal or greater intensity will likely occur again, based on design storm criteria 4 Peak I/I Flow: The greatest difference captured between measured flow and estimated dry weather flow, Peak I/I Flow = Maximum (Measured Flow – Estimated Dry Weather Flow) 5 Peak I/I Rate: A normalized peak I/I flow based on catchment area size, Peak I/I Rate = Peak I/I Flow / Catchment Area 6 Volumetric Coefficient (Cv%): The ratio of total I/I volume and total rainfall volume, Cv% = Total I/I Flow Volume / Total Precipitation Volume * 100% 7 Peak I/ I Coefficient: The ratio of peak I/I flow and peak rainfall intensity, Peak I/ I Coefficient = Peak I/I Flow / (Peak Rainfall Intensity over Tc * Catchment Area) 8 Hourly Wet‐Weather Peaking Factor: The ratio of peak hourly wet‐weather measured flow and average dry‐weather flow, Wet‐Weather Peaking Factor = Peak Hourly Wet‐Weather Measured Flow / Average Dry-Weather Flow 9 Instantaneous Wet‐Weather Peaking Factor: The ratio of peak wet‐weather measured flow and average dry‐weather flow, Wet‐Weather Peaking Factor = Peak Wet‐Weather Measured Flow / Average Dry-Weather Flow 2
209 Civica Infrastructure Inc. www.civi.ca
Civica Infrastructures Inc. Kawartha Lakes Flow Monitoring Report
Appendix - A June 03, 2024
I/I Analysis Graph Station: B8
210 Civica Infrastructure Inc. www.civi.ca
Civica Infrastructures Inc. Kawartha Lakes Flow Monitoring Report
Appendix - A June 03, 2024
Infiltration/Inflow Event Analysis Station: B8 Oct 05, 2023 08:40 – Oct 07, 2023 19:20, Total Precipitation: 35.75 mm (14,300,000.00 L) Station Details
Storm Details
Catchment Area
40.00 ha
Total Precipitation
35.75 mm (14,300,000.00 L)
Duration of Storm
34.67 hr
Time of Concentration (Tc) 1
20 min
Peak Precipitation Intensity Over Tc 2
22.50 mm/hr
Return Period over Tc 3
< 2 Yr
Measured Flow
I/I Flow
Time of Peak Measured Flow
Oct 06, 2023 00:55
Time of Peak I/I Flow (TD)
Oct 06, 2023 00:55
Estimated Dry Weather Flow at TD
0.39 L/s
Peak Measured Flow
15.96 L/s
Peak I/I Flow 4
15.57 L/s
Peak I/I Rate 5
0.39 L/s/ha
Peak Measured Depth
134.00 mm
Total I/I Flow Volume during event
63,473.90 L
Volumetric Coefficient (Cv%) 6
0.44%
Total Measured Flow Volume during Event
236,435.60 L
Peak I/I Coefficient 7
0.0062
Hourly Wet-Weather Peaking Factor 8
5.37
Instantaneous Wet-Weather Peaking Factor 9
15.53
1
Time of Concentration (Tc): The estimated time for the flow to travel from the furthest point in the upstream area to the point of monitoring, assume flow is travelling at 1.00 m/s Peak Precipitation Intensity Over Tc: The peak rainfall intensity for the duration of the storm with the time interval defined by time of concentration 3 Return Period over Tc: The estimated time to elapse before a storm of equal or greater intensity will likely occur again, based on design storm criteria 4 Peak I/I Flow: The greatest difference captured between measured flow and estimated dry weather flow, Peak I/I Flow = Maximum (Measured Flow – Estimated Dry Weather Flow) 5 Peak I/I Rate: A normalized peak I/I flow based on catchment area size, Peak I/I Rate = Peak I/I Flow / Catchment Area 6 Volumetric Coefficient (Cv%): The ratio of total I/I volume and total rainfall volume, Cv% = Total I/I Flow Volume / Total Precipitation Volume * 100% 7 Peak I/ I Coefficient: The ratio of peak I/I flow and peak rainfall intensity, Peak I/ I Coefficient = Peak I/I Flow / (Peak Rainfall Intensity over Tc * Catchment Area) 8 Hourly Wet‐Weather Peaking Factor: The ratio of peak hourly wet‐weather measured flow and average dry‐weather flow, Wet‐Weather Peaking Factor = Peak Hourly Wet‐Weather Measured Flow / Average Dry-Weather Flow 9 Instantaneous Wet‐Weather Peaking Factor: The ratio of peak wet‐weather measured flow and average dry‐weather flow, Wet‐Weather Peaking Factor = Peak Wet‐Weather Measured Flow / Average Dry-Weather Flow 2
211 Civica Infrastructure Inc. www.civi.ca
Civica Infrastructures Inc. Kawartha Lakes Flow Monitoring Report
Appendix - A June 03, 2024
I/I Analysis Graph Station: B8
212 Civica Infrastructure Inc. www.civi.ca
Civica Infrastructures Inc. Kawartha Lakes Flow Monitoring Report
Appendix - A June 03, 2024
Infiltration/Inflow Event Analysis Station: B8 Oct 08, 2023 02:50 – Oct 12, 2023 11:55, Total Precipitation: 28.75 mm (11,500,000.00 L) Station Details
Storm Details
Catchment Area
40.00 ha
Total Precipitation
28.75 mm (11,500,000.00 L)
Duration of Storm
81.08 hr
Time of Concentration (Tc) 1
20 min
Peak Precipitation Intensity Over Tc 2
3.80 mm/hr
Return Period over Tc 3
< 2 Yr
Measured Flow
I/I Flow
Time of Peak Measured Flow
Oct 10, 2023 08:40
Time of Peak I/I Flow (TD)
Oct 10, 2023 08:40
Estimated Dry Weather Flow at TD
1.74 L/s
Peak Measured Flow
3.79 L/s
Peak I/I Flow 4
2.06 L/s
Peak I/I Rate 5
0.05 L/s/ha
Peak Measured Depth
75.00 mm
Total I/I Flow Volume during event
82,786.00 L
Volumetric Coefficient (Cv%) 6
0.72%
Total Measured Flow Volume during Event
404,220.80 L
Peak I/I Coefficient 7
0.0049
Hourly Wet-Weather Peaking Factor 8
2.58
Instantaneous Wet-Weather Peaking Factor 9
3.96
1
Time of Concentration (Tc): The estimated time for the flow to travel from the furthest point in the upstream area to the point of monitoring, assume flow is travelling at 1.00 m/s Peak Precipitation Intensity Over Tc: The peak rainfall intensity for the duration of the storm with the time interval defined by time of concentration 3 Return Period over Tc: The estimated time to elapse before a storm of equal or greater intensity will likely occur again, based on design storm criteria 4 Peak I/I Flow: The greatest difference captured between measured flow and estimated dry weather flow, Peak I/I Flow = Maximum (Measured Flow – Estimated Dry Weather Flow) 5 Peak I/I Rate: A normalized peak I/I flow based on catchment area size, Peak I/I Rate = Peak I/I Flow / Catchment Area 6 Volumetric Coefficient (Cv%): The ratio of total I/I volume and total rainfall volume, Cv% = Total I/I Flow Volume / Total Precipitation Volume * 100% 7 Peak I/ I Coefficient: The ratio of peak I/I flow and peak rainfall intensity, Peak I/ I Coefficient = Peak I/I Flow / (Peak Rainfall Intensity over Tc * Catchment Area) 8 Hourly Wet‐Weather Peaking Factor: The ratio of peak hourly wet‐weather measured flow and average dry‐weather flow, Wet‐Weather Peaking Factor = Peak Hourly Wet‐Weather Measured Flow / Average Dry-Weather Flow 9 Instantaneous Wet‐Weather Peaking Factor: The ratio of peak wet‐weather measured flow and average dry‐weather flow, Wet‐Weather Peaking Factor = Peak Wet‐Weather Measured Flow / Average Dry-Weather Flow 2
213 Civica Infrastructure Inc. www.civi.ca
Civica Infrastructures Inc. Kawartha Lakes Flow Monitoring Report
Appendix - A June 03, 2024
Activity Log Station: B8 Date Time
Type
Purpose of Visit
Comment
15-Feb-2023 12:26:00 PM
Installation Log
install
15-Feb-2023 12:26:00 PM
Installation Log
install
22-Feb-2023 08:09:00 AM
Maintenance Log
Data Download
DATA DOWNLOADED, TELEMETRY SENT.
No
Yes
INSTALLED OUTLET FLUME WITH CSO. OFF ROAD BY PUMPING STATION, PARK BESIDE. TWO INLETS, ONE IS RAISED. PHOTOS AND MEASUREMENTS TAKEN. TELEMETRY SENT. INSTALLED OUTLET FLUME WITH CSO. OFF ROAD BY PUMPING STATION, PARK BESIDE. TWO INLETS, ONE IS RAISED. PHOTOS AND MEASUREMENTS TAKEN. TELEMETRY SENT.
Calibration Measurement Yes Yes
14-Mar-2023 05:30:00 PM
Maintenance Log
CALIBRATION
DATA DOWNLOADED, TELEMETRY SENT AND CHECKED, ENTRY MADE, SITE CALIBRATED, PHOTO AND VIDEO TAKEN UNABLE TO CHECKED BATTERY
03-Apr-2023 10:52:00 AM
Maintenance Log
CALIBRATION
DATA DOWNLOADED, PHOTOS TAKEN, TELEMETRY SENT
Yes
19-Apr-2023 12:15:00 PM
Maintenance Log
CALIBRATION
C SET,SURVEY SENT,DATA DOWNLOADED, TELEMETRY SENT AND CHECKED, DEBRIS CLEARED (RAGGINGS AND DEBRIS), PHOTOS AND VIDEOS TAKEN, SITE CALIBRATED,ANTENNA CHECKED,BATTERY CHECKED,SITE CLEARED,
Yes
10-May-2023 10:39:00 AM
Maintenance Log
CALIBRATION
TC SET,SURVEY SENT,DOWNLOADED DATA, SENT TELEMETRY, MADE ENTRY, TOOK PHOTOS/VIDEOS, TOOK MEASUREMENTS,DEBRIS AND SILT CLEARED, CALIBRATED SITE,SITE CLEARED
Yes
Yes
22-Jun-2023 03:45:00 PM
Maintenance Log
CALIBRATION
DATA DOWNLOADED, TELEMETRY SENT ENTRY MADE PHOTOS/VIDEOS TAKEN, MEASUREMENTS TAKEN, SITE CALIBRATED
22-Aug-2023 02:00:00 PM
Maintenance Log
DATA DOWNLOAD
TC SET,DATA DOWNLOADED,TELEMETRY SENT,ANTENNA CHECKED,SITE CLEARED
Yes
24-Oct-2023 11:45:00 AM
Removal Log
REMOVAL
SET UP CS/TC, DOWNLOAD DATA, SENT TELEMETRY, TOOK MEASUREMENTS, CALIBRATED SITE, REMOVED ALL EQUIPMENT, REMOVAL COMPLETE, PMAC: 8358, NO INTERNAL BATTERY CHANNEL APPEARED ON PMAC LITE FOR THIS LOGGER
Yes
214 Civica Infrastructure Inc. www.civi.ca
Civica Infrastructures Inc. Kawartha Lakes Flow Monitoring Report
Appendix - A June 03, 2024
Aggregate Data Station: B9
Precipitation Date From
Date To
Days
Min (mm)
Avg (mm)
Max (mm)
Sum (mm)
Count
Time of Min1
Time of Max1
Jan 24, 2023
Oct 24, 2023
274
0.00
0.01
5.00
634.00
78,485
Tue Jan 24, 2023 14:30
Fri Oct 06, 2023 18:10
Level Date From
Date To
Days
Min (m)
Avg (m)
Max (m)
Count
Time of Min1
Time of Max1
Jan 24, 2023
Oct 24, 2023
274
0.00
0.03
0.07
78,587
Fri Jul 14, 2023 12:00
Fri Jul 21, 2023 07:35
Flow
1
Date From
Date To
Days
Min (L/s)
Avg (L/s)
Max (L/s)
Total Volume (1,000,000 L)
Count
Time of Min1
Time of Max1
Jan 24, 2023
Oct 24, 2023
274
0.01
0.47
3.97
11.17
78,587
Fri Jul 14, 2023 12:00
Fri Jul 21, 2023 07:35
Time of Min and Time of Max will be displayed by first occurrence
215 Civica Infrastructure Inc. www.civi.ca
Civica Infrastructures Inc. Kawartha Lakes Flow Monitoring Report
Appendix - A June 03, 2024
Data Chart Station: B9 Jan 24, 2023 – Jan 31, 2023
216 Civica Infrastructure Inc. www.civi.ca
Civica Infrastructures Inc. Kawartha Lakes Flow Monitoring Report
Appendix - A June 03, 2024
Data Chart Station: B9 Feb 01, 2023 – Feb 28, 2023
217 Civica Infrastructure Inc. www.civi.ca
Civica Infrastructures Inc. Kawartha Lakes Flow Monitoring Report
Appendix - A June 03, 2024
Data Chart Station: B9 Mar 01, 2023 – Mar 31, 2023
218 Civica Infrastructure Inc. www.civi.ca
Civica Infrastructures Inc. Kawartha Lakes Flow Monitoring Report
Appendix - A June 03, 2024
Data Chart Station: B9 Apr 01, 2023 – Apr 30, 2023
219 Civica Infrastructure Inc. www.civi.ca
Civica Infrastructures Inc. Kawartha Lakes Flow Monitoring Report
Appendix - A June 03, 2024
Data Chart Station: B9 May 01, 2023 – May 31, 2023
220 Civica Infrastructure Inc. www.civi.ca
Civica Infrastructures Inc. Kawartha Lakes Flow Monitoring Report
Appendix - A June 03, 2024
Data Chart Station: B9 Jun 01, 2023 – Jun 30, 2023
221 Civica Infrastructure Inc. www.civi.ca
Civica Infrastructures Inc. Kawartha Lakes Flow Monitoring Report
Appendix - A June 03, 2024
Data Chart Station: B9 Jul 01, 2023 – Jul 31, 2023
222 Civica Infrastructure Inc. www.civi.ca
Civica Infrastructures Inc. Kawartha Lakes Flow Monitoring Report
Appendix - A June 03, 2024
Data Chart Station: B9 Aug 01, 2023 – Aug 31, 2023
223 Civica Infrastructure Inc. www.civi.ca
Civica Infrastructures Inc. Kawartha Lakes Flow Monitoring Report
Appendix - A June 03, 2024
Data Chart Station: B9 Sep 01, 2023 – Sep 30, 2023
224 Civica Infrastructure Inc. www.civi.ca
Civica Infrastructures Inc. Kawartha Lakes Flow Monitoring Report
Appendix - A June 03, 2024
Data Chart Station: B9 Oct 01, 2023 – Oct 24, 2023
225 Civica Infrastructure Inc. www.civi.ca
Civica Infrastructures Inc. Kawartha Lakes Flow Monitoring Report
Appendix - A June 03, 2024
Sanitary Report Station: B9
1
Average Dry Weather Flow (L/s)
Average Dry Weather Flow (L/c/d)
Average Daily Minimum Dry Weather Flow (L/s)
Average Daily Peak Dry Weather Flow (L/s)
0.436
400.917
0.112
1.619
Peaking Factor
Groundwater Infiltration (L/s)1
Groundwater Infiltration (L/ha/d)
% of GWI in Average DWF
3.711
0.095
260.416
21.836
Groundwater infiltration (GWI) is assumed as 85% of the daily minimum flow averaged over the monitoring period
226 Civica Infrastructure Inc. www.civi.ca
Civica Infrastructures Inc. Kawartha Lakes Flow Monitoring Report
Appendix - A June 03, 2024
I/I Analysis Table
1
Event1
Total Precipitation (mm)
Duration (hours)
Peak Intensity Over Tc at Station (mm/hr)
Feb 09, 2023
39.75
14.42
Mar 16, 2023
19.50
Mar 31, 2023
B9 Measured Peak Flow (L/s)
Peak I/I Flow (L/s)
Peak I/I Rate (L/s/ha)
Volumetric Runoff Coefficient (CV%)
Peaking Factor (PF)
13.00
1.87
1.33
0.04
0.12 %
3.71
12.75
4.00
1.95
1.36
0.04
0.41 %
3.21
22.00
16.50
8.00
1.71
1.19
0.04
0.17 %
2.83
Apr 05, 2023
28.75
10.67
33.00
1.79
0.98
0.03
0.08 %
2.23
Apr 28, 2023
34.00
52.92
10.00
1.79
1.34
0.04
0.16 %
3.57
May 19, 2023
35.00
17.92
9.00
1.23
0.81
0.03
0.10 %
2.40
Jun 11, 2023
51.00
28.58
13.00
2.03
1.62
0.05
0.08 %
4.23
Jun 27, 2023
15.25
10.67
15.00
1.56
0.89
0.03
0.17 %
2.35
Jul 13, 2023
16.25
4.08
10.00
1.79
1.15
0.04
0.12 %
2.61
Jul 20, 2023
17.50
18.75
11.00
3.97
3.41
0.11
0.24 %
10.17
Jul 29, 2023
16.50
3.42
20.00
1.17
0.93
0.03
0.14 %
2.52
Aug 12, 2023
15.00
25.58
39.00
1.95
1.35
0.04
0.62 %
3.63
Oct 05, 2023
35.75
34.67
27.00
1.71
1.16
0.04
0.15 %
3.46
Oct 08, 2023
28.75
81.08
4.00
1.95
1.30
0.04
0.29 %
4.04
Average
26.79
23.72
15.43
1.89
1.34
0.04
0.20 %
3.64
Maximum
51.00
81.08
39.00
3.97
3.41
0.11
0.62 %
10.17
Flow KPIs
Measured Storms
Station: B9
An event is a storm with a minimum volume of 15mm and a minimum inter-event dry period of 12 hours
227 Civica Infrastructure Inc. www.civi.ca
Civica Infrastructures Inc. Kawartha Lakes Flow Monitoring Report
Appendix - A June 03, 2024
I/I Analysis Graph Station: B9
228 Civica Infrastructure Inc. www.civi.ca
Civica Infrastructures Inc. Kawartha Lakes Flow Monitoring Report
Appendix - A June 03, 2024
Infiltration/Inflow Event Analysis Station: B9 Feb 08, 2023 21:00 – Feb 10, 2023 11:25, Total Precipitation: 39.75 mm (12,561,000.00 L) Station Details
Storm Details
Catchment Area
31.60 ha
Total Precipitation
39.75 mm (12,561,000.00 L)
Duration of Storm
14.42 hr
Time of Concentration (Tc) 1
15 min
Peak Precipitation Intensity Over Tc 2
13.00 mm/hr
Return Period over Tc 3
< 2 Yr
Measured Flow
I/I Flow
Time of Peak Measured Flow
Feb 09, 2023 16:00
Time of Peak I/I Flow (TD)
Feb 09, 2023 16:00
Estimated Dry Weather Flow at TD
0.53 L/s
Peak Measured Flow
1.87 L/s
Peak I/I Flow 4
1.33 L/s
Peak I/I Rate 5
0.04 L/s/ha
Peak Measured Depth
51.70 mm
Total I/I Flow Volume during event
14,881.00 L
Volumetric Coefficient (Cv%) 6
0.12%
Total Measured Flow Volume during Event
49,145.20 L
Peak I/I Coefficient 7
0.0012
Hourly Wet-Weather Peaking Factor 8
2.68
Instantaneous Wet-Weather Peaking Factor 9
5.19
1
Time of Concentration (Tc): The estimated time for the flow to travel from the furthest point in the upstream area to the point of monitoring, assume flow is travelling at 1.00 m/s Peak Precipitation Intensity Over Tc: The peak rainfall intensity for the duration of the storm with the time interval defined by time of concentration 3 Return Period over Tc: The estimated time to elapse before a storm of equal or greater intensity will likely occur again, based on design storm criteria 4 Peak I/I Flow: The greatest difference captured between measured flow and estimated dry weather flow, Peak I/I Flow = Maximum (Measured Flow – Estimated Dry Weather Flow) 5 Peak I/I Rate: A normalized peak I/I flow based on catchment area size, Peak I/I Rate = Peak I/I Flow / Catchment Area 6 Volumetric Coefficient (Cv%): The ratio of total I/I volume and total rainfall volume, Cv% = Total I/I Flow Volume / Total Precipitation Volume * 100% 7 Peak I/ I Coefficient: The ratio of peak I/I flow and peak rainfall intensity, Peak I/ I Coefficient = Peak I/I Flow / (Peak Rainfall Intensity over Tc * Catchment Area) 8 Hourly Wet‐Weather Peaking Factor: The ratio of peak hourly wet‐weather measured flow and average dry‐weather flow, Wet‐Weather Peaking Factor = Peak Hourly Wet‐Weather Measured Flow / Average Dry-Weather Flow 9 Instantaneous Wet‐Weather Peaking Factor: The ratio of peak wet‐weather measured flow and average dry‐weather flow, Wet‐Weather Peaking Factor = Peak Wet‐Weather Measured Flow / Average Dry-Weather Flow 2
229 Civica Infrastructure Inc. www.civi.ca
Civica Infrastructures Inc. Kawartha Lakes Flow Monitoring Report
Appendix - A June 03, 2024
I/I Analysis Graph Station: B9
230 Civica Infrastructure Inc. www.civi.ca
Civica Infrastructures Inc. Kawartha Lakes Flow Monitoring Report
Appendix - A June 03, 2024
Infiltration/Inflow Event Analysis Station: B9 Mar 16, 2023 11:05 – Mar 17, 2023 23:50, Total Precipitation: 19.50 mm (6,162,000.00 L) Station Details
Storm Details
Catchment Area
31.60 ha
Total Precipitation
19.50 mm (6,162,000.00 L)
Duration of Storm
12.75 hr
Time of Concentration (Tc) 1
15 min
Peak Precipitation Intensity Over Tc 2
4.00 mm/hr
Return Period over Tc 3
< 2 Yr
Measured Flow
I/I Flow
Time of Peak Measured Flow
Mar 17, 2023 06:00
Time of Peak I/I Flow (TD)
Mar 17, 2023 06:00
Estimated Dry Weather Flow at TD
0.59 L/s
Peak Measured Flow
1.95 L/s
Peak I/I Flow 4
1.36 L/s
Peak I/I Rate 5
0.04 L/s/ha
Peak Measured Depth
52.70 mm
Total I/I Flow Volume during event
25,284.80 L
Volumetric Coefficient (Cv%) 6
0.41%
Total Measured Flow Volume during Event
63,043.30 L
Peak I/I Coefficient 7
0.0039
Hourly Wet-Weather Peaking Factor 8
2.97
Instantaneous Wet-Weather Peaking Factor 9
4.61
1
Time of Concentration (Tc): The estimated time for the flow to travel from the furthest point in the upstream area to the point of monitoring, assume flow is travelling at 1.00 m/s Peak Precipitation Intensity Over Tc: The peak rainfall intensity for the duration of the storm with the time interval defined by time of concentration 3 Return Period over Tc: The estimated time to elapse before a storm of equal or greater intensity will likely occur again, based on design storm criteria 4 Peak I/I Flow: The greatest difference captured between measured flow and estimated dry weather flow, Peak I/I Flow = Maximum (Measured Flow – Estimated Dry Weather Flow) 5 Peak I/I Rate: A normalized peak I/I flow based on catchment area size, Peak I/I Rate = Peak I/I Flow / Catchment Area 6 Volumetric Coefficient (Cv%): The ratio of total I/I volume and total rainfall volume, Cv% = Total I/I Flow Volume / Total Precipitation Volume * 100% 7 Peak I/ I Coefficient: The ratio of peak I/I flow and peak rainfall intensity, Peak I/ I Coefficient = Peak I/I Flow / (Peak Rainfall Intensity over Tc * Catchment Area) 8 Hourly Wet‐Weather Peaking Factor: The ratio of peak hourly wet‐weather measured flow and average dry‐weather flow, Wet‐Weather Peaking Factor = Peak Hourly Wet‐Weather Measured Flow / Average Dry-Weather Flow 9 Instantaneous Wet‐Weather Peaking Factor: The ratio of peak wet‐weather measured flow and average dry‐weather flow, Wet‐Weather Peaking Factor = Peak Wet‐Weather Measured Flow / Average Dry-Weather Flow 2
231 Civica Infrastructure Inc. www.civi.ca
Civica Infrastructures Inc. Kawartha Lakes Flow Monitoring Report
Appendix - A June 03, 2024
I/I Analysis Graph Station: B9
232 Civica Infrastructure Inc. www.civi.ca
Civica Infrastructures Inc. Kawartha Lakes Flow Monitoring Report
Appendix - A June 03, 2024
Infiltration/Inflow Event Analysis Station: B9 Mar 31, 2023 00:55 – Apr 01, 2023 17:25, Total Precipitation: 22.00 mm (6,952,000.00 L) Station Details
Storm Details
Catchment Area
31.60 ha
Total Precipitation
22.00 mm (6,952,000.00 L)
Duration of Storm
16.50 hr
Time of Concentration (Tc) 1
15 min
Peak Precipitation Intensity Over Tc 2
8.00 mm/hr
Return Period over Tc 3
< 2 Yr
Measured Flow
I/I Flow
Time of Peak Measured Flow
Mar 31, 2023 18:05
Time of Peak I/I Flow (TD)
Apr 01, 2023 05:35
Estimated Dry Weather Flow at TD
0.52 L/s
Peak Measured Flow
1.71 L/s
Peak I/I Flow 4
1.19 L/s
Peak I/I Rate 5
0.04 L/s/ha
Peak Measured Depth
49.70 mm
Total I/I Flow Volume during event
11,863.50 L
Volumetric Coefficient (Cv%) 6
0.17%
Total Measured Flow Volume during Event
55,275.10 L
Peak I/I Coefficient 7
0.0017
Hourly Wet-Weather Peaking Factor 8
2.40
Instantaneous Wet-Weather Peaking Factor 9
4.06
1
Time of Concentration (Tc): The estimated time for the flow to travel from the furthest point in the upstream area to the point of monitoring, assume flow is travelling at 1.00 m/s Peak Precipitation Intensity Over Tc: The peak rainfall intensity for the duration of the storm with the time interval defined by time of concentration 3 Return Period over Tc: The estimated time to elapse before a storm of equal or greater intensity will likely occur again, based on design storm criteria 4 Peak I/I Flow: The greatest difference captured between measured flow and estimated dry weather flow, Peak I/I Flow = Maximum (Measured Flow – Estimated Dry Weather Flow) 5 Peak I/I Rate: A normalized peak I/I flow based on catchment area size, Peak I/I Rate = Peak I/I Flow / Catchment Area 6 Volumetric Coefficient (Cv%): The ratio of total I/I volume and total rainfall volume, Cv% = Total I/I Flow Volume / Total Precipitation Volume * 100% 7 Peak I/ I Coefficient: The ratio of peak I/I flow and peak rainfall intensity, Peak I/ I Coefficient = Peak I/I Flow / (Peak Rainfall Intensity over Tc * Catchment Area) 8 Hourly Wet‐Weather Peaking Factor: The ratio of peak hourly wet‐weather measured flow and average dry‐weather flow, Wet‐Weather Peaking Factor = Peak Hourly Wet‐Weather Measured Flow / Average Dry-Weather Flow 9 Instantaneous Wet‐Weather Peaking Factor: The ratio of peak wet‐weather measured flow and average dry‐weather flow, Wet‐Weather Peaking Factor = Peak Wet‐Weather Measured Flow / Average Dry-Weather Flow 2
233 Civica Infrastructure Inc. www.civi.ca
Civica Infrastructures Inc. Kawartha Lakes Flow Monitoring Report
Appendix - A June 03, 2024
I/I Analysis Graph Station: B9
234 Civica Infrastructure Inc. www.civi.ca
Civica Infrastructures Inc. Kawartha Lakes Flow Monitoring Report
Appendix - A June 03, 2024
Infiltration/Inflow Event Analysis Station: B9 Apr 04, 2023 17:50 – Apr 06, 2023 04:30, Total Precipitation: 28.75 mm (9,085,000.00 L) Station Details
Storm Details
Catchment Area
31.60 ha
Total Precipitation
28.75 mm (9,085,000.00 L)
Duration of Storm
10.67 hr
Time of Concentration (Tc) 1
15 min
Peak Precipitation Intensity Over Tc 2
33.00 mm/hr
Return Period over Tc 3
< 2 Yr
Measured Flow
I/I Flow
Time of Peak Measured Flow
Apr 05, 2023 09:50
Time of Peak I/I Flow (TD)
Apr 05, 2023 09:50
Estimated Dry Weather Flow at TD
0.80 L/s
Peak Measured Flow
1.79 L/s
Peak I/I Flow 4
0.98 L/s
Peak I/I Rate 5
0.03 L/s/ha
Peak Measured Depth
50.70 mm
Total I/I Flow Volume during event
7,507.80 L
Volumetric Coefficient (Cv%) 6
0.08%
Total Measured Flow Volume during Event
43,577.00 L
Peak I/I Coefficient 7
0.0003
Hourly Wet-Weather Peaking Factor 8
2.36
Instantaneous Wet-Weather Peaking Factor 9
4.06
1
Time of Concentration (Tc): The estimated time for the flow to travel from the furthest point in the upstream area to the point of monitoring, assume flow is travelling at 1.00 m/s Peak Precipitation Intensity Over Tc: The peak rainfall intensity for the duration of the storm with the time interval defined by time of concentration 3 Return Period over Tc: The estimated time to elapse before a storm of equal or greater intensity will likely occur again, based on design storm criteria 4 Peak I/I Flow: The greatest difference captured between measured flow and estimated dry weather flow, Peak I/I Flow = Maximum (Measured Flow – Estimated Dry Weather Flow) 5 Peak I/I Rate: A normalized peak I/I flow based on catchment area size, Peak I/I Rate = Peak I/I Flow / Catchment Area 6 Volumetric Coefficient (Cv%): The ratio of total I/I volume and total rainfall volume, Cv% = Total I/I Flow Volume / Total Precipitation Volume * 100% 7 Peak I/ I Coefficient: The ratio of peak I/I flow and peak rainfall intensity, Peak I/ I Coefficient = Peak I/I Flow / (Peak Rainfall Intensity over Tc * Catchment Area) 8 Hourly Wet‐Weather Peaking Factor: The ratio of peak hourly wet‐weather measured flow and average dry‐weather flow, Wet‐Weather Peaking Factor = Peak Hourly Wet‐Weather Measured Flow / Average Dry-Weather Flow 9 Instantaneous Wet‐Weather Peaking Factor: The ratio of peak wet‐weather measured flow and average dry‐weather flow, Wet‐Weather Peaking Factor = Peak Wet‐Weather Measured Flow / Average Dry-Weather Flow 2
235 Civica Infrastructure Inc. www.civi.ca
Civica Infrastructures Inc. Kawartha Lakes Flow Monitoring Report
Appendix - A June 03, 2024
I/I Analysis Graph Station: B9
236 Civica Infrastructure Inc. www.civi.ca
Civica Infrastructures Inc. Kawartha Lakes Flow Monitoring Report
Appendix - A June 03, 2024
Infiltration/Inflow Event Analysis Station: B9 Apr 28, 2023 08:40 – May 01, 2023 13:35, Total Precipitation: 34.00 mm (10,744,000.00 L) Station Details
Storm Details
Catchment Area
31.60 ha
Total Precipitation
34.00 mm (10,744,000.00 L)
Duration of Storm
52.92 hr
Time of Concentration (Tc) 1
15 min
Peak Precipitation Intensity Over Tc 2
10.00 mm/hr
Return Period over Tc 3
< 2 Yr
Measured Flow
I/I Flow
Time of Peak Measured Flow
Apr 29, 2023 12:45
Time of Peak I/I Flow (TD)
Apr 29, 2023 12:45
Estimated Dry Weather Flow at TD
0.45 L/s
Peak Measured Flow
1.79 L/s
Peak I/I Flow 4
1.34 L/s
Peak I/I Rate 5
0.04 L/s/ha
Peak Measured Depth
52.70 mm
Total I/I Flow Volume during event
17,152.60 L
Volumetric Coefficient (Cv%) 6
0.16%
Total Measured Flow Volume during Event
104,755.00 L
Peak I/I Coefficient 7
0.0015
Hourly Wet-Weather Peaking Factor 8
2.69
Instantaneous Wet-Weather Peaking Factor 9
4.77
1
Time of Concentration (Tc): The estimated time for the flow to travel from the furthest point in the upstream area to the point of monitoring, assume flow is travelling at 1.00 m/s Peak Precipitation Intensity Over Tc: The peak rainfall intensity for the duration of the storm with the time interval defined by time of concentration 3 Return Period over Tc: The estimated time to elapse before a storm of equal or greater intensity will likely occur again, based on design storm criteria 4 Peak I/I Flow: The greatest difference captured between measured flow and estimated dry weather flow, Peak I/I Flow = Maximum (Measured Flow – Estimated Dry Weather Flow) 5 Peak I/I Rate: A normalized peak I/I flow based on catchment area size, Peak I/I Rate = Peak I/I Flow / Catchment Area 6 Volumetric Coefficient (Cv%): The ratio of total I/I volume and total rainfall volume, Cv% = Total I/I Flow Volume / Total Precipitation Volume * 100% 7 Peak I/ I Coefficient: The ratio of peak I/I flow and peak rainfall intensity, Peak I/ I Coefficient = Peak I/I Flow / (Peak Rainfall Intensity over Tc * Catchment Area) 8 Hourly Wet‐Weather Peaking Factor: The ratio of peak hourly wet‐weather measured flow and average dry‐weather flow, Wet‐Weather Peaking Factor = Peak Hourly Wet‐Weather Measured Flow / Average Dry-Weather Flow 9 Instantaneous Wet‐Weather Peaking Factor: The ratio of peak wet‐weather measured flow and average dry‐weather flow, Wet‐Weather Peaking Factor = Peak Wet‐Weather Measured Flow / Average Dry-Weather Flow 2
237 Civica Infrastructure Inc. www.civi.ca
Civica Infrastructures Inc. Kawartha Lakes Flow Monitoring Report
Appendix - A June 03, 2024
I/I Analysis Graph Station: B9
238 Civica Infrastructure Inc. www.civi.ca
Civica Infrastructures Inc. Kawartha Lakes Flow Monitoring Report
Appendix - A June 03, 2024
Infiltration/Inflow Event Analysis Station: B9 May 19, 2023 09:15 – May 21, 2023 03:10, Total Precipitation: 35.00 mm (11,060,000.00 L) Station Details
Storm Details
Catchment Area
31.60 ha
Total Precipitation
35.00 mm (11,060,000.00 L)
Duration of Storm
17.92 hr
Time of Concentration (Tc) 1
15 min
Peak Precipitation Intensity Over Tc 2
9.00 mm/hr
Return Period over Tc 3
< 2 Yr
Measured Flow
I/I Flow
Time of Peak Measured Flow
May 20, 2023 15:25
Time of Peak I/I Flow (TD)
May 20, 2023 15:25
Estimated Dry Weather Flow at TD
0.42 L/s
Peak Measured Flow
1.23 L/s
Peak I/I Flow 4
0.81 L/s
Peak I/I Rate 5
0.03 L/s/ha
Peak Measured Depth
45.70 mm
Total I/I Flow Volume during event
10,505.70 L
Volumetric Coefficient (Cv%) 6
0.10%
Total Measured Flow Volume during Event
46,909.60 L
Peak I/I Coefficient 7
0.0010
Hourly Wet-Weather Peaking Factor 8
2.37
Instantaneous Wet-Weather Peaking Factor 9
3.65
1
Time of Concentration (Tc): The estimated time for the flow to travel from the furthest point in the upstream area to the point of monitoring, assume flow is travelling at 1.00 m/s Peak Precipitation Intensity Over Tc: The peak rainfall intensity for the duration of the storm with the time interval defined by time of concentration 3 Return Period over Tc: The estimated time to elapse before a storm of equal or greater intensity will likely occur again, based on design storm criteria 4 Peak I/I Flow: The greatest difference captured between measured flow and estimated dry weather flow, Peak I/I Flow = Maximum (Measured Flow – Estimated Dry Weather Flow) 5 Peak I/I Rate: A normalized peak I/I flow based on catchment area size, Peak I/I Rate = Peak I/I Flow / Catchment Area 6 Volumetric Coefficient (Cv%): The ratio of total I/I volume and total rainfall volume, Cv% = Total I/I Flow Volume / Total Precipitation Volume * 100% 7 Peak I/ I Coefficient: The ratio of peak I/I flow and peak rainfall intensity, Peak I/ I Coefficient = Peak I/I Flow / (Peak Rainfall Intensity over Tc * Catchment Area) 8 Hourly Wet‐Weather Peaking Factor: The ratio of peak hourly wet‐weather measured flow and average dry‐weather flow, Wet‐Weather Peaking Factor = Peak Hourly Wet‐Weather Measured Flow / Average Dry-Weather Flow 9 Instantaneous Wet‐Weather Peaking Factor: The ratio of peak wet‐weather measured flow and average dry‐weather flow, Wet‐Weather Peaking Factor = Peak Wet‐Weather Measured Flow / Average Dry-Weather Flow 2
239 Civica Infrastructure Inc. www.civi.ca
Civica Infrastructures Inc. Kawartha Lakes Flow Monitoring Report
Appendix - A June 03, 2024
I/I Analysis Graph Station: B9
240 Civica Infrastructure Inc. www.civi.ca
Civica Infrastructures Inc. Kawartha Lakes Flow Monitoring Report
Appendix - A June 03, 2024
Infiltration/Inflow Event Analysis Station: B9 Jun 11, 2023 06:00 – Jun 13, 2023 10:35, Total Precipitation: 51.00 mm (16,116,000.00 L) Station Details
Storm Details
Catchment Area
31.60 ha
Total Precipitation
51.00 mm (16,116,000.00 L)
Duration of Storm
28.58 hr
Time of Concentration (Tc) 1
15 min
Peak Precipitation Intensity Over Tc 2
13.00 mm/hr
Return Period over Tc 3
< 2 Yr
Measured Flow
I/I Flow
Time of Peak Measured Flow
Jun 12, 2023 04:40
Time of Peak I/I Flow (TD)
Jun 12, 2023 04:40
Estimated Dry Weather Flow at TD
0.41 L/s
Peak Measured Flow
2.03 L/s
Peak I/I Flow 4
1.62 L/s
Peak I/I Rate 5
0.05 L/s/ha
Peak Measured Depth
53.70 mm
Total I/I Flow Volume during event
13,593.40 L
Volumetric Coefficient (Cv%) 6
0.08%
Total Measured Flow Volume during Event
69,785.60 L
Peak I/I Coefficient 7
0.0014
Hourly Wet-Weather Peaking Factor 8
2.45
Instantaneous Wet-Weather Peaking Factor 9
5.28
1
Time of Concentration (Tc): The estimated time for the flow to travel from the furthest point in the upstream area to the point of monitoring, assume flow is travelling at 1.00 m/s Peak Precipitation Intensity Over Tc: The peak rainfall intensity for the duration of the storm with the time interval defined by time of concentration 3 Return Period over Tc: The estimated time to elapse before a storm of equal or greater intensity will likely occur again, based on design storm criteria 4 Peak I/I Flow: The greatest difference captured between measured flow and estimated dry weather flow, Peak I/I Flow = Maximum (Measured Flow – Estimated Dry Weather Flow) 5 Peak I/I Rate: A normalized peak I/I flow based on catchment area size, Peak I/I Rate = Peak I/I Flow / Catchment Area 6 Volumetric Coefficient (Cv%): The ratio of total I/I volume and total rainfall volume, Cv% = Total I/I Flow Volume / Total Precipitation Volume * 100% 7 Peak I/ I Coefficient: The ratio of peak I/I flow and peak rainfall intensity, Peak I/ I Coefficient = Peak I/I Flow / (Peak Rainfall Intensity over Tc * Catchment Area) 8 Hourly Wet‐Weather Peaking Factor: The ratio of peak hourly wet‐weather measured flow and average dry‐weather flow, Wet‐Weather Peaking Factor = Peak Hourly Wet‐Weather Measured Flow / Average Dry-Weather Flow 9 Instantaneous Wet‐Weather Peaking Factor: The ratio of peak wet‐weather measured flow and average dry‐weather flow, Wet‐Weather Peaking Factor = Peak Wet‐Weather Measured Flow / Average Dry-Weather Flow 2
241 Civica Infrastructure Inc. www.civi.ca
Civica Infrastructures Inc. Kawartha Lakes Flow Monitoring Report
Appendix - A June 03, 2024
I/I Analysis Graph Station: B9
242 Civica Infrastructure Inc. www.civi.ca
Civica Infrastructures Inc. Kawartha Lakes Flow Monitoring Report
Appendix - A June 03, 2024
Infiltration/Inflow Event Analysis Station: B9 Jun 26, 2023 22:25 – Jun 28, 2023 09:05, Total Precipitation: 15.25 mm (4,819,000.00 L) Station Details
Storm Details
Catchment Area
31.60 ha
Total Precipitation
15.25 mm (4,819,000.00 L)
Duration of Storm
10.67 hr
Time of Concentration (Tc) 1
15 min
Peak Precipitation Intensity Over Tc 2
15.00 mm/hr
Return Period over Tc 3
< 2 Yr
Measured Flow
I/I Flow
Time of Peak Measured Flow
Jun 27, 2023 09:45
Time of Peak I/I Flow (TD)
Jun 27, 2023 19:05
Estimated Dry Weather Flow at TD
0.47 L/s
Peak Measured Flow
1.56 L/s
Peak I/I Flow 4
0.89 L/s
Peak I/I Rate 5
0.03 L/s/ha
Peak Measured Depth
48.70 mm
Total I/I Flow Volume during event
8,113.60 L
Volumetric Coefficient (Cv%) 6
0.17%
Total Measured Flow Volume during Event
39,048.00 L
Peak I/I Coefficient 7
0.0007
Hourly Wet-Weather Peaking Factor 8
2.48
Instantaneous Wet-Weather Peaking Factor 9
4.14
1
Time of Concentration (Tc): The estimated time for the flow to travel from the furthest point in the upstream area to the point of monitoring, assume flow is travelling at 1.00 m/s Peak Precipitation Intensity Over Tc: The peak rainfall intensity for the duration of the storm with the time interval defined by time of concentration 3 Return Period over Tc: The estimated time to elapse before a storm of equal or greater intensity will likely occur again, based on design storm criteria 4 Peak I/I Flow: The greatest difference captured between measured flow and estimated dry weather flow, Peak I/I Flow = Maximum (Measured Flow – Estimated Dry Weather Flow) 5 Peak I/I Rate: A normalized peak I/I flow based on catchment area size, Peak I/I Rate = Peak I/I Flow / Catchment Area 6 Volumetric Coefficient (Cv%): The ratio of total I/I volume and total rainfall volume, Cv% = Total I/I Flow Volume / Total Precipitation Volume * 100% 7 Peak I/ I Coefficient: The ratio of peak I/I flow and peak rainfall intensity, Peak I/ I Coefficient = Peak I/I Flow / (Peak Rainfall Intensity over Tc * Catchment Area) 8 Hourly Wet‐Weather Peaking Factor: The ratio of peak hourly wet‐weather measured flow and average dry‐weather flow, Wet‐Weather Peaking Factor = Peak Hourly Wet‐Weather Measured Flow / Average Dry-Weather Flow 9 Instantaneous Wet‐Weather Peaking Factor: The ratio of peak wet‐weather measured flow and average dry‐weather flow, Wet‐Weather Peaking Factor = Peak Wet‐Weather Measured Flow / Average Dry-Weather Flow 2
243 Civica Infrastructure Inc. www.civi.ca
Civica Infrastructures Inc. Kawartha Lakes Flow Monitoring Report
Appendix - A June 03, 2024
I/I Analysis Graph Station: B9
244 Civica Infrastructure Inc. www.civi.ca
Civica Infrastructures Inc. Kawartha Lakes Flow Monitoring Report
Appendix - A June 03, 2024
Infiltration/Inflow Event Analysis Station: B9 Jul 12, 2023 14:55 – Jul 13, 2023 19:00, Total Precipitation: 16.25 mm (5,135,000.00 L) Station Details
Storm Details
Catchment Area
31.60 ha
Total Precipitation
16.25 mm (5,135,000.00 L)
Duration of Storm
4.08 hr
Time of Concentration (Tc) 1
15 min
Peak Precipitation Intensity Over Tc 2
10.00 mm/hr
Return Period over Tc 3
< 2 Yr
Measured Flow
I/I Flow
Time of Peak Measured Flow
Jul 13, 2023 06:15
Time of Peak I/I Flow (TD)
Jul 13, 2023 06:15
Estimated Dry Weather Flow at TD
0.63 L/s
Peak Measured Flow
1.79 L/s
Peak I/I Flow 4
1.15 L/s
Peak I/I Rate 5
0.04 L/s/ha
Peak Measured Depth
50.70 mm
Total I/I Flow Volume during event
6,095.50 L
Volumetric Coefficient (Cv%) 6
0.12%
Total Measured Flow Volume during Event
31,790.00 L
Peak I/I Coefficient 7
0.0013
Hourly Wet-Weather Peaking Factor 8
2.07
Instantaneous Wet-Weather Peaking Factor 9
4.05
1
Time of Concentration (Tc): The estimated time for the flow to travel from the furthest point in the upstream area to the point of monitoring, assume flow is travelling at 1.00 m/s Peak Precipitation Intensity Over Tc: The peak rainfall intensity for the duration of the storm with the time interval defined by time of concentration 3 Return Period over Tc: The estimated time to elapse before a storm of equal or greater intensity will likely occur again, based on design storm criteria 4 Peak I/I Flow: The greatest difference captured between measured flow and estimated dry weather flow, Peak I/I Flow = Maximum (Measured Flow – Estimated Dry Weather Flow) 5 Peak I/I Rate: A normalized peak I/I flow based on catchment area size, Peak I/I Rate = Peak I/I Flow / Catchment Area 6 Volumetric Coefficient (Cv%): The ratio of total I/I volume and total rainfall volume, Cv% = Total I/I Flow Volume / Total Precipitation Volume * 100% 7 Peak I/ I Coefficient: The ratio of peak I/I flow and peak rainfall intensity, Peak I/ I Coefficient = Peak I/I Flow / (Peak Rainfall Intensity over Tc * Catchment Area) 8 Hourly Wet‐Weather Peaking Factor: The ratio of peak hourly wet‐weather measured flow and average dry‐weather flow, Wet‐Weather Peaking Factor = Peak Hourly Wet‐Weather Measured Flow / Average Dry-Weather Flow 9 Instantaneous Wet‐Weather Peaking Factor: The ratio of peak wet‐weather measured flow and average dry‐weather flow, Wet‐Weather Peaking Factor = Peak Wet‐Weather Measured Flow / Average Dry-Weather Flow 2
245 Civica Infrastructure Inc. www.civi.ca
Civica Infrastructures Inc. Kawartha Lakes Flow Monitoring Report
Appendix - A June 03, 2024
I/I Analysis Graph Station: B9
246 Civica Infrastructure Inc. www.civi.ca
Civica Infrastructures Inc. Kawartha Lakes Flow Monitoring Report
Appendix - A June 03, 2024
Infiltration/Inflow Event Analysis Station: B9 Jul 20, 2023 07:25 – Jul 22, 2023 02:10, Total Precipitation: 17.50 mm (5,530,000.00 L) Station Details
Storm Details
Catchment Area
31.60 ha
Total Precipitation
17.50 mm (5,530,000.00 L)
Duration of Storm
18.75 hr
Time of Concentration (Tc) 1
15 min
Peak Precipitation Intensity Over Tc 2
11.00 mm/hr
Return Period over Tc 3
< 2 Yr
Measured Flow
I/I Flow
Time of Peak Measured Flow
Jul 21, 2023 07:35
Time of Peak I/I Flow (TD)
Jul 21, 2023 07:35
Estimated Dry Weather Flow at TD
0.57 L/s
Peak Measured Flow
3.97 L/s
Peak I/I Flow 4
3.41 L/s
Peak I/I Rate 5
0.11 L/s/ha
Peak Measured Depth
72.70 mm
Total I/I Flow Volume during event
13,014.30 L
Volumetric Coefficient (Cv%) 6
0.24%
Total Measured Flow Volume during Event
50,168.40 L
Peak I/I Coefficient 7
0.0035
Hourly Wet-Weather Peaking Factor 8
3.09
Instantaneous Wet-Weather Peaking Factor 9
11.87
1
Time of Concentration (Tc): The estimated time for the flow to travel from the furthest point in the upstream area to the point of monitoring, assume flow is travelling at 1.00 m/s Peak Precipitation Intensity Over Tc: The peak rainfall intensity for the duration of the storm with the time interval defined by time of concentration 3 Return Period over Tc: The estimated time to elapse before a storm of equal or greater intensity will likely occur again, based on design storm criteria 4 Peak I/I Flow: The greatest difference captured between measured flow and estimated dry weather flow, Peak I/I Flow = Maximum (Measured Flow – Estimated Dry Weather Flow) 5 Peak I/I Rate: A normalized peak I/I flow based on catchment area size, Peak I/I Rate = Peak I/I Flow / Catchment Area 6 Volumetric Coefficient (Cv%): The ratio of total I/I volume and total rainfall volume, Cv% = Total I/I Flow Volume / Total Precipitation Volume * 100% 7 Peak I/ I Coefficient: The ratio of peak I/I flow and peak rainfall intensity, Peak I/ I Coefficient = Peak I/I Flow / (Peak Rainfall Intensity over Tc * Catchment Area) 8 Hourly Wet‐Weather Peaking Factor: The ratio of peak hourly wet‐weather measured flow and average dry‐weather flow, Wet‐Weather Peaking Factor = Peak Hourly Wet‐Weather Measured Flow / Average Dry-Weather Flow 9 Instantaneous Wet‐Weather Peaking Factor: The ratio of peak wet‐weather measured flow and average dry‐weather flow, Wet‐Weather Peaking Factor = Peak Wet‐Weather Measured Flow / Average Dry-Weather Flow 2
247 Civica Infrastructure Inc. www.civi.ca
Civica Infrastructures Inc. Kawartha Lakes Flow Monitoring Report
Appendix - A June 03, 2024
I/I Analysis Graph Station: B9
248 Civica Infrastructure Inc. www.civi.ca
Civica Infrastructures Inc. Kawartha Lakes Flow Monitoring Report
Appendix - A June 03, 2024
Infiltration/Inflow Event Analysis Station: B9 Jul 28, 2023 20:30 – Jul 29, 2023 23:55, Total Precipitation: 16.50 mm (5,214,000.00 L) Station Details
Storm Details
Catchment Area
31.60 ha
Total Precipitation
16.50 mm (5,214,000.00 L)
Duration of Storm
3.42 hr
Time of Concentration (Tc) 1
15 min
Peak Precipitation Intensity Over Tc 2
20.00 mm/hr
Return Period over Tc 3
< 2 Yr
Measured Flow
I/I Flow
Time of Peak Measured Flow
Jul 29, 2023 18:05
Time of Peak I/I Flow (TD)
Jul 29, 2023 23:10
Estimated Dry Weather Flow at TD
0.24 L/s
Peak Measured Flow
1.17 L/s
Peak I/I Flow 4
0.93 L/s
Peak I/I Rate 5
0.03 L/s/ha
Peak Measured Depth
41.70 mm
Total I/I Flow Volume during event
7,373.00 L
Volumetric Coefficient (Cv%) 6
0.14%
Total Measured Flow Volume during Event
27,879.10 L
Peak I/I Coefficient 7
0.0005
Hourly Wet-Weather Peaking Factor 8
2.18
Instantaneous Wet-Weather Peaking Factor 9
3.18
1
Time of Concentration (Tc): The estimated time for the flow to travel from the furthest point in the upstream area to the point of monitoring, assume flow is travelling at 1.00 m/s Peak Precipitation Intensity Over Tc: The peak rainfall intensity for the duration of the storm with the time interval defined by time of concentration 3 Return Period over Tc: The estimated time to elapse before a storm of equal or greater intensity will likely occur again, based on design storm criteria 4 Peak I/I Flow: The greatest difference captured between measured flow and estimated dry weather flow, Peak I/I Flow = Maximum (Measured Flow – Estimated Dry Weather Flow) 5 Peak I/I Rate: A normalized peak I/I flow based on catchment area size, Peak I/I Rate = Peak I/I Flow / Catchment Area 6 Volumetric Coefficient (Cv%): The ratio of total I/I volume and total rainfall volume, Cv% = Total I/I Flow Volume / Total Precipitation Volume * 100% 7 Peak I/ I Coefficient: The ratio of peak I/I flow and peak rainfall intensity, Peak I/ I Coefficient = Peak I/I Flow / (Peak Rainfall Intensity over Tc * Catchment Area) 8 Hourly Wet‐Weather Peaking Factor: The ratio of peak hourly wet‐weather measured flow and average dry‐weather flow, Wet‐Weather Peaking Factor = Peak Hourly Wet‐Weather Measured Flow / Average Dry-Weather Flow 9 Instantaneous Wet‐Weather Peaking Factor: The ratio of peak wet‐weather measured flow and average dry‐weather flow, Wet‐Weather Peaking Factor = Peak Wet‐Weather Measured Flow / Average Dry-Weather Flow 2
249 Civica Infrastructure Inc. www.civi.ca
Civica Infrastructures Inc. Kawartha Lakes Flow Monitoring Report
Appendix - A June 03, 2024
I/I Analysis Graph Station: B9
250 Civica Infrastructure Inc. www.civi.ca
Civica Infrastructures Inc. Kawartha Lakes Flow Monitoring Report
Appendix - A June 03, 2024
Infiltration/Inflow Event Analysis Station: B9 Aug 11, 2023 21:30 – Aug 13, 2023 23:05, Total Precipitation: 15.00 mm (4,740,000.00 L) Station Details
Storm Details
Catchment Area
31.60 ha
Total Precipitation
15.00 mm (4,740,000.00 L)
Duration of Storm
25.58 hr
Time of Concentration (Tc) 1
15 min
Peak Precipitation Intensity Over Tc 2
39.00 mm/hr
Return Period over Tc 3
< 2 Yr
Measured Flow
I/I Flow
Time of Peak Measured Flow
Aug 13, 2023 18:15
Time of Peak I/I Flow (TD)
Aug 13, 2023 18:15
Estimated Dry Weather Flow at TD
0.60 L/s
Peak Measured Flow
1.95 L/s
Peak I/I Flow 4
1.35 L/s
Peak I/I Rate 5
0.04 L/s/ha
Peak Measured Depth
52.70 mm
Total I/I Flow Volume during event
29,565.60 L
Volumetric Coefficient (Cv%) 6
0.62%
Total Measured Flow Volume during Event
79,826.20 L
Peak I/I Coefficient 7
0.0004
Hourly Wet-Weather Peaking Factor 8
3.05
Instantaneous Wet-Weather Peaking Factor 9
5.25
1
Time of Concentration (Tc): The estimated time for the flow to travel from the furthest point in the upstream area to the point of monitoring, assume flow is travelling at 1.00 m/s Peak Precipitation Intensity Over Tc: The peak rainfall intensity for the duration of the storm with the time interval defined by time of concentration 3 Return Period over Tc: The estimated time to elapse before a storm of equal or greater intensity will likely occur again, based on design storm criteria 4 Peak I/I Flow: The greatest difference captured between measured flow and estimated dry weather flow, Peak I/I Flow = Maximum (Measured Flow – Estimated Dry Weather Flow) 5 Peak I/I Rate: A normalized peak I/I flow based on catchment area size, Peak I/I Rate = Peak I/I Flow / Catchment Area 6 Volumetric Coefficient (Cv%): The ratio of total I/I volume and total rainfall volume, Cv% = Total I/I Flow Volume / Total Precipitation Volume * 100% 7 Peak I/ I Coefficient: The ratio of peak I/I flow and peak rainfall intensity, Peak I/ I Coefficient = Peak I/I Flow / (Peak Rainfall Intensity over Tc * Catchment Area) 8 Hourly Wet‐Weather Peaking Factor: The ratio of peak hourly wet‐weather measured flow and average dry‐weather flow, Wet‐Weather Peaking Factor = Peak Hourly Wet‐Weather Measured Flow / Average Dry-Weather Flow 9 Instantaneous Wet‐Weather Peaking Factor: The ratio of peak wet‐weather measured flow and average dry‐weather flow, Wet‐Weather Peaking Factor = Peak Wet‐Weather Measured Flow / Average Dry-Weather Flow 2
251 Civica Infrastructure Inc. www.civi.ca
Civica Infrastructures Inc. Kawartha Lakes Flow Monitoring Report
Appendix - A June 03, 2024
I/I Analysis Graph Station: B9
252 Civica Infrastructure Inc. www.civi.ca
Civica Infrastructures Inc. Kawartha Lakes Flow Monitoring Report
Appendix - A June 03, 2024
Infiltration/Inflow Event Analysis Station: B9 Oct 05, 2023 08:40 – Oct 07, 2023 19:20, Total Precipitation: 35.75 mm (11,297,000.00 L) Station Details
Storm Details
Catchment Area
31.60 ha
Total Precipitation
35.75 mm (11,297,000.00 L)
Duration of Storm
34.67 hr
Time of Concentration (Tc) 1
15 min
Peak Precipitation Intensity Over Tc 2
27.00 mm/hr
Return Period over Tc 3
< 2 Yr
Measured Flow
I/I Flow
Time of Peak Measured Flow
Oct 06, 2023 07:35
Time of Peak I/I Flow (TD)
Oct 06, 2023 07:35
Estimated Dry Weather Flow at TD
0.55 L/s
Peak Measured Flow
1.71 L/s
Peak I/I Flow 4
1.16 L/s
Peak I/I Rate 5
0.04 L/s/ha
Peak Measured Depth
49.70 mm
Total I/I Flow Volume during event
16,985.40 L
Volumetric Coefficient (Cv%) 6
0.15%
Total Measured Flow Volume during Event
73,647.30 L
Peak I/I Coefficient 7
0.0005
Hourly Wet-Weather Peaking Factor 8
3.44
Instantaneous Wet-Weather Peaking Factor 9
5.08
1
Time of Concentration (Tc): The estimated time for the flow to travel from the furthest point in the upstream area to the point of monitoring, assume flow is travelling at 1.00 m/s Peak Precipitation Intensity Over Tc: The peak rainfall intensity for the duration of the storm with the time interval defined by time of concentration 3 Return Period over Tc: The estimated time to elapse before a storm of equal or greater intensity will likely occur again, based on design storm criteria 4 Peak I/I Flow: The greatest difference captured between measured flow and estimated dry weather flow, Peak I/I Flow = Maximum (Measured Flow – Estimated Dry Weather Flow) 5 Peak I/I Rate: A normalized peak I/I flow based on catchment area size, Peak I/I Rate = Peak I/I Flow / Catchment Area 6 Volumetric Coefficient (Cv%): The ratio of total I/I volume and total rainfall volume, Cv% = Total I/I Flow Volume / Total Precipitation Volume * 100% 7 Peak I/ I Coefficient: The ratio of peak I/I flow and peak rainfall intensity, Peak I/ I Coefficient = Peak I/I Flow / (Peak Rainfall Intensity over Tc * Catchment Area) 8 Hourly Wet‐Weather Peaking Factor: The ratio of peak hourly wet‐weather measured flow and average dry‐weather flow, Wet‐Weather Peaking Factor = Peak Hourly Wet‐Weather Measured Flow / Average Dry-Weather Flow 9 Instantaneous Wet‐Weather Peaking Factor: The ratio of peak wet‐weather measured flow and average dry‐weather flow, Wet‐Weather Peaking Factor = Peak Wet‐Weather Measured Flow / Average Dry-Weather Flow 2
253 Civica Infrastructure Inc. www.civi.ca
Civica Infrastructures Inc. Kawartha Lakes Flow Monitoring Report
Appendix - A June 03, 2024
I/I Analysis Graph Station: B9
254 Civica Infrastructure Inc. www.civi.ca
Civica Infrastructures Inc. Kawartha Lakes Flow Monitoring Report
Appendix - A June 03, 2024
Infiltration/Inflow Event Analysis Station: B9 Oct 08, 2023 02:50 – Oct 12, 2023 11:55, Total Precipitation: 28.75 mm (9,085,000.00 L) Station Details
Storm Details
Catchment Area
31.60 ha
Total Precipitation
28.75 mm (9,085,000.00 L)
Duration of Storm
81.08 hr
Time of Concentration (Tc) 1
15 min
Peak Precipitation Intensity Over Tc 2
4.00 mm/hr
Return Period over Tc 3
< 2 Yr
Measured Flow
I/I Flow
Time of Peak Measured Flow
Oct 10, 2023 18:00
Time of Peak I/I Flow (TD)
Oct 10, 2023 18:00
Estimated Dry Weather Flow at TD
0.65 L/s
Peak Measured Flow
1.95 L/s
Peak I/I Flow 4
1.30 L/s
Peak I/I Rate 5
0.04 L/s/ha
Peak Measured Depth
52.70 mm
Total I/I Flow Volume during event
26,048.80 L
Volumetric Coefficient (Cv%) 6
0.29%
Total Measured Flow Volume during Event
134,103.30 L
Peak I/I Coefficient 7
0.0037
Hourly Wet-Weather Peaking Factor 8
2.87
Instantaneous Wet-Weather Peaking Factor 9
6.04
1
Time of Concentration (Tc): The estimated time for the flow to travel from the furthest point in the upstream area to the point of monitoring, assume flow is travelling at 1.00 m/s Peak Precipitation Intensity Over Tc: The peak rainfall intensity for the duration of the storm with the time interval defined by time of concentration 3 Return Period over Tc: The estimated time to elapse before a storm of equal or greater intensity will likely occur again, based on design storm criteria 4 Peak I/I Flow: The greatest difference captured between measured flow and estimated dry weather flow, Peak I/I Flow = Maximum (Measured Flow – Estimated Dry Weather Flow) 5 Peak I/I Rate: A normalized peak I/I flow based on catchment area size, Peak I/I Rate = Peak I/I Flow / Catchment Area 6 Volumetric Coefficient (Cv%): The ratio of total I/I volume and total rainfall volume, Cv% = Total I/I Flow Volume / Total Precipitation Volume * 100% 7 Peak I/ I Coefficient: The ratio of peak I/I flow and peak rainfall intensity, Peak I/ I Coefficient = Peak I/I Flow / (Peak Rainfall Intensity over Tc * Catchment Area) 8 Hourly Wet‐Weather Peaking Factor: The ratio of peak hourly wet‐weather measured flow and average dry‐weather flow, Wet‐Weather Peaking Factor = Peak Hourly Wet‐Weather Measured Flow / Average Dry-Weather Flow 9 Instantaneous Wet‐Weather Peaking Factor: The ratio of peak wet‐weather measured flow and average dry‐weather flow, Wet‐Weather Peaking Factor = Peak Wet‐Weather Measured Flow / Average Dry-Weather Flow 2
255 Civica Infrastructure Inc. www.civi.ca
Civica Infrastructures Inc. Kawartha Lakes Flow Monitoring Report
Appendix - A June 03, 2024
Activity Log Station: B9 Date Time
Type
Purpose of Visit
Comment
Calibration Measurement
24-Jan-2023 02:32:00 PM
Installation Log
INSTALLATION
TC SETUP, PHOTOS TAKEN,VIDEOS TAKEN,SENSOR INSTALLED,FLUME INSTALLLED, LOGGER STARTED
Yes
Yes
15-Mar-2023 09:20:00 AM
Maintenance Log
CALIBRATION
DATA DOWNLOADED, TELEMETRY SENT AND CHECKED, ENTRY MADE, SITE CALIBRATED, PHOTO AND VIDEO TAKEN
10-May-2023 10:54:00 AM
Maintenance Log
CALIBRATION
SET,SURVEY SENT,DOWNLOADED DATA, SENT TELEMETRY, MADE ENTRY, TOOK PHOTOS/VIDEOS, TOOK MEASUREMENTS,DEBRIS AND SILT CLEARED, CALIBRATED SITE,SITE CLEARED
Yes
22-Aug-2023 02:10:00 PM
Maintenance Log
DATA DOWNLOAD
TC SET,DATA DOWNLOADED,TELEMETRY SENT,ANTENNA CHECKED,SITE CLEARED
Yes
24-Oct-2023 12:15:00 PM
Removal Log
REMOVAL
SET UP CS/TC, DOWNLOAD DATA, SENT TELEMETRY, TOOK MEASUREMENTS, CALIBRATED SITE, REMOVED ALL EQUIPMENT, REMOVAL COMPLETE, PMAC ID: 8364
Yes
256 Civica Infrastructure Inc. www.civi.ca
Civica Infrastructures Inc. Kawartha Lakes Flow Monitoring Report
Appendix - A June 03, 2024
Aggregate Data Station: B10
Precipitation Date From
Date To
Days
Min (mm)
Avg (mm)
Max (mm)
Sum (mm)
Count
Time of Min1
Time of Max1
Jan 31, 2023
Oct 24, 2023
267
0.00
0.01
5.50
637.25
73,826
Tue Jan 31, 2023 12:00
Wed Apr 05, 2023 10:40
Level Date From
Date To
Days
Min (m)
Avg (m)
Max (m)
Count
Time of Min1
Time of Max1
Jan 31, 2023
Oct 24, 2023
267
0.00
0.04
0.09
76,599
Sat Sep 16, 2023 00:40
Sat Sep 16, 2023 16:35
Flow
1
Date From
Date To
Days
Min (L/s)
Avg (L/s)
Max (L/s)
Total Volume (1,000,000 L)
Count
Time of Min1
Time of Max1
Jan 31, 2023
Oct 24, 2023
267
0.01
0.88
6.66
20.22
76,599
Sat Sep 16, 2023 00:40
Sat Sep 16, 2023 16:35
Time of Min and Time of Max will be displayed by first occurrence
257 Civica Infrastructure Inc. www.civi.ca
Civica Infrastructures Inc. Kawartha Lakes Flow Monitoring Report
Appendix - A June 03, 2024
Data Chart Station: B10 Jan 31, 2023 – Jan 31, 2023
258 Civica Infrastructure Inc. www.civi.ca
Civica Infrastructures Inc. Kawartha Lakes Flow Monitoring Report
Appendix - A June 03, 2024
Data Chart Station: B10 Feb 01, 2023 – Feb 28, 2023
259 Civica Infrastructure Inc. www.civi.ca
Civica Infrastructures Inc. Kawartha Lakes Flow Monitoring Report
Appendix - A June 03, 2024
Data Chart Station: B10 Mar 01, 2023 – Mar 31, 2023
260 Civica Infrastructure Inc. www.civi.ca
Civica Infrastructures Inc. Kawartha Lakes Flow Monitoring Report
Appendix - A June 03, 2024
Data Chart Station: B10 Apr 01, 2023 – Apr 30, 2023
261 Civica Infrastructure Inc. www.civi.ca
Civica Infrastructures Inc. Kawartha Lakes Flow Monitoring Report
Appendix - A June 03, 2024
Data Chart Station: B10 May 01, 2023 – May 31, 2023
262 Civica Infrastructure Inc. www.civi.ca
Civica Infrastructures Inc. Kawartha Lakes Flow Monitoring Report
Appendix - A June 03, 2024
Data Chart Station: B10 Jun 01, 2023 – Jun 30, 2023
263 Civica Infrastructure Inc. www.civi.ca
Civica Infrastructures Inc. Kawartha Lakes Flow Monitoring Report
Appendix - A June 03, 2024
Data Chart Station: B10 Jul 01, 2023 – Jul 31, 2023
264 Civica Infrastructure Inc. www.civi.ca
Civica Infrastructures Inc. Kawartha Lakes Flow Monitoring Report
Appendix - A June 03, 2024
Data Chart Station: B10 Aug 01, 2023 – Aug 31, 2023
265 Civica Infrastructure Inc. www.civi.ca
Civica Infrastructures Inc. Kawartha Lakes Flow Monitoring Report
Appendix - A June 03, 2024
Data Chart Station: B10 Sep 01, 2023 – Sep 30, 2023
266 Civica Infrastructure Inc. www.civi.ca
Civica Infrastructures Inc. Kawartha Lakes Flow Monitoring Report
Appendix - A June 03, 2024
Data Chart Station: B10 Oct 01, 2023 – Oct 24, 2023
267 Civica Infrastructure Inc. www.civi.ca
Civica Infrastructures Inc. Kawartha Lakes Flow Monitoring Report
Appendix - A June 03, 2024
Sanitary Report Station: B10
1
Average Dry Weather Flow (L/s)
Average Dry Weather Flow (L/c/d)
Average Daily Minimum Dry Weather Flow (L/s)
Average Daily Peak Dry Weather Flow (L/s)
0.801
289.512
0.244
2.541
Peaking Factor
Groundwater Infiltration (L/s)1
Groundwater Infiltration (L/ha/d)
% of GWI in Average DWF
3.173
0.207
650.752
25.863
Groundwater infiltration (GWI) is assumed as 85% of the daily minimum flow averaged over the monitoring period
268 Civica Infrastructure Inc. www.civi.ca
Civica Infrastructures Inc. Kawartha Lakes Flow Monitoring Report
Appendix - A June 03, 2024
I/I Analysis Table
1
Event1
Total Precipitation (mm)
Duration (hours)
Peak Intensity Over Tc at Station (mm/hr)
Feb 09, 2023
39.75
14.42
Mar 16, 2023
19.25
Mar 31, 2023
B10 Measured Peak Flow (L/s)
Peak I/I Flow (L/s)
Peak I/I Rate (L/s/ha)
Volumetric Runoff Coefficient (CV%)
Peaking Factor (PF)
10.20
2.52
1.86
0.07
0.37 %
3.39
15.33
3.00
1.84
1.21
0.04
0.28 %
2.73
22.75
29.00
12.60
1.92
0.84
0.03
0.15 %
1.55
Apr 05, 2023
33.25
11.33
23.40
3.01
2.48
0.09
0.78 %
4.14
Apr 29, 2023
23.25
46.92
6.60
3.56
2.34
0.09
1.37 %
3.26
May 19, 2023
35.50
19.50
7.80
5.25
4.15
0.15
0.49 %
5.32
Jun 11, 2023
48.25
35.42
9.60
5.39
4.67
0.17
0.82 %
5.57
Jun 27, 2023
16.00
11.25
7.20
4.04
3.10
0.11
0.70 %
3.62
Jul 13, 2023
16.75
6.08
7.80
4.04
3.08
0.11
1.05 %
3.17
Jul 29, 2023
20.50
3.67
18.60
3.79
2.18
0.08
0.28 %
1.87
Aug 12, 2023
17.00
25.67
30.00
2.81
1.80
0.07
0.47 %
1.93
Oct 05, 2023
35.75
34.67
19.20
3.33
1.56
0.06
0.45 %
1.69
Oct 08, 2023
28.75
81.08
3.60
3.79
2.37
0.09
0.42 %
3.16
Average
27.44
25.72
12.28
3.48
2.43
0.09
0.59 %
3.18
Maximum
48.25
81.08
30.00
5.39
4.67
0.17
1.37 %
5.57
Flow KPIs
Measured Storms
Station: B10
An event is a storm with a minimum volume of 15mm and a minimum inter-event dry period of 12 hours
269 Civica Infrastructure Inc. www.civi.ca
Civica Infrastructures Inc. Kawartha Lakes Flow Monitoring Report
Appendix - A June 03, 2024
I/I Analysis Graph Station: B10
270 Civica Infrastructure Inc. www.civi.ca
Civica Infrastructures Inc. Kawartha Lakes Flow Monitoring Report
Appendix - A June 03, 2024
Infiltration/Inflow Event Analysis Station: B10 Feb 08, 2023 21:00 – Feb 10, 2023 11:25, Total Precipitation: 39.75 mm (10,931,250.00 L) Station Details
Storm Details
Catchment Area
27.50 ha
Total Precipitation
39.75 mm (10,931,250.00 L)
Duration of Storm
14.42 hr
Time of Concentration (Tc) 1
25 min
Peak Precipitation Intensity Over Tc 2
10.20 mm/hr
Return Period over Tc 3
< 2 Yr
Measured Flow
I/I Flow
Time of Peak Measured Flow
Feb 09, 2023 12:15
Time of Peak I/I Flow (TD)
Feb 09, 2023 13:40
Estimated Dry Weather Flow at TD
0.66 L/s
Peak Measured Flow
2.52 L/s
Peak I/I Flow 4
1.86 L/s
Peak I/I Rate 5
0.07 L/s/ha
Peak Measured Depth
61.00 mm
Total I/I Flow Volume during event
40,732.50 L
Volumetric Coefficient (Cv%) 6
0.37%
Total Measured Flow Volume during Event
93,060.70 L
Peak I/I Coefficient 7
0.0024
Hourly Wet-Weather Peaking Factor 8
4.07
Instantaneous Wet-Weather Peaking Factor 9
4.59
1
Time of Concentration (Tc): The estimated time for the flow to travel from the furthest point in the upstream area to the point of monitoring, assume flow is travelling at 1.00 m/s Peak Precipitation Intensity Over Tc: The peak rainfall intensity for the duration of the storm with the time interval defined by time of concentration 3 Return Period over Tc: The estimated time to elapse before a storm of equal or greater intensity will likely occur again, based on design storm criteria 4 Peak I/I Flow: The greatest difference captured between measured flow and estimated dry weather flow, Peak I/I Flow = Maximum (Measured Flow – Estimated Dry Weather Flow) 5 Peak I/I Rate: A normalized peak I/I flow based on catchment area size, Peak I/I Rate = Peak I/I Flow / Catchment Area 6 Volumetric Coefficient (Cv%): The ratio of total I/I volume and total rainfall volume, Cv% = Total I/I Flow Volume / Total Precipitation Volume * 100% 7 Peak I/ I Coefficient: The ratio of peak I/I flow and peak rainfall intensity, Peak I/ I Coefficient = Peak I/I Flow / (Peak Rainfall Intensity over Tc * Catchment Area) 8 Hourly Wet‐Weather Peaking Factor: The ratio of peak hourly wet‐weather measured flow and average dry‐weather flow, Wet‐Weather Peaking Factor = Peak Hourly Wet‐Weather Measured Flow / Average Dry-Weather Flow 9 Instantaneous Wet‐Weather Peaking Factor: The ratio of peak wet‐weather measured flow and average dry‐weather flow, Wet‐Weather Peaking Factor = Peak Wet‐Weather Measured Flow / Average Dry-Weather Flow 2
271 Civica Infrastructure Inc. www.civi.ca
Civica Infrastructures Inc. Kawartha Lakes Flow Monitoring Report
Appendix - A June 03, 2024
I/I Analysis Graph Station: B10
272 Civica Infrastructure Inc. www.civi.ca
Civica Infrastructures Inc. Kawartha Lakes Flow Monitoring Report
Appendix - A June 03, 2024
Infiltration/Inflow Event Analysis Station: B10 Mar 16, 2023 11:10 – Mar 18, 2023 02:30, Total Precipitation: 19.25 mm (5,293,750.00 L) Station Details
Storm Details
Catchment Area
27.50 ha
Total Precipitation
19.25 mm (5,293,750.00 L)
Duration of Storm
15.33 hr
Time of Concentration (Tc) 1
25 min
Peak Precipitation Intensity Over Tc 2
3.00 mm/hr
Return Period over Tc 3
< 2 Yr
Measured Flow
I/I Flow
Time of Peak Measured Flow
Mar 17, 2023 12:00
Time of Peak I/I Flow (TD)
Mar 17, 2023 12:00
Estimated Dry Weather Flow at TD
0.62 L/s
Peak Measured Flow
1.84 L/s
Peak I/I Flow 4
1.21 L/s
Peak I/I Rate 5
0.04 L/s/ha
Peak Measured Depth
53.00 mm
Total I/I Flow Volume during event
15,030.90 L
Volumetric Coefficient (Cv%) 6
0.28%
Total Measured Flow Volume during Event
58,903.40 L
Peak I/I Coefficient 7
0.0053
Hourly Wet-Weather Peaking Factor 8
2.96
Instantaneous Wet-Weather Peaking Factor 9
4.13
1
Time of Concentration (Tc): The estimated time for the flow to travel from the furthest point in the upstream area to the point of monitoring, assume flow is travelling at 1.00 m/s Peak Precipitation Intensity Over Tc: The peak rainfall intensity for the duration of the storm with the time interval defined by time of concentration 3 Return Period over Tc: The estimated time to elapse before a storm of equal or greater intensity will likely occur again, based on design storm criteria 4 Peak I/I Flow: The greatest difference captured between measured flow and estimated dry weather flow, Peak I/I Flow = Maximum (Measured Flow – Estimated Dry Weather Flow) 5 Peak I/I Rate: A normalized peak I/I flow based on catchment area size, Peak I/I Rate = Peak I/I Flow / Catchment Area 6 Volumetric Coefficient (Cv%): The ratio of total I/I volume and total rainfall volume, Cv% = Total I/I Flow Volume / Total Precipitation Volume * 100% 7 Peak I/ I Coefficient: The ratio of peak I/I flow and peak rainfall intensity, Peak I/ I Coefficient = Peak I/I Flow / (Peak Rainfall Intensity over Tc * Catchment Area) 8 Hourly Wet‐Weather Peaking Factor: The ratio of peak hourly wet‐weather measured flow and average dry‐weather flow, Wet‐Weather Peaking Factor = Peak Hourly Wet‐Weather Measured Flow / Average Dry-Weather Flow 9 Instantaneous Wet‐Weather Peaking Factor: The ratio of peak wet‐weather measured flow and average dry‐weather flow, Wet‐Weather Peaking Factor = Peak Wet‐Weather Measured Flow / Average Dry-Weather Flow 2
273 Civica Infrastructure Inc. www.civi.ca
Civica Infrastructures Inc. Kawartha Lakes Flow Monitoring Report
Appendix - A June 03, 2024
I/I Analysis Graph Station: B10
274 Civica Infrastructure Inc. www.civi.ca
Civica Infrastructures Inc. Kawartha Lakes Flow Monitoring Report
Appendix - A June 03, 2024
Infiltration/Inflow Event Analysis Station: B10 Mar 31, 2023 01:00 – Apr 02, 2023 06:00, Total Precipitation: 22.75 mm (6,256,250.00 L) Station Details
Storm Details
Catchment Area
27.50 ha
Total Precipitation
22.75 mm (6,256,250.00 L)
Duration of Storm
29.00 hr
Time of Concentration (Tc) 1
25 min
Peak Precipitation Intensity Over Tc 2
12.60 mm/hr
Return Period over Tc 3
< 2 Yr
Measured Flow
I/I Flow
Time of Peak Measured Flow
Apr 01, 2023 10:50
Time of Peak I/I Flow (TD)
Apr 01, 2023 10:50
Estimated Dry Weather Flow at TD
1.07 L/s
Peak Measured Flow
1.92 L/s
Peak I/I Flow 4
0.84 L/s
Peak I/I Rate 5
0.03 L/s/ha
Peak Measured Depth
54.00 mm
Total I/I Flow Volume during event
9,303.00 L
Volumetric Coefficient (Cv%) 6
0.15%
Total Measured Flow Volume during Event
89,838.70 L
Peak I/I Coefficient 7
0.0009
Hourly Wet-Weather Peaking Factor 8
2.64
Instantaneous Wet-Weather Peaking Factor 9
3.52
1
Time of Concentration (Tc): The estimated time for the flow to travel from the furthest point in the upstream area to the point of monitoring, assume flow is travelling at 1.00 m/s Peak Precipitation Intensity Over Tc: The peak rainfall intensity for the duration of the storm with the time interval defined by time of concentration 3 Return Period over Tc: The estimated time to elapse before a storm of equal or greater intensity will likely occur again, based on design storm criteria 4 Peak I/I Flow: The greatest difference captured between measured flow and estimated dry weather flow, Peak I/I Flow = Maximum (Measured Flow – Estimated Dry Weather Flow) 5 Peak I/I Rate: A normalized peak I/I flow based on catchment area size, Peak I/I Rate = Peak I/I Flow / Catchment Area 6 Volumetric Coefficient (Cv%): The ratio of total I/I volume and total rainfall volume, Cv% = Total I/I Flow Volume / Total Precipitation Volume * 100% 7 Peak I/ I Coefficient: The ratio of peak I/I flow and peak rainfall intensity, Peak I/ I Coefficient = Peak I/I Flow / (Peak Rainfall Intensity over Tc * Catchment Area) 8 Hourly Wet‐Weather Peaking Factor: The ratio of peak hourly wet‐weather measured flow and average dry‐weather flow, Wet‐Weather Peaking Factor = Peak Hourly Wet‐Weather Measured Flow / Average Dry-Weather Flow 9 Instantaneous Wet‐Weather Peaking Factor: The ratio of peak wet‐weather measured flow and average dry‐weather flow, Wet‐Weather Peaking Factor = Peak Wet‐Weather Measured Flow / Average Dry-Weather Flow 2
275 Civica Infrastructure Inc. www.civi.ca
Civica Infrastructures Inc. Kawartha Lakes Flow Monitoring Report
Appendix - A June 03, 2024
I/I Analysis Graph Station: B10
276 Civica Infrastructure Inc. www.civi.ca
Civica Infrastructures Inc. Kawartha Lakes Flow Monitoring Report
Appendix - A June 03, 2024
Infiltration/Inflow Event Analysis Station: B10 Apr 04, 2023 17:40 – Apr 06, 2023 05:00, Total Precipitation: 33.25 mm (9,143,750.00 L) Station Details
Storm Details
Catchment Area
27.50 ha
Total Precipitation
33.25 mm (9,143,750.00 L)
Duration of Storm
11.33 hr
Time of Concentration (Tc) 1
25 min
Peak Precipitation Intensity Over Tc 2
23.40 mm/hr
Return Period over Tc 3
< 2 Yr
Measured Flow
I/I Flow
Time of Peak Measured Flow
Apr 05, 2023 23:35
Time of Peak I/I Flow (TD)
Apr 05, 2023 23:35
Estimated Dry Weather Flow at TD
0.53 L/s
Peak Measured Flow
3.01 L/s
Peak I/I Flow 4
2.48 L/s
Peak I/I Rate 5
0.09 L/s/ha
Peak Measured Depth
66.00 mm
Total I/I Flow Volume during event
71,341.30 L
Volumetric Coefficient (Cv%) 6
0.78%
Total Measured Flow Volume during Event
121,819.10 L
Peak I/I Coefficient 7
0.0014
Hourly Wet-Weather Peaking Factor 8
3.54
Instantaneous Wet-Weather Peaking Factor 9
5.03
1
Time of Concentration (Tc): The estimated time for the flow to travel from the furthest point in the upstream area to the point of monitoring, assume flow is travelling at 1.00 m/s Peak Precipitation Intensity Over Tc: The peak rainfall intensity for the duration of the storm with the time interval defined by time of concentration 3 Return Period over Tc: The estimated time to elapse before a storm of equal or greater intensity will likely occur again, based on design storm criteria 4 Peak I/I Flow: The greatest difference captured between measured flow and estimated dry weather flow, Peak I/I Flow = Maximum (Measured Flow – Estimated Dry Weather Flow) 5 Peak I/I Rate: A normalized peak I/I flow based on catchment area size, Peak I/I Rate = Peak I/I Flow / Catchment Area 6 Volumetric Coefficient (Cv%): The ratio of total I/I volume and total rainfall volume, Cv% = Total I/I Flow Volume / Total Precipitation Volume * 100% 7 Peak I/ I Coefficient: The ratio of peak I/I flow and peak rainfall intensity, Peak I/ I Coefficient = Peak I/I Flow / (Peak Rainfall Intensity over Tc * Catchment Area) 8 Hourly Wet‐Weather Peaking Factor: The ratio of peak hourly wet‐weather measured flow and average dry‐weather flow, Wet‐Weather Peaking Factor = Peak Hourly Wet‐Weather Measured Flow / Average Dry-Weather Flow 9 Instantaneous Wet‐Weather Peaking Factor: The ratio of peak wet‐weather measured flow and average dry‐weather flow, Wet‐Weather Peaking Factor = Peak Wet‐Weather Measured Flow / Average Dry-Weather Flow 2
277 Civica Infrastructure Inc. www.civi.ca
Civica Infrastructures Inc. Kawartha Lakes Flow Monitoring Report
Appendix - A June 03, 2024
I/I Analysis Graph Station: B10
278 Civica Infrastructure Inc. www.civi.ca
Civica Infrastructures Inc. Kawartha Lakes Flow Monitoring Report
Appendix - A June 03, 2024
Infiltration/Inflow Event Analysis Station: B10 Apr 29, 2023 06:55 – May 02, 2023 05:50, Total Precipitation: 23.25 mm (6,393,750.00 L) Station Details
Storm Details
Catchment Area
27.50 ha
Total Precipitation
23.25 mm (6,393,750.00 L)
Duration of Storm
46.92 hr
Time of Concentration (Tc) 1
25 min
Peak Precipitation Intensity Over Tc 2
6.60 mm/hr
Return Period over Tc 3
< 2 Yr
Measured Flow
I/I Flow
Time of Peak Measured Flow
May 01, 2023 09:40
Time of Peak I/I Flow (TD)
May 01, 2023 09:40
Estimated Dry Weather Flow at TD
1.22 L/s
Peak Measured Flow
3.56 L/s
Peak I/I Flow 4
2.34 L/s
Peak I/I Rate 5
0.09 L/s/ha
Peak Measured Depth
71.00 mm
Total I/I Flow Volume during event
87,771.00 L
Volumetric Coefficient (Cv%) 6
1.37%
Total Measured Flow Volume during Event
240,242.90 L
Peak I/I Coefficient 7
0.0046
Hourly Wet-Weather Peaking Factor 8
3.11
Instantaneous Wet-Weather Peaking Factor 9
4.96
1
Time of Concentration (Tc): The estimated time for the flow to travel from the furthest point in the upstream area to the point of monitoring, assume flow is travelling at 1.00 m/s Peak Precipitation Intensity Over Tc: The peak rainfall intensity for the duration of the storm with the time interval defined by time of concentration 3 Return Period over Tc: The estimated time to elapse before a storm of equal or greater intensity will likely occur again, based on design storm criteria 4 Peak I/I Flow: The greatest difference captured between measured flow and estimated dry weather flow, Peak I/I Flow = Maximum (Measured Flow – Estimated Dry Weather Flow) 5 Peak I/I Rate: A normalized peak I/I flow based on catchment area size, Peak I/I Rate = Peak I/I Flow / Catchment Area 6 Volumetric Coefficient (Cv%): The ratio of total I/I volume and total rainfall volume, Cv% = Total I/I Flow Volume / Total Precipitation Volume * 100% 7 Peak I/ I Coefficient: The ratio of peak I/I flow and peak rainfall intensity, Peak I/ I Coefficient = Peak I/I Flow / (Peak Rainfall Intensity over Tc * Catchment Area) 8 Hourly Wet‐Weather Peaking Factor: The ratio of peak hourly wet‐weather measured flow and average dry‐weather flow, Wet‐Weather Peaking Factor = Peak Hourly Wet‐Weather Measured Flow / Average Dry-Weather Flow 9 Instantaneous Wet‐Weather Peaking Factor: The ratio of peak wet‐weather measured flow and average dry‐weather flow, Wet‐Weather Peaking Factor = Peak Wet‐Weather Measured Flow / Average Dry-Weather Flow 2
279 Civica Infrastructure Inc. www.civi.ca
Civica Infrastructures Inc. Kawartha Lakes Flow Monitoring Report
Appendix - A June 03, 2024
I/I Analysis Graph Station: B10
280 Civica Infrastructure Inc. www.civi.ca
Civica Infrastructures Inc. Kawartha Lakes Flow Monitoring Report
Appendix - A June 03, 2024
Infiltration/Inflow Event Analysis Station: B10 May 19, 2023 08:30 – May 21, 2023 04:00, Total Precipitation: 35.50 mm (9,762,500.00 L) Station Details
Storm Details
Catchment Area
27.50 ha
Total Precipitation
35.50 mm (9,762,500.00 L)
Duration of Storm
19.50 hr
Time of Concentration (Tc) 1
25 min
Peak Precipitation Intensity Over Tc 2
7.80 mm/hr
Return Period over Tc 3
< 2 Yr
Measured Flow
I/I Flow
Time of Peak Measured Flow
May 20, 2023 08:45
Time of Peak I/I Flow (TD)
May 20, 2023 08:45
Estimated Dry Weather Flow at TD
1.10 L/s
Peak Measured Flow
5.25 L/s
Peak I/I Flow 4
4.15 L/s
Peak I/I Rate 5
0.15 L/s/ha
Peak Measured Depth
84.00 mm
Total I/I Flow Volume during event
48,265.70 L
Volumetric Coefficient (Cv%) 6
0.49%
Total Measured Flow Volume during Event
136,844.50 L
Peak I/I Coefficient 7
0.0070
Hourly Wet-Weather Peaking Factor 8
4.71
Instantaneous Wet-Weather Peaking Factor 9
6.73
1
Time of Concentration (Tc): The estimated time for the flow to travel from the furthest point in the upstream area to the point of monitoring, assume flow is travelling at 1.00 m/s Peak Precipitation Intensity Over Tc: The peak rainfall intensity for the duration of the storm with the time interval defined by time of concentration 3 Return Period over Tc: The estimated time to elapse before a storm of equal or greater intensity will likely occur again, based on design storm criteria 4 Peak I/I Flow: The greatest difference captured between measured flow and estimated dry weather flow, Peak I/I Flow = Maximum (Measured Flow – Estimated Dry Weather Flow) 5 Peak I/I Rate: A normalized peak I/I flow based on catchment area size, Peak I/I Rate = Peak I/I Flow / Catchment Area 6 Volumetric Coefficient (Cv%): The ratio of total I/I volume and total rainfall volume, Cv% = Total I/I Flow Volume / Total Precipitation Volume * 100% 7 Peak I/ I Coefficient: The ratio of peak I/I flow and peak rainfall intensity, Peak I/ I Coefficient = Peak I/I Flow / (Peak Rainfall Intensity over Tc * Catchment Area) 8 Hourly Wet‐Weather Peaking Factor: The ratio of peak hourly wet‐weather measured flow and average dry‐weather flow, Wet‐Weather Peaking Factor = Peak Hourly Wet‐Weather Measured Flow / Average Dry-Weather Flow 9 Instantaneous Wet‐Weather Peaking Factor: The ratio of peak wet‐weather measured flow and average dry‐weather flow, Wet‐Weather Peaking Factor = Peak Wet‐Weather Measured Flow / Average Dry-Weather Flow 2
281 Civica Infrastructure Inc. www.civi.ca
Civica Infrastructures Inc. Kawartha Lakes Flow Monitoring Report
Appendix - A June 03, 2024
I/I Analysis Graph Station: B10
282 Civica Infrastructure Inc. www.civi.ca
Civica Infrastructures Inc. Kawartha Lakes Flow Monitoring Report
Appendix - A June 03, 2024
Infiltration/Inflow Event Analysis Station: B10 Jun 11, 2023 08:25 – Jun 13, 2023 19:50, Total Precipitation: 48.25 mm (13,268,750.00 L) Station Details
Storm Details
Catchment Area
27.50 ha
Total Precipitation
48.25 mm (13,268,750.00 L)
Duration of Storm
35.42 hr
Time of Concentration (Tc) 1
25 min
Peak Precipitation Intensity Over Tc 2
9.60 mm/hr
Return Period over Tc 3
< 2 Yr
Measured Flow
I/I Flow
Time of Peak Measured Flow
Jun 13, 2023 01:25
Time of Peak I/I Flow (TD)
Jun 13, 2023 01:25
Estimated Dry Weather Flow at TD
0.73 L/s
Peak Measured Flow
5.39 L/s
Peak I/I Flow 4
4.67 L/s
Peak I/I Rate 5
0.17 L/s/ha
Peak Measured Depth
85.00 mm
Total I/I Flow Volume during event
109,001.10 L
Volumetric Coefficient (Cv%) 6
0.82%
Total Measured Flow Volume during Event
252,260.00 L
Peak I/I Coefficient 7
0.0064
Hourly Wet-Weather Peaking Factor 8
3.25
Instantaneous Wet-Weather Peaking Factor 9
6.44
1
Time of Concentration (Tc): The estimated time for the flow to travel from the furthest point in the upstream area to the point of monitoring, assume flow is travelling at 1.00 m/s Peak Precipitation Intensity Over Tc: The peak rainfall intensity for the duration of the storm with the time interval defined by time of concentration 3 Return Period over Tc: The estimated time to elapse before a storm of equal or greater intensity will likely occur again, based on design storm criteria 4 Peak I/I Flow: The greatest difference captured between measured flow and estimated dry weather flow, Peak I/I Flow = Maximum (Measured Flow – Estimated Dry Weather Flow) 5 Peak I/I Rate: A normalized peak I/I flow based on catchment area size, Peak I/I Rate = Peak I/I Flow / Catchment Area 6 Volumetric Coefficient (Cv%): The ratio of total I/I volume and total rainfall volume, Cv% = Total I/I Flow Volume / Total Precipitation Volume * 100% 7 Peak I/ I Coefficient: The ratio of peak I/I flow and peak rainfall intensity, Peak I/ I Coefficient = Peak I/I Flow / (Peak Rainfall Intensity over Tc * Catchment Area) 8 Hourly Wet‐Weather Peaking Factor: The ratio of peak hourly wet‐weather measured flow and average dry‐weather flow, Wet‐Weather Peaking Factor = Peak Hourly Wet‐Weather Measured Flow / Average Dry-Weather Flow 9 Instantaneous Wet‐Weather Peaking Factor: The ratio of peak wet‐weather measured flow and average dry‐weather flow, Wet‐Weather Peaking Factor = Peak Wet‐Weather Measured Flow / Average Dry-Weather Flow 2
283 Civica Infrastructure Inc. www.civi.ca
Civica Infrastructures Inc. Kawartha Lakes Flow Monitoring Report
Appendix - A June 03, 2024
I/I Analysis Graph Station: B10
284 Civica Infrastructure Inc. www.civi.ca
Civica Infrastructures Inc. Kawartha Lakes Flow Monitoring Report
Appendix - A June 03, 2024
Infiltration/Inflow Event Analysis Station: B10 Jun 26, 2023 22:35 – Jun 28, 2023 09:50, Total Precipitation: 16.00 mm (4,400,000.00 L) Station Details
Storm Details
Catchment Area
27.50 ha
Total Precipitation
16.00 mm (4,400,000.00 L)
Duration of Storm
11.25 hr
Time of Concentration (Tc) 1
25 min
Peak Precipitation Intensity Over Tc 2
7.20 mm/hr
Return Period over Tc 3
< 2 Yr
Measured Flow
I/I Flow
Time of Peak Measured Flow
Jun 27, 2023 13:55
Time of Peak I/I Flow (TD)
Jun 27, 2023 13:55
Estimated Dry Weather Flow at TD
0.94 L/s
Peak Measured Flow
4.04 L/s
Peak I/I Flow 4
3.10 L/s
Peak I/I Rate 5
0.11 L/s/ha
Peak Measured Depth
75.00 mm
Total I/I Flow Volume during event
30,773.10 L
Volumetric Coefficient (Cv%) 6
0.70%
Total Measured Flow Volume during Event
102,653.10 L
Peak I/I Coefficient 7
0.0056
Hourly Wet-Weather Peaking Factor 8
3.68
Instantaneous Wet-Weather Peaking Factor 9
4.72
1
Time of Concentration (Tc): The estimated time for the flow to travel from the furthest point in the upstream area to the point of monitoring, assume flow is travelling at 1.00 m/s Peak Precipitation Intensity Over Tc: The peak rainfall intensity for the duration of the storm with the time interval defined by time of concentration 3 Return Period over Tc: The estimated time to elapse before a storm of equal or greater intensity will likely occur again, based on design storm criteria 4 Peak I/I Flow: The greatest difference captured between measured flow and estimated dry weather flow, Peak I/I Flow = Maximum (Measured Flow – Estimated Dry Weather Flow) 5 Peak I/I Rate: A normalized peak I/I flow based on catchment area size, Peak I/I Rate = Peak I/I Flow / Catchment Area 6 Volumetric Coefficient (Cv%): The ratio of total I/I volume and total rainfall volume, Cv% = Total I/I Flow Volume / Total Precipitation Volume * 100% 7 Peak I/ I Coefficient: The ratio of peak I/I flow and peak rainfall intensity, Peak I/ I Coefficient = Peak I/I Flow / (Peak Rainfall Intensity over Tc * Catchment Area) 8 Hourly Wet‐Weather Peaking Factor: The ratio of peak hourly wet‐weather measured flow and average dry‐weather flow, Wet‐Weather Peaking Factor = Peak Hourly Wet‐Weather Measured Flow / Average Dry-Weather Flow 9 Instantaneous Wet‐Weather Peaking Factor: The ratio of peak wet‐weather measured flow and average dry‐weather flow, Wet‐Weather Peaking Factor = Peak Wet‐Weather Measured Flow / Average Dry-Weather Flow 2
285 Civica Infrastructure Inc. www.civi.ca
Civica Infrastructures Inc. Kawartha Lakes Flow Monitoring Report
Appendix - A June 03, 2024
I/I Analysis Graph Station: B10
286 Civica Infrastructure Inc. www.civi.ca
Civica Infrastructures Inc. Kawartha Lakes Flow Monitoring Report
Appendix - A June 03, 2024
Infiltration/Inflow Event Analysis Station: B10 Jul 12, 2023 14:55 – Jul 13, 2023 21:00, Total Precipitation: 16.75 mm (4,606,250.00 L) Station Details
Storm Details
Catchment Area
27.50 ha
Total Precipitation
16.75 mm (4,606,250.00 L)
Duration of Storm
6.08 hr
Time of Concentration (Tc) 1
25 min
Peak Precipitation Intensity Over Tc 2
7.80 mm/hr
Return Period over Tc 3
< 2 Yr
Measured Flow
I/I Flow
Time of Peak Measured Flow
Jul 13, 2023 09:30
Time of Peak I/I Flow (TD)
Jul 13, 2023 16:45
Estimated Dry Weather Flow at TD
0.96 L/s
Peak Measured Flow
4.04 L/s
Peak I/I Flow 4
3.08 L/s
Peak I/I Rate 5
0.11 L/s/ha
Peak Measured Depth
75.00 mm
Total I/I Flow Volume during event
48,455.20 L
Volumetric Coefficient (Cv%) 6
1.05%
Total Measured Flow Volume during Event
111,940.20 L
Peak I/I Coefficient 7
0.0052
Hourly Wet-Weather Peaking Factor 8
3.51
Instantaneous Wet-Weather Peaking Factor 9
4.16
1
Time of Concentration (Tc): The estimated time for the flow to travel from the furthest point in the upstream area to the point of monitoring, assume flow is travelling at 1.00 m/s Peak Precipitation Intensity Over Tc: The peak rainfall intensity for the duration of the storm with the time interval defined by time of concentration 3 Return Period over Tc: The estimated time to elapse before a storm of equal or greater intensity will likely occur again, based on design storm criteria 4 Peak I/I Flow: The greatest difference captured between measured flow and estimated dry weather flow, Peak I/I Flow = Maximum (Measured Flow – Estimated Dry Weather Flow) 5 Peak I/I Rate: A normalized peak I/I flow based on catchment area size, Peak I/I Rate = Peak I/I Flow / Catchment Area 6 Volumetric Coefficient (Cv%): The ratio of total I/I volume and total rainfall volume, Cv% = Total I/I Flow Volume / Total Precipitation Volume * 100% 7 Peak I/ I Coefficient: The ratio of peak I/I flow and peak rainfall intensity, Peak I/ I Coefficient = Peak I/I Flow / (Peak Rainfall Intensity over Tc * Catchment Area) 8 Hourly Wet‐Weather Peaking Factor: The ratio of peak hourly wet‐weather measured flow and average dry‐weather flow, Wet‐Weather Peaking Factor = Peak Hourly Wet‐Weather Measured Flow / Average Dry-Weather Flow 9 Instantaneous Wet‐Weather Peaking Factor: The ratio of peak wet‐weather measured flow and average dry‐weather flow, Wet‐Weather Peaking Factor = Peak Wet‐Weather Measured Flow / Average Dry-Weather Flow 2
287 Civica Infrastructure Inc. www.civi.ca
Civica Infrastructures Inc. Kawartha Lakes Flow Monitoring Report
Appendix - A June 03, 2024
I/I Analysis Graph Station: B10
288 Civica Infrastructure Inc. www.civi.ca
Civica Infrastructures Inc. Kawartha Lakes Flow Monitoring Report
Appendix - A June 03, 2024
Infiltration/Inflow Event Analysis Station: B10 Jul 28, 2023 20:05 – Jul 29, 2023 23:45, Total Precipitation: 20.50 mm (5,637,500.00 L) Station Details
Storm Details
Catchment Area
27.50 ha
Total Precipitation
20.50 mm (5,637,500.00 L)
Duration of Storm
3.67 hr
Time of Concentration (Tc) 1
25 min
Peak Precipitation Intensity Over Tc 2
18.60 mm/hr
Return Period over Tc 3
< 2 Yr
Measured Flow
I/I Flow
Time of Peak Measured Flow
Jul 29, 2023 11:00
Time of Peak I/I Flow (TD)
Jul 29, 2023 11:00
Estimated Dry Weather Flow at TD
1.62 L/s
Peak Measured Flow
3.79 L/s
Peak I/I Flow 4
2.18 L/s
Peak I/I Rate 5
0.08 L/s/ha
Peak Measured Depth
73.00 mm
Total I/I Flow Volume during event
15,719.10 L
Volumetric Coefficient (Cv%) 6
0.28%
Total Measured Flow Volume during Event
81,824.80 L
Peak I/I Coefficient 7
0.0015
Hourly Wet-Weather Peaking Factor 8
1.84
Instantaneous Wet-Weather Peaking Factor 9
3.25
1
Time of Concentration (Tc): The estimated time for the flow to travel from the furthest point in the upstream area to the point of monitoring, assume flow is travelling at 1.00 m/s Peak Precipitation Intensity Over Tc: The peak rainfall intensity for the duration of the storm with the time interval defined by time of concentration 3 Return Period over Tc: The estimated time to elapse before a storm of equal or greater intensity will likely occur again, based on design storm criteria 4 Peak I/I Flow: The greatest difference captured between measured flow and estimated dry weather flow, Peak I/I Flow = Maximum (Measured Flow – Estimated Dry Weather Flow) 5 Peak I/I Rate: A normalized peak I/I flow based on catchment area size, Peak I/I Rate = Peak I/I Flow / Catchment Area 6 Volumetric Coefficient (Cv%): The ratio of total I/I volume and total rainfall volume, Cv% = Total I/I Flow Volume / Total Precipitation Volume * 100% 7 Peak I/ I Coefficient: The ratio of peak I/I flow and peak rainfall intensity, Peak I/ I Coefficient = Peak I/I Flow / (Peak Rainfall Intensity over Tc * Catchment Area) 8 Hourly Wet‐Weather Peaking Factor: The ratio of peak hourly wet‐weather measured flow and average dry‐weather flow, Wet‐Weather Peaking Factor = Peak Hourly Wet‐Weather Measured Flow / Average Dry-Weather Flow 9 Instantaneous Wet‐Weather Peaking Factor: The ratio of peak wet‐weather measured flow and average dry‐weather flow, Wet‐Weather Peaking Factor = Peak Wet‐Weather Measured Flow / Average Dry-Weather Flow 2
289 Civica Infrastructure Inc. www.civi.ca
Civica Infrastructures Inc. Kawartha Lakes Flow Monitoring Report
Appendix - A June 03, 2024
I/I Analysis Graph Station: B10
290 Civica Infrastructure Inc. www.civi.ca
Civica Infrastructures Inc. Kawartha Lakes Flow Monitoring Report
Appendix - A June 03, 2024
Infiltration/Inflow Event Analysis Station: B10 Aug 11, 2023 21:25 – Aug 13, 2023 23:05, Total Precipitation: 17.00 mm (4,675,000.00 L) Station Details
Storm Details
Catchment Area
27.50 ha
Total Precipitation
17.00 mm (4,675,000.00 L)
Duration of Storm
25.67 hr
Time of Concentration (Tc) 1
25 min
Peak Precipitation Intensity Over Tc 2
30.00 mm/hr
Return Period over Tc 3
< 2 Yr
Measured Flow
I/I Flow
Time of Peak Measured Flow
Aug 12, 2023 18:55
Time of Peak I/I Flow (TD)
Aug 12, 2023 18:55
Estimated Dry Weather Flow at TD
1.01 L/s
Peak Measured Flow
2.81 L/s
Peak I/I Flow 4
1.80 L/s
Peak I/I Rate 5
0.07 L/s/ha
Peak Measured Depth
64.00 mm
Total I/I Flow Volume during event
21,860.90 L
Volumetric Coefficient (Cv%) 6
0.47%
Total Measured Flow Volume during Event
148,165.90 L
Peak I/I Coefficient 7
0.0008
Hourly Wet-Weather Peaking Factor 8
2.55
Instantaneous Wet-Weather Peaking Factor 9
3.02
1
Time of Concentration (Tc): The estimated time for the flow to travel from the furthest point in the upstream area to the point of monitoring, assume flow is travelling at 1.00 m/s Peak Precipitation Intensity Over Tc: The peak rainfall intensity for the duration of the storm with the time interval defined by time of concentration 3 Return Period over Tc: The estimated time to elapse before a storm of equal or greater intensity will likely occur again, based on design storm criteria 4 Peak I/I Flow: The greatest difference captured between measured flow and estimated dry weather flow, Peak I/I Flow = Maximum (Measured Flow – Estimated Dry Weather Flow) 5 Peak I/I Rate: A normalized peak I/I flow based on catchment area size, Peak I/I Rate = Peak I/I Flow / Catchment Area 6 Volumetric Coefficient (Cv%): The ratio of total I/I volume and total rainfall volume, Cv% = Total I/I Flow Volume / Total Precipitation Volume * 100% 7 Peak I/ I Coefficient: The ratio of peak I/I flow and peak rainfall intensity, Peak I/ I Coefficient = Peak I/I Flow / (Peak Rainfall Intensity over Tc * Catchment Area) 8 Hourly Wet‐Weather Peaking Factor: The ratio of peak hourly wet‐weather measured flow and average dry‐weather flow, Wet‐Weather Peaking Factor = Peak Hourly Wet‐Weather Measured Flow / Average Dry-Weather Flow 9 Instantaneous Wet‐Weather Peaking Factor: The ratio of peak wet‐weather measured flow and average dry‐weather flow, Wet‐Weather Peaking Factor = Peak Wet‐Weather Measured Flow / Average Dry-Weather Flow 2
291 Civica Infrastructure Inc. www.civi.ca
Civica Infrastructures Inc. Kawartha Lakes Flow Monitoring Report
Appendix - A June 03, 2024
I/I Analysis Graph Station: B10
292 Civica Infrastructure Inc. www.civi.ca
Civica Infrastructures Inc. Kawartha Lakes Flow Monitoring Report
Appendix - A June 03, 2024
Infiltration/Inflow Event Analysis Station: B10 Oct 05, 2023 08:40 – Oct 07, 2023 19:20, Total Precipitation: 35.75 mm (9,831,250.00 L) Station Details
Storm Details
Catchment Area
27.50 ha
Total Precipitation
35.75 mm (9,831,250.00 L)
Duration of Storm
34.67 hr
Time of Concentration (Tc) 1
25 min
Peak Precipitation Intensity Over Tc 2
19.20 mm/hr
Return Period over Tc 3
< 2 Yr
Measured Flow
I/I Flow
Time of Peak Measured Flow
Oct 07, 2023 10:45
Time of Peak I/I Flow (TD)
Oct 06, 2023 18:30
Estimated Dry Weather Flow at TD
1.15 L/s
Peak Measured Flow
3.33 L/s
Peak I/I Flow 4
1.56 L/s
Peak I/I Rate 5
0.06 L/s/ha
Peak Measured Depth
69.00 mm
Total I/I Flow Volume during event
44,160.90 L
Volumetric Coefficient (Cv%) 6
0.45%
Total Measured Flow Volume during Event
199,548.30 L
Peak I/I Coefficient 7
0.0011
Hourly Wet-Weather Peaking Factor 8
2.76
Instantaneous Wet-Weather Peaking Factor 9
3.61
1
Time of Concentration (Tc): The estimated time for the flow to travel from the furthest point in the upstream area to the point of monitoring, assume flow is travelling at 1.00 m/s Peak Precipitation Intensity Over Tc: The peak rainfall intensity for the duration of the storm with the time interval defined by time of concentration 3 Return Period over Tc: The estimated time to elapse before a storm of equal or greater intensity will likely occur again, based on design storm criteria 4 Peak I/I Flow: The greatest difference captured between measured flow and estimated dry weather flow, Peak I/I Flow = Maximum (Measured Flow – Estimated Dry Weather Flow) 5 Peak I/I Rate: A normalized peak I/I flow based on catchment area size, Peak I/I Rate = Peak I/I Flow / Catchment Area 6 Volumetric Coefficient (Cv%): The ratio of total I/I volume and total rainfall volume, Cv% = Total I/I Flow Volume / Total Precipitation Volume * 100% 7 Peak I/ I Coefficient: The ratio of peak I/I flow and peak rainfall intensity, Peak I/ I Coefficient = Peak I/I Flow / (Peak Rainfall Intensity over Tc * Catchment Area) 8 Hourly Wet‐Weather Peaking Factor: The ratio of peak hourly wet‐weather measured flow and average dry‐weather flow, Wet‐Weather Peaking Factor = Peak Hourly Wet‐Weather Measured Flow / Average Dry-Weather Flow 9 Instantaneous Wet‐Weather Peaking Factor: The ratio of peak wet‐weather measured flow and average dry‐weather flow, Wet‐Weather Peaking Factor = Peak Wet‐Weather Measured Flow / Average Dry-Weather Flow 2
293 Civica Infrastructure Inc. www.civi.ca
Civica Infrastructures Inc. Kawartha Lakes Flow Monitoring Report
Appendix - A June 03, 2024
I/I Analysis Graph Station: B10
294 Civica Infrastructure Inc. www.civi.ca
Civica Infrastructures Inc. Kawartha Lakes Flow Monitoring Report
Appendix - A June 03, 2024
Infiltration/Inflow Event Analysis Station: B10 Oct 08, 2023 02:50 – Oct 12, 2023 11:55, Total Precipitation: 28.75 mm (7,906,250.00 L) Station Details
Storm Details
Catchment Area
27.50 ha
Total Precipitation
28.75 mm (7,906,250.00 L)
Duration of Storm
81.08 hr
Time of Concentration (Tc) 1
25 min
Peak Precipitation Intensity Over Tc 2
3.60 mm/hr
Return Period over Tc 3
< 2 Yr
Measured Flow
I/I Flow
Time of Peak Measured Flow
Oct 12, 2023 09:25
Time of Peak I/I Flow (TD)
Oct 12, 2023 09:25
Estimated Dry Weather Flow at TD
1.43 L/s
Peak Measured Flow
3.79 L/s
Peak I/I Flow 4
2.37 L/s
Peak I/I Rate 5
0.09 L/s/ha
Peak Measured Depth
73.00 mm
Total I/I Flow Volume during event
33,474.20 L
Volumetric Coefficient (Cv%) 6
0.42%
Total Measured Flow Volume during Event
284,656.80 L
Peak I/I Coefficient 7
0.0086
Hourly Wet-Weather Peaking Factor 8
3.53
Instantaneous Wet-Weather Peaking Factor 9
5.06
1
Time of Concentration (Tc): The estimated time for the flow to travel from the furthest point in the upstream area to the point of monitoring, assume flow is travelling at 1.00 m/s Peak Precipitation Intensity Over Tc: The peak rainfall intensity for the duration of the storm with the time interval defined by time of concentration 3 Return Period over Tc: The estimated time to elapse before a storm of equal or greater intensity will likely occur again, based on design storm criteria 4 Peak I/I Flow: The greatest difference captured between measured flow and estimated dry weather flow, Peak I/I Flow = Maximum (Measured Flow – Estimated Dry Weather Flow) 5 Peak I/I Rate: A normalized peak I/I flow based on catchment area size, Peak I/I Rate = Peak I/I Flow / Catchment Area 6 Volumetric Coefficient (Cv%): The ratio of total I/I volume and total rainfall volume, Cv% = Total I/I Flow Volume / Total Precipitation Volume * 100% 7 Peak I/ I Coefficient: The ratio of peak I/I flow and peak rainfall intensity, Peak I/ I Coefficient = Peak I/I Flow / (Peak Rainfall Intensity over Tc * Catchment Area) 8 Hourly Wet‐Weather Peaking Factor: The ratio of peak hourly wet‐weather measured flow and average dry‐weather flow, Wet‐Weather Peaking Factor = Peak Hourly Wet‐Weather Measured Flow / Average Dry-Weather Flow 9 Instantaneous Wet‐Weather Peaking Factor: The ratio of peak wet‐weather measured flow and average dry‐weather flow, Wet‐Weather Peaking Factor = Peak Wet‐Weather Measured Flow / Average Dry-Weather Flow 2
295 Civica Infrastructure Inc. www.civi.ca
Civica Infrastructures Inc. Kawartha Lakes Flow Monitoring Report
Appendix - A June 03, 2024
Activity Log Station: B10 Date Time
Type
Purpose of Visit
31-Jan-2023 12:43:00 PM
Installation Log
INSTALL
06-Mar-2023 01:53:00 PM
Maintenance Log
CALIBRATION
Comment SITE ASSESSED, MEASUREMENTS TAKEN,TRAFFIC CONTROL & CSE SET,BEFORE AND AFTER INSTALL PHOTOS TAKEN,LOGGER CALIBRATED AND STARTED,LIDOTT INSTALLED WITH EXTNDEER,BEFORE AND AFTER MEASUREMENTS TAKEN,FLUME LEVELLED,VIDEOS TAKEN TC SET, DATA DOWNLOADED,TELEMETRY SENT,DEBRIS AND SILT REMOVED,SITE CALIBRATED,ANTENNA IN GOOD CONDITION,PHOTOS AND VIDEOS TAKEN, SNOW CLEARED
Calibration Measurement Yes Yes
15-Mar-2023 09:53:00 AM
Maintenance Log
CALIBRATION
DATA DOWNLOADED, TELEMETRY SENT AND CHECKED, ENTRY MADE, SITE CALIBRATED, PHOTO AND VIDEO TAKEN DEBRIS CLEARED
10-May-2023 11:17:00 AM
Maintenance Log
CALIBRATION
TC SET,SURVEY SENT,DOWNLOADED DATA, SENT TELEMETRY, MADE ENTRY, TOOK PHOTOS/VIDEOS, TOOK MEASUREMENTS,DEBRIS AND SILT CLEARED, CALIBRATED SITE,SITE CLEARED
Yes
24-Oct-2023 12:45:00 PM
Removal Log
REMOVAL
SET UP CS/TC, DOWNLOAD DATA, SENT TELEMETRY, TOOK MEASUREMENTS, CALIBRATED SITE, REMOVED ALL EQUIPMENT, REMOVAL COMPLETE, PMAC ID:8366
Yes
296 Civica Infrastructure Inc. www.civi.ca
Yes
Civica Infrastructures Inc. Kawartha Lakes Flow Monitoring Report
Appendix - A June 03, 2024
Aggregate Data Station: Bobcaygeon
Precipitation
1
Date From
Date To
Days
Min (mm)
Avg (mm)
Max (mm)
Sum (mm)
Count
Time of Min1
Time of Max1
Jan 01, 2023
Nov 02, 2023
306
0.00
0.01
15.75
775.25
88,032
Sun Jan 01, 2023 00:00
Thu Aug 03, 2023 16:20
Time of Min and Time of Max will be displayed by first occurrence
297 Civica Infrastructure Inc. www.civi.ca
Civica Infrastructures Inc. Kawartha Lakes Flow Monitoring Report
Appendix - A June 03, 2024
Data Chart Station: Bobcaygeon Jan 01, 2023 – Jan 31, 2023
298 Civica Infrastructure Inc. www.civi.ca
Civica Infrastructures Inc. Kawartha Lakes Flow Monitoring Report
Appendix - A June 03, 2024
Data Chart Station: Bobcaygeon Feb 01, 2023 – Feb 28, 2023
299 Civica Infrastructure Inc. www.civi.ca
Civica Infrastructures Inc. Kawartha Lakes Flow Monitoring Report
Appendix - A June 03, 2024
Data Chart Station: Bobcaygeon Mar 01, 2023 – Mar 31, 2023
300 Civica Infrastructure Inc. www.civi.ca
Civica Infrastructures Inc. Kawartha Lakes Flow Monitoring Report
Appendix - A June 03, 2024
Data Chart Station: Bobcaygeon Apr 01, 2023 – Apr 30, 2023
301 Civica Infrastructure Inc. www.civi.ca
Civica Infrastructures Inc. Kawartha Lakes Flow Monitoring Report
Appendix - A June 03, 2024
Data Chart Station: Bobcaygeon May 01, 2023 – May 31, 2023
302 Civica Infrastructure Inc. www.civi.ca
Civica Infrastructures Inc. Kawartha Lakes Flow Monitoring Report
Appendix - A June 03, 2024
Data Chart Station: Bobcaygeon Jun 01, 2023 – Jun 30, 2023
303 Civica Infrastructure Inc. www.civi.ca
Civica Infrastructures Inc. Kawartha Lakes Flow Monitoring Report
Appendix - A June 03, 2024
Data Chart Station: Bobcaygeon Jul 01, 2023 – Jul 31, 2023
304 Civica Infrastructure Inc. www.civi.ca
Civica Infrastructures Inc. Kawartha Lakes Flow Monitoring Report
Appendix - A June 03, 2024
Data Chart Station: Bobcaygeon Aug 01, 2023 – Aug 31, 2023
305 Civica Infrastructure Inc. www.civi.ca
Civica Infrastructures Inc. Kawartha Lakes Flow Monitoring Report
Appendix - A June 03, 2024
Data Chart Station: Bobcaygeon Sep 01, 2023 – Sep 30, 2023
306 Civica Infrastructure Inc. www.civi.ca
Civica Infrastructures Inc. Kawartha Lakes Flow Monitoring Report
Appendix - A June 03, 2024
Data Chart Station: Bobcaygeon Oct 01, 2023 – Oct 31, 2023
307 Civica Infrastructure Inc. www.civi.ca
Civica Infrastructures Inc. Kawartha Lakes Flow Monitoring Report
Appendix - A June 03, 2024
Data Chart Station: Bobcaygeon Nov 01, 2023 – Nov 02, 2023
308 Civica Infrastructure Inc. www.civi.ca
Civica Infrastructures Inc. Kawartha Lakes Flow Monitoring Report
Appendix - A June 03, 2024
Activity Log Station: Bobcaygeon Date Time
Type
Purpose of Visit
Comment
Calibration Measurement
01-Nov-2023 12:21:00 PM
Removal Log
REMOVAL
ROOF ACCESSED, PHOTOS AND VIDEOS TAKEN, TELEMETRY NOT SENT, DATA DOWNLOADED, RG REMOVED. RG WAS NOT STARTED, IT WAS ALREADY STOPPED.
No
309 Civica Infrastructure Inc. www.civi.ca
Civica Infrastructures Inc. Kawartha Lakes Flow Monitoring Report
Appendix - A June 03, 2024
Aggregate Data Station: F1
Precipitation Date From
Date To
Days
Min (mm)
Avg (mm)
Max (mm)
Sum (mm)
Count
Time of Min1
Time of Max1
Jan 16, 2023
Oct 17, 2023
230
0.00
0.01
7.87
541.05
65,609
Tue Feb 21, 2023 12:55
Sat Aug 12, 2023 10:35
Level Date From
Date To
Days
Min (m)
Avg (m)
Max (m)
Count
Time of Min1
Time of Max1
Jan 16, 2023
Oct 17, 2023
232
0.00
0.04
0.12
66,179
Mon Jan 30, 2023 03:35
Wed Apr 05, 2023 21:50
Velocity Date From
Date To
Days
Min (m/s)
Avg (m/s)
Max (m/s)
Count
Time of Min1
Time of Max1
Jan 16, 2023
Oct 17, 2023
232
0.25
0.84
1.73
66,179
Fri Sep 22, 2023 05:10
Thu Feb 09, 2023 15:55
Flow
1
Date From
Date To
Days
Min (L/s)
Avg (L/s)
Max (L/s)
Total Volume (1,000,000 L)
Count
Time of Min1
Time of Max1
Jan 16, 2023
Oct 17, 2023
232
0.35
10.58
71.69
209.96
66,179
Wed Sep 20, 2023 02:05
Thu Feb 09, 2023 19:00
Time of Min and Time of Max will be displayed by first occurrence
310 Civica Infrastructure Inc. www.civi.ca
Civica Infrastructures Inc. Kawartha Lakes Flow Monitoring Report
Appendix - A June 03, 2024
Data Chart Station: F1 Jan 16, 2023 – Jan 31, 2023
311 Civica Infrastructure Inc. www.civi.ca
Civica Infrastructures Inc. Kawartha Lakes Flow Monitoring Report
Appendix - A June 03, 2024
Data Chart Station: F1 Feb 01, 2023 – Feb 28, 2023
312 Civica Infrastructure Inc. www.civi.ca
Civica Infrastructures Inc. Kawartha Lakes Flow Monitoring Report
Appendix - A June 03, 2024
Data Chart Station: F1 Mar 01, 2023 – Mar 31, 2023
313 Civica Infrastructure Inc. www.civi.ca
Civica Infrastructures Inc. Kawartha Lakes Flow Monitoring Report
Appendix - A June 03, 2024
Data Chart Station: F1 Apr 01, 2023 – Apr 30, 2023
314 Civica Infrastructure Inc. www.civi.ca
Civica Infrastructures Inc. Kawartha Lakes Flow Monitoring Report
Appendix - A June 03, 2024
Data Chart Station: F1 May 01, 2023 – May 31, 2023
315 Civica Infrastructure Inc. www.civi.ca
Civica Infrastructures Inc. Kawartha Lakes Flow Monitoring Report
Appendix - A June 03, 2024
Data Chart Station: F1 Jun 01, 2023 – Jun 30, 2023
316 Civica Infrastructure Inc. www.civi.ca
Civica Infrastructures Inc. Kawartha Lakes Flow Monitoring Report
Appendix - A June 03, 2024
Data Chart Station: F1 Jul 01, 2023 – Jul 31, 2023
317 Civica Infrastructure Inc. www.civi.ca
Civica Infrastructures Inc. Kawartha Lakes Flow Monitoring Report
Appendix - A June 03, 2024
Data Chart Station: F1 Aug 01, 2023 – Aug 31, 2023
318 Civica Infrastructure Inc. www.civi.ca
Civica Infrastructures Inc. Kawartha Lakes Flow Monitoring Report
Appendix - A June 03, 2024
Data Chart Station: F1 Sep 01, 2023 – Sep 30, 2023
319 Civica Infrastructure Inc. www.civi.ca
Civica Infrastructures Inc. Kawartha Lakes Flow Monitoring Report
Appendix - A June 03, 2024
Data Chart Station: F1 Oct 01, 2023 – Oct 17, 2023
320 Civica Infrastructure Inc. www.civi.ca
Civica Infrastructures Inc. Kawartha Lakes Flow Monitoring Report
Appendix - A June 03, 2024
Sanitary Report Station: F1
1
Average Dry Weather Flow (L/s)
Average Dry Weather Flow (L/c/d)
Average Daily Minimum Dry Weather Flow (L/s)
Average Daily Peak Dry Weather Flow (L/s)
8.844
461.989
1.827
37.928
Peaking Factor
Groundwater Infiltration (L/s)1
Groundwater Infiltration (L/ha/d)
% of GWI in Average DWF
4.289
1.553
1,265.476
17.556
Groundwater infiltration (GWI) is assumed as 85% of the daily minimum flow averaged over the monitoring period
321 Civica Infrastructure Inc. www.civi.ca
Civica Infrastructures Inc. Kawartha Lakes Flow Monitoring Report
Appendix - A June 03, 2024
I/I Analysis Table
1 2
Event1
Total Precipitation (mm)
Duration (hours)
Peak Intensity Over Tc at Station (mm/hr)
Mar 31, 2023
22.25
18.08
Apr 05, 2023
33.75
Apr 30, 2023
F1 Measured Peak Flow (L/s)
Peak I/I Flow (L/s)
Peak I/I Rate (L/s/ha)
Volumetric Runoff Coefficient (CV%)
Peaking Factor (PF)
6.00
59.31
43.97
0.42
3.70 %
3.37
10.58
16.00
71.19
60.81
0.57
7.11 %
4.75
24.75
7.92
7.50
53.62
44.40
0.42
3.47 %
5.12
May 19, 2023
38.75
14.75
13.00
N/A 2
Jun 11, 2023
46.50
25.92
7.50
N/A 2
Jun 23, 2023
20.50
38.25
26.50
N/A 2
Jun 25, 2023
18.25
1.42
20.50
Jun 26, 2023
20.25
8.50
19.50
Jun 27, 2023
15.00
7.92
Jul 13, 2023
19.00
Jul 29, 2023
Flow KPIs
Measured Storms
Station: F1
29.99
19.84
0.19
1.02 %
2.70
37.70
26.69
0.25
1.58 %
3.07
11.00
45.25
37.21
0.35
2.67 %
4.66
4.33
8.50
29.18
20.09
0.19
0.87 %
2.84
19.05
3.08
28.40
39.91
30.58
0.29
1.03 %
3.88
Aug 12, 2023
23.11
10.50
31.50
34.95
27.45
0.26
1.24 %
4.34
Oct 05, 2023
23.11
23.58
9.70
33.33
30.60
0.29
2.08 %
6.79
Oct 08, 2023
29.46
34.17
6.10
41.86
36.29
0.34
3.09 %
6.76
Average
25.27
14.93
15.12
43.30
34.36
0.32
2.53 %
4.39
Maximum
46.50
38.25
31.50
71.19
60.81
0.57
7.11 %
6.79
An event is a storm with a minimum volume of 15mm and a minimum inter-event dry period of 12 hours I/I event analysis unable to be completed due to missing flow monitoring data during event
322 Civica Infrastructure Inc. www.civi.ca
Civica Infrastructures Inc. Kawartha Lakes Flow Monitoring Report
Appendix - A June 03, 2024
I/I Analysis Graph Station: F1
323 Civica Infrastructure Inc. www.civi.ca
Civica Infrastructures Inc. Kawartha Lakes Flow Monitoring Report
Appendix - A June 03, 2024
Infiltration/Inflow Event Analysis Station: F1 Mar 31, 2023 01:02 – Apr 01, 2023 19:07, Total Precipitation: 22.25 mm (23,587,225.00 L) Station Details
Storm Details
Catchment Area
106.01 ha
Total Precipitation
22.25 mm (23,587,225.00 L)
Duration of Storm
18.08 hr
Time of Concentration (Tc) 1
30 min
Peak Precipitation Intensity Over Tc 2
6.00 mm/hr
Return Period over Tc 3
< 2 Yr
Measured Flow
I/I Flow
Time of Peak Measured Flow
Apr 01, 2023 09:15
Time of Peak I/I Flow (TD)
Apr 01, 2023 12:05
Estimated Dry Weather Flow at TD
14.81 L/s
Peak Measured Flow
59.31 L/s
Peak I/I Flow 4
43.97 L/s
Peak I/I Rate 5
0.42 L/s/ha
Peak Measured Depth
107.00 mm
Total I/I Flow Volume during event
872,587.30 L
Volumetric Coefficient (Cv%) 6
3.70%
Total Measured Flow Volume during Event
2,286,195.20 L
Peak I/I Coefficient 7
0.0249
Hourly Wet-Weather Peaking Factor 8
2.89
Instantaneous Wet-Weather Peaking Factor 9
4.54
1
Time of Concentration (Tc): The estimated time for the flow to travel from the furthest point in the upstream area to the point of monitoring, assume flow is travelling at 1.00 m/s Peak Precipitation Intensity Over Tc: The peak rainfall intensity for the duration of the storm with the time interval defined by time of concentration 3 Return Period over Tc: The estimated time to elapse before a storm of equal or greater intensity will likely occur again, based on design storm criteria 4 Peak I/I Flow: The greatest difference captured between measured flow and estimated dry weather flow, Peak I/I Flow = Maximum (Measured Flow – Estimated Dry Weather Flow) 5 Peak I/I Rate: A normalized peak I/I flow based on catchment area size, Peak I/I Rate = Peak I/I Flow / Catchment Area 6 Volumetric Coefficient (Cv%): The ratio of total I/I volume and total rainfall volume, Cv% = Total I/I Flow Volume / Total Precipitation Volume * 100% 7 Peak I/ I Coefficient: The ratio of peak I/I flow and peak rainfall intensity, Peak I/ I Coefficient = Peak I/I Flow / (Peak Rainfall Intensity over Tc * Catchment Area) 8 Hourly Wet‐Weather Peaking Factor: The ratio of peak hourly wet‐weather measured flow and average dry‐weather flow, Wet‐Weather Peaking Factor = Peak Hourly Wet‐Weather Measured Flow / Average Dry-Weather Flow 9 Instantaneous Wet‐Weather Peaking Factor: The ratio of peak wet‐weather measured flow and average dry‐weather flow, Wet‐Weather Peaking Factor = Peak Wet‐Weather Measured Flow / Average Dry-Weather Flow 2
324 Civica Infrastructure Inc. www.civi.ca
Civica Infrastructures Inc. Kawartha Lakes Flow Monitoring Report
Appendix - A June 03, 2024
I/I Analysis Graph Station: F1
325 Civica Infrastructure Inc. www.civi.ca
Civica Infrastructures Inc. Kawartha Lakes Flow Monitoring Report
Appendix - A June 03, 2024
Infiltration/Inflow Event Analysis Station: F1 Apr 04, 2023 17:42 – Apr 06, 2023 04:17, Total Precipitation: 33.75 mm (35,778,375.00 L) Station Details
Storm Details
Catchment Area
106.01 ha
Total Precipitation
33.75 mm (35,778,375.00 L)
Duration of Storm
10.58 hr
Time of Concentration (Tc) 1
30 min
Peak Precipitation Intensity Over Tc 2
16.00 mm/hr
Return Period over Tc 3
< 2 Yr
Measured Flow
I/I Flow
Time of Peak Measured Flow
Apr 05, 2023 21:50
Time of Peak I/I Flow (TD)
Apr 05, 2023 21:50
Estimated Dry Weather Flow at TD
10.38 L/s
Peak Measured Flow
71.19 L/s
Peak I/I Flow 4
60.81 L/s
Peak I/I Rate 5
0.57 L/s/ha
Peak Measured Depth
121.00 mm
Total I/I Flow Volume during event
2,543,682.10 L
Volumetric Coefficient (Cv%) 6
7.11%
Total Measured Flow Volume during Event
3,584,945.00 L
Peak I/I Coefficient 7
0.0129
Hourly Wet-Weather Peaking Factor 8
4.55
Instantaneous Wet-Weather Peaking Factor 9
5.56
1
Time of Concentration (Tc): The estimated time for the flow to travel from the furthest point in the upstream area to the point of monitoring, assume flow is travelling at 1.00 m/s Peak Precipitation Intensity Over Tc: The peak rainfall intensity for the duration of the storm with the time interval defined by time of concentration 3 Return Period over Tc: The estimated time to elapse before a storm of equal or greater intensity will likely occur again, based on design storm criteria 4 Peak I/I Flow: The greatest difference captured between measured flow and estimated dry weather flow, Peak I/I Flow = Maximum (Measured Flow – Estimated Dry Weather Flow) 5 Peak I/I Rate: A normalized peak I/I flow based on catchment area size, Peak I/I Rate = Peak I/I Flow / Catchment Area 6 Volumetric Coefficient (Cv%): The ratio of total I/I volume and total rainfall volume, Cv% = Total I/I Flow Volume / Total Precipitation Volume * 100% 7 Peak I/ I Coefficient: The ratio of peak I/I flow and peak rainfall intensity, Peak I/ I Coefficient = Peak I/I Flow / (Peak Rainfall Intensity over Tc * Catchment Area) 8 Hourly Wet‐Weather Peaking Factor: The ratio of peak hourly wet‐weather measured flow and average dry‐weather flow, Wet‐Weather Peaking Factor = Peak Hourly Wet‐Weather Measured Flow / Average Dry-Weather Flow 9 Instantaneous Wet‐Weather Peaking Factor: The ratio of peak wet‐weather measured flow and average dry‐weather flow, Wet‐Weather Peaking Factor = Peak Wet‐Weather Measured Flow / Average Dry-Weather Flow 2
326 Civica Infrastructure Inc. www.civi.ca
Civica Infrastructures Inc. Kawartha Lakes Flow Monitoring Report
Appendix - A June 03, 2024
I/I Analysis Graph Station: F1
327 Civica Infrastructure Inc. www.civi.ca
Civica Infrastructures Inc. Kawartha Lakes Flow Monitoring Report
Appendix - A June 03, 2024
Infiltration/Inflow Event Analysis Station: F1 Apr 30, 2023 00:27 – May 01, 2023 08:22, Total Precipitation: 24.75 mm (26,237,475.00 L) Station Details
Storm Details
Catchment Area
106.01 ha
Total Precipitation
24.75 mm (26,237,475.00 L)
Duration of Storm
7.92 hr
Time of Concentration (Tc) 1
30 min
Peak Precipitation Intensity Over Tc 2
7.50 mm/hr
Return Period over Tc 3
< 2 Yr
Measured Flow
I/I Flow
Time of Peak Measured Flow
May 01, 2023 06:10
Time of Peak I/I Flow (TD)
May 01, 2023 06:10
Estimated Dry Weather Flow at TD
9.23 L/s
Peak Measured Flow
53.62 L/s
Peak I/I Flow 4
44.40 L/s
Peak I/I Rate 5
0.42 L/s/ha
Peak Measured Depth
103.00 mm
Total I/I Flow Volume during event
909,056.00 L
Volumetric Coefficient (Cv%) 6
3.47%
Total Measured Flow Volume during Event
1,531,043.00 L
Peak I/I Coefficient 7
0.0201
Hourly Wet-Weather Peaking Factor 8
3.96
Instantaneous Wet-Weather Peaking Factor 9
6.18
1
Time of Concentration (Tc): The estimated time for the flow to travel from the furthest point in the upstream area to the point of monitoring, assume flow is travelling at 1.00 m/s Peak Precipitation Intensity Over Tc: The peak rainfall intensity for the duration of the storm with the time interval defined by time of concentration 3 Return Period over Tc: The estimated time to elapse before a storm of equal or greater intensity will likely occur again, based on design storm criteria 4 Peak I/I Flow: The greatest difference captured between measured flow and estimated dry weather flow, Peak I/I Flow = Maximum (Measured Flow – Estimated Dry Weather Flow) 5 Peak I/I Rate: A normalized peak I/I flow based on catchment area size, Peak I/I Rate = Peak I/I Flow / Catchment Area 6 Volumetric Coefficient (Cv%): The ratio of total I/I volume and total rainfall volume, Cv% = Total I/I Flow Volume / Total Precipitation Volume * 100% 7 Peak I/ I Coefficient: The ratio of peak I/I flow and peak rainfall intensity, Peak I/ I Coefficient = Peak I/I Flow / (Peak Rainfall Intensity over Tc * Catchment Area) 8 Hourly Wet‐Weather Peaking Factor: The ratio of peak hourly wet‐weather measured flow and average dry‐weather flow, Wet‐Weather Peaking Factor = Peak Hourly Wet‐Weather Measured Flow / Average Dry-Weather Flow 9 Instantaneous Wet‐Weather Peaking Factor: The ratio of peak wet‐weather measured flow and average dry‐weather flow, Wet‐Weather Peaking Factor = Peak Wet‐Weather Measured Flow / Average Dry-Weather Flow 2
328 Civica Infrastructure Inc. www.civi.ca
Civica Infrastructures Inc. Kawartha Lakes Flow Monitoring Report
Appendix - A June 03, 2024
I/I Analysis Graph Station: F1
329 Civica Infrastructure Inc. www.civi.ca
Civica Infrastructures Inc. Kawartha Lakes Flow Monitoring Report
Appendix - A June 03, 2024
Infiltration/Inflow Event Analysis Station: F1 Jun 25, 2023 00:47 – Jun 26, 2023 02:12, Total Precipitation: 18.25 mm (19,346,825.00 L) Station Details
Storm Details
Catchment Area
106.01 ha
Total Precipitation
18.25 mm (19,346,825.00 L)
Duration of Storm
1.42 hr
Time of Concentration (Tc) 1
30 min
Peak Precipitation Intensity Over Tc 2
20.50 mm/hr
Return Period over Tc 3
< 2 Yr
Measured Flow
I/I Flow
Time of Peak Measured Flow
Jun 25, 2023 14:30
Time of Peak I/I Flow (TD)
Jun 25, 2023 23:55
Estimated Dry Weather Flow at TD
5.87 L/s
Peak Measured Flow
29.99 L/s
Peak I/I Flow 4
19.84 L/s
Peak I/I Rate 5
0.19 L/s/ha
Peak Measured Depth
92.00 mm
Total I/I Flow Volume during event
196,430.30 L
Volumetric Coefficient (Cv%) 6
1.02%
Total Measured Flow Volume during Event
551,063.80 L
Peak I/I Coefficient 7
0.0033
Hourly Wet-Weather Peaking Factor 8
2.24
Instantaneous Wet-Weather Peaking Factor 9
4.08
1
Time of Concentration (Tc): The estimated time for the flow to travel from the furthest point in the upstream area to the point of monitoring, assume flow is travelling at 1.00 m/s Peak Precipitation Intensity Over Tc: The peak rainfall intensity for the duration of the storm with the time interval defined by time of concentration 3 Return Period over Tc: The estimated time to elapse before a storm of equal or greater intensity will likely occur again, based on design storm criteria 4 Peak I/I Flow: The greatest difference captured between measured flow and estimated dry weather flow, Peak I/I Flow = Maximum (Measured Flow – Estimated Dry Weather Flow) 5 Peak I/I Rate: A normalized peak I/I flow based on catchment area size, Peak I/I Rate = Peak I/I Flow / Catchment Area 6 Volumetric Coefficient (Cv%): The ratio of total I/I volume and total rainfall volume, Cv% = Total I/I Flow Volume / Total Precipitation Volume * 100% 7 Peak I/ I Coefficient: The ratio of peak I/I flow and peak rainfall intensity, Peak I/ I Coefficient = Peak I/I Flow / (Peak Rainfall Intensity over Tc * Catchment Area) 8 Hourly Wet‐Weather Peaking Factor: The ratio of peak hourly wet‐weather measured flow and average dry‐weather flow, Wet‐Weather Peaking Factor = Peak Hourly Wet‐Weather Measured Flow / Average Dry-Weather Flow 9 Instantaneous Wet‐Weather Peaking Factor: The ratio of peak wet‐weather measured flow and average dry‐weather flow, Wet‐Weather Peaking Factor = Peak Wet‐Weather Measured Flow / Average Dry-Weather Flow 2
330 Civica Infrastructure Inc. www.civi.ca
Civica Infrastructures Inc. Kawartha Lakes Flow Monitoring Report
Appendix - A June 03, 2024
I/I Analysis Graph Station: F1
331 Civica Infrastructure Inc. www.civi.ca
Civica Infrastructures Inc. Kawartha Lakes Flow Monitoring Report
Appendix - A June 03, 2024
Infiltration/Inflow Event Analysis Station: F1 Jun 25, 2023 15:17 – Jun 26, 2023 23:47, Total Precipitation: 20.25 mm (21,467,025.00 L) Station Details
Storm Details
Catchment Area
106.01 ha
Total Precipitation
20.25 mm (21,467,025.00 L)
Duration of Storm
8.50 hr
Time of Concentration (Tc) 1
30 min
Peak Precipitation Intensity Over Tc 2
19.50 mm/hr
Return Period over Tc 3
< 2 Yr
Measured Flow
I/I Flow
Time of Peak Measured Flow
Jun 26, 2023 20:00
Time of Peak I/I Flow (TD)
Jun 26, 2023 11:40
Estimated Dry Weather Flow at TD
7.71 L/s
Peak Measured Flow
37.70 L/s
Peak I/I Flow 4
26.69 L/s
Peak I/I Rate 5
0.25 L/s/ha
Peak Measured Depth
97.00 mm
Total I/I Flow Volume during event
338,336.00 L
Volumetric Coefficient (Cv%) 6
1.58%
Total Measured Flow Volume during Event
979,658.90 L
Peak I/I Coefficient 7
0.0047
Hourly Wet-Weather Peaking Factor 8
2.39
Instantaneous Wet-Weather Peaking Factor 9
4.34
1
Time of Concentration (Tc): The estimated time for the flow to travel from the furthest point in the upstream area to the point of monitoring, assume flow is travelling at 1.00 m/s Peak Precipitation Intensity Over Tc: The peak rainfall intensity for the duration of the storm with the time interval defined by time of concentration 3 Return Period over Tc: The estimated time to elapse before a storm of equal or greater intensity will likely occur again, based on design storm criteria 4 Peak I/I Flow: The greatest difference captured between measured flow and estimated dry weather flow, Peak I/I Flow = Maximum (Measured Flow – Estimated Dry Weather Flow) 5 Peak I/I Rate: A normalized peak I/I flow based on catchment area size, Peak I/I Rate = Peak I/I Flow / Catchment Area 6 Volumetric Coefficient (Cv%): The ratio of total I/I volume and total rainfall volume, Cv% = Total I/I Flow Volume / Total Precipitation Volume * 100% 7 Peak I/ I Coefficient: The ratio of peak I/I flow and peak rainfall intensity, Peak I/ I Coefficient = Peak I/I Flow / (Peak Rainfall Intensity over Tc * Catchment Area) 8 Hourly Wet‐Weather Peaking Factor: The ratio of peak hourly wet‐weather measured flow and average dry‐weather flow, Wet‐Weather Peaking Factor = Peak Hourly Wet‐Weather Measured Flow / Average Dry-Weather Flow 9 Instantaneous Wet‐Weather Peaking Factor: The ratio of peak wet‐weather measured flow and average dry‐weather flow, Wet‐Weather Peaking Factor = Peak Wet‐Weather Measured Flow / Average Dry-Weather Flow 2
332 Civica Infrastructure Inc. www.civi.ca
Civica Infrastructures Inc. Kawartha Lakes Flow Monitoring Report
Appendix - A June 03, 2024
I/I Analysis Graph Station: F1
333 Civica Infrastructure Inc. www.civi.ca
Civica Infrastructures Inc. Kawartha Lakes Flow Monitoring Report
Appendix - A June 03, 2024
Infiltration/Inflow Event Analysis Station: F1 Jun 26, 2023 21:52 – Jun 28, 2023 05:47, Total Precipitation: 15.00 mm (15,901,500.00 L) Station Details
Storm Details
Catchment Area
106.01 ha
Total Precipitation
15.00 mm (15,901,500.00 L)
Duration of Storm
7.92 hr
Time of Concentration (Tc) 1
30 min
Peak Precipitation Intensity Over Tc 2
11.00 mm/hr
Return Period over Tc 3
< 2 Yr
Measured Flow
I/I Flow
Time of Peak Measured Flow
Jun 27, 2023 16:10
Time of Peak I/I Flow (TD)
Jun 27, 2023 16:10
Estimated Dry Weather Flow at TD
8.04 L/s
Peak Measured Flow
45.25 L/s
Peak I/I Flow 4
37.21 L/s
Peak I/I Rate 5
0.35 L/s/ha
Peak Measured Depth
106.00 mm
Total I/I Flow Volume during event
425,059.80 L
Volumetric Coefficient (Cv%) 6
2.67%
Total Measured Flow Volume during Event
997,236.00 L
Peak I/I Coefficient 7
0.0115
Hourly Wet-Weather Peaking Factor 8
2.52
Instantaneous Wet-Weather Peaking Factor 9
5.67
1
Time of Concentration (Tc): The estimated time for the flow to travel from the furthest point in the upstream area to the point of monitoring, assume flow is travelling at 1.00 m/s Peak Precipitation Intensity Over Tc: The peak rainfall intensity for the duration of the storm with the time interval defined by time of concentration 3 Return Period over Tc: The estimated time to elapse before a storm of equal or greater intensity will likely occur again, based on design storm criteria 4 Peak I/I Flow: The greatest difference captured between measured flow and estimated dry weather flow, Peak I/I Flow = Maximum (Measured Flow – Estimated Dry Weather Flow) 5 Peak I/I Rate: A normalized peak I/I flow based on catchment area size, Peak I/I Rate = Peak I/I Flow / Catchment Area 6 Volumetric Coefficient (Cv%): The ratio of total I/I volume and total rainfall volume, Cv% = Total I/I Flow Volume / Total Precipitation Volume * 100% 7 Peak I/ I Coefficient: The ratio of peak I/I flow and peak rainfall intensity, Peak I/ I Coefficient = Peak I/I Flow / (Peak Rainfall Intensity over Tc * Catchment Area) 8 Hourly Wet‐Weather Peaking Factor: The ratio of peak hourly wet‐weather measured flow and average dry‐weather flow, Wet‐Weather Peaking Factor = Peak Hourly Wet‐Weather Measured Flow / Average Dry-Weather Flow 9 Instantaneous Wet‐Weather Peaking Factor: The ratio of peak wet‐weather measured flow and average dry‐weather flow, Wet‐Weather Peaking Factor = Peak Wet‐Weather Measured Flow / Average Dry-Weather Flow 2
334 Civica Infrastructure Inc. www.civi.ca
Civica Infrastructures Inc. Kawartha Lakes Flow Monitoring Report
Appendix - A June 03, 2024
I/I Analysis Graph Station: F1
335 Civica Infrastructure Inc. www.civi.ca
Civica Infrastructures Inc. Kawartha Lakes Flow Monitoring Report
Appendix - A June 03, 2024
Infiltration/Inflow Event Analysis Station: F1 Jul 12, 2023 14:27 – Jul 13, 2023 18:47, Total Precipitation: 19.00 mm (20,141,900.00 L) Station Details
Storm Details
Catchment Area
106.01 ha
Total Precipitation
19.00 mm (20,141,900.00 L)
Duration of Storm
4.33 hr
Time of Concentration (Tc) 1
30 min
Peak Precipitation Intensity Over Tc 2
8.50 mm/hr
Return Period over Tc 3
< 2 Yr
Measured Flow
I/I Flow
Time of Peak Measured Flow
Jul 13, 2023 10:40
Time of Peak I/I Flow (TD)
Jul 13, 2023 10:40
Estimated Dry Weather Flow at TD
9.08 L/s
Peak Measured Flow
29.18 L/s
Peak I/I Flow 4
20.09 L/s
Peak I/I Rate 5
0.19 L/s/ha
Peak Measured Depth
95.00 mm
Total I/I Flow Volume during event
175,697.70 L
Volumetric Coefficient (Cv%) 6
0.87%
Total Measured Flow Volume during Event
591,581.90 L
Peak I/I Coefficient 7
0.0080
Hourly Wet-Weather Peaking Factor 8
2.30
Instantaneous Wet-Weather Peaking Factor 9
4.12
1
Time of Concentration (Tc): The estimated time for the flow to travel from the furthest point in the upstream area to the point of monitoring, assume flow is travelling at 1.00 m/s Peak Precipitation Intensity Over Tc: The peak rainfall intensity for the duration of the storm with the time interval defined by time of concentration 3 Return Period over Tc: The estimated time to elapse before a storm of equal or greater intensity will likely occur again, based on design storm criteria 4 Peak I/I Flow: The greatest difference captured between measured flow and estimated dry weather flow, Peak I/I Flow = Maximum (Measured Flow – Estimated Dry Weather Flow) 5 Peak I/I Rate: A normalized peak I/I flow based on catchment area size, Peak I/I Rate = Peak I/I Flow / Catchment Area 6 Volumetric Coefficient (Cv%): The ratio of total I/I volume and total rainfall volume, Cv% = Total I/I Flow Volume / Total Precipitation Volume * 100% 7 Peak I/ I Coefficient: The ratio of peak I/I flow and peak rainfall intensity, Peak I/ I Coefficient = Peak I/I Flow / (Peak Rainfall Intensity over Tc * Catchment Area) 8 Hourly Wet‐Weather Peaking Factor: The ratio of peak hourly wet‐weather measured flow and average dry‐weather flow, Wet‐Weather Peaking Factor = Peak Hourly Wet‐Weather Measured Flow / Average Dry-Weather Flow 9 Instantaneous Wet‐Weather Peaking Factor: The ratio of peak wet‐weather measured flow and average dry‐weather flow, Wet‐Weather Peaking Factor = Peak Wet‐Weather Measured Flow / Average Dry-Weather Flow 2
336 Civica Infrastructure Inc. www.civi.ca
Civica Infrastructures Inc. Kawartha Lakes Flow Monitoring Report
Appendix - A June 03, 2024
I/I Analysis Graph Station: F1
337 Civica Infrastructure Inc. www.civi.ca
Civica Infrastructures Inc. Kawartha Lakes Flow Monitoring Report
Appendix - A June 03, 2024
Infiltration/Inflow Event Analysis Station: F1 Jul 28, 2023 21:10 – Jul 30, 2023 00:15, Total Precipitation: 19.05 mm (20,194,901.80 L) Station Details
Storm Details
Catchment Area
106.01 ha
Total Precipitation
19.05 mm (20,194,901.80 L)
Duration of Storm
3.08 hr
Time of Concentration (Tc) 1
30 min
Peak Precipitation Intensity Over Tc 2
28.40 mm/hr
Return Period over Tc 3
< 2 Yr
Measured Flow
I/I Flow
Time of Peak Measured Flow
Jul 29, 2023 10:00
Time of Peak I/I Flow (TD)
Jul 29, 2023 10:00
Estimated Dry Weather Flow at TD
9.32 L/s
Peak Measured Flow
39.91 L/s
Peak I/I Flow 4
30.58 L/s
Peak I/I Rate 5
0.29 L/s/ha
Peak Measured Depth
107.00 mm
Total I/I Flow Volume during event
208,457.60 L
Volumetric Coefficient (Cv%) 6
1.03%
Total Measured Flow Volume during Event
638,858.30 L
Peak I/I Coefficient 7
0.0037
Hourly Wet-Weather Peaking Factor 8
2.82
Instantaneous Wet-Weather Peaking Factor 9
5.06
1
Time of Concentration (Tc): The estimated time for the flow to travel from the furthest point in the upstream area to the point of monitoring, assume flow is travelling at 1.00 m/s Peak Precipitation Intensity Over Tc: The peak rainfall intensity for the duration of the storm with the time interval defined by time of concentration 3 Return Period over Tc: The estimated time to elapse before a storm of equal or greater intensity will likely occur again, based on design storm criteria 4 Peak I/I Flow: The greatest difference captured between measured flow and estimated dry weather flow, Peak I/I Flow = Maximum (Measured Flow – Estimated Dry Weather Flow) 5 Peak I/I Rate: A normalized peak I/I flow based on catchment area size, Peak I/I Rate = Peak I/I Flow / Catchment Area 6 Volumetric Coefficient (Cv%): The ratio of total I/I volume and total rainfall volume, Cv% = Total I/I Flow Volume / Total Precipitation Volume * 100% 7 Peak I/ I Coefficient: The ratio of peak I/I flow and peak rainfall intensity, Peak I/ I Coefficient = Peak I/I Flow / (Peak Rainfall Intensity over Tc * Catchment Area) 8 Hourly Wet‐Weather Peaking Factor: The ratio of peak hourly wet‐weather measured flow and average dry‐weather flow, Wet‐Weather Peaking Factor = Peak Hourly Wet‐Weather Measured Flow / Average Dry-Weather Flow 9 Instantaneous Wet‐Weather Peaking Factor: The ratio of peak wet‐weather measured flow and average dry‐weather flow, Wet‐Weather Peaking Factor = Peak Wet‐Weather Measured Flow / Average Dry-Weather Flow 2
338 Civica Infrastructure Inc. www.civi.ca
Civica Infrastructures Inc. Kawartha Lakes Flow Monitoring Report
Appendix - A June 03, 2024
I/I Analysis Graph Station: F1
339 Civica Infrastructure Inc. www.civi.ca
Civica Infrastructures Inc. Kawartha Lakes Flow Monitoring Report
Appendix - A June 03, 2024
Infiltration/Inflow Event Analysis Station: F1 Aug 11, 2023 20:40 – Aug 13, 2023 07:10, Total Precipitation: 23.11 mm (24,503,146.10 L) Station Details
Storm Details
Catchment Area
106.01 ha
Total Precipitation
23.11 mm (24,503,146.10 L)
Duration of Storm
10.50 hr
Time of Concentration (Tc) 1
30 min
Peak Precipitation Intensity Over Tc 2
31.50 mm/hr
Return Period over Tc 3
< 2 Yr
Measured Flow
I/I Flow
Time of Peak Measured Flow
Aug 12, 2023 12:35
Time of Peak I/I Flow (TD)
Aug 12, 2023 22:45
Estimated Dry Weather Flow at TD
6.19 L/s
Peak Measured Flow
34.95 L/s
Peak I/I Flow 4
27.45 L/s
Peak I/I Rate 5
0.26 L/s/ha
Peak Measured Depth
103.00 mm
Total I/I Flow Volume during event
303,938.50 L
Volumetric Coefficient (Cv%) 6
1.24%
Total Measured Flow Volume during Event
818,436.90 L
Peak I/I Coefficient 7
0.0030
Hourly Wet-Weather Peaking Factor 8
3.77
Instantaneous Wet-Weather Peaking Factor 9
5.52
1
Time of Concentration (Tc): The estimated time for the flow to travel from the furthest point in the upstream area to the point of monitoring, assume flow is travelling at 1.00 m/s Peak Precipitation Intensity Over Tc: The peak rainfall intensity for the duration of the storm with the time interval defined by time of concentration 3 Return Period over Tc: The estimated time to elapse before a storm of equal or greater intensity will likely occur again, based on design storm criteria 4 Peak I/I Flow: The greatest difference captured between measured flow and estimated dry weather flow, Peak I/I Flow = Maximum (Measured Flow – Estimated Dry Weather Flow) 5 Peak I/I Rate: A normalized peak I/I flow based on catchment area size, Peak I/I Rate = Peak I/I Flow / Catchment Area 6 Volumetric Coefficient (Cv%): The ratio of total I/I volume and total rainfall volume, Cv% = Total I/I Flow Volume / Total Precipitation Volume * 100% 7 Peak I/ I Coefficient: The ratio of peak I/I flow and peak rainfall intensity, Peak I/ I Coefficient = Peak I/I Flow / (Peak Rainfall Intensity over Tc * Catchment Area) 8 Hourly Wet‐Weather Peaking Factor: The ratio of peak hourly wet‐weather measured flow and average dry‐weather flow, Wet‐Weather Peaking Factor = Peak Hourly Wet‐Weather Measured Flow / Average Dry-Weather Flow 9 Instantaneous Wet‐Weather Peaking Factor: The ratio of peak wet‐weather measured flow and average dry‐weather flow, Wet‐Weather Peaking Factor = Peak Wet‐Weather Measured Flow / Average Dry-Weather Flow 2
340 Civica Infrastructure Inc. www.civi.ca
Civica Infrastructures Inc. Kawartha Lakes Flow Monitoring Report
Appendix - A June 03, 2024
I/I Analysis Graph Station: F1
341 Civica Infrastructure Inc. www.civi.ca
Civica Infrastructures Inc. Kawartha Lakes Flow Monitoring Report
Appendix - A June 03, 2024
Infiltration/Inflow Event Analysis Station: F1 Oct 05, 2023 10:00 – Oct 07, 2023 09:35, Total Precipitation: 23.11 mm (24,503,149.30 L) Station Details
Storm Details
Catchment Area
106.01 ha
Total Precipitation
23.11 mm (24,503,149.30 L)
Duration of Storm
23.58 hr
Time of Concentration (Tc) 1
30 min
Peak Precipitation Intensity Over Tc 2
9.70 mm/hr
Return Period over Tc 3
< 2 Yr
Measured Flow
I/I Flow
Time of Peak Measured Flow
Oct 06, 2023 00:10
Time of Peak I/I Flow (TD)
Oct 06, 2023 00:10
Estimated Dry Weather Flow at TD
2.74 L/s
Peak Measured Flow
33.33 L/s
Peak I/I Flow 4
30.60 L/s
Peak I/I Rate 5
0.29 L/s/ha
Peak Measured Depth
100.00 mm
Total I/I Flow Volume during event
509,443.70 L
Volumetric Coefficient (Cv%) 6
2.08%
Total Measured Flow Volume during Event
1,088,192.90 L
Peak I/I Coefficient 7
0.0108
Hourly Wet-Weather Peaking Factor 8
3.51
Instantaneous Wet-Weather Peaking Factor 9
7.40
1
Time of Concentration (Tc): The estimated time for the flow to travel from the furthest point in the upstream area to the point of monitoring, assume flow is travelling at 1.00 m/s Peak Precipitation Intensity Over Tc: The peak rainfall intensity for the duration of the storm with the time interval defined by time of concentration 3 Return Period over Tc: The estimated time to elapse before a storm of equal or greater intensity will likely occur again, based on design storm criteria 4 Peak I/I Flow: The greatest difference captured between measured flow and estimated dry weather flow, Peak I/I Flow = Maximum (Measured Flow – Estimated Dry Weather Flow) 5 Peak I/I Rate: A normalized peak I/I flow based on catchment area size, Peak I/I Rate = Peak I/I Flow / Catchment Area 6 Volumetric Coefficient (Cv%): The ratio of total I/I volume and total rainfall volume, Cv% = Total I/I Flow Volume / Total Precipitation Volume * 100% 7 Peak I/ I Coefficient: The ratio of peak I/I flow and peak rainfall intensity, Peak I/ I Coefficient = Peak I/I Flow / (Peak Rainfall Intensity over Tc * Catchment Area) 8 Hourly Wet‐Weather Peaking Factor: The ratio of peak hourly wet‐weather measured flow and average dry‐weather flow, Wet‐Weather Peaking Factor = Peak Hourly Wet‐Weather Measured Flow / Average Dry-Weather Flow 9 Instantaneous Wet‐Weather Peaking Factor: The ratio of peak wet‐weather measured flow and average dry‐weather flow, Wet‐Weather Peaking Factor = Peak Wet‐Weather Measured Flow / Average Dry-Weather Flow 2
342 Civica Infrastructure Inc. www.civi.ca
Civica Infrastructures Inc. Kawartha Lakes Flow Monitoring Report
Appendix - A June 03, 2024
I/I Analysis Graph Station: F1
343 Civica Infrastructure Inc. www.civi.ca
Civica Infrastructures Inc. Kawartha Lakes Flow Monitoring Report
Appendix - A June 03, 2024
Infiltration/Inflow Event Analysis Station: F1 Oct 08, 2023 02:40 – Oct 10, 2023 12:50, Total Precipitation: 29.46 mm (31,234,786.40 L) Station Details
Storm Details
Catchment Area
106.01 ha
Total Precipitation
29.46 mm (31,234,786.40 L)
Duration of Storm
34.17 hr
Time of Concentration (Tc) 1
30 min
Peak Precipitation Intensity Over Tc 2
6.10 mm/hr
Return Period over Tc 3
< 2 Yr
Measured Flow
I/I Flow
Time of Peak Measured Flow
Oct 09, 2023 10:15
Time of Peak I/I Flow (TD)
Oct 09, 2023 10:15
Estimated Dry Weather Flow at TD
5.58 L/s
Peak Measured Flow
41.86 L/s
Peak I/I Flow 4
36.29 L/s
Peak I/I Rate 5
0.34 L/s/ha
Peak Measured Depth
110.00 mm
Total I/I Flow Volume during event
966,471.10 L
Volumetric Coefficient (Cv%) 6
3.09%
Total Measured Flow Volume during Event
1,859,872.40 L
Peak I/I Coefficient 7
0.0202
Hourly Wet-Weather Peaking Factor 8
4.23
Instantaneous Wet-Weather Peaking Factor 9
7.80
1
Time of Concentration (Tc): The estimated time for the flow to travel from the furthest point in the upstream area to the point of monitoring, assume flow is travelling at 1.00 m/s Peak Precipitation Intensity Over Tc: The peak rainfall intensity for the duration of the storm with the time interval defined by time of concentration 3 Return Period over Tc: The estimated time to elapse before a storm of equal or greater intensity will likely occur again, based on design storm criteria 4 Peak I/I Flow: The greatest difference captured between measured flow and estimated dry weather flow, Peak I/I Flow = Maximum (Measured Flow – Estimated Dry Weather Flow) 5 Peak I/I Rate: A normalized peak I/I flow based on catchment area size, Peak I/I Rate = Peak I/I Flow / Catchment Area 6 Volumetric Coefficient (Cv%): The ratio of total I/I volume and total rainfall volume, Cv% = Total I/I Flow Volume / Total Precipitation Volume * 100% 7 Peak I/ I Coefficient: The ratio of peak I/I flow and peak rainfall intensity, Peak I/ I Coefficient = Peak I/I Flow / (Peak Rainfall Intensity over Tc * Catchment Area) 8 Hourly Wet‐Weather Peaking Factor: The ratio of peak hourly wet‐weather measured flow and average dry‐weather flow, Wet‐Weather Peaking Factor = Peak Hourly Wet‐Weather Measured Flow / Average Dry-Weather Flow 9 Instantaneous Wet‐Weather Peaking Factor: The ratio of peak wet‐weather measured flow and average dry‐weather flow, Wet‐Weather Peaking Factor = Peak Wet‐Weather Measured Flow / Average Dry-Weather Flow 2
344 Civica Infrastructure Inc. www.civi.ca
Civica Infrastructures Inc. Kawartha Lakes Flow Monitoring Report
Appendix - A June 03, 2024
Activity Log Station: F1 Date Time
Type
Purpose of Visit
Comment
Calibration Measurement
16-Jan-2023 03:24:00 PM
Installation Log
INSTALLATION
MEASUREMENTS TAKEN, PHOTOS TAKEN, LOGGER INSTALLED
Yes
02-Mar-2023 09:25:00 AM
Maintenance Log
CALIBRATION
TC SET,DATA DOWNLOADED,TELEMETRY SENT,DEBRIS AND SILT REMOVED,SITE CALIBRATED,ANTENNA IN GOOD CONDITION,PHOTOS AND VIDEOS TAKEN
Yes
10-May-2023 01:00:00 PM
Removal Log
REMOVAL
SET UP TC, DOWNLOADED DATA, SENT TELEMETRY, TOOK MEASUREMENTS, TOOK PHOTOS, REMOVED EQUIPMENT, REMOVAL COMPLETED.
Yes
23-Jun-2023 11:15:00 AM
Installation Log
INSTALLATION
TC SET,SURVEY SENT, SERIAL NUMBERS NOTED,MEASUREMENT TAKEN,A/V SENSOR INSTALLED IN INLET,DOWNWARD SENSOR INSTALLED,SITE CALIBRATED,SITE CLEARED
Yes
17-Oct-2023 11:00:00 AM
Removal Log
REMOVAL
SET UP TC/CSE, DOWNLOADED DATA, SENT TELEMETRY, PMAC ID:8222 , TOOK MEASUREMENTS, CALIBRATED SITE, REMOVED ALL EQUIPMENT, REMOVAL COMPLETE. note: LOGGER TIME IS 2 HOURS AHEAD OF PC TIME.
Yes
345 Civica Infrastructure Inc. www.civi.ca
Civica Infrastructures Inc. Kawartha Lakes Flow Monitoring Report
Appendix - A June 03, 2024
Aggregate Data Station: F2
Precipitation Date From
Date To
Days
Min (mm)
Avg (mm)
Max (mm)
Sum (mm)
Count
Time of Min1
Time of Max1
Jan 17, 2023
Oct 17, 2023
230
0.00
0.01
6.35
528.27
59,223
Tue Feb 21, 2023 13:00
Sat Mar 04, 2023 14:00
Level Date From
Date To
Days
Min (m)
Avg (m)
Max (m)
Count
Time of Min1
Time of Max1
Jan 17, 2023
Oct 17, 2023
203
0.00
0.04
1.12
57,934
Tue Apr 25, 2023 16:05
Wed Apr 05, 2023 17:55
Velocity Date From
Date To
Days
Min (m/s)
Avg (m/s)
Max (m/s)
Count
Time of Min1
Time of Max1
Jan 17, 2023
Oct 17, 2023
231
0.00
0.01
0.42
65,953
Tue Jan 17, 2023 10:05
Wed Apr 05, 2023 18:00
Flow
1
Date From
Date To
Days
Min (L/s)
Avg (L/s)
Max (L/s)
Total Volume (1,000,000 L)
Count
Time of Min1
Time of Max1
Jan 17, 2023
Oct 17, 2023
203
0.00
1.23
13.21
21.43
57,934
Tue Apr 25, 2023 16:05
Wed Apr 05, 2023 18:00
Time of Min and Time of Max will be displayed by first occurrence
346 Civica Infrastructure Inc. www.civi.ca
Civica Infrastructures Inc. Kawartha Lakes Flow Monitoring Report
Appendix - A June 03, 2024
Data Chart Station: F2 Jan 17, 2023 – Jan 31, 2023
347 Civica Infrastructure Inc. www.civi.ca
Civica Infrastructures Inc. Kawartha Lakes Flow Monitoring Report
Appendix - A June 03, 2024
Data Chart Station: F2 Feb 01, 2023 – Feb 28, 2023
348 Civica Infrastructure Inc. www.civi.ca
Civica Infrastructures Inc. Kawartha Lakes Flow Monitoring Report
Appendix - A June 03, 2024
Data Chart Station: F2 Mar 01, 2023 – Mar 31, 2023
349 Civica Infrastructure Inc. www.civi.ca
Civica Infrastructures Inc. Kawartha Lakes Flow Monitoring Report
Appendix - A June 03, 2024
Data Chart Station: F2 Apr 01, 2023 – Apr 30, 2023
350 Civica Infrastructure Inc. www.civi.ca
Civica Infrastructures Inc. Kawartha Lakes Flow Monitoring Report
Appendix - A June 03, 2024
Data Chart Station: F2 May 01, 2023 – May 31, 2023
351 Civica Infrastructure Inc. www.civi.ca
Civica Infrastructures Inc. Kawartha Lakes Flow Monitoring Report
Appendix - A June 03, 2024
Data Chart Station: F2 Jun 01, 2023 – Jun 30, 2023
352 Civica Infrastructure Inc. www.civi.ca
Civica Infrastructures Inc. Kawartha Lakes Flow Monitoring Report
Appendix - A June 03, 2024
Data Chart Station: F2 Jul 01, 2023 – Jul 31, 2023
353 Civica Infrastructure Inc. www.civi.ca
Civica Infrastructures Inc. Kawartha Lakes Flow Monitoring Report
Appendix - A June 03, 2024
Data Chart Station: F2 Aug 01, 2023 – Aug 31, 2023
354 Civica Infrastructure Inc. www.civi.ca
Civica Infrastructures Inc. Kawartha Lakes Flow Monitoring Report
Appendix - A June 03, 2024
Data Chart Station: F2 Sep 01, 2023 – Sep 30, 2023
355 Civica Infrastructure Inc. www.civi.ca
Civica Infrastructures Inc. Kawartha Lakes Flow Monitoring Report
Appendix - A June 03, 2024
Data Chart Station: F2 Oct 01, 2023 – Oct 17, 2023
356 Civica Infrastructure Inc. www.civi.ca
Civica Infrastructures Inc. Kawartha Lakes Flow Monitoring Report
Appendix - A June 03, 2024
Sanitary Report Station: F2
1
Average Dry Weather Flow (L/s)
Average Dry Weather Flow (L/c/d)
Average Daily Minimum Dry Weather Flow (L/s)
Average Daily Peak Dry Weather Flow (L/s)
1.073
610.137
0.622
2.245
Peaking Factor
Groundwater Infiltration (L/s)1
Groundwater Infiltration (L/ha/d)
% of GWI in Average DWF
2.091
0.529
4,810.113
49.273
Groundwater infiltration (GWI) is assumed as 85% of the daily minimum flow averaged over the monitoring period
357 Civica Infrastructure Inc. www.civi.ca
Civica Infrastructures Inc. Kawartha Lakes Flow Monitoring Report
Appendix - A June 03, 2024
I/I Analysis Table
1 2
Event1
Total Precipitation (mm)
Duration (hours)
Peak Intensity Over Tc at Station (mm/hr)
Mar 31, 2023
22.25
18.08
Apr 05, 2023
33.75
Apr 30, 2023
F2 Measured Peak Flow (L/s)
Peak I/I Flow (L/s)
Peak I/I Rate (L/s/ha)
Volumetric Runoff Coefficient (CV%)
Peaking Factor (PF)
6.60
6.01
3.14
0.33
5.97 %
1.29
10.58
17.40
13.21
11.13
1.17
8.49 %
5.35
24.75
7.92
7.80
4.16
2.99
0.31
2.33 %
3.06
May 19, 2023
38.75
14.75
15.00
N/A 2
Jun 11, 2023
46.50
25.92
8.40
N/A 2
Jun 23, 2023
20.50
38.25
28.20
N/A 2
Jun 25, 2023
18.25
1.42
21.00
Jun 26, 2023
20.25
8.50
21.60
Jun 27, 2023
15.00
7.92
12.60
N/A 2
Jul 13, 2023
19.00
4.33
9.00
N/A 2
Jul 29, 2023
17.50
2.08
28.80
2.00
0.96
0.10
0.66 %
1.04
Aug 12, 2023
23.75
13.17
28.80
1.84
0.91
0.10
0.32 %
1.17
Oct 05, 2023
23.11
23.58
11.00
2.81
2.06
0.22
0.70 %
3.30
Oct 08, 2023
29.46
34.17
6.10
2.16
1.24
0.13
1.48 %
1.72
Average
25.20
15.05
15.88
4.60
3.20
0.34
2.85 %
2.42
Maximum
46.50
38.25
28.80
13.21
11.13
1.17
8.49 %
5.35
Flow KPIs
Measured Storms
Station: F2
N/A 2 N/A 2
An event is a storm with a minimum volume of 15mm and a minimum inter-event dry period of 12 hours I/I event analysis unable to be completed due to missing flow monitoring data during event
358 Civica Infrastructure Inc. www.civi.ca
Civica Infrastructures Inc. Kawartha Lakes Flow Monitoring Report
Appendix - A June 03, 2024
I/I Analysis Graph Station: F2
359 Civica Infrastructure Inc. www.civi.ca
Civica Infrastructures Inc. Kawartha Lakes Flow Monitoring Report
Appendix - A June 03, 2024
Infiltration/Inflow Event Analysis Station: F2 Mar 31, 2023 01:02 – Apr 01, 2023 19:07, Total Precipitation: 22.25 mm (2,113,750.00 L) Station Details
Storm Details
Catchment Area
9.50 ha
Total Precipitation
22.25 mm (2,113,750.00 L)
Duration of Storm
18.08 hr
Time of Concentration (Tc) 1
25 min
Peak Precipitation Intensity Over Tc 2
6.60 mm/hr
Return Period over Tc 3
< 2 Yr
Measured Flow
I/I Flow
Time of Peak Measured Flow
Apr 01, 2023 14:50
Time of Peak I/I Flow (TD)
Apr 01, 2023 11:55
Estimated Dry Weather Flow at TD
2.71 L/s
Peak Measured Flow
6.01 L/s
Peak I/I Flow 4
3.14 L/s
Peak I/I Rate 5
0.33 L/s/ha
Peak Measured Depth
89.00 mm
Total I/I Flow Volume during event
126,092.10 L
Volumetric Coefficient (Cv%) 6
5.97%
Total Measured Flow Volume during Event
390,435.60 L
Peak I/I Coefficient 7
0.0180
Hourly Wet-Weather Peaking Factor 8
2.24
Instantaneous Wet-Weather Peaking Factor 9
2.46
1
Time of Concentration (Tc): The estimated time for the flow to travel from the furthest point in the upstream area to the point of monitoring, assume flow is travelling at 1.00 m/s Peak Precipitation Intensity Over Tc: The peak rainfall intensity for the duration of the storm with the time interval defined by time of concentration 3 Return Period over Tc: The estimated time to elapse before a storm of equal or greater intensity will likely occur again, based on design storm criteria 4 Peak I/I Flow: The greatest difference captured between measured flow and estimated dry weather flow, Peak I/I Flow = Maximum (Measured Flow – Estimated Dry Weather Flow) 5 Peak I/I Rate: A normalized peak I/I flow based on catchment area size, Peak I/I Rate = Peak I/I Flow / Catchment Area 6 Volumetric Coefficient (Cv%): The ratio of total I/I volume and total rainfall volume, Cv% = Total I/I Flow Volume / Total Precipitation Volume * 100% 7 Peak I/ I Coefficient: The ratio of peak I/I flow and peak rainfall intensity, Peak I/ I Coefficient = Peak I/I Flow / (Peak Rainfall Intensity over Tc * Catchment Area) 8 Hourly Wet‐Weather Peaking Factor: The ratio of peak hourly wet‐weather measured flow and average dry‐weather flow, Wet‐Weather Peaking Factor = Peak Hourly Wet‐Weather Measured Flow / Average Dry-Weather Flow 9 Instantaneous Wet‐Weather Peaking Factor: The ratio of peak wet‐weather measured flow and average dry‐weather flow, Wet‐Weather Peaking Factor = Peak Wet‐Weather Measured Flow / Average Dry-Weather Flow 2
360 Civica Infrastructure Inc. www.civi.ca
Civica Infrastructures Inc. Kawartha Lakes Flow Monitoring Report
Appendix - A June 03, 2024
I/I Analysis Graph Station: F2
361 Civica Infrastructure Inc. www.civi.ca
Civica Infrastructures Inc. Kawartha Lakes Flow Monitoring Report
Appendix - A June 03, 2024
Infiltration/Inflow Event Analysis Station: F2 Apr 04, 2023 17:42 – Apr 06, 2023 04:17, Total Precipitation: 33.75 mm (3,206,250.00 L) Station Details
Storm Details
Catchment Area
9.50 ha
Total Precipitation
33.75 mm (3,206,250.00 L)
Duration of Storm
10.58 hr
Time of Concentration (Tc) 1
25 min
Peak Precipitation Intensity Over Tc 2
17.40 mm/hr
Return Period over Tc 3
< 2 Yr
Measured Flow
I/I Flow
Time of Peak Measured Flow
Apr 05, 2023 18:00
Time of Peak I/I Flow (TD)
Apr 05, 2023 18:00
Estimated Dry Weather Flow at TD
2.09 L/s
Peak Measured Flow
13.21 L/s
Peak I/I Flow 4
11.13 L/s
Peak I/I Rate 5
1.17 L/s/ha
Peak Measured Depth
1,123.00 mm 10
Total I/I Flow Volume during event
272,281.10 L
Volumetric Coefficient (Cv%) 6
8.49%
Total Measured Flow Volume during Event
441,281.20 L
Peak I/I Coefficient 7
0.0242
Hourly Wet-Weather Peaking Factor 8
4.08
Instantaneous Wet-Weather Peaking Factor 9
6.36
1
Time of Concentration (Tc): The estimated time for the flow to travel from the furthest point in the upstream area to the point of monitoring, assume flow is travelling at 1.00 m/s Peak Precipitation Intensity Over Tc: The peak rainfall intensity for the duration of the storm with the time interval defined by time of concentration 3 Return Period over Tc: The estimated time to elapse before a storm of equal or greater intensity will likely occur again, based on design storm criteria 4 Peak I/I Flow: The greatest difference captured between measured flow and estimated dry weather flow, Peak I/I Flow = Maximum (Measured Flow – Estimated Dry Weather Flow) 5 Peak I/I Rate: A normalized peak I/I flow based on catchment area size, Peak I/I Rate = Peak I/I Flow / Catchment Area 6 Volumetric Coefficient (Cv%): The ratio of total I/I volume and total rainfall volume, Cv% = Total I/I Flow Volume / Total Precipitation Volume * 100% 7 Peak I/ I Coefficient: The ratio of peak I/I flow and peak rainfall intensity, Peak I/ I Coefficient = Peak I/I Flow / (Peak Rainfall Intensity over Tc * Catchment Area) 8 Hourly Wet‐Weather Peaking Factor: The ratio of peak hourly wet‐weather measured flow and average dry‐weather flow, Wet‐Weather Peaking Factor = Peak Hourly Wet‐Weather Measured Flow / Average Dry-Weather Flow 9 Instantaneous Wet‐Weather Peaking Factor: The ratio of peak wet‐weather measured flow and average dry‐weather flow, Wet‐Weather Peaking Factor = Peak Wet‐Weather Measured Flow / Average Dry-Weather Flow 10 Captured peak depth is greater than 90% of pipe diameter, pipe containing flow monitor may have experienced surcharge 2
362 Civica Infrastructure Inc. www.civi.ca
Civica Infrastructures Inc. Kawartha Lakes Flow Monitoring Report
Appendix - A June 03, 2024
I/I Analysis Graph Station: F2
363 Civica Infrastructure Inc. www.civi.ca
Civica Infrastructures Inc. Kawartha Lakes Flow Monitoring Report
Appendix - A June 03, 2024
Infiltration/Inflow Event Analysis Station: F2 Apr 30, 2023 00:27 – May 01, 2023 08:22, Total Precipitation: 24.75 mm (2,351,250.00 L) Station Details
Storm Details
Catchment Area
9.50 ha
Total Precipitation
24.75 mm (2,351,250.00 L)
Duration of Storm
7.92 hr
Time of Concentration (Tc) 1
25 min
Peak Precipitation Intensity Over Tc 2
7.80 mm/hr
Return Period over Tc 3
< 2 Yr
Measured Flow
I/I Flow
Time of Peak Measured Flow
Apr 30, 2023 19:35
Time of Peak I/I Flow (TD)
Apr 30, 2023 19:35
Estimated Dry Weather Flow at TD
1.17 L/s
Peak Measured Flow
4.16 L/s
Peak I/I Flow 4
2.99 L/s
Peak I/I Rate 5
0.31 L/s/ha
Peak Measured Depth
76.00 mm
Total I/I Flow Volume during event
54,712.90 L
Volumetric Coefficient (Cv%) 6
2.33%
Total Measured Flow Volume during Event
124,710.80 L
Peak I/I Coefficient 7
0.0145
Hourly Wet-Weather Peaking Factor 8
2.74
Instantaneous Wet-Weather Peaking Factor 9
4.26
1
Time of Concentration (Tc): The estimated time for the flow to travel from the furthest point in the upstream area to the point of monitoring, assume flow is travelling at 1.00 m/s Peak Precipitation Intensity Over Tc: The peak rainfall intensity for the duration of the storm with the time interval defined by time of concentration 3 Return Period over Tc: The estimated time to elapse before a storm of equal or greater intensity will likely occur again, based on design storm criteria 4 Peak I/I Flow: The greatest difference captured between measured flow and estimated dry weather flow, Peak I/I Flow = Maximum (Measured Flow – Estimated Dry Weather Flow) 5 Peak I/I Rate: A normalized peak I/I flow based on catchment area size, Peak I/I Rate = Peak I/I Flow / Catchment Area 6 Volumetric Coefficient (Cv%): The ratio of total I/I volume and total rainfall volume, Cv% = Total I/I Flow Volume / Total Precipitation Volume * 100% 7 Peak I/ I Coefficient: The ratio of peak I/I flow and peak rainfall intensity, Peak I/ I Coefficient = Peak I/I Flow / (Peak Rainfall Intensity over Tc * Catchment Area) 8 Hourly Wet‐Weather Peaking Factor: The ratio of peak hourly wet‐weather measured flow and average dry‐weather flow, Wet‐Weather Peaking Factor = Peak Hourly Wet‐Weather Measured Flow / Average Dry-Weather Flow 9 Instantaneous Wet‐Weather Peaking Factor: The ratio of peak wet‐weather measured flow and average dry‐weather flow, Wet‐Weather Peaking Factor = Peak Wet‐Weather Measured Flow / Average Dry-Weather Flow 2
364 Civica Infrastructure Inc. www.civi.ca
Civica Infrastructures Inc. Kawartha Lakes Flow Monitoring Report
Appendix - A June 03, 2024
I/I Analysis Graph Station: F2
365 Civica Infrastructure Inc. www.civi.ca
Civica Infrastructures Inc. Kawartha Lakes Flow Monitoring Report
Appendix - A June 03, 2024
Infiltration/Inflow Event Analysis Station: F2 Jul 28, 2023 21:14 – Jul 29, 2023 23:19, Total Precipitation: 17.50 mm (1,662,500.00 L) Station Details
Storm Details
Catchment Area
9.50 ha
Total Precipitation
17.50 mm (1,662,500.00 L)
Duration of Storm
2.08 hr
Time of Concentration (Tc) 1
25 min
Peak Precipitation Intensity Over Tc 2
28.80 mm/hr
Return Period over Tc 3
< 2 Yr
Measured Flow
I/I Flow
Time of Peak Measured Flow
Jul 29, 2023 10:35
Time of Peak I/I Flow (TD)
Jul 29, 2023 12:20
Estimated Dry Weather Flow at TD
0.95 L/s
Peak Measured Flow
2.00 L/s
Peak I/I Flow 4
0.96 L/s
Peak I/I Rate 5
0.10 L/s/ha
Peak Measured Depth
55.00 mm
Total I/I Flow Volume during event
10,905.80 L
Volumetric Coefficient (Cv%) 6
0.66%
Total Measured Flow Volume during Event
57,679.60 L
Peak I/I Coefficient 7
0.0013
Hourly Wet-Weather Peaking Factor 8
1.55
Instantaneous Wet-Weather Peaking Factor 9
2.16
1
Time of Concentration (Tc): The estimated time for the flow to travel from the furthest point in the upstream area to the point of monitoring, assume flow is travelling at 1.00 m/s Peak Precipitation Intensity Over Tc: The peak rainfall intensity for the duration of the storm with the time interval defined by time of concentration 3 Return Period over Tc: The estimated time to elapse before a storm of equal or greater intensity will likely occur again, based on design storm criteria 4 Peak I/I Flow: The greatest difference captured between measured flow and estimated dry weather flow, Peak I/I Flow = Maximum (Measured Flow – Estimated Dry Weather Flow) 5 Peak I/I Rate: A normalized peak I/I flow based on catchment area size, Peak I/I Rate = Peak I/I Flow / Catchment Area 6 Volumetric Coefficient (Cv%): The ratio of total I/I volume and total rainfall volume, Cv% = Total I/I Flow Volume / Total Precipitation Volume * 100% 7 Peak I/ I Coefficient: The ratio of peak I/I flow and peak rainfall intensity, Peak I/ I Coefficient = Peak I/I Flow / (Peak Rainfall Intensity over Tc * Catchment Area) 8 Hourly Wet‐Weather Peaking Factor: The ratio of peak hourly wet‐weather measured flow and average dry‐weather flow, Wet‐Weather Peaking Factor = Peak Hourly Wet‐Weather Measured Flow / Average Dry-Weather Flow 9 Instantaneous Wet‐Weather Peaking Factor: The ratio of peak wet‐weather measured flow and average dry‐weather flow, Wet‐Weather Peaking Factor = Peak Wet‐Weather Measured Flow / Average Dry-Weather Flow 2
366 Civica Infrastructure Inc. www.civi.ca
Civica Infrastructures Inc. Kawartha Lakes Flow Monitoring Report
Appendix - A June 03, 2024
I/I Analysis Graph Station: F2
367 Civica Infrastructure Inc. www.civi.ca
Civica Infrastructures Inc. Kawartha Lakes Flow Monitoring Report
Appendix - A June 03, 2024
Infiltration/Inflow Event Analysis Station: F2 Aug 11, 2023 22:04 – Aug 13, 2023 11:14, Total Precipitation: 23.75 mm (2,256,250.00 L) Station Details
Storm Details
Catchment Area
9.50 ha
Total Precipitation
23.75 mm (2,256,250.00 L)
Duration of Storm
13.17 hr
Time of Concentration (Tc) 1
25 min
Peak Precipitation Intensity Over Tc 2
28.80 mm/hr
Return Period over Tc 3
< 2 Yr
Measured Flow
I/I Flow
Time of Peak Measured Flow
Aug 13, 2023 08:45
Time of Peak I/I Flow (TD)
Aug 13, 2023 06:15
Estimated Dry Weather Flow at TD
0.85 L/s
Peak Measured Flow
1.84 L/s
Peak I/I Flow 4
0.91 L/s
Peak I/I Rate 5
0.10 L/s/ha
Peak Measured Depth
55.00 mm
Total I/I Flow Volume during event
7,283.80 L
Volumetric Coefficient (Cv%) 6
0.32%
Total Measured Flow Volume during Event
77,639.90 L
Peak I/I Coefficient 7
0.0012
Hourly Wet-Weather Peaking Factor 8
1.83
Instantaneous Wet-Weather Peaking Factor 9
2.36
1
Time of Concentration (Tc): The estimated time for the flow to travel from the furthest point in the upstream area to the point of monitoring, assume flow is travelling at 1.00 m/s Peak Precipitation Intensity Over Tc: The peak rainfall intensity for the duration of the storm with the time interval defined by time of concentration 3 Return Period over Tc: The estimated time to elapse before a storm of equal or greater intensity will likely occur again, based on design storm criteria 4 Peak I/I Flow: The greatest difference captured between measured flow and estimated dry weather flow, Peak I/I Flow = Maximum (Measured Flow – Estimated Dry Weather Flow) 5 Peak I/I Rate: A normalized peak I/I flow based on catchment area size, Peak I/I Rate = Peak I/I Flow / Catchment Area 6 Volumetric Coefficient (Cv%): The ratio of total I/I volume and total rainfall volume, Cv% = Total I/I Flow Volume / Total Precipitation Volume * 100% 7 Peak I/ I Coefficient: The ratio of peak I/I flow and peak rainfall intensity, Peak I/ I Coefficient = Peak I/I Flow / (Peak Rainfall Intensity over Tc * Catchment Area) 8 Hourly Wet‐Weather Peaking Factor: The ratio of peak hourly wet‐weather measured flow and average dry‐weather flow, Wet‐Weather Peaking Factor = Peak Hourly Wet‐Weather Measured Flow / Average Dry-Weather Flow 9 Instantaneous Wet‐Weather Peaking Factor: The ratio of peak wet‐weather measured flow and average dry‐weather flow, Wet‐Weather Peaking Factor = Peak Wet‐Weather Measured Flow / Average Dry-Weather Flow 2
368 Civica Infrastructure Inc. www.civi.ca
Civica Infrastructures Inc. Kawartha Lakes Flow Monitoring Report
Appendix - A June 03, 2024
I/I Analysis Graph Station: F2
369 Civica Infrastructure Inc. www.civi.ca
Civica Infrastructures Inc. Kawartha Lakes Flow Monitoring Report
Appendix - A June 03, 2024
Infiltration/Inflow Event Analysis Station: F2 Oct 05, 2023 10:00 – Oct 07, 2023 09:35, Total Precipitation: 23.11 mm (2,195,829.70 L) Station Details
Storm Details
Catchment Area
9.50 ha
Total Precipitation
23.11 mm (2,195,829.70 L)
Duration of Storm
23.58 hr
Time of Concentration (Tc) 1
25 min
Peak Precipitation Intensity Over Tc 2
11.00 mm/hr
Return Period over Tc 3
< 2 Yr
Measured Flow
I/I Flow
Time of Peak Measured Flow
Oct 06, 2023 13:50
Time of Peak I/I Flow (TD)
Oct 06, 2023 13:50
Estimated Dry Weather Flow at TD
0.75 L/s
Peak Measured Flow
2.81 L/s
Peak I/I Flow 4
2.06 L/s
Peak I/I Rate 5
0.22 L/s/ha
Peak Measured Depth
64.00 mm
Total I/I Flow Volume during event
15,421.50 L
Volumetric Coefficient (Cv%) 6
0.70%
Total Measured Flow Volume during Event
95,611.20 L
Peak I/I Coefficient 7
0.0071
Hourly Wet-Weather Peaking Factor 8
2.32
Instantaneous Wet-Weather Peaking Factor 9
4.50
1
Time of Concentration (Tc): The estimated time for the flow to travel from the furthest point in the upstream area to the point of monitoring, assume flow is travelling at 1.00 m/s Peak Precipitation Intensity Over Tc: The peak rainfall intensity for the duration of the storm with the time interval defined by time of concentration 3 Return Period over Tc: The estimated time to elapse before a storm of equal or greater intensity will likely occur again, based on design storm criteria 4 Peak I/I Flow: The greatest difference captured between measured flow and estimated dry weather flow, Peak I/I Flow = Maximum (Measured Flow – Estimated Dry Weather Flow) 5 Peak I/I Rate: A normalized peak I/I flow based on catchment area size, Peak I/I Rate = Peak I/I Flow / Catchment Area 6 Volumetric Coefficient (Cv%): The ratio of total I/I volume and total rainfall volume, Cv% = Total I/I Flow Volume / Total Precipitation Volume * 100% 7 Peak I/ I Coefficient: The ratio of peak I/I flow and peak rainfall intensity, Peak I/ I Coefficient = Peak I/I Flow / (Peak Rainfall Intensity over Tc * Catchment Area) 8 Hourly Wet‐Weather Peaking Factor: The ratio of peak hourly wet‐weather measured flow and average dry‐weather flow, Wet‐Weather Peaking Factor = Peak Hourly Wet‐Weather Measured Flow / Average Dry-Weather Flow 9 Instantaneous Wet‐Weather Peaking Factor: The ratio of peak wet‐weather measured flow and average dry‐weather flow, Wet‐Weather Peaking Factor = Peak Wet‐Weather Measured Flow / Average Dry-Weather Flow 2
370 Civica Infrastructure Inc. www.civi.ca
Civica Infrastructures Inc. Kawartha Lakes Flow Monitoring Report
Appendix - A June 03, 2024
I/I Analysis Graph Station: F2
371 Civica Infrastructure Inc. www.civi.ca
Civica Infrastructures Inc. Kawartha Lakes Flow Monitoring Report
Appendix - A June 03, 2024
Infiltration/Inflow Event Analysis Station: F2 Oct 08, 2023 02:40 – Oct 10, 2023 12:50, Total Precipitation: 29.46 mm (2,799,080.00 L) Station Details
Storm Details
Catchment Area
9.50 ha
Total Precipitation
29.46 mm (2,799,080.00 L)
Duration of Storm
34.17 hr
Time of Concentration (Tc) 1
25 min
Peak Precipitation Intensity Over Tc 2
6.10 mm/hr
Return Period over Tc 3
< 2 Yr
Measured Flow
I/I Flow
Time of Peak Measured Flow
Oct 09, 2023 10:45
Time of Peak I/I Flow (TD)
Oct 09, 2023 10:45
Estimated Dry Weather Flow at TD
0.92 L/s
Peak Measured Flow
2.16 L/s
Peak I/I Flow 4
1.24 L/s
Peak I/I Rate 5
0.13 L/s/ha
Peak Measured Depth
57.00 mm
Total I/I Flow Volume during event
41,273.40 L
Volumetric Coefficient (Cv%) 6
1.48%
Total Measured Flow Volume during Event
161,486.80 L
Peak I/I Coefficient 7
0.0077
Hourly Wet-Weather Peaking Factor 8
2.02
Instantaneous Wet-Weather Peaking Factor 9
2.99
1
Time of Concentration (Tc): The estimated time for the flow to travel from the furthest point in the upstream area to the point of monitoring, assume flow is travelling at 1.00 m/s Peak Precipitation Intensity Over Tc: The peak rainfall intensity for the duration of the storm with the time interval defined by time of concentration 3 Return Period over Tc: The estimated time to elapse before a storm of equal or greater intensity will likely occur again, based on design storm criteria 4 Peak I/I Flow: The greatest difference captured between measured flow and estimated dry weather flow, Peak I/I Flow = Maximum (Measured Flow – Estimated Dry Weather Flow) 5 Peak I/I Rate: A normalized peak I/I flow based on catchment area size, Peak I/I Rate = Peak I/I Flow / Catchment Area 6 Volumetric Coefficient (Cv%): The ratio of total I/I volume and total rainfall volume, Cv% = Total I/I Flow Volume / Total Precipitation Volume * 100% 7 Peak I/ I Coefficient: The ratio of peak I/I flow and peak rainfall intensity, Peak I/ I Coefficient = Peak I/I Flow / (Peak Rainfall Intensity over Tc * Catchment Area) 8 Hourly Wet‐Weather Peaking Factor: The ratio of peak hourly wet‐weather measured flow and average dry‐weather flow, Wet‐Weather Peaking Factor = Peak Hourly Wet‐Weather Measured Flow / Average Dry-Weather Flow 9 Instantaneous Wet‐Weather Peaking Factor: The ratio of peak wet‐weather measured flow and average dry‐weather flow, Wet‐Weather Peaking Factor = Peak Wet‐Weather Measured Flow / Average Dry-Weather Flow 2
372 Civica Infrastructure Inc. www.civi.ca
Civica Infrastructures Inc. Kawartha Lakes Flow Monitoring Report
Appendix - A June 03, 2024
Activity Log Station: F2 Date Time
Type
Purpose of Visit
17-Jan-2023 09:20:00 AM
Installation Log
INSTALLATION
24-Jan-2023 05:52:00 PM
Maintenance Log
CALIBRATION
22-Feb-2023 01:13:00 PM
Maintenance Log
MAINTENANCE / CALIBRATION
DATA DOWNOADED , TELEMTERY SENT. ANTENNA REPLACED.
Yes
20-Mar-2023 12:14:00 PM
Maintenance Log
CALIBRATION
DATA DOWNLOADED, TELEMETRY SENT AND CHECKED, MEASUREMENTS TAKEN, PHOTO AND VIDEO TAKEN, SITE CALIBRATED, AV SENSOR ZEROED.
Yes
29-Mar-2023 12:45:00 PM
Maintenance Log
CALIBRATION
DATA DOWNLOADED, TELEMETRY SENT, DEBRIS CLEARED, MEASUREMENTS TAKEN, SITE CALIBRATED, PHOTOS TAKEN
Yes
10-May-2023 01:37:00 PM
Removal Log
Removal
SET UP TC, DOWNLOADED DATA, SENT TELEMETRY,FLUME DISLODGED TOOK MEASUREMENTS, TOOK PHOTOS, REMOVED EQUIPMENT, REMOVAL COMPLETED.
Yes
23-Jun-2023 12:40:00 PM
Installation Log
INSTALLATION
TC SET,SURVEY SENT, SERIAL NUMBERS NOTED,MEASUREMENT TAKEN,A/V SENSOR INSTALLED IN INLET,DOWNWARD SENSOR INSTALLED,SITE CALIBRATED,SITE CLEARED
Yes
21-Jul-2023 09:57:00 AM
Maintenance Log
CALIBRATION
TC SET,SURVEY SENT,DATA DOWNLOADED,TELEMETRY SENT,ANTENNA CHECKED,DESSICASNT REPLACED,ENTRY MADE,FLUME INSTALLED,DOWNWARDS CSO REMOVED AND REPLACED WITH LIDOTT, DEBRIS AND SILT CLEARED,CALIBRATION DONE,MEASUREMENTS NOTED,SITE CLEARED. HEAD IS 24MM
Yes
22-Aug-2023 12:50:00 PM
Maintenance Log
DATA DOWNLOAD
TC SET,DATA DOWNLOADED,TELEMETRY SENT,DESSICANT CHECKED,ANTENNA CHECKED,SITE CLEARED
Yes
REMOVAL
SET UP TC/CSE, DOWNLOADED DATA, SENT TELEMETRY, PMAC ID: 8340, TOOK MEASUREMENTS, CALIBRATED SITE, REMOVED ALL EQUIPMENT, REMOVAL COMPLETE, note: SILT 8mm, MODERATE DEBRIS, THE RAIN CAP HAD FALLEN IN THE MANHOLE ON ARRIVAL (WE REMOVED IT-IT MIGHT HAVE FALLEN DUE TO THE WEIGHT OF THE WATER SINCE IT WAS FULL OF WATER AND SAND)
Yes
17-Oct-2023 09:35:00 AM
Removal Log
Comment MEASUREMENTS TAKEN, PHOTOS TAKEN, LOGGER INSTALLED, DEBRIS ON CHANNEL (ROCKS) CLEARED WITH THE SHOVEL DATA DOWNLOADED, MEASUREMENTS TAKEN, TELEMETRY SENT, PHOTOS TAKEN, LIDOTT AND FLUME ADJUSTED
373 Civica Infrastructure Inc. www.civi.ca
Calibration Measurement Yes Yes
Civica Infrastructures Inc. Kawartha Lakes Flow Monitoring Report
Appendix - A June 03, 2024
Aggregate Data Station: F3
Precipitation Date From
Date To
Days
Min (mm)
Avg (mm)
Max (mm)
Sum (mm)
Count
Time of Min1
Time of Max1
Jan 17, 2023
Oct 17, 2023
230
0.00
0.01
6.35
528.27
59,223
Tue Feb 21, 2023 13:00
Sat Mar 04, 2023 14:00
Level Date From
Date To
Days
Min (m)
Avg (m)
Max (m)
Count
Time of Min1
Time of Max1
Jan 17, 2023
Oct 17, 2023
231
0.00
0.09
0.23
66,088
Tue Jan 17, 2023 00:00
Wed Apr 05, 2023 19:55
Velocity Date From
Date To
Days
Min (m/s)
Avg (m/s)
Max (m/s)
Count
Time of Min1
Time of Max1
Jan 17, 2023
Oct 17, 2023
231
0.00
0.53
1.16
65,939
Wed Jul 19, 2023 03:40
Fri Mar 17, 2023 17:55
Flow
1
Date From
Date To
Days
Min (L/s)
Avg (L/s)
Max (L/s)
Total Volume (1,000,000 L)
Count
Time of Min1
Time of Max1
Jan 17, 2023
Oct 17, 2023
231
0.05
18.26
89.12
361.24
65,939
Wed Jul 19, 2023 03:40
Fri Mar 17, 2023 17:55
Time of Min and Time of Max will be displayed by first occurrence
374 Civica Infrastructure Inc. www.civi.ca
Civica Infrastructures Inc. Kawartha Lakes Flow Monitoring Report
Appendix - A June 03, 2024
Data Chart Station: F3 Jan 17, 2023 – Jan 31, 2023
375 Civica Infrastructure Inc. www.civi.ca
Civica Infrastructures Inc. Kawartha Lakes Flow Monitoring Report
Appendix - A June 03, 2024
Data Chart Station: F3 Feb 01, 2023 – Feb 28, 2023
376 Civica Infrastructure Inc. www.civi.ca
Civica Infrastructures Inc. Kawartha Lakes Flow Monitoring Report
Appendix - A June 03, 2024
Data Chart Station: F3 Mar 01, 2023 – Mar 31, 2023
377 Civica Infrastructure Inc. www.civi.ca
Civica Infrastructures Inc. Kawartha Lakes Flow Monitoring Report
Appendix - A June 03, 2024
Data Chart Station: F3 Apr 01, 2023 – Apr 30, 2023
378 Civica Infrastructure Inc. www.civi.ca
Civica Infrastructures Inc. Kawartha Lakes Flow Monitoring Report
Appendix - A June 03, 2024
Data Chart Station: F3 May 01, 2023 – May 31, 2023
379 Civica Infrastructure Inc. www.civi.ca
Civica Infrastructures Inc. Kawartha Lakes Flow Monitoring Report
Appendix - A June 03, 2024
Data Chart Station: F3 Jun 01, 2023 – Jun 30, 2023
380 Civica Infrastructure Inc. www.civi.ca
Civica Infrastructures Inc. Kawartha Lakes Flow Monitoring Report
Appendix - A June 03, 2024
Data Chart Station: F3 Jul 01, 2023 – Jul 31, 2023
381 Civica Infrastructure Inc. www.civi.ca
Civica Infrastructures Inc. Kawartha Lakes Flow Monitoring Report
Appendix - A June 03, 2024
Data Chart Station: F3 Aug 01, 2023 – Aug 31, 2023
382 Civica Infrastructure Inc. www.civi.ca
Civica Infrastructures Inc. Kawartha Lakes Flow Monitoring Report
Appendix - A June 03, 2024
Data Chart Station: F3 Sep 01, 2023 – Sep 30, 2023
383 Civica Infrastructure Inc. www.civi.ca
Civica Infrastructures Inc. Kawartha Lakes Flow Monitoring Report
Appendix - A June 03, 2024
Data Chart Station: F3 Oct 01, 2023 – Oct 17, 2023
384 Civica Infrastructure Inc. www.civi.ca
Civica Infrastructures Inc. Kawartha Lakes Flow Monitoring Report
Appendix - A June 03, 2024
Sanitary Report Station: F3
1
Average Dry Weather Flow (L/s)
Average Dry Weather Flow (L/c/d)
Average Daily Minimum Dry Weather Flow (L/s)
Average Daily Peak Dry Weather Flow (L/s)
17.040
653.172
4.186
40.028
Peaking Factor
Groundwater Infiltration (L/s)1
Groundwater Infiltration (L/ha/d)
% of GWI in Average DWF
2.349
3.558
1,776.812
20.879
Groundwater infiltration (GWI) is assumed as 85% of the daily minimum flow averaged over the monitoring period
385 Civica Infrastructure Inc. www.civi.ca
Civica Infrastructures Inc. Kawartha Lakes Flow Monitoring Report
Appendix - A June 03, 2024
I/I Analysis Table
1 2
Event1
Total Precipitation (mm)
Duration (hours)
Peak Intensity Over Tc at Station (mm/hr)
Mar 31, 2023
22.25
18.08
Apr 05, 2023
33.75
Apr 30, 2023
F3 Measured Peak Flow (L/s)
Peak I/I Flow (L/s)
Peak I/I Rate (L/s/ha)
Volumetric Runoff Coefficient (CV%)
Peaking Factor (PF)
5.60
68.59
39.77
0.23
2.45 %
1.58
10.58
15.40
82.91
55.51
0.32
3.00 %
2.32
24.75
7.92
6.90
56.03
36.59
0.21
2.49 %
1.82
May 19, 2023
38.75
14.75
12.00
N/A 2
Jun 11, 2023
46.50
25.92
6.86
N/A 2
Jun 23, 2023
20.50
38.25
24.00
N/A 2
Jun 25, 2023
18.25
1.42
20.60
Jun 26, 2023
20.25
8.50
17.60
Jun 27, 2023
15.00
7.92
Jul 13, 2023
19.00
Jul 29, 2023
Flow KPIs
Measured Storms
Station: F3
39.56
21.29
0.12
0.79 %
1.53
51.84
32.24
0.19
1.61 %
1.81
9.90
56.50
38.03
0.22
3.80 %
2.19
4.33
7.70
39.02
23.23
0.13
0.96 %
1.73
17.50
2.08
21.40
50.11
28.05
0.16
1.01 %
1.86
Aug 12, 2023
23.75
13.17
22.30
46.93
27.82
0.16
1.35 %
2.07
Oct 05, 2023
23.11
23.58
8.70
40.40
26.25
0.15
1.60 %
2.32
Oct 08, 2023
29.46
34.17
6.10
49.11
35.25
0.20
2.39 %
2.84
Average
25.20
15.05
13.22
52.82
33.09
0.19
1.95 %
2.01
Maximum
46.50
38.25
24.00
82.91
55.51
0.32
3.80 %
2.84
An event is a storm with a minimum volume of 15mm and a minimum inter-event dry period of 12 hours I/I event analysis unable to be completed due to missing flow monitoring data during event
386 Civica Infrastructure Inc. www.civi.ca
Civica Infrastructures Inc. Kawartha Lakes Flow Monitoring Report
Appendix - A June 03, 2024
I/I Analysis Graph Station: F3
387 Civica Infrastructure Inc. www.civi.ca
Civica Infrastructures Inc. Kawartha Lakes Flow Monitoring Report
Appendix - A June 03, 2024
Infiltration/Inflow Event Analysis Station: F3 Mar 31, 2023 01:02 – Apr 01, 2023 19:07, Total Precipitation: 22.25 mm (38,492,500.00 L) Station Details
Storm Details
Catchment Area
173.00 ha
Total Precipitation
22.25 mm (38,492,500.00 L)
Duration of Storm
18.08 hr
Time of Concentration (Tc) 1
35 min
Peak Precipitation Intensity Over Tc 2
5.60 mm/hr
Return Period over Tc 3
< 2 Yr
Measured Flow
I/I Flow
Time of Peak Measured Flow
Apr 01, 2023 14:25
Time of Peak I/I Flow (TD)
Apr 01, 2023 14:25
Estimated Dry Weather Flow at TD
28.82 L/s
Peak Measured Flow
68.59 L/s
Peak I/I Flow 4
39.77 L/s
Peak I/I Rate 5
0.23 L/s/ha
Peak Measured Depth
177.00 mm
Total I/I Flow Volume during event
942,826.00 L
Volumetric Coefficient (Cv%) 6
2.45%
Total Measured Flow Volume during Event
3,671,070.20 L
Peak I/I Coefficient 7
0.0149
Hourly Wet-Weather Peaking Factor 8
1.90
Instantaneous Wet-Weather Peaking Factor 9
2.72
1
Time of Concentration (Tc): The estimated time for the flow to travel from the furthest point in the upstream area to the point of monitoring, assume flow is travelling at 1.00 m/s Peak Precipitation Intensity Over Tc: The peak rainfall intensity for the duration of the storm with the time interval defined by time of concentration 3 Return Period over Tc: The estimated time to elapse before a storm of equal or greater intensity will likely occur again, based on design storm criteria 4 Peak I/I Flow: The greatest difference captured between measured flow and estimated dry weather flow, Peak I/I Flow = Maximum (Measured Flow – Estimated Dry Weather Flow) 5 Peak I/I Rate: A normalized peak I/I flow based on catchment area size, Peak I/I Rate = Peak I/I Flow / Catchment Area 6 Volumetric Coefficient (Cv%): The ratio of total I/I volume and total rainfall volume, Cv% = Total I/I Flow Volume / Total Precipitation Volume * 100% 7 Peak I/ I Coefficient: The ratio of peak I/I flow and peak rainfall intensity, Peak I/ I Coefficient = Peak I/I Flow / (Peak Rainfall Intensity over Tc * Catchment Area) 8 Hourly Wet‐Weather Peaking Factor: The ratio of peak hourly wet‐weather measured flow and average dry‐weather flow, Wet‐Weather Peaking Factor = Peak Hourly Wet‐Weather Measured Flow / Average Dry-Weather Flow 9 Instantaneous Wet‐Weather Peaking Factor: The ratio of peak wet‐weather measured flow and average dry‐weather flow, Wet‐Weather Peaking Factor = Peak Wet‐Weather Measured Flow / Average Dry-Weather Flow 2
388 Civica Infrastructure Inc. www.civi.ca
Civica Infrastructures Inc. Kawartha Lakes Flow Monitoring Report
Appendix - A June 03, 2024
I/I Analysis Graph Station: F3
389 Civica Infrastructure Inc. www.civi.ca
Civica Infrastructures Inc. Kawartha Lakes Flow Monitoring Report
Appendix - A June 03, 2024
Infiltration/Inflow Event Analysis Station: F3 Apr 04, 2023 17:42 – Apr 06, 2023 04:17, Total Precipitation: 33.75 mm (58,387,500.00 L) Station Details
Storm Details
Catchment Area
173.00 ha
Total Precipitation
33.75 mm (58,387,500.00 L)
Duration of Storm
10.58 hr
Time of Concentration (Tc) 1
35 min
Peak Precipitation Intensity Over Tc 2
15.40 mm/hr
Return Period over Tc 3
< 2 Yr
Measured Flow
I/I Flow
Time of Peak Measured Flow
Apr 05, 2023 19:55
Time of Peak I/I Flow (TD)
Apr 05, 2023 20:10
Estimated Dry Weather Flow at TD
26.74 L/s
Peak Measured Flow
82.91 L/s
Peak I/I Flow 4
55.51 L/s
Peak I/I Rate 5
0.32 L/s/ha
Peak Measured Depth
228.00 mm
Total I/I Flow Volume during event
1,750,710.70 L
Volumetric Coefficient (Cv%) 6
3.00%
Total Measured Flow Volume during Event
3,694,548.30 L
Peak I/I Coefficient 7
0.0075
Hourly Wet-Weather Peaking Factor 8
2.94
Instantaneous Wet-Weather Peaking Factor 9
3.47
1
Time of Concentration (Tc): The estimated time for the flow to travel from the furthest point in the upstream area to the point of monitoring, assume flow is travelling at 1.00 m/s Peak Precipitation Intensity Over Tc: The peak rainfall intensity for the duration of the storm with the time interval defined by time of concentration 3 Return Period over Tc: The estimated time to elapse before a storm of equal or greater intensity will likely occur again, based on design storm criteria 4 Peak I/I Flow: The greatest difference captured between measured flow and estimated dry weather flow, Peak I/I Flow = Maximum (Measured Flow – Estimated Dry Weather Flow) 5 Peak I/I Rate: A normalized peak I/I flow based on catchment area size, Peak I/I Rate = Peak I/I Flow / Catchment Area 6 Volumetric Coefficient (Cv%): The ratio of total I/I volume and total rainfall volume, Cv% = Total I/I Flow Volume / Total Precipitation Volume * 100% 7 Peak I/ I Coefficient: The ratio of peak I/I flow and peak rainfall intensity, Peak I/ I Coefficient = Peak I/I Flow / (Peak Rainfall Intensity over Tc * Catchment Area) 8 Hourly Wet‐Weather Peaking Factor: The ratio of peak hourly wet‐weather measured flow and average dry‐weather flow, Wet‐Weather Peaking Factor = Peak Hourly Wet‐Weather Measured Flow / Average Dry-Weather Flow 9 Instantaneous Wet‐Weather Peaking Factor: The ratio of peak wet‐weather measured flow and average dry‐weather flow, Wet‐Weather Peaking Factor = Peak Wet‐Weather Measured Flow / Average Dry-Weather Flow 2
390 Civica Infrastructure Inc. www.civi.ca
Civica Infrastructures Inc. Kawartha Lakes Flow Monitoring Report
Appendix - A June 03, 2024
I/I Analysis Graph Station: F3
391 Civica Infrastructure Inc. www.civi.ca
Civica Infrastructures Inc. Kawartha Lakes Flow Monitoring Report
Appendix - A June 03, 2024
Infiltration/Inflow Event Analysis Station: F3 Apr 30, 2023 00:27 – May 01, 2023 08:22, Total Precipitation: 24.75 mm (42,817,500.00 L) Station Details
Storm Details
Catchment Area
173.00 ha
Total Precipitation
24.75 mm (42,817,500.00 L)
Duration of Storm
7.92 hr
Time of Concentration (Tc) 1
35 min
Peak Precipitation Intensity Over Tc 2
6.90 mm/hr
Return Period over Tc 3
< 2 Yr
Measured Flow
I/I Flow
Time of Peak Measured Flow
May 01, 2023 07:10
Time of Peak I/I Flow (TD)
May 01, 2023 00:55
Estimated Dry Weather Flow at TD
15.97 L/s
Peak Measured Flow
56.03 L/s
Peak I/I Flow 4
36.59 L/s
Peak I/I Rate 5
0.21 L/s/ha
Peak Measured Depth
189.00 mm
Total I/I Flow Volume during event
1,066,411.60 L
Volumetric Coefficient (Cv%) 6
2.49%
Total Measured Flow Volume during Event
2,511,332.50 L
Peak I/I Coefficient 7
0.0111
Hourly Wet-Weather Peaking Factor 8
2.29
Instantaneous Wet-Weather Peaking Factor 9
2.78
1
Time of Concentration (Tc): The estimated time for the flow to travel from the furthest point in the upstream area to the point of monitoring, assume flow is travelling at 1.00 m/s Peak Precipitation Intensity Over Tc: The peak rainfall intensity for the duration of the storm with the time interval defined by time of concentration 3 Return Period over Tc: The estimated time to elapse before a storm of equal or greater intensity will likely occur again, based on design storm criteria 4 Peak I/I Flow: The greatest difference captured between measured flow and estimated dry weather flow, Peak I/I Flow = Maximum (Measured Flow – Estimated Dry Weather Flow) 5 Peak I/I Rate: A normalized peak I/I flow based on catchment area size, Peak I/I Rate = Peak I/I Flow / Catchment Area 6 Volumetric Coefficient (Cv%): The ratio of total I/I volume and total rainfall volume, Cv% = Total I/I Flow Volume / Total Precipitation Volume * 100% 7 Peak I/ I Coefficient: The ratio of peak I/I flow and peak rainfall intensity, Peak I/ I Coefficient = Peak I/I Flow / (Peak Rainfall Intensity over Tc * Catchment Area) 8 Hourly Wet‐Weather Peaking Factor: The ratio of peak hourly wet‐weather measured flow and average dry‐weather flow, Wet‐Weather Peaking Factor = Peak Hourly Wet‐Weather Measured Flow / Average Dry-Weather Flow 9 Instantaneous Wet‐Weather Peaking Factor: The ratio of peak wet‐weather measured flow and average dry‐weather flow, Wet‐Weather Peaking Factor = Peak Wet‐Weather Measured Flow / Average Dry-Weather Flow 2
392 Civica Infrastructure Inc. www.civi.ca
Civica Infrastructures Inc. Kawartha Lakes Flow Monitoring Report
Appendix - A June 03, 2024
I/I Analysis Graph Station: F3
393 Civica Infrastructure Inc. www.civi.ca
Civica Infrastructures Inc. Kawartha Lakes Flow Monitoring Report
Appendix - A June 03, 2024
Infiltration/Inflow Event Analysis Station: F3 Jun 25, 2023 00:47 – Jun 26, 2023 02:12, Total Precipitation: 18.25 mm (31,572,500.00 L) Station Details
Storm Details
Catchment Area
173.00 ha
Total Precipitation
18.25 mm (31,572,500.00 L)
Duration of Storm
1.42 hr
Time of Concentration (Tc) 1
35 min
Peak Precipitation Intensity Over Tc 2
20.60 mm/hr
Return Period over Tc 3
< 2 Yr
Measured Flow
I/I Flow
Time of Peak Measured Flow
Jun 25, 2023 20:45
Time of Peak I/I Flow (TD)
Jun 25, 2023 13:40
Estimated Dry Weather Flow at TD
16.26 L/s
Peak Measured Flow
39.56 L/s
Peak I/I Flow 4
21.29 L/s
Peak I/I Rate 5
0.12 L/s/ha
Peak Measured Depth
139.00 mm
Total I/I Flow Volume during event
248,093.40 L
Volumetric Coefficient (Cv%) 6
0.79%
Total Measured Flow Volume during Event
921,152.80 L
Peak I/I Coefficient 7
0.0022
Hourly Wet-Weather Peaking Factor 8
1.84
Instantaneous Wet-Weather Peaking Factor 9
2.84
1
Time of Concentration (Tc): The estimated time for the flow to travel from the furthest point in the upstream area to the point of monitoring, assume flow is travelling at 1.00 m/s Peak Precipitation Intensity Over Tc: The peak rainfall intensity for the duration of the storm with the time interval defined by time of concentration 3 Return Period over Tc: The estimated time to elapse before a storm of equal or greater intensity will likely occur again, based on design storm criteria 4 Peak I/I Flow: The greatest difference captured between measured flow and estimated dry weather flow, Peak I/I Flow = Maximum (Measured Flow – Estimated Dry Weather Flow) 5 Peak I/I Rate: A normalized peak I/I flow based on catchment area size, Peak I/I Rate = Peak I/I Flow / Catchment Area 6 Volumetric Coefficient (Cv%): The ratio of total I/I volume and total rainfall volume, Cv% = Total I/I Flow Volume / Total Precipitation Volume * 100% 7 Peak I/ I Coefficient: The ratio of peak I/I flow and peak rainfall intensity, Peak I/ I Coefficient = Peak I/I Flow / (Peak Rainfall Intensity over Tc * Catchment Area) 8 Hourly Wet‐Weather Peaking Factor: The ratio of peak hourly wet‐weather measured flow and average dry‐weather flow, Wet‐Weather Peaking Factor = Peak Hourly Wet‐Weather Measured Flow / Average Dry-Weather Flow 9 Instantaneous Wet‐Weather Peaking Factor: The ratio of peak wet‐weather measured flow and average dry‐weather flow, Wet‐Weather Peaking Factor = Peak Wet‐Weather Measured Flow / Average Dry-Weather Flow 2
394 Civica Infrastructure Inc. www.civi.ca
Civica Infrastructures Inc. Kawartha Lakes Flow Monitoring Report
Appendix - A June 03, 2024
I/I Analysis Graph Station: F3
395 Civica Infrastructure Inc. www.civi.ca
Civica Infrastructures Inc. Kawartha Lakes Flow Monitoring Report
Appendix - A June 03, 2024
Infiltration/Inflow Event Analysis Station: F3 Jun 25, 2023 15:17 – Jun 26, 2023 23:47, Total Precipitation: 20.25 mm (35,032,500.00 L) Station Details
Storm Details
Catchment Area
173.00 ha
Total Precipitation
20.25 mm (35,032,500.00 L)
Duration of Storm
8.50 hr
Time of Concentration (Tc) 1
35 min
Peak Precipitation Intensity Over Tc 2
17.60 mm/hr
Return Period over Tc 3
< 2 Yr
Measured Flow
I/I Flow
Time of Peak Measured Flow
Jun 26, 2023 20:30
Time of Peak I/I Flow (TD)
Jun 26, 2023 20:30
Estimated Dry Weather Flow at TD
19.60 L/s
Peak Measured Flow
51.84 L/s
Peak I/I Flow 4
32.24 L/s
Peak I/I Rate 5
0.19 L/s/ha
Peak Measured Depth
155.00 mm
Total I/I Flow Volume during event
563,573.40 L
Volumetric Coefficient (Cv%) 6
1.61%
Total Measured Flow Volume during Event
1,879,034.90 L
Peak I/I Coefficient 7
0.0038
Hourly Wet-Weather Peaking Factor 8
2.02
Instantaneous Wet-Weather Peaking Factor 9
2.91
1
Time of Concentration (Tc): The estimated time for the flow to travel from the furthest point in the upstream area to the point of monitoring, assume flow is travelling at 1.00 m/s Peak Precipitation Intensity Over Tc: The peak rainfall intensity for the duration of the storm with the time interval defined by time of concentration 3 Return Period over Tc: The estimated time to elapse before a storm of equal or greater intensity will likely occur again, based on design storm criteria 4 Peak I/I Flow: The greatest difference captured between measured flow and estimated dry weather flow, Peak I/I Flow = Maximum (Measured Flow – Estimated Dry Weather Flow) 5 Peak I/I Rate: A normalized peak I/I flow based on catchment area size, Peak I/I Rate = Peak I/I Flow / Catchment Area 6 Volumetric Coefficient (Cv%): The ratio of total I/I volume and total rainfall volume, Cv% = Total I/I Flow Volume / Total Precipitation Volume * 100% 7 Peak I/ I Coefficient: The ratio of peak I/I flow and peak rainfall intensity, Peak I/ I Coefficient = Peak I/I Flow / (Peak Rainfall Intensity over Tc * Catchment Area) 8 Hourly Wet‐Weather Peaking Factor: The ratio of peak hourly wet‐weather measured flow and average dry‐weather flow, Wet‐Weather Peaking Factor = Peak Hourly Wet‐Weather Measured Flow / Average Dry-Weather Flow 9 Instantaneous Wet‐Weather Peaking Factor: The ratio of peak wet‐weather measured flow and average dry‐weather flow, Wet‐Weather Peaking Factor = Peak Wet‐Weather Measured Flow / Average Dry-Weather Flow 2
396 Civica Infrastructure Inc. www.civi.ca
Civica Infrastructures Inc. Kawartha Lakes Flow Monitoring Report
Appendix - A June 03, 2024
I/I Analysis Graph Station: F3
397 Civica Infrastructure Inc. www.civi.ca
Civica Infrastructures Inc. Kawartha Lakes Flow Monitoring Report
Appendix - A June 03, 2024
Infiltration/Inflow Event Analysis Station: F3 Jun 26, 2023 21:52 – Jun 28, 2023 05:47, Total Precipitation: 15.00 mm (25,950,000.00 L) Station Details
Storm Details
Catchment Area
173.00 ha
Total Precipitation
15.00 mm (25,950,000.00 L)
Duration of Storm
7.92 hr
Time of Concentration (Tc) 1
35 min
Peak Precipitation Intensity Over Tc 2
9.90 mm/hr
Return Period over Tc 3
< 2 Yr
Measured Flow
I/I Flow
Time of Peak Measured Flow
Jun 27, 2023 16:25
Time of Peak I/I Flow (TD)
Jun 27, 2023 22:40
Estimated Dry Weather Flow at TD
11.05 L/s
Peak Measured Flow
56.50 L/s
Peak I/I Flow 4
38.03 L/s
Peak I/I Rate 5
0.22 L/s/ha
Peak Measured Depth
166.00 mm
Total I/I Flow Volume during event
985,057.60 L
Volumetric Coefficient (Cv%) 6
3.80%
Total Measured Flow Volume during Event
2,229,343.20 L
Peak I/I Coefficient 7
0.0080
Hourly Wet-Weather Peaking Factor 8
2.28
Instantaneous Wet-Weather Peaking Factor 9
3.26
1
Time of Concentration (Tc): The estimated time for the flow to travel from the furthest point in the upstream area to the point of monitoring, assume flow is travelling at 1.00 m/s Peak Precipitation Intensity Over Tc: The peak rainfall intensity for the duration of the storm with the time interval defined by time of concentration 3 Return Period over Tc: The estimated time to elapse before a storm of equal or greater intensity will likely occur again, based on design storm criteria 4 Peak I/I Flow: The greatest difference captured between measured flow and estimated dry weather flow, Peak I/I Flow = Maximum (Measured Flow – Estimated Dry Weather Flow) 5 Peak I/I Rate: A normalized peak I/I flow based on catchment area size, Peak I/I Rate = Peak I/I Flow / Catchment Area 6 Volumetric Coefficient (Cv%): The ratio of total I/I volume and total rainfall volume, Cv% = Total I/I Flow Volume / Total Precipitation Volume * 100% 7 Peak I/ I Coefficient: The ratio of peak I/I flow and peak rainfall intensity, Peak I/ I Coefficient = Peak I/I Flow / (Peak Rainfall Intensity over Tc * Catchment Area) 8 Hourly Wet‐Weather Peaking Factor: The ratio of peak hourly wet‐weather measured flow and average dry‐weather flow, Wet‐Weather Peaking Factor = Peak Hourly Wet‐Weather Measured Flow / Average Dry-Weather Flow 9 Instantaneous Wet‐Weather Peaking Factor: The ratio of peak wet‐weather measured flow and average dry‐weather flow, Wet‐Weather Peaking Factor = Peak Wet‐Weather Measured Flow / Average Dry-Weather Flow 2
398 Civica Infrastructure Inc. www.civi.ca
Civica Infrastructures Inc. Kawartha Lakes Flow Monitoring Report
Appendix - A June 03, 2024
I/I Analysis Graph Station: F3
399 Civica Infrastructure Inc. www.civi.ca
Civica Infrastructures Inc. Kawartha Lakes Flow Monitoring Report
Appendix - A June 03, 2024
Infiltration/Inflow Event Analysis Station: F3 Jul 12, 2023 14:27 – Jul 13, 2023 18:47, Total Precipitation: 19.00 mm (32,870,000.00 L) Station Details
Storm Details
Catchment Area
173.00 ha
Total Precipitation
19.00 mm (32,870,000.00 L)
Duration of Storm
4.33 hr
Time of Concentration (Tc) 1
35 min
Peak Precipitation Intensity Over Tc 2
7.70 mm/hr
Return Period over Tc 3
< 2 Yr
Measured Flow
I/I Flow
Time of Peak Measured Flow
Jul 13, 2023 08:25
Time of Peak I/I Flow (TD)
Jul 13, 2023 05:10
Estimated Dry Weather Flow at TD
9.06 L/s
Peak Measured Flow
39.02 L/s
Peak I/I Flow 4
23.23 L/s
Peak I/I Rate 5
0.13 L/s/ha
Peak Measured Depth
140.00 mm
Total I/I Flow Volume during event
314,767.80 L
Volumetric Coefficient (Cv%) 6
0.96%
Total Measured Flow Volume during Event
1,104,740.60 L
Peak I/I Coefficient 7
0.0063
Hourly Wet-Weather Peaking Factor 8
1.92
Instantaneous Wet-Weather Peaking Factor 9
2.90
1
Time of Concentration (Tc): The estimated time for the flow to travel from the furthest point in the upstream area to the point of monitoring, assume flow is travelling at 1.00 m/s Peak Precipitation Intensity Over Tc: The peak rainfall intensity for the duration of the storm with the time interval defined by time of concentration 3 Return Period over Tc: The estimated time to elapse before a storm of equal or greater intensity will likely occur again, based on design storm criteria 4 Peak I/I Flow: The greatest difference captured between measured flow and estimated dry weather flow, Peak I/I Flow = Maximum (Measured Flow – Estimated Dry Weather Flow) 5 Peak I/I Rate: A normalized peak I/I flow based on catchment area size, Peak I/I Rate = Peak I/I Flow / Catchment Area 6 Volumetric Coefficient (Cv%): The ratio of total I/I volume and total rainfall volume, Cv% = Total I/I Flow Volume / Total Precipitation Volume * 100% 7 Peak I/ I Coefficient: The ratio of peak I/I flow and peak rainfall intensity, Peak I/ I Coefficient = Peak I/I Flow / (Peak Rainfall Intensity over Tc * Catchment Area) 8 Hourly Wet‐Weather Peaking Factor: The ratio of peak hourly wet‐weather measured flow and average dry‐weather flow, Wet‐Weather Peaking Factor = Peak Hourly Wet‐Weather Measured Flow / Average Dry-Weather Flow 9 Instantaneous Wet‐Weather Peaking Factor: The ratio of peak wet‐weather measured flow and average dry‐weather flow, Wet‐Weather Peaking Factor = Peak Wet‐Weather Measured Flow / Average Dry-Weather Flow 2
400 Civica Infrastructure Inc. www.civi.ca
Civica Infrastructures Inc. Kawartha Lakes Flow Monitoring Report
Appendix - A June 03, 2024
I/I Analysis Graph Station: F3
401 Civica Infrastructure Inc. www.civi.ca
Civica Infrastructures Inc. Kawartha Lakes Flow Monitoring Report
Appendix - A June 03, 2024
Infiltration/Inflow Event Analysis Station: F3 Jul 28, 2023 21:14 – Jul 29, 2023 23:19, Total Precipitation: 17.50 mm (30,275,000.00 L) Station Details
Storm Details
Catchment Area
173.00 ha
Total Precipitation
17.50 mm (30,275,000.00 L)
Duration of Storm
2.08 hr
Time of Concentration (Tc) 1
35 min
Peak Precipitation Intensity Over Tc 2
21.40 mm/hr
Return Period over Tc 3
< 2 Yr
Measured Flow
I/I Flow
Time of Peak Measured Flow
Jul 29, 2023 10:15
Time of Peak I/I Flow (TD)
Jul 29, 2023 21:40
Estimated Dry Weather Flow at TD
9.15 L/s
Peak Measured Flow
50.11 L/s
Peak I/I Flow 4
28.05 L/s
Peak I/I Rate 5
0.16 L/s/ha
Peak Measured Depth
153.00 mm
Total I/I Flow Volume during event
307,104.20 L
Volumetric Coefficient (Cv%) 6
1.01%
Total Measured Flow Volume during Event
1,073,417.80 L
Peak I/I Coefficient 7
0.0027
Hourly Wet-Weather Peaking Factor 8
2.06
Instantaneous Wet-Weather Peaking Factor 9
3.32
1
Time of Concentration (Tc): The estimated time for the flow to travel from the furthest point in the upstream area to the point of monitoring, assume flow is travelling at 1.00 m/s Peak Precipitation Intensity Over Tc: The peak rainfall intensity for the duration of the storm with the time interval defined by time of concentration 3 Return Period over Tc: The estimated time to elapse before a storm of equal or greater intensity will likely occur again, based on design storm criteria 4 Peak I/I Flow: The greatest difference captured between measured flow and estimated dry weather flow, Peak I/I Flow = Maximum (Measured Flow – Estimated Dry Weather Flow) 5 Peak I/I Rate: A normalized peak I/I flow based on catchment area size, Peak I/I Rate = Peak I/I Flow / Catchment Area 6 Volumetric Coefficient (Cv%): The ratio of total I/I volume and total rainfall volume, Cv% = Total I/I Flow Volume / Total Precipitation Volume * 100% 7 Peak I/ I Coefficient: The ratio of peak I/I flow and peak rainfall intensity, Peak I/ I Coefficient = Peak I/I Flow / (Peak Rainfall Intensity over Tc * Catchment Area) 8 Hourly Wet‐Weather Peaking Factor: The ratio of peak hourly wet‐weather measured flow and average dry‐weather flow, Wet‐Weather Peaking Factor = Peak Hourly Wet‐Weather Measured Flow / Average Dry-Weather Flow 9 Instantaneous Wet‐Weather Peaking Factor: The ratio of peak wet‐weather measured flow and average dry‐weather flow, Wet‐Weather Peaking Factor = Peak Wet‐Weather Measured Flow / Average Dry-Weather Flow 2
402 Civica Infrastructure Inc. www.civi.ca
Civica Infrastructures Inc. Kawartha Lakes Flow Monitoring Report
Appendix - A June 03, 2024
I/I Analysis Graph Station: F3
403 Civica Infrastructure Inc. www.civi.ca
Civica Infrastructures Inc. Kawartha Lakes Flow Monitoring Report
Appendix - A June 03, 2024
Infiltration/Inflow Event Analysis Station: F3 Aug 11, 2023 22:04 – Aug 13, 2023 11:14, Total Precipitation: 23.75 mm (41,087,500.00 L) Station Details
Storm Details
Catchment Area
173.00 ha
Total Precipitation
23.75 mm (41,087,500.00 L)
Duration of Storm
13.17 hr
Time of Concentration (Tc) 1
35 min
Peak Precipitation Intensity Over Tc 2
22.30 mm/hr
Return Period over Tc 3
< 2 Yr
Measured Flow
I/I Flow
Time of Peak Measured Flow
Aug 12, 2023 10:55
Time of Peak I/I Flow (TD)
Aug 12, 2023 11:55
Estimated Dry Weather Flow at TD
17.38 L/s
Peak Measured Flow
46.93 L/s
Peak I/I Flow 4
27.82 L/s
Peak I/I Rate 5
0.16 L/s/ha
Peak Measured Depth
161.00 mm
Total I/I Flow Volume during event
555,370.20 L
Volumetric Coefficient (Cv%) 6
1.35%
Total Measured Flow Volume during Event
1,772,147.00 L
Peak I/I Coefficient 7
0.0026
Hourly Wet-Weather Peaking Factor 8
2.58
Instantaneous Wet-Weather Peaking Factor 9
3.49
1
Time of Concentration (Tc): The estimated time for the flow to travel from the furthest point in the upstream area to the point of monitoring, assume flow is travelling at 1.00 m/s Peak Precipitation Intensity Over Tc: The peak rainfall intensity for the duration of the storm with the time interval defined by time of concentration 3 Return Period over Tc: The estimated time to elapse before a storm of equal or greater intensity will likely occur again, based on design storm criteria 4 Peak I/I Flow: The greatest difference captured between measured flow and estimated dry weather flow, Peak I/I Flow = Maximum (Measured Flow – Estimated Dry Weather Flow) 5 Peak I/I Rate: A normalized peak I/I flow based on catchment area size, Peak I/I Rate = Peak I/I Flow / Catchment Area 6 Volumetric Coefficient (Cv%): The ratio of total I/I volume and total rainfall volume, Cv% = Total I/I Flow Volume / Total Precipitation Volume * 100% 7 Peak I/ I Coefficient: The ratio of peak I/I flow and peak rainfall intensity, Peak I/ I Coefficient = Peak I/I Flow / (Peak Rainfall Intensity over Tc * Catchment Area) 8 Hourly Wet‐Weather Peaking Factor: The ratio of peak hourly wet‐weather measured flow and average dry‐weather flow, Wet‐Weather Peaking Factor = Peak Hourly Wet‐Weather Measured Flow / Average Dry-Weather Flow 9 Instantaneous Wet‐Weather Peaking Factor: The ratio of peak wet‐weather measured flow and average dry‐weather flow, Wet‐Weather Peaking Factor = Peak Wet‐Weather Measured Flow / Average Dry-Weather Flow 2
404 Civica Infrastructure Inc. www.civi.ca
Civica Infrastructures Inc. Kawartha Lakes Flow Monitoring Report
Appendix - A June 03, 2024
I/I Analysis Graph Station: F3
405 Civica Infrastructure Inc. www.civi.ca
Civica Infrastructures Inc. Kawartha Lakes Flow Monitoring Report
Appendix - A June 03, 2024
Infiltration/Inflow Event Analysis Station: F3 Oct 05, 2023 10:00 – Oct 07, 2023 09:35, Total Precipitation: 23.11 mm (39,987,214.80 L) Station Details
Storm Details
Catchment Area
173.00 ha
Total Precipitation
23.11 mm (39,987,214.80 L)
Duration of Storm
23.58 hr
Time of Concentration (Tc) 1
35 min
Peak Precipitation Intensity Over Tc 2
8.70 mm/hr
Return Period over Tc 3
< 2 Yr
Measured Flow
I/I Flow
Time of Peak Measured Flow
Oct 06, 2023 15:00
Time of Peak I/I Flow (TD)
Oct 06, 2023 15:00
Estimated Dry Weather Flow at TD
14.15 L/s
Peak Measured Flow
40.40 L/s
Peak I/I Flow 4
26.25 L/s
Peak I/I Rate 5
0.15 L/s/ha
Peak Measured Depth
142.00 mm
Total I/I Flow Volume during event
638,018.80 L
Volumetric Coefficient (Cv%) 6
1.60%
Total Measured Flow Volume during Event
2,092,368.40 L
Peak I/I Coefficient 7
0.0063
Hourly Wet-Weather Peaking Factor 8
1.95
Instantaneous Wet-Weather Peaking Factor 9
3.57
1
Time of Concentration (Tc): The estimated time for the flow to travel from the furthest point in the upstream area to the point of monitoring, assume flow is travelling at 1.00 m/s Peak Precipitation Intensity Over Tc: The peak rainfall intensity for the duration of the storm with the time interval defined by time of concentration 3 Return Period over Tc: The estimated time to elapse before a storm of equal or greater intensity will likely occur again, based on design storm criteria 4 Peak I/I Flow: The greatest difference captured between measured flow and estimated dry weather flow, Peak I/I Flow = Maximum (Measured Flow – Estimated Dry Weather Flow) 5 Peak I/I Rate: A normalized peak I/I flow based on catchment area size, Peak I/I Rate = Peak I/I Flow / Catchment Area 6 Volumetric Coefficient (Cv%): The ratio of total I/I volume and total rainfall volume, Cv% = Total I/I Flow Volume / Total Precipitation Volume * 100% 7 Peak I/ I Coefficient: The ratio of peak I/I flow and peak rainfall intensity, Peak I/ I Coefficient = Peak I/I Flow / (Peak Rainfall Intensity over Tc * Catchment Area) 8 Hourly Wet‐Weather Peaking Factor: The ratio of peak hourly wet‐weather measured flow and average dry‐weather flow, Wet‐Weather Peaking Factor = Peak Hourly Wet‐Weather Measured Flow / Average Dry-Weather Flow 9 Instantaneous Wet‐Weather Peaking Factor: The ratio of peak wet‐weather measured flow and average dry‐weather flow, Wet‐Weather Peaking Factor = Peak Wet‐Weather Measured Flow / Average Dry-Weather Flow 2
406 Civica Infrastructure Inc. www.civi.ca
Civica Infrastructures Inc. Kawartha Lakes Flow Monitoring Report
Appendix - A June 03, 2024
I/I Analysis Graph Station: F3
407 Civica Infrastructure Inc. www.civi.ca
Civica Infrastructures Inc. Kawartha Lakes Flow Monitoring Report
Appendix - A June 03, 2024
Infiltration/Inflow Event Analysis Station: F3 Oct 08, 2023 02:40 – Oct 10, 2023 12:50, Total Precipitation: 29.46 mm (50,972,720.00 L) Station Details
Storm Details
Catchment Area
173.00 ha
Total Precipitation
29.46 mm (50,972,720.00 L)
Duration of Storm
34.17 hr
Time of Concentration (Tc) 1
35 min
Peak Precipitation Intensity Over Tc 2
6.10 mm/hr
Return Period over Tc 3
< 2 Yr
Measured Flow
I/I Flow
Time of Peak Measured Flow
Oct 09, 2023 15:45
Time of Peak I/I Flow (TD)
Oct 09, 2023 15:45
Estimated Dry Weather Flow at TD
13.86 L/s
Peak Measured Flow
49.11 L/s
Peak I/I Flow 4
35.25 L/s
Peak I/I Rate 5
0.20 L/s/ha
Peak Measured Depth
154.00 mm
Total I/I Flow Volume during event
1,216,581.80 L
Volumetric Coefficient (Cv%) 6
2.39%
Total Measured Flow Volume during Event
3,286,148.60 L
Peak I/I Coefficient 7
0.0120
Hourly Wet-Weather Peaking Factor 8
2.49
Instantaneous Wet-Weather Peaking Factor 9
3.95
1
Time of Concentration (Tc): The estimated time for the flow to travel from the furthest point in the upstream area to the point of monitoring, assume flow is travelling at 1.00 m/s Peak Precipitation Intensity Over Tc: The peak rainfall intensity for the duration of the storm with the time interval defined by time of concentration 3 Return Period over Tc: The estimated time to elapse before a storm of equal or greater intensity will likely occur again, based on design storm criteria 4 Peak I/I Flow: The greatest difference captured between measured flow and estimated dry weather flow, Peak I/I Flow = Maximum (Measured Flow – Estimated Dry Weather Flow) 5 Peak I/I Rate: A normalized peak I/I flow based on catchment area size, Peak I/I Rate = Peak I/I Flow / Catchment Area 6 Volumetric Coefficient (Cv%): The ratio of total I/I volume and total rainfall volume, Cv% = Total I/I Flow Volume / Total Precipitation Volume * 100% 7 Peak I/ I Coefficient: The ratio of peak I/I flow and peak rainfall intensity, Peak I/ I Coefficient = Peak I/I Flow / (Peak Rainfall Intensity over Tc * Catchment Area) 8 Hourly Wet‐Weather Peaking Factor: The ratio of peak hourly wet‐weather measured flow and average dry‐weather flow, Wet‐Weather Peaking Factor = Peak Hourly Wet‐Weather Measured Flow / Average Dry-Weather Flow 9 Instantaneous Wet‐Weather Peaking Factor: The ratio of peak wet‐weather measured flow and average dry‐weather flow, Wet‐Weather Peaking Factor = Peak Wet‐Weather Measured Flow / Average Dry-Weather Flow 2
408 Civica Infrastructure Inc. www.civi.ca
Civica Infrastructures Inc. Kawartha Lakes Flow Monitoring Report
Appendix - A June 03, 2024
Activity Log Station: F3 Date Time
Type
Purpose of Visit
Comment
Calibration Measurement
17-Jan-2023 12:13:00 PM
Installation Log
INSTALLATION
MEASUREMENTS TAKEN, PHOTOS TAKEN, LOGGER INSTALLED
Yes
REMOVED ADS EQUIPMENT AND INSTALLED DETEC AV AND CSO SENSOR. EMPTY DISTANCE:520MM 15-Feb-2023 02:59:00 PM
Maintenance Log
SWAP
COULD NOT CONNECT TO ADS SENSOR.
Yes
DRILL STOPPED WORKING ON SITE 02-Mar-2023 10:02:00 AM
Maintenance Log
CALIBRATION
TC SET,DATA DOWNLOADED,TELEMETRY SENT,DEBRIS AND SILT REMOVED,SITE CALIBRATED,ANTENNA IN GOOD CONDITION,PHOTOS AND VIDEOS TAKEN
Yes
10-May-2023 02:46:00 PM
Removal Log
REMOVAL
SET UP TC, DOWNLOADED DATA, SENT TELEMETRY, TOOK MEAS
Yes
23-Jun-2023 01:50:00 PM
Installation Log
INSTALLATION
TC SET,SURVEY SENT, SERIAL NUMBERS NOTED,MEASUREMENT TAKEN,A/V SENSOR INSTALLED IN INLET,DOWNWARD SENSOR INSTALLED,SITE CALIBRATED,SITE CLEARED
Yes
17-Oct-2023 10:15:00 AM
Removal Log
REMOVAL
SET UP TC/CSE, DOWNLOADED DATA, SENT TELEMETRY, PMAC ID: 8320, TOOK MEASUREMENTS, CALIBRATED SITE, REMOVED ALL EQUIPMENT, REMOVAL COMPLETE, note: BRACKET WAS DAMAGED SO IT WAS ON A SLIGHT ANGLE, HOWEVER THE READINGS ARE VERY ACCURATE.
Yes
409 Civica Infrastructure Inc. www.civi.ca
Civica Infrastructures Inc. Kawartha Lakes Flow Monitoring Report
Appendix - A June 03, 2024
Aggregate Data Station: Fenelon Falls
Precipitation
1
Date From
Date To
Days
Min (mm)
Avg (mm)
Max (mm)
Sum (mm)
Count
Time of Min1
Time of Max1
Feb 21, 2023
Nov 02, 2023
246
0.00
0.01
6.35
556.21
59,882
Tue Feb 21, 2023 13:00
Sat Mar 04, 2023 14:00
Time of Min and Time of Max will be displayed by first occurrence
410 Civica Infrastructure Inc. www.civi.ca
Civica Infrastructures Inc. Kawartha Lakes Flow Monitoring Report
Appendix - A June 03, 2024
Data Chart Station: Fenelon Falls Feb 21, 2023 – Feb 28, 2023
411 Civica Infrastructure Inc. www.civi.ca
Civica Infrastructures Inc. Kawartha Lakes Flow Monitoring Report
Appendix - A June 03, 2024
Data Chart Station: Fenelon Falls Mar 01, 2023 – Mar 31, 2023
412 Civica Infrastructure Inc. www.civi.ca
Civica Infrastructures Inc. Kawartha Lakes Flow Monitoring Report
Appendix - A June 03, 2024
Data Chart Station: Fenelon Falls Apr 01, 2023 – Apr 30, 2023
413 Civica Infrastructure Inc. www.civi.ca
Civica Infrastructures Inc. Kawartha Lakes Flow Monitoring Report
Appendix - A June 03, 2024
Data Chart Station: Fenelon Falls May 01, 2023 – May 31, 2023
414 Civica Infrastructure Inc. www.civi.ca
Civica Infrastructures Inc. Kawartha Lakes Flow Monitoring Report
Appendix - A June 03, 2024
Data Chart Station: Fenelon Falls Jun 01, 2023 – Jun 30, 2023
415 Civica Infrastructure Inc. www.civi.ca
Civica Infrastructures Inc. Kawartha Lakes Flow Monitoring Report
Appendix - A June 03, 2024
Data Chart Station: Fenelon Falls Jul 01, 2023 – Jul 31, 2023
416 Civica Infrastructure Inc. www.civi.ca
Civica Infrastructures Inc. Kawartha Lakes Flow Monitoring Report
Appendix - A June 03, 2024
Data Chart Station: Fenelon Falls Aug 01, 2023 – Aug 31, 2023
417 Civica Infrastructure Inc. www.civi.ca
Civica Infrastructures Inc. Kawartha Lakes Flow Monitoring Report
Appendix - A June 03, 2024
Data Chart Station: Fenelon Falls Sep 01, 2023 – Sep 30, 2023
418 Civica Infrastructure Inc. www.civi.ca
Civica Infrastructures Inc. Kawartha Lakes Flow Monitoring Report
Appendix - A June 03, 2024
Data Chart Station: Fenelon Falls Oct 01, 2023 – Oct 31, 2023
419 Civica Infrastructure Inc. www.civi.ca
Civica Infrastructures Inc. Kawartha Lakes Flow Monitoring Report
Appendix - A June 03, 2024
Data Chart Station: Fenelon Falls Nov 01, 2023 – Nov 02, 2023
420 Civica Infrastructure Inc. www.civi.ca
Civica Infrastructures Inc. Kawartha Lakes Flow Monitoring Report
Appendix - A June 03, 2024
Activity Log Station: Fenelon Falls Date Time
Type
Purpose of Visit
Comment
Calibration Measurement
01-Nov-2023 02:00:00 PM
Removal Log
REMOVAL
ROOF ACCESSED, PHOTOS AND VIDEOS TAKEN, TELEMETRY SENT, DATA DOWNLOADED RG REMOVED, PADLOCK ON GATE REMOVED. PLEASE INFORM THE CLIENT TO LOCK THE GATE.
No
421 Civica Infrastructure Inc. www.civi.ca
Civica Infrastructures Inc. Kawartha Lakes Flow Monitoring Report
Appendix - A June 03, 2024
Aggregate Data Station: L1
Precipitation Date From
Date To
Days
Min (mm)
Avg (mm)
Max (mm)
Sum (mm)
Count
Time of Min1
Time of Max1
Jan 11, 2023
Oct 03, 2023
258
0.00
0.01
12.00
504.30
73,694
Wed Jan 11, 2023 00:00
Thu Aug 03, 2023 16:10
Level Date From
Date To
Days
Min (m)
Avg (m)
Max (m)
Count
Time of Min1
Time of Max1
Jan 11, 2023
Oct 03, 2023
266
0.02
0.04
0.11
76,318
Fri Sep 22, 2023 02:50
Thu Aug 03, 2023 16:30
Velocity Date From
Date To
Days
Min (m/s)
Avg (m/s)
Max (m/s)
Count
Time of Min1
Time of Max1
Jan 11, 2023
Oct 03, 2023
266
0.11
0.25
0.62
76,318
Fri Sep 22, 2023 02:50
Thu Aug 03, 2023 16:30
Flow
1
Date From
Date To
Days
Min (L/s)
Avg (L/s)
Max (L/s)
Total Volume (1,000,000 L)
Count
Time of Min1
Time of Max1
Jan 11, 2023
Oct 03, 2023
266
0.69
2.64
18.12
60.45
76,318
Fri Sep 22, 2023 02:50
Thu Aug 03, 2023 16:30
Time of Min and Time of Max will be displayed by first occurrence
422 Civica Infrastructure Inc. www.civi.ca
Civica Infrastructures Inc. Kawartha Lakes Flow Monitoring Report
Appendix - A June 03, 2024
Data Chart Station: L1 Jan 11, 2023 – Jan 31, 2023
423 Civica Infrastructure Inc. www.civi.ca
Civica Infrastructures Inc. Kawartha Lakes Flow Monitoring Report
Appendix - A June 03, 2024
Data Chart Station: L1 Feb 01, 2023 – Feb 28, 2023
424 Civica Infrastructure Inc. www.civi.ca
Civica Infrastructures Inc. Kawartha Lakes Flow Monitoring Report
Appendix - A June 03, 2024
Data Chart Station: L1 Mar 01, 2023 – Mar 31, 2023
425 Civica Infrastructure Inc. www.civi.ca
Civica Infrastructures Inc. Kawartha Lakes Flow Monitoring Report
Appendix - A June 03, 2024
Data Chart Station: L1 Apr 01, 2023 – Apr 30, 2023
426 Civica Infrastructure Inc. www.civi.ca
Civica Infrastructures Inc. Kawartha Lakes Flow Monitoring Report
Appendix - A June 03, 2024
Data Chart Station: L1 May 01, 2023 – May 31, 2023
427 Civica Infrastructure Inc. www.civi.ca
Civica Infrastructures Inc. Kawartha Lakes Flow Monitoring Report
Appendix - A June 03, 2024
Data Chart Station: L1 Jun 01, 2023 – Jun 30, 2023
428 Civica Infrastructure Inc. www.civi.ca
Civica Infrastructures Inc. Kawartha Lakes Flow Monitoring Report
Appendix - A June 03, 2024
Data Chart Station: L1 Jul 01, 2023 – Jul 31, 2023
429 Civica Infrastructure Inc. www.civi.ca
Civica Infrastructures Inc. Kawartha Lakes Flow Monitoring Report
Appendix - A June 03, 2024
Data Chart Station: L1 Aug 01, 2023 – Aug 31, 2023
430 Civica Infrastructure Inc. www.civi.ca
Civica Infrastructures Inc. Kawartha Lakes Flow Monitoring Report
Appendix - A June 03, 2024
Data Chart Station: L1 Sep 01, 2023 – Sep 30, 2023
431 Civica Infrastructure Inc. www.civi.ca
Civica Infrastructures Inc. Kawartha Lakes Flow Monitoring Report
Appendix - A June 03, 2024
Data Chart Station: L1 Oct 01, 2023 – Oct 03, 2023
432 Civica Infrastructure Inc. www.civi.ca
Civica Infrastructures Inc. Kawartha Lakes Flow Monitoring Report
Appendix - A June 03, 2024
Sanitary Report Station: L1
1
Average Dry Weather Flow (L/s)
Average Dry Weather Flow (L/c/d)
Average Daily Minimum Dry Weather Flow (L/s)
Average Daily Peak Dry Weather Flow (L/s)
2.488
302.324
1.075
4.180
Peaking Factor
Groundwater Infiltration (L/s)1
Groundwater Infiltration (L/ha/d)
% of GWI in Average DWF
1.680
0.914
1,844.163
36.720
Groundwater infiltration (GWI) is assumed as 85% of the daily minimum flow averaged over the monitoring period
433 Civica Infrastructure Inc. www.civi.ca
Civica Infrastructures Inc. Kawartha Lakes Flow Monitoring Report
Appendix - A June 03, 2024
I/I Analysis Table
1
Event1
Total Precipitation (mm)
Duration (hours)
Peak Intensity Over Tc at Station (mm/hr)
Feb 09, 2023
39.75
14.42
Mar 31, 2023
19.00
Apr 05, 2023
L1 Measured Peak Flow (L/s)
Peak I/I Flow (L/s)
Peak I/I Rate (L/s/ha)
Volumetric Runoff Coefficient (CV%)
Peaking Factor (PF)
8.10
12.06
8.89
0.21
2.09 %
3.30
23.33
5.80
6.35
3.10
0.07
1.28 %
0.93
18.00
12.50
9.90
5.43
2.17
0.05
0.84 %
0.80
Apr 30, 2023
16.40
9.50
4.80
6.11
3.17
0.07
1.17 %
1.30
May 19, 2023
32.00
18.92
8.20
6.46
3.71
0.09
0.68 %
1.53
Jun 11, 2023
35.40
25.75
7.20
7.12
4.62
0.11
0.56 %
1.97
Jun 26, 2023
18.40
8.42
15.40
7.04
4.49
0.11
0.37 %
1.83
Jun 27, 2023
24.20
5.42
10.60
6.63
4.38
0.10
0.65 %
1.78
Aug 03, 2023
41.40
4.83
54.20
18.12
15.38
0.36
0.99 %
6.29
Sep 07, 2023
21.80
0.83
31.20
8.97
6.83
0.16
0.54 %
3.22
Average
26.64
12.39
15.54
8.43
5.67
0.13
0.92 %
2.30
Maximum
41.40
25.75
54.20
18.12
15.38
0.36
2.09 %
6.29
Flow KPIs
Measured Storms
Station: L1
An event is a storm with a minimum volume of 15mm and a minimum inter-event dry period of 12 hours
434 Civica Infrastructure Inc. www.civi.ca
Civica Infrastructures Inc. Kawartha Lakes Flow Monitoring Report
Appendix - A June 03, 2024
I/I Analysis Graph Station: L1
435 Civica Infrastructure Inc. www.civi.ca
Civica Infrastructures Inc. Kawartha Lakes Flow Monitoring Report
Appendix - A June 03, 2024
Infiltration/Inflow Event Analysis Station: L1 Feb 08, 2023 21:00 – Feb 10, 2023 11:25, Total Precipitation: 39.75 mm (17,013,000.00 L) Station Details
Storm Details
Catchment Area
42.80 ha
Total Precipitation
39.75 mm (17,013,000.00 L)
Duration of Storm
14.42 hr
Time of Concentration (Tc) 1
35 min
Peak Precipitation Intensity Over Tc 2
8.10 mm/hr
Return Period over Tc 3
< 2 Yr
Measured Flow
I/I Flow
Time of Peak Measured Flow
Feb 09, 2023 18:00
Time of Peak I/I Flow (TD)
Feb 09, 2023 17:50
Estimated Dry Weather Flow at TD
3.13 L/s
Peak Measured Flow
12.06 L/s
Peak I/I Flow 4
8.89 L/s
Peak I/I Rate 5
0.21 L/s/ha
Peak Measured Depth
86.15 mm
Total I/I Flow Volume during event
355,306.90 L
Volumetric Coefficient (Cv%) 6
2.09%
Total Measured Flow Volume during Event
612,590.90 L
Peak I/I Coefficient 7
0.0092
Hourly Wet-Weather Peaking Factor 8
4.01
Instantaneous Wet-Weather Peaking Factor 9
4.47
1
Time of Concentration (Tc): The estimated time for the flow to travel from the furthest point in the upstream area to the point of monitoring, assume flow is travelling at 1.00 m/s Peak Precipitation Intensity Over Tc: The peak rainfall intensity for the duration of the storm with the time interval defined by time of concentration 3 Return Period over Tc: The estimated time to elapse before a storm of equal or greater intensity will likely occur again, based on design storm criteria 4 Peak I/I Flow: The greatest difference captured between measured flow and estimated dry weather flow, Peak I/I Flow = Maximum (Measured Flow – Estimated Dry Weather Flow) 5 Peak I/I Rate: A normalized peak I/I flow based on catchment area size, Peak I/I Rate = Peak I/I Flow / Catchment Area 6 Volumetric Coefficient (Cv%): The ratio of total I/I volume and total rainfall volume, Cv% = Total I/I Flow Volume / Total Precipitation Volume * 100% 7 Peak I/ I Coefficient: The ratio of peak I/I flow and peak rainfall intensity, Peak I/ I Coefficient = Peak I/I Flow / (Peak Rainfall Intensity over Tc * Catchment Area) 8 Hourly Wet‐Weather Peaking Factor: The ratio of peak hourly wet‐weather measured flow and average dry‐weather flow, Wet‐Weather Peaking Factor = Peak Hourly Wet‐Weather Measured Flow / Average Dry-Weather Flow 9 Instantaneous Wet‐Weather Peaking Factor: The ratio of peak wet‐weather measured flow and average dry‐weather flow, Wet‐Weather Peaking Factor = Peak Wet‐Weather Measured Flow / Average Dry-Weather Flow 2
436 Civica Infrastructure Inc. www.civi.ca
Civica Infrastructures Inc. Kawartha Lakes Flow Monitoring Report
Appendix - A June 03, 2024
I/I Analysis Graph Station: L1
437 Civica Infrastructure Inc. www.civi.ca
Civica Infrastructures Inc. Kawartha Lakes Flow Monitoring Report
Appendix - A June 03, 2024
Infiltration/Inflow Event Analysis Station: L1 Mar 30, 2023 21:40 – Apr 01, 2023 21:00, Total Precipitation: 19.00 mm (8,131,997.40 L) Station Details
Storm Details
Catchment Area
42.80 ha
Total Precipitation
19.00 mm (8,131,997.40 L)
Duration of Storm
23.33 hr
Time of Concentration (Tc) 1
35 min
Peak Precipitation Intensity Over Tc 2
5.80 mm/hr
Return Period over Tc 3
< 2 Yr
Measured Flow
I/I Flow
Time of Peak Measured Flow
Apr 01, 2023 08:10
Time of Peak I/I Flow (TD)
Apr 01, 2023 05:15
Estimated Dry Weather Flow at TD
2.60 L/s
Peak Measured Flow
6.35 L/s
Peak I/I Flow 4
3.10 L/s
Peak I/I Rate 5
0.07 L/s/ha
Peak Measured Depth
50.33 mm
Total I/I Flow Volume during event
103,989.60 L
Volumetric Coefficient (Cv%) 6
1.28%
Total Measured Flow Volume during Event
529,535.00 L
Peak I/I Coefficient 7
0.0045
Hourly Wet-Weather Peaking Factor 8
1.71
Instantaneous Wet-Weather Peaking Factor 9
1.90
1
Time of Concentration (Tc): The estimated time for the flow to travel from the furthest point in the upstream area to the point of monitoring, assume flow is travelling at 1.00 m/s Peak Precipitation Intensity Over Tc: The peak rainfall intensity for the duration of the storm with the time interval defined by time of concentration 3 Return Period over Tc: The estimated time to elapse before a storm of equal or greater intensity will likely occur again, based on design storm criteria 4 Peak I/I Flow: The greatest difference captured between measured flow and estimated dry weather flow, Peak I/I Flow = Maximum (Measured Flow – Estimated Dry Weather Flow) 5 Peak I/I Rate: A normalized peak I/I flow based on catchment area size, Peak I/I Rate = Peak I/I Flow / Catchment Area 6 Volumetric Coefficient (Cv%): The ratio of total I/I volume and total rainfall volume, Cv% = Total I/I Flow Volume / Total Precipitation Volume * 100% 7 Peak I/ I Coefficient: The ratio of peak I/I flow and peak rainfall intensity, Peak I/ I Coefficient = Peak I/I Flow / (Peak Rainfall Intensity over Tc * Catchment Area) 8 Hourly Wet‐Weather Peaking Factor: The ratio of peak hourly wet‐weather measured flow and average dry‐weather flow, Wet‐Weather Peaking Factor = Peak Hourly Wet‐Weather Measured Flow / Average Dry-Weather Flow 9 Instantaneous Wet‐Weather Peaking Factor: The ratio of peak wet‐weather measured flow and average dry‐weather flow, Wet‐Weather Peaking Factor = Peak Wet‐Weather Measured Flow / Average Dry-Weather Flow 2
438 Civica Infrastructure Inc. www.civi.ca
Civica Infrastructures Inc. Kawartha Lakes Flow Monitoring Report
Appendix - A June 03, 2024
I/I Analysis Graph Station: L1
439 Civica Infrastructure Inc. www.civi.ca
Civica Infrastructures Inc. Kawartha Lakes Flow Monitoring Report
Appendix - A June 03, 2024
Infiltration/Inflow Event Analysis Station: L1 Apr 04, 2023 17:45 – Apr 06, 2023 06:15, Total Precipitation: 18.00 mm (7,703,997.00 L) Station Details
Storm Details
Catchment Area
42.80 ha
Total Precipitation
18.00 mm (7,703,997.00 L)
Duration of Storm
12.50 hr
Time of Concentration (Tc) 1
35 min
Peak Precipitation Intensity Over Tc 2
9.90 mm/hr
Return Period over Tc 3
< 2 Yr
Measured Flow
I/I Flow
Time of Peak Measured Flow
Apr 05, 2023 18:40
Time of Peak I/I Flow (TD)
Apr 06, 2023 00:05
Estimated Dry Weather Flow at TD
2.25 L/s
Peak Measured Flow
5.43 L/s
Peak I/I Flow 4
2.17 L/s
Peak I/I Rate 5
0.05 L/s/ha
Peak Measured Depth
50.33 mm
Total I/I Flow Volume during event
64,734.30 L
Volumetric Coefficient (Cv%) 6
0.84%
Total Measured Flow Volume during Event
303,590.40 L
Peak I/I Coefficient 7
0.0018
Hourly Wet-Weather Peaking Factor 8
1.77
Instantaneous Wet-Weather Peaking Factor 9
2.01
1
Time of Concentration (Tc): The estimated time for the flow to travel from the furthest point in the upstream area to the point of monitoring, assume flow is travelling at 1.00 m/s Peak Precipitation Intensity Over Tc: The peak rainfall intensity for the duration of the storm with the time interval defined by time of concentration 3 Return Period over Tc: The estimated time to elapse before a storm of equal or greater intensity will likely occur again, based on design storm criteria 4 Peak I/I Flow: The greatest difference captured between measured flow and estimated dry weather flow, Peak I/I Flow = Maximum (Measured Flow – Estimated Dry Weather Flow) 5 Peak I/I Rate: A normalized peak I/I flow based on catchment area size, Peak I/I Rate = Peak I/I Flow / Catchment Area 6 Volumetric Coefficient (Cv%): The ratio of total I/I volume and total rainfall volume, Cv% = Total I/I Flow Volume / Total Precipitation Volume * 100% 7 Peak I/ I Coefficient: The ratio of peak I/I flow and peak rainfall intensity, Peak I/ I Coefficient = Peak I/I Flow / (Peak Rainfall Intensity over Tc * Catchment Area) 8 Hourly Wet‐Weather Peaking Factor: The ratio of peak hourly wet‐weather measured flow and average dry‐weather flow, Wet‐Weather Peaking Factor = Peak Hourly Wet‐Weather Measured Flow / Average Dry-Weather Flow 9 Instantaneous Wet‐Weather Peaking Factor: The ratio of peak wet‐weather measured flow and average dry‐weather flow, Wet‐Weather Peaking Factor = Peak Wet‐Weather Measured Flow / Average Dry-Weather Flow 2
440 Civica Infrastructure Inc. www.civi.ca
Civica Infrastructures Inc. Kawartha Lakes Flow Monitoring Report
Appendix - A June 03, 2024
I/I Analysis Graph Station: L1
441 Civica Infrastructure Inc. www.civi.ca
Civica Infrastructures Inc. Kawartha Lakes Flow Monitoring Report
Appendix - A June 03, 2024
Infiltration/Inflow Event Analysis Station: L1 Apr 30, 2023 00:30 – May 01, 2023 10:00, Total Precipitation: 16.40 mm (7,019,198.70 L) Station Details
Storm Details
Catchment Area
42.80 ha
Total Precipitation
16.40 mm (7,019,198.70 L)
Duration of Storm
9.50 hr
Time of Concentration (Tc) 1
35 min
Peak Precipitation Intensity Over Tc 2
4.80 mm/hr
Return Period over Tc 3
< 2 Yr
Measured Flow
I/I Flow
Time of Peak Measured Flow
Apr 30, 2023 17:50
Time of Peak I/I Flow (TD)
Apr 30, 2023 17:50
Estimated Dry Weather Flow at TD
2.94 L/s
Peak Measured Flow
6.11 L/s
Peak I/I Flow 4
3.17 L/s
Peak I/I Rate 5
0.07 L/s/ha
Peak Measured Depth
60.00 mm
Total I/I Flow Volume during event
82,260.30 L
Volumetric Coefficient (Cv%) 6
1.17%
Total Measured Flow Volume during Event
271,227.90 L
Peak I/I Coefficient 7
0.0056
Hourly Wet-Weather Peaking Factor 8
2.10
Instantaneous Wet-Weather Peaking Factor 9
2.51
1
Time of Concentration (Tc): The estimated time for the flow to travel from the furthest point in the upstream area to the point of monitoring, assume flow is travelling at 1.00 m/s Peak Precipitation Intensity Over Tc: The peak rainfall intensity for the duration of the storm with the time interval defined by time of concentration 3 Return Period over Tc: The estimated time to elapse before a storm of equal or greater intensity will likely occur again, based on design storm criteria 4 Peak I/I Flow: The greatest difference captured between measured flow and estimated dry weather flow, Peak I/I Flow = Maximum (Measured Flow – Estimated Dry Weather Flow) 5 Peak I/I Rate: A normalized peak I/I flow based on catchment area size, Peak I/I Rate = Peak I/I Flow / Catchment Area 6 Volumetric Coefficient (Cv%): The ratio of total I/I volume and total rainfall volume, Cv% = Total I/I Flow Volume / Total Precipitation Volume * 100% 7 Peak I/ I Coefficient: The ratio of peak I/I flow and peak rainfall intensity, Peak I/ I Coefficient = Peak I/I Flow / (Peak Rainfall Intensity over Tc * Catchment Area) 8 Hourly Wet‐Weather Peaking Factor: The ratio of peak hourly wet‐weather measured flow and average dry‐weather flow, Wet‐Weather Peaking Factor = Peak Hourly Wet‐Weather Measured Flow / Average Dry-Weather Flow 9 Instantaneous Wet‐Weather Peaking Factor: The ratio of peak wet‐weather measured flow and average dry‐weather flow, Wet‐Weather Peaking Factor = Peak Wet‐Weather Measured Flow / Average Dry-Weather Flow 2
442 Civica Infrastructure Inc. www.civi.ca
Civica Infrastructures Inc. Kawartha Lakes Flow Monitoring Report
Appendix - A June 03, 2024
I/I Analysis Graph Station: L1
443 Civica Infrastructure Inc. www.civi.ca
Civica Infrastructures Inc. Kawartha Lakes Flow Monitoring Report
Appendix - A June 03, 2024
Infiltration/Inflow Event Analysis Station: L1 May 19, 2023 08:15 – May 21, 2023 03:10, Total Precipitation: 32.00 mm (13,695,995.70 L) Station Details
Storm Details
Catchment Area
42.80 ha
Total Precipitation
32.00 mm (13,695,995.70 L)
Duration of Storm
18.92 hr
Time of Concentration (Tc) 1
35 min
Peak Precipitation Intensity Over Tc 2
8.20 mm/hr
Return Period over Tc 3
< 2 Yr
Measured Flow
I/I Flow
Time of Peak Measured Flow
May 20, 2023 07:00
Time of Peak I/I Flow (TD)
May 20, 2023 06:50
Estimated Dry Weather Flow at TD
2.75 L/s
Peak Measured Flow
6.46 L/s
Peak I/I Flow 4
3.71 L/s
Peak I/I Rate 5
0.09 L/s/ha
Peak Measured Depth
57.00 mm
Total I/I Flow Volume during event
93,669.10 L
Volumetric Coefficient (Cv%) 6
0.68%
Total Measured Flow Volume during Event
364,202.40 L
Peak I/I Coefficient 7
0.0038
Hourly Wet-Weather Peaking Factor 8
2.25
Instantaneous Wet-Weather Peaking Factor 9
2.67
1
Time of Concentration (Tc): The estimated time for the flow to travel from the furthest point in the upstream area to the point of monitoring, assume flow is travelling at 1.00 m/s Peak Precipitation Intensity Over Tc: The peak rainfall intensity for the duration of the storm with the time interval defined by time of concentration 3 Return Period over Tc: The estimated time to elapse before a storm of equal or greater intensity will likely occur again, based on design storm criteria 4 Peak I/I Flow: The greatest difference captured between measured flow and estimated dry weather flow, Peak I/I Flow = Maximum (Measured Flow – Estimated Dry Weather Flow) 5 Peak I/I Rate: A normalized peak I/I flow based on catchment area size, Peak I/I Rate = Peak I/I Flow / Catchment Area 6 Volumetric Coefficient (Cv%): The ratio of total I/I volume and total rainfall volume, Cv% = Total I/I Flow Volume / Total Precipitation Volume * 100% 7 Peak I/ I Coefficient: The ratio of peak I/I flow and peak rainfall intensity, Peak I/ I Coefficient = Peak I/I Flow / (Peak Rainfall Intensity over Tc * Catchment Area) 8 Hourly Wet‐Weather Peaking Factor: The ratio of peak hourly wet‐weather measured flow and average dry‐weather flow, Wet‐Weather Peaking Factor = Peak Hourly Wet‐Weather Measured Flow / Average Dry-Weather Flow 9 Instantaneous Wet‐Weather Peaking Factor: The ratio of peak wet‐weather measured flow and average dry‐weather flow, Wet‐Weather Peaking Factor = Peak Wet‐Weather Measured Flow / Average Dry-Weather Flow 2
444 Civica Infrastructure Inc. www.civi.ca
Civica Infrastructures Inc. Kawartha Lakes Flow Monitoring Report
Appendix - A June 03, 2024
I/I Analysis Graph Station: L1
445 Civica Infrastructure Inc. www.civi.ca
Civica Infrastructures Inc. Kawartha Lakes Flow Monitoring Report
Appendix - A June 03, 2024
Infiltration/Inflow Event Analysis Station: L1 Jun 11, 2023 07:25 – Jun 13, 2023 09:10, Total Precipitation: 35.40 mm (15,151,197.00 L) Station Details
Storm Details
Catchment Area
42.80 ha
Total Precipitation
35.40 mm (15,151,197.00 L)
Duration of Storm
25.75 hr
Time of Concentration (Tc) 1
35 min
Peak Precipitation Intensity Over Tc 2
7.20 mm/hr
Return Period over Tc 3
< 2 Yr
Measured Flow
I/I Flow
Time of Peak Measured Flow
Jun 12, 2023 11:15
Time of Peak I/I Flow (TD)
Jun 12, 2023 11:15
Estimated Dry Weather Flow at TD
2.51 L/s
Peak Measured Flow
7.12 L/s
Peak I/I Flow 4
4.62 L/s
Peak I/I Rate 5
0.11 L/s/ha
Peak Measured Depth
66.00 mm
Total I/I Flow Volume during event
85,201.40 L
Volumetric Coefficient (Cv%) 6
0.56%
Total Measured Flow Volume during Event
404,469.70 L
Peak I/I Coefficient 7
0.0054
Hourly Wet-Weather Peaking Factor 8
2.58
Instantaneous Wet-Weather Peaking Factor 9
3.04
1
Time of Concentration (Tc): The estimated time for the flow to travel from the furthest point in the upstream area to the point of monitoring, assume flow is travelling at 1.00 m/s Peak Precipitation Intensity Over Tc: The peak rainfall intensity for the duration of the storm with the time interval defined by time of concentration 3 Return Period over Tc: The estimated time to elapse before a storm of equal or greater intensity will likely occur again, based on design storm criteria 4 Peak I/I Flow: The greatest difference captured between measured flow and estimated dry weather flow, Peak I/I Flow = Maximum (Measured Flow – Estimated Dry Weather Flow) 5 Peak I/I Rate: A normalized peak I/I flow based on catchment area size, Peak I/I Rate = Peak I/I Flow / Catchment Area 6 Volumetric Coefficient (Cv%): The ratio of total I/I volume and total rainfall volume, Cv% = Total I/I Flow Volume / Total Precipitation Volume * 100% 7 Peak I/ I Coefficient: The ratio of peak I/I flow and peak rainfall intensity, Peak I/ I Coefficient = Peak I/I Flow / (Peak Rainfall Intensity over Tc * Catchment Area) 8 Hourly Wet‐Weather Peaking Factor: The ratio of peak hourly wet‐weather measured flow and average dry‐weather flow, Wet‐Weather Peaking Factor = Peak Hourly Wet‐Weather Measured Flow / Average Dry-Weather Flow 9 Instantaneous Wet‐Weather Peaking Factor: The ratio of peak wet‐weather measured flow and average dry‐weather flow, Wet‐Weather Peaking Factor = Peak Wet‐Weather Measured Flow / Average Dry-Weather Flow 2
446 Civica Infrastructure Inc. www.civi.ca
Civica Infrastructures Inc. Kawartha Lakes Flow Monitoring Report
Appendix - A June 03, 2024
I/I Analysis Graph Station: L1
447 Civica Infrastructure Inc. www.civi.ca
Civica Infrastructures Inc. Kawartha Lakes Flow Monitoring Report
Appendix - A June 03, 2024
Infiltration/Inflow Event Analysis Station: L1 Jun 25, 2023 15:05 – Jun 26, 2023 23:30, Total Precipitation: 18.40 mm (7,875,197.90 L) Station Details
Storm Details
Catchment Area
42.80 ha
Total Precipitation
18.40 mm (7,875,197.90 L)
Duration of Storm
8.42 hr
Time of Concentration (Tc) 1
35 min
Peak Precipitation Intensity Over Tc 2
15.40 mm/hr
Return Period over Tc 3
< 2 Yr
Measured Flow
I/I Flow
Time of Peak Measured Flow
Jun 26, 2023 11:40
Time of Peak I/I Flow (TD)
Jun 26, 2023 11:40
Estimated Dry Weather Flow at TD
2.55 L/s
Peak Measured Flow
7.04 L/s
Peak I/I Flow 4
4.49 L/s
Peak I/I Rate 5
0.11 L/s/ha
Peak Measured Depth
65.33 mm
Total I/I Flow Volume during event
29,425.10 L
Volumetric Coefficient (Cv%) 6
0.37%
Total Measured Flow Volume during Event
210,352.50 L
Peak I/I Coefficient 7
0.0025
Hourly Wet-Weather Peaking Factor 8
2.06
Instantaneous Wet-Weather Peaking Factor 9
2.87
1
Time of Concentration (Tc): The estimated time for the flow to travel from the furthest point in the upstream area to the point of monitoring, assume flow is travelling at 1.00 m/s Peak Precipitation Intensity Over Tc: The peak rainfall intensity for the duration of the storm with the time interval defined by time of concentration 3 Return Period over Tc: The estimated time to elapse before a storm of equal or greater intensity will likely occur again, based on design storm criteria 4 Peak I/I Flow: The greatest difference captured between measured flow and estimated dry weather flow, Peak I/I Flow = Maximum (Measured Flow – Estimated Dry Weather Flow) 5 Peak I/I Rate: A normalized peak I/I flow based on catchment area size, Peak I/I Rate = Peak I/I Flow / Catchment Area 6 Volumetric Coefficient (Cv%): The ratio of total I/I volume and total rainfall volume, Cv% = Total I/I Flow Volume / Total Precipitation Volume * 100% 7 Peak I/ I Coefficient: The ratio of peak I/I flow and peak rainfall intensity, Peak I/ I Coefficient = Peak I/I Flow / (Peak Rainfall Intensity over Tc * Catchment Area) 8 Hourly Wet‐Weather Peaking Factor: The ratio of peak hourly wet‐weather measured flow and average dry‐weather flow, Wet‐Weather Peaking Factor = Peak Hourly Wet‐Weather Measured Flow / Average Dry-Weather Flow 9 Instantaneous Wet‐Weather Peaking Factor: The ratio of peak wet‐weather measured flow and average dry‐weather flow, Wet‐Weather Peaking Factor = Peak Wet‐Weather Measured Flow / Average Dry-Weather Flow 2
448 Civica Infrastructure Inc. www.civi.ca
Civica Infrastructures Inc. Kawartha Lakes Flow Monitoring Report
Appendix - A June 03, 2024
I/I Analysis Graph Station: L1
449 Civica Infrastructure Inc. www.civi.ca
Civica Infrastructures Inc. Kawartha Lakes Flow Monitoring Report
Appendix - A June 03, 2024
Infiltration/Inflow Event Analysis Station: L1 Jun 26, 2023 21:00 – Jun 28, 2023 02:25, Total Precipitation: 24.20 mm (10,357,594.90 L) Station Details
Storm Details
Catchment Area
42.80 ha
Total Precipitation
24.20 mm (10,357,594.90 L)
Duration of Storm
5.42 hr
Time of Concentration (Tc) 1
35 min
Peak Precipitation Intensity Over Tc 2
10.60 mm/hr
Return Period over Tc 3
< 2 Yr
Measured Flow
I/I Flow
Time of Peak Measured Flow
Jun 27, 2023 13:55
Time of Peak I/I Flow (TD)
Jun 27, 2023 13:55
Estimated Dry Weather Flow at TD
2.25 L/s
Peak Measured Flow
6.63 L/s
Peak I/I Flow 4
4.38 L/s
Peak I/I Rate 5
0.10 L/s/ha
Peak Measured Depth
69.00 mm
Total I/I Flow Volume during event
67,551.30 L
Volumetric Coefficient (Cv%) 6
0.65%
Total Measured Flow Volume during Event
222,875.80 L
Peak I/I Coefficient 7
0.0035
Hourly Wet-Weather Peaking Factor 8
2.51
Instantaneous Wet-Weather Peaking Factor 9
2.69
1
Time of Concentration (Tc): The estimated time for the flow to travel from the furthest point in the upstream area to the point of monitoring, assume flow is travelling at 1.00 m/s Peak Precipitation Intensity Over Tc: The peak rainfall intensity for the duration of the storm with the time interval defined by time of concentration 3 Return Period over Tc: The estimated time to elapse before a storm of equal or greater intensity will likely occur again, based on design storm criteria 4 Peak I/I Flow: The greatest difference captured between measured flow and estimated dry weather flow, Peak I/I Flow = Maximum (Measured Flow – Estimated Dry Weather Flow) 5 Peak I/I Rate: A normalized peak I/I flow based on catchment area size, Peak I/I Rate = Peak I/I Flow / Catchment Area 6 Volumetric Coefficient (Cv%): The ratio of total I/I volume and total rainfall volume, Cv% = Total I/I Flow Volume / Total Precipitation Volume * 100% 7 Peak I/ I Coefficient: The ratio of peak I/I flow and peak rainfall intensity, Peak I/ I Coefficient = Peak I/I Flow / (Peak Rainfall Intensity over Tc * Catchment Area) 8 Hourly Wet‐Weather Peaking Factor: The ratio of peak hourly wet‐weather measured flow and average dry‐weather flow, Wet‐Weather Peaking Factor = Peak Hourly Wet‐Weather Measured Flow / Average Dry-Weather Flow 9 Instantaneous Wet‐Weather Peaking Factor: The ratio of peak wet‐weather measured flow and average dry‐weather flow, Wet‐Weather Peaking Factor = Peak Wet‐Weather Measured Flow / Average Dry-Weather Flow 2
450 Civica Infrastructure Inc. www.civi.ca
Civica Infrastructures Inc. Kawartha Lakes Flow Monitoring Report
Appendix - A June 03, 2024
I/I Analysis Graph Station: L1
451 Civica Infrastructure Inc. www.civi.ca
Civica Infrastructures Inc. Kawartha Lakes Flow Monitoring Report
Appendix - A June 03, 2024
Infiltration/Inflow Event Analysis Station: L1 Aug 03, 2023 03:55 – Aug 04, 2023 08:45, Total Precipitation: 41.40 mm (17,719,198.30 L) Station Details
Storm Details
Catchment Area
42.80 ha
Total Precipitation
41.40 mm (17,719,198.30 L)
Duration of Storm
4.83 hr
Time of Concentration (Tc) 1
35 min
Peak Precipitation Intensity Over Tc 2
54.20 mm/hr
Return Period over Tc 3
5 - 10 Yr
Measured Flow
I/I Flow
Time of Peak Measured Flow
Aug 03, 2023 16:30
Time of Peak I/I Flow (TD)
Aug 03, 2023 16:30
Estimated Dry Weather Flow at TD
2.73 L/s
Peak Measured Flow
18.12 L/s
Peak I/I Flow 4
15.38 L/s
Peak I/I Rate 5
0.36 L/s/ha
Peak Measured Depth
114.00 mm
Total I/I Flow Volume during event
176,143.50 L
Volumetric Coefficient (Cv%) 6
0.99%
Total Measured Flow Volume during Event
325,181.60 L
Peak I/I Coefficient 7
0.0024
Hourly Wet-Weather Peaking Factor 8
5.32
Instantaneous Wet-Weather Peaking Factor 9
7.40
1
Time of Concentration (Tc): The estimated time for the flow to travel from the furthest point in the upstream area to the point of monitoring, assume flow is travelling at 1.00 m/s Peak Precipitation Intensity Over Tc: The peak rainfall intensity for the duration of the storm with the time interval defined by time of concentration 3 Return Period over Tc: The estimated time to elapse before a storm of equal or greater intensity will likely occur again, based on design storm criteria 4 Peak I/I Flow: The greatest difference captured between measured flow and estimated dry weather flow, Peak I/I Flow = Maximum (Measured Flow – Estimated Dry Weather Flow) 5 Peak I/I Rate: A normalized peak I/I flow based on catchment area size, Peak I/I Rate = Peak I/I Flow / Catchment Area 6 Volumetric Coefficient (Cv%): The ratio of total I/I volume and total rainfall volume, Cv% = Total I/I Flow Volume / Total Precipitation Volume * 100% 7 Peak I/ I Coefficient: The ratio of peak I/I flow and peak rainfall intensity, Peak I/ I Coefficient = Peak I/I Flow / (Peak Rainfall Intensity over Tc * Catchment Area) 8 Hourly Wet‐Weather Peaking Factor: The ratio of peak hourly wet‐weather measured flow and average dry‐weather flow, Wet‐Weather Peaking Factor = Peak Hourly Wet‐Weather Measured Flow / Average Dry-Weather Flow 9 Instantaneous Wet‐Weather Peaking Factor: The ratio of peak wet‐weather measured flow and average dry‐weather flow, Wet‐Weather Peaking Factor = Peak Wet‐Weather Measured Flow / Average Dry-Weather Flow 2
452 Civica Infrastructure Inc. www.civi.ca
Civica Infrastructures Inc. Kawartha Lakes Flow Monitoring Report
Appendix - A June 03, 2024
I/I Analysis Graph Station: L1
453 Civica Infrastructure Inc. www.civi.ca
Civica Infrastructures Inc. Kawartha Lakes Flow Monitoring Report
Appendix - A June 03, 2024
Infiltration/Inflow Event Analysis Station: L1 Sep 07, 2023 03:00 – Sep 08, 2023 03:50, Total Precipitation: 21.80 mm (9,330,397.40 L) Station Details
Storm Details
Catchment Area
42.80 ha
Total Precipitation
21.80 mm (9,330,397.40 L)
Duration of Storm
0.83 hr
Time of Concentration (Tc) 1
35 min
Peak Precipitation Intensity Over Tc 2
31.20 mm/hr
Return Period over Tc 3
< 2 Yr
Measured Flow
I/I Flow
Time of Peak Measured Flow
Sep 07, 2023 16:00
Time of Peak I/I Flow (TD)
Sep 07, 2023 16:00
Estimated Dry Weather Flow at TD
2.14 L/s
Peak Measured Flow
8.97 L/s
Peak I/I Flow 4
6.83 L/s
Peak I/I Rate 5
0.16 L/s/ha
Peak Measured Depth
75.33 mm
Total I/I Flow Volume during event
50,109.40 L
Volumetric Coefficient (Cv%) 6
0.54%
Total Measured Flow Volume during Event
148,556.90 L
Peak I/I Coefficient 7
0.0018
Hourly Wet-Weather Peaking Factor 8
3.01
Instantaneous Wet-Weather Peaking Factor 9
4.24
1
Time of Concentration (Tc): The estimated time for the flow to travel from the furthest point in the upstream area to the point of monitoring, assume flow is travelling at 1.00 m/s Peak Precipitation Intensity Over Tc: The peak rainfall intensity for the duration of the storm with the time interval defined by time of concentration 3 Return Period over Tc: The estimated time to elapse before a storm of equal or greater intensity will likely occur again, based on design storm criteria 4 Peak I/I Flow: The greatest difference captured between measured flow and estimated dry weather flow, Peak I/I Flow = Maximum (Measured Flow – Estimated Dry Weather Flow) 5 Peak I/I Rate: A normalized peak I/I flow based on catchment area size, Peak I/I Rate = Peak I/I Flow / Catchment Area 6 Volumetric Coefficient (Cv%): The ratio of total I/I volume and total rainfall volume, Cv% = Total I/I Flow Volume / Total Precipitation Volume * 100% 7 Peak I/ I Coefficient: The ratio of peak I/I flow and peak rainfall intensity, Peak I/ I Coefficient = Peak I/I Flow / (Peak Rainfall Intensity over Tc * Catchment Area) 8 Hourly Wet‐Weather Peaking Factor: The ratio of peak hourly wet‐weather measured flow and average dry‐weather flow, Wet‐Weather Peaking Factor = Peak Hourly Wet‐Weather Measured Flow / Average Dry-Weather Flow 9 Instantaneous Wet‐Weather Peaking Factor: The ratio of peak wet‐weather measured flow and average dry‐weather flow, Wet‐Weather Peaking Factor = Peak Wet‐Weather Measured Flow / Average Dry-Weather Flow 2
454 Civica Infrastructure Inc. www.civi.ca
Civica Infrastructures Inc. Kawartha Lakes Flow Monitoring Report
Appendix - A June 03, 2024
Activity Log Station: L1 Date Time
Type
Purpose of Visit
Comment
Calibration Measurement
11-Jan-2023 08:33:00 AM
Installation Log
INSTALLATION
SITE INSPECTED,MEASUREMENTS TAKEN, PHOTOS TAKEN, LOGGER INSTALLED
Yes
01-Feb-2023 11:00:00 AM
Maintenance Log
CALIBRATION
EXTENDER INSTALLED, ADJUSTED RING POSITION, DATA DOWNLOADED, TELEMETRY SENT, PHOTOS TAKEN, SITE CALIBRATED ANTENNA REPOSITIONED
Yes
01-Mar-2023 11:29:00 AM
Maintenance Log
CALIBRATION
TC SET,DATA DOWNLOADED,TELEMETRY SENT,DEBRIS AND SILT REMOVED,SITE CALIBRATED,ANTENNA IN GOOD CONDITION,PHOTOS AND VIDEOS TAKEN
Yes
Yes
14-Mar-2023 01:50:00 PM
Maintenance Log
MAINTENANCE
DATA DOWNLOADED, TELEMETRY SENT AND CHECKED, ENTRY MADE, SITE CALIBRATED, PHOTO AND VIDEO TAKEN SWAPPED LOGGER UNABLE TO CONNECT TO THE LOGGER 9 ADS TITRON
09-May-2023 09:27:00 AM
Maintenance Log
CALIBRATION
DOWNLOADED DATA, SENT TELEMETRY, MADE ENTRY, TOOK PHOTOS/VIDEOS, TOOK MEASUREMENTS, ANTENNA REPLACED,DESSICANT CHECKED,DEBRIS AND SILT CLEANED,CALIBRATED SITE,SITE CLEARED
Yes
Yes
Yes
21-Jun-2023 10:55:00 AM
Maintenance Log
CALIBRATION
DATA DOWNLOADED, TELEMETRY SENT ENTRY MADE PHOTOS/VIDEOS TAKEN, MEASUREMENTS TAKEN, SITE CALIBRATED
03-Oct-2023 09:25:00 AM
Removal Log
REMOVAL
TRAFFIC CONTROL SENT, DATA DOWNLOADED, TELEMETRY SENT, CALIBRATION DONE, EQUIPMENT REMOVED, LOGGER TAG, PHOTOS AND VIDEOS BEFORE AND AFTER TAKEN.
455 Civica Infrastructure Inc. www.civi.ca
Civica Infrastructures Inc. Kawartha Lakes Flow Monitoring Report
Appendix - A June 03, 2024
Aggregate Data Station: L2
Precipitation Date From
Date To
Days
Min (mm)
Avg (mm)
Max (mm)
Sum (mm)
Count
Time of Min1
Time of Max1
Jan 12, 2023
Oct 03, 2023
257
0.00
0.01
12.00
504.30
73,442
Thu Jan 12, 2023 00:00
Thu Aug 03, 2023 16:10
Level Date From
Date To
Days
Min (m)
Avg (m)
Max (m)
Count
Time of Min1
Time of Max1
Jan 12, 2023
Oct 03, 2023
265
0.05
0.12
0.27
76,006
Sun Oct 01, 2023 17:20
Sat Apr 01, 2023 05:25
Velocity Date From
Date To
Days
Min (m/s)
Avg (m/s)
Max (m/s)
Count
Time of Min1
Time of Max1
Jan 12, 2023
Oct 03, 2023
265
0.00
0.37
0.73
76,006
Fri Aug 11, 2023 19:00
Sat Apr 01, 2023 10:10
Flow
1
Date From
Date To
Days
Min (L/s)
Avg (L/s)
Max (L/s)
Total Volume (1,000,000 L)
Count
Time of Min1
Time of Max1
Jan 12, 2023
Oct 03, 2023
265
0.00
11.96
70.23
272.60
76,006
Fri Aug 11, 2023 19:00
Sat Apr 01, 2023 08:20
Time of Min and Time of Max will be displayed by first occurrence
456 Civica Infrastructure Inc. www.civi.ca
Civica Infrastructures Inc. Kawartha Lakes Flow Monitoring Report
Appendix - A June 03, 2024
Data Chart Station: L2 Jan 12, 2023 – Jan 31, 2023
457 Civica Infrastructure Inc. www.civi.ca
Civica Infrastructures Inc. Kawartha Lakes Flow Monitoring Report
Appendix - A June 03, 2024
Data Chart Station: L2 Feb 01, 2023 – Feb 28, 2023
458 Civica Infrastructure Inc. www.civi.ca
Civica Infrastructures Inc. Kawartha Lakes Flow Monitoring Report
Appendix - A June 03, 2024
Data Chart Station: L2 Mar 01, 2023 – Mar 31, 2023
459 Civica Infrastructure Inc. www.civi.ca
Civica Infrastructures Inc. Kawartha Lakes Flow Monitoring Report
Appendix - A June 03, 2024
Data Chart Station: L2 Apr 01, 2023 – Apr 30, 2023
460 Civica Infrastructure Inc. www.civi.ca
Civica Infrastructures Inc. Kawartha Lakes Flow Monitoring Report
Appendix - A June 03, 2024
Data Chart Station: L2 May 01, 2023 – May 31, 2023
461 Civica Infrastructure Inc. www.civi.ca
Civica Infrastructures Inc. Kawartha Lakes Flow Monitoring Report
Appendix - A June 03, 2024
Data Chart Station: L2 Jun 01, 2023 – Jun 30, 2023
462 Civica Infrastructure Inc. www.civi.ca
Civica Infrastructures Inc. Kawartha Lakes Flow Monitoring Report
Appendix - A June 03, 2024
Data Chart Station: L2 Jul 01, 2023 – Jul 31, 2023
463 Civica Infrastructure Inc. www.civi.ca
Civica Infrastructures Inc. Kawartha Lakes Flow Monitoring Report
Appendix - A June 03, 2024
Data Chart Station: L2 Aug 01, 2023 – Aug 31, 2023
464 Civica Infrastructure Inc. www.civi.ca
Civica Infrastructures Inc. Kawartha Lakes Flow Monitoring Report
Appendix - A June 03, 2024
Data Chart Station: L2 Sep 01, 2023 – Sep 30, 2023
465 Civica Infrastructure Inc. www.civi.ca
Civica Infrastructures Inc. Kawartha Lakes Flow Monitoring Report
Appendix - A June 03, 2024
Data Chart Station: L2 Oct 01, 2023 – Oct 03, 2023
466 Civica Infrastructure Inc. www.civi.ca
Civica Infrastructures Inc. Kawartha Lakes Flow Monitoring Report
Appendix - A June 03, 2024
Sanitary Report Station: L2
1
Average Dry Weather Flow (L/s)
Average Dry Weather Flow (L/c/d)
Average Daily Minimum Dry Weather Flow (L/s)
Average Daily Peak Dry Weather Flow (L/s)
9.748
319.012
3.912
15.452
Peaking Factor
Groundwater Infiltration (L/s)1
Groundwater Infiltration (L/ha/d)
% of GWI in Average DWF
1.585
3.325
2,465.998
34.112
Groundwater infiltration (GWI) is assumed as 85% of the daily minimum flow averaged over the monitoring period
467 Civica Infrastructure Inc. www.civi.ca
Civica Infrastructures Inc. Kawartha Lakes Flow Monitoring Report
Appendix - A June 03, 2024
I/I Analysis Table
1
Event1
Total Precipitation (mm)
Duration (hours)
Peak Intensity Over Tc at Station (mm/hr)
Feb 09, 2023
39.75
14.42
Mar 31, 2023
19.00
Apr 05, 2023
L2 Measured Peak Flow (L/s)
Peak I/I Flow (L/s)
Peak I/I Rate (L/s/ha)
Volumetric Runoff Coefficient (CV%)
Peaking Factor (PF)
6.20
57.05
43.82
0.38
4.63 %
3.78
23.33
4.80
70.23
44.75
0.38
9.85 %
1.77
18.00
12.50
5.50
66.71
46.87
0.40
9.10 %
2.31
Apr 30, 2023
16.40
9.50
4.10
51.88
35.85
0.31
6.95 %
2.89
May 19, 2023
32.00
18.92
6.60
45.62
33.04
0.28
2.70 %
3.56
Jun 11, 2023
35.40
25.75
5.40
34.32
24.72
0.21
2.27 %
3.34
Jun 26, 2023
18.40
8.42
8.30
34.01
25.32
0.22
1.57 %
3.07
Jun 27, 2023
24.20
5.42
6.80
46.23
38.31
0.33
3.62 %
4.76
Aug 03, 2023
41.40
4.83
29.40
59.47
50.29
0.43
2.48 %
6.74
Sep 07, 2023
21.80
0.83
20.10
36.65
28.16
0.24
0.92 %
4.41
Average
26.64
12.39
9.72
50.22
37.11
0.32
4.41 %
3.66
Maximum
41.40
25.75
29.40
70.23
50.29
0.43
9.85 %
6.74
Flow KPIs
Measured Storms
Station: L2
An event is a storm with a minimum volume of 15mm and a minimum inter-event dry period of 12 hours
468 Civica Infrastructure Inc. www.civi.ca
Civica Infrastructures Inc. Kawartha Lakes Flow Monitoring Report
Appendix - A June 03, 2024
I/I Analysis Graph Station: L2
469 Civica Infrastructure Inc. www.civi.ca
Civica Infrastructures Inc. Kawartha Lakes Flow Monitoring Report
Appendix - A June 03, 2024
Infiltration/Inflow Event Analysis Station: L2 Feb 08, 2023 21:00 – Feb 10, 2023 11:25, Total Precipitation: 39.75 mm (46,308,750.00 L) Station Details
Storm Details
Catchment Area
116.50 ha
Total Precipitation
39.75 mm (46,308,750.00 L)
Duration of Storm
14.42 hr
Time of Concentration (Tc) 1
65 min
Peak Precipitation Intensity Over Tc 2
6.20 mm/hr
Return Period over Tc 3
< 2 Yr
Measured Flow
I/I Flow
Time of Peak Measured Flow
Feb 09, 2023 18:30
Time of Peak I/I Flow (TD)
Feb 09, 2023 18:30
Estimated Dry Weather Flow at TD
13.23 L/s
Peak Measured Flow
57.05 L/s
Peak I/I Flow 4
43.82 L/s
Peak I/I Rate 5
0.38 L/s/ha
Peak Measured Depth
253.00 mm
Total I/I Flow Volume during event
2,142,124.80 L
Volumetric Coefficient (Cv%) 6
4.63%
Total Measured Flow Volume during Event
3,249,287.60 L
Peak I/I Coefficient 7
0.0217
Hourly Wet-Weather Peaking Factor 8
4.66
Instantaneous Wet-Weather Peaking Factor 9
4.92
1
Time of Concentration (Tc): The estimated time for the flow to travel from the furthest point in the upstream area to the point of monitoring, assume flow is travelling at 1.00 m/s Peak Precipitation Intensity Over Tc: The peak rainfall intensity for the duration of the storm with the time interval defined by time of concentration 3 Return Period over Tc: The estimated time to elapse before a storm of equal or greater intensity will likely occur again, based on design storm criteria 4 Peak I/I Flow: The greatest difference captured between measured flow and estimated dry weather flow, Peak I/I Flow = Maximum (Measured Flow – Estimated Dry Weather Flow) 5 Peak I/I Rate: A normalized peak I/I flow based on catchment area size, Peak I/I Rate = Peak I/I Flow / Catchment Area 6 Volumetric Coefficient (Cv%): The ratio of total I/I volume and total rainfall volume, Cv% = Total I/I Flow Volume / Total Precipitation Volume * 100% 7 Peak I/ I Coefficient: The ratio of peak I/I flow and peak rainfall intensity, Peak I/ I Coefficient = Peak I/I Flow / (Peak Rainfall Intensity over Tc * Catchment Area) 8 Hourly Wet‐Weather Peaking Factor: The ratio of peak hourly wet‐weather measured flow and average dry‐weather flow, Wet‐Weather Peaking Factor = Peak Hourly Wet‐Weather Measured Flow / Average Dry-Weather Flow 9 Instantaneous Wet‐Weather Peaking Factor: The ratio of peak wet‐weather measured flow and average dry‐weather flow, Wet‐Weather Peaking Factor = Peak Wet‐Weather Measured Flow / Average Dry-Weather Flow 2
470 Civica Infrastructure Inc. www.civi.ca
Civica Infrastructures Inc. Kawartha Lakes Flow Monitoring Report
Appendix - A June 03, 2024
I/I Analysis Graph Station: L2
471 Civica Infrastructure Inc. www.civi.ca
Civica Infrastructures Inc. Kawartha Lakes Flow Monitoring Report
Appendix - A June 03, 2024
Infiltration/Inflow Event Analysis Station: L2 Mar 30, 2023 21:40 – Apr 01, 2023 21:00, Total Precipitation: 19.00 mm (22,134,993.00 L) Station Details
Storm Details
Catchment Area
116.50 ha
Total Precipitation
19.00 mm (22,134,993.00 L)
Duration of Storm
23.33 hr
Time of Concentration (Tc) 1
65 min
Peak Precipitation Intensity Over Tc 2
4.80 mm/hr
Return Period over Tc 3
< 2 Yr
Measured Flow
I/I Flow
Time of Peak Measured Flow
Apr 01, 2023 08:20
Time of Peak I/I Flow (TD)
Apr 01, 2023 05:40
Estimated Dry Weather Flow at TD
23.83 L/s
Peak Measured Flow
70.23 L/s
Peak I/I Flow 4
44.75 L/s
Peak I/I Rate 5
0.38 L/s/ha
Peak Measured Depth
267.00 mm
Total I/I Flow Volume during event
2,179,379.80 L
Volumetric Coefficient (Cv%) 6
9.85%
Total Measured Flow Volume during Event
5,405,626.20 L
Peak I/I Coefficient 7
0.0288
Hourly Wet-Weather Peaking Factor 8
2.50
Instantaneous Wet-Weather Peaking Factor 9
2.78
1
Time of Concentration (Tc): The estimated time for the flow to travel from the furthest point in the upstream area to the point of monitoring, assume flow is travelling at 1.00 m/s Peak Precipitation Intensity Over Tc: The peak rainfall intensity for the duration of the storm with the time interval defined by time of concentration 3 Return Period over Tc: The estimated time to elapse before a storm of equal or greater intensity will likely occur again, based on design storm criteria 4 Peak I/I Flow: The greatest difference captured between measured flow and estimated dry weather flow, Peak I/I Flow = Maximum (Measured Flow – Estimated Dry Weather Flow) 5 Peak I/I Rate: A normalized peak I/I flow based on catchment area size, Peak I/I Rate = Peak I/I Flow / Catchment Area 6 Volumetric Coefficient (Cv%): The ratio of total I/I volume and total rainfall volume, Cv% = Total I/I Flow Volume / Total Precipitation Volume * 100% 7 Peak I/ I Coefficient: The ratio of peak I/I flow and peak rainfall intensity, Peak I/ I Coefficient = Peak I/I Flow / (Peak Rainfall Intensity over Tc * Catchment Area) 8 Hourly Wet‐Weather Peaking Factor: The ratio of peak hourly wet‐weather measured flow and average dry‐weather flow, Wet‐Weather Peaking Factor = Peak Hourly Wet‐Weather Measured Flow / Average Dry-Weather Flow 9 Instantaneous Wet‐Weather Peaking Factor: The ratio of peak wet‐weather measured flow and average dry‐weather flow, Wet‐Weather Peaking Factor = Peak Wet‐Weather Measured Flow / Average Dry-Weather Flow 2
472 Civica Infrastructure Inc. www.civi.ca
Civica Infrastructures Inc. Kawartha Lakes Flow Monitoring Report
Appendix - A June 03, 2024
I/I Analysis Graph Station: L2
473 Civica Infrastructure Inc. www.civi.ca
Civica Infrastructures Inc. Kawartha Lakes Flow Monitoring Report
Appendix - A June 03, 2024
Infiltration/Inflow Event Analysis Station: L2 Apr 04, 2023 17:45 – Apr 06, 2023 06:15, Total Precipitation: 18.00 mm (20,969,991.80 L) Station Details
Storm Details
Catchment Area
116.50 ha
Total Precipitation
18.00 mm (20,969,991.80 L)
Duration of Storm
12.50 hr
Time of Concentration (Tc) 1
65 min
Peak Precipitation Intensity Over Tc 2
5.50 mm/hr
Return Period over Tc 3
< 2 Yr
Measured Flow
I/I Flow
Time of Peak Measured Flow
Apr 05, 2023 16:25
Time of Peak I/I Flow (TD)
Apr 05, 2023 16:25
Estimated Dry Weather Flow at TD
19.84 L/s
Peak Measured Flow
66.71 L/s
Peak I/I Flow 4
46.87 L/s
Peak I/I Rate 5
0.40 L/s/ha
Peak Measured Depth
267.00 mm
Total I/I Flow Volume during event
1,907,575.40 L
Volumetric Coefficient (Cv%) 6
9.10%
Total Measured Flow Volume during Event
3,702,780.80 L
Peak I/I Coefficient 7
0.0262
Hourly Wet-Weather Peaking Factor 8
3.18
Instantaneous Wet-Weather Peaking Factor 9
3.29
1
Time of Concentration (Tc): The estimated time for the flow to travel from the furthest point in the upstream area to the point of monitoring, assume flow is travelling at 1.00 m/s Peak Precipitation Intensity Over Tc: The peak rainfall intensity for the duration of the storm with the time interval defined by time of concentration 3 Return Period over Tc: The estimated time to elapse before a storm of equal or greater intensity will likely occur again, based on design storm criteria 4 Peak I/I Flow: The greatest difference captured between measured flow and estimated dry weather flow, Peak I/I Flow = Maximum (Measured Flow – Estimated Dry Weather Flow) 5 Peak I/I Rate: A normalized peak I/I flow based on catchment area size, Peak I/I Rate = Peak I/I Flow / Catchment Area 6 Volumetric Coefficient (Cv%): The ratio of total I/I volume and total rainfall volume, Cv% = Total I/I Flow Volume / Total Precipitation Volume * 100% 7 Peak I/ I Coefficient: The ratio of peak I/I flow and peak rainfall intensity, Peak I/ I Coefficient = Peak I/I Flow / (Peak Rainfall Intensity over Tc * Catchment Area) 8 Hourly Wet‐Weather Peaking Factor: The ratio of peak hourly wet‐weather measured flow and average dry‐weather flow, Wet‐Weather Peaking Factor = Peak Hourly Wet‐Weather Measured Flow / Average Dry-Weather Flow 9 Instantaneous Wet‐Weather Peaking Factor: The ratio of peak wet‐weather measured flow and average dry‐weather flow, Wet‐Weather Peaking Factor = Peak Wet‐Weather Measured Flow / Average Dry-Weather Flow 2
474 Civica Infrastructure Inc. www.civi.ca
Civica Infrastructures Inc. Kawartha Lakes Flow Monitoring Report
Appendix - A June 03, 2024
I/I Analysis Graph Station: L2
475 Civica Infrastructure Inc. www.civi.ca
Civica Infrastructures Inc. Kawartha Lakes Flow Monitoring Report
Appendix - A June 03, 2024
Infiltration/Inflow Event Analysis Station: L2 Apr 30, 2023 00:30 – May 01, 2023 10:00, Total Precipitation: 16.40 mm (19,105,996.50 L) Station Details
Storm Details
Catchment Area
116.50 ha
Total Precipitation
16.40 mm (19,105,996.50 L)
Duration of Storm
9.50 hr
Time of Concentration (Tc) 1
65 min
Peak Precipitation Intensity Over Tc 2
4.10 mm/hr
Return Period over Tc 3
< 2 Yr
Measured Flow
I/I Flow
Time of Peak Measured Flow
Apr 30, 2023 18:45
Time of Peak I/I Flow (TD)
Apr 30, 2023 18:45
Estimated Dry Weather Flow at TD
16.03 L/s
Peak Measured Flow
51.88 L/s
Peak I/I Flow 4
35.85 L/s
Peak I/I Rate 5
0.31 L/s/ha
Peak Measured Depth
229.00 mm
Total I/I Flow Volume during event
1,328,460.00 L
Volumetric Coefficient (Cv%) 6
6.95%
Total Measured Flow Volume during Event
2,291,132.00 L
Peak I/I Coefficient 7
0.0273
Hourly Wet-Weather Peaking Factor 8
3.34
Instantaneous Wet-Weather Peaking Factor 9
4.19
1
Time of Concentration (Tc): The estimated time for the flow to travel from the furthest point in the upstream area to the point of monitoring, assume flow is travelling at 1.00 m/s Peak Precipitation Intensity Over Tc: The peak rainfall intensity for the duration of the storm with the time interval defined by time of concentration 3 Return Period over Tc: The estimated time to elapse before a storm of equal or greater intensity will likely occur again, based on design storm criteria 4 Peak I/I Flow: The greatest difference captured between measured flow and estimated dry weather flow, Peak I/I Flow = Maximum (Measured Flow – Estimated Dry Weather Flow) 5 Peak I/I Rate: A normalized peak I/I flow based on catchment area size, Peak I/I Rate = Peak I/I Flow / Catchment Area 6 Volumetric Coefficient (Cv%): The ratio of total I/I volume and total rainfall volume, Cv% = Total I/I Flow Volume / Total Precipitation Volume * 100% 7 Peak I/ I Coefficient: The ratio of peak I/I flow and peak rainfall intensity, Peak I/ I Coefficient = Peak I/I Flow / (Peak Rainfall Intensity over Tc * Catchment Area) 8 Hourly Wet‐Weather Peaking Factor: The ratio of peak hourly wet‐weather measured flow and average dry‐weather flow, Wet‐Weather Peaking Factor = Peak Hourly Wet‐Weather Measured Flow / Average Dry-Weather Flow 9 Instantaneous Wet‐Weather Peaking Factor: The ratio of peak wet‐weather measured flow and average dry‐weather flow, Wet‐Weather Peaking Factor = Peak Wet‐Weather Measured Flow / Average Dry-Weather Flow 2
476 Civica Infrastructure Inc. www.civi.ca
Civica Infrastructures Inc. Kawartha Lakes Flow Monitoring Report
Appendix - A June 03, 2024
I/I Analysis Graph Station: L2
477 Civica Infrastructure Inc. www.civi.ca
Civica Infrastructures Inc. Kawartha Lakes Flow Monitoring Report
Appendix - A June 03, 2024
Infiltration/Inflow Event Analysis Station: L2 May 19, 2023 08:15 – May 21, 2023 03:10, Total Precipitation: 32.00 mm (37,279,988.30 L) Station Details
Storm Details
Catchment Area
116.50 ha
Total Precipitation
32.00 mm (37,279,988.30 L)
Duration of Storm
18.92 hr
Time of Concentration (Tc) 1
65 min
Peak Precipitation Intensity Over Tc 2
6.60 mm/hr
Return Period over Tc 3
< 2 Yr
Measured Flow
I/I Flow
Time of Peak Measured Flow
May 20, 2023 07:30
Time of Peak I/I Flow (TD)
May 20, 2023 07:30
Estimated Dry Weather Flow at TD
12.58 L/s
Peak Measured Flow
45.62 L/s
Peak I/I Flow 4
33.04 L/s
Peak I/I Rate 5
0.28 L/s/ha
Peak Measured Depth
217.00 mm
Total I/I Flow Volume during event
1,006,166.20 L
Volumetric Coefficient (Cv%) 6
2.70%
Total Measured Flow Volume during Event
2,041,899.60 L
Peak I/I Coefficient 7
0.0154
Hourly Wet-Weather Peaking Factor 8
4.39
Instantaneous Wet-Weather Peaking Factor 9
4.92
1
Time of Concentration (Tc): The estimated time for the flow to travel from the furthest point in the upstream area to the point of monitoring, assume flow is travelling at 1.00 m/s Peak Precipitation Intensity Over Tc: The peak rainfall intensity for the duration of the storm with the time interval defined by time of concentration 3 Return Period over Tc: The estimated time to elapse before a storm of equal or greater intensity will likely occur again, based on design storm criteria 4 Peak I/I Flow: The greatest difference captured between measured flow and estimated dry weather flow, Peak I/I Flow = Maximum (Measured Flow – Estimated Dry Weather Flow) 5 Peak I/I Rate: A normalized peak I/I flow based on catchment area size, Peak I/I Rate = Peak I/I Flow / Catchment Area 6 Volumetric Coefficient (Cv%): The ratio of total I/I volume and total rainfall volume, Cv% = Total I/I Flow Volume / Total Precipitation Volume * 100% 7 Peak I/ I Coefficient: The ratio of peak I/I flow and peak rainfall intensity, Peak I/ I Coefficient = Peak I/I Flow / (Peak Rainfall Intensity over Tc * Catchment Area) 8 Hourly Wet‐Weather Peaking Factor: The ratio of peak hourly wet‐weather measured flow and average dry‐weather flow, Wet‐Weather Peaking Factor = Peak Hourly Wet‐Weather Measured Flow / Average Dry-Weather Flow 9 Instantaneous Wet‐Weather Peaking Factor: The ratio of peak wet‐weather measured flow and average dry‐weather flow, Wet‐Weather Peaking Factor = Peak Wet‐Weather Measured Flow / Average Dry-Weather Flow 2
478 Civica Infrastructure Inc. www.civi.ca
Civica Infrastructures Inc. Kawartha Lakes Flow Monitoring Report
Appendix - A June 03, 2024
I/I Analysis Graph Station: L2
479 Civica Infrastructure Inc. www.civi.ca
Civica Infrastructures Inc. Kawartha Lakes Flow Monitoring Report
Appendix - A June 03, 2024
Infiltration/Inflow Event Analysis Station: L2 Jun 11, 2023 07:25 – Jun 13, 2023 09:10, Total Precipitation: 35.40 mm (41,240,991.80 L) Station Details
Storm Details
Catchment Area
116.50 ha
Total Precipitation
35.40 mm (41,240,991.80 L)
Duration of Storm
25.75 hr
Time of Concentration (Tc) 1
65 min
Peak Precipitation Intensity Over Tc 2
5.40 mm/hr
Return Period over Tc 3
< 2 Yr
Measured Flow
I/I Flow
Time of Peak Measured Flow
Jun 12, 2023 11:50
Time of Peak I/I Flow (TD)
Jun 12, 2023 11:50
Estimated Dry Weather Flow at TD
9.60 L/s
Peak Measured Flow
34.32 L/s
Peak I/I Flow 4
24.72 L/s
Peak I/I Rate 5
0.21 L/s/ha
Peak Measured Depth
188.00 mm
Total I/I Flow Volume during event
937,826.90 L
Volumetric Coefficient (Cv%) 6
2.27%
Total Measured Flow Volume during Event
1,947,136.80 L
Peak I/I Coefficient 7
0.0143
Hourly Wet-Weather Peaking Factor 8
3.99
Instantaneous Wet-Weather Peaking Factor 9
4.63
1
Time of Concentration (Tc): The estimated time for the flow to travel from the furthest point in the upstream area to the point of monitoring, assume flow is travelling at 1.00 m/s Peak Precipitation Intensity Over Tc: The peak rainfall intensity for the duration of the storm with the time interval defined by time of concentration 3 Return Period over Tc: The estimated time to elapse before a storm of equal or greater intensity will likely occur again, based on design storm criteria 4 Peak I/I Flow: The greatest difference captured between measured flow and estimated dry weather flow, Peak I/I Flow = Maximum (Measured Flow – Estimated Dry Weather Flow) 5 Peak I/I Rate: A normalized peak I/I flow based on catchment area size, Peak I/I Rate = Peak I/I Flow / Catchment Area 6 Volumetric Coefficient (Cv%): The ratio of total I/I volume and total rainfall volume, Cv% = Total I/I Flow Volume / Total Precipitation Volume * 100% 7 Peak I/ I Coefficient: The ratio of peak I/I flow and peak rainfall intensity, Peak I/ I Coefficient = Peak I/I Flow / (Peak Rainfall Intensity over Tc * Catchment Area) 8 Hourly Wet‐Weather Peaking Factor: The ratio of peak hourly wet‐weather measured flow and average dry‐weather flow, Wet‐Weather Peaking Factor = Peak Hourly Wet‐Weather Measured Flow / Average Dry-Weather Flow 9 Instantaneous Wet‐Weather Peaking Factor: The ratio of peak wet‐weather measured flow and average dry‐weather flow, Wet‐Weather Peaking Factor = Peak Wet‐Weather Measured Flow / Average Dry-Weather Flow 2
480 Civica Infrastructure Inc. www.civi.ca
Civica Infrastructures Inc. Kawartha Lakes Flow Monitoring Report
Appendix - A June 03, 2024
I/I Analysis Graph Station: L2
481 Civica Infrastructure Inc. www.civi.ca
Civica Infrastructures Inc. Kawartha Lakes Flow Monitoring Report
Appendix - A June 03, 2024
Infiltration/Inflow Event Analysis Station: L2 Jun 25, 2023 15:05 – Jun 26, 2023 23:30, Total Precipitation: 18.40 mm (21,435,994.20 L) Station Details
Storm Details
Catchment Area
116.50 ha
Total Precipitation
18.40 mm (21,435,994.20 L)
Duration of Storm
8.42 hr
Time of Concentration (Tc) 1
65 min
Peak Precipitation Intensity Over Tc 2
8.30 mm/hr
Return Period over Tc 3
< 2 Yr
Measured Flow
I/I Flow
Time of Peak Measured Flow
Jun 26, 2023 11:55
Time of Peak I/I Flow (TD)
Jun 26, 2023 11:50
Estimated Dry Weather Flow at TD
8.69 L/s
Peak Measured Flow
34.01 L/s
Peak I/I Flow 4
25.32 L/s
Peak I/I Rate 5
0.22 L/s/ha
Peak Measured Depth
189.00 mm
Total I/I Flow Volume during event
335,546.90 L
Volumetric Coefficient (Cv%) 6
1.57%
Total Measured Flow Volume during Event
943,964.80 L
Peak I/I Coefficient 7
0.0094
Hourly Wet-Weather Peaking Factor 8
3.26
Instantaneous Wet-Weather Peaking Factor 9
4.13
1
Time of Concentration (Tc): The estimated time for the flow to travel from the furthest point in the upstream area to the point of monitoring, assume flow is travelling at 1.00 m/s Peak Precipitation Intensity Over Tc: The peak rainfall intensity for the duration of the storm with the time interval defined by time of concentration 3 Return Period over Tc: The estimated time to elapse before a storm of equal or greater intensity will likely occur again, based on design storm criteria 4 Peak I/I Flow: The greatest difference captured between measured flow and estimated dry weather flow, Peak I/I Flow = Maximum (Measured Flow – Estimated Dry Weather Flow) 5 Peak I/I Rate: A normalized peak I/I flow based on catchment area size, Peak I/I Rate = Peak I/I Flow / Catchment Area 6 Volumetric Coefficient (Cv%): The ratio of total I/I volume and total rainfall volume, Cv% = Total I/I Flow Volume / Total Precipitation Volume * 100% 7 Peak I/ I Coefficient: The ratio of peak I/I flow and peak rainfall intensity, Peak I/ I Coefficient = Peak I/I Flow / (Peak Rainfall Intensity over Tc * Catchment Area) 8 Hourly Wet‐Weather Peaking Factor: The ratio of peak hourly wet‐weather measured flow and average dry‐weather flow, Wet‐Weather Peaking Factor = Peak Hourly Wet‐Weather Measured Flow / Average Dry-Weather Flow 9 Instantaneous Wet‐Weather Peaking Factor: The ratio of peak wet‐weather measured flow and average dry‐weather flow, Wet‐Weather Peaking Factor = Peak Wet‐Weather Measured Flow / Average Dry-Weather Flow 2
482 Civica Infrastructure Inc. www.civi.ca
Civica Infrastructures Inc. Kawartha Lakes Flow Monitoring Report
Appendix - A June 03, 2024
I/I Analysis Graph Station: L2
483 Civica Infrastructure Inc. www.civi.ca
Civica Infrastructures Inc. Kawartha Lakes Flow Monitoring Report
Appendix - A June 03, 2024
Infiltration/Inflow Event Analysis Station: L2 Jun 26, 2023 21:00 – Jun 28, 2023 02:25, Total Precipitation: 24.20 mm (28,192,986.00 L) Station Details
Storm Details
Catchment Area
116.50 ha
Total Precipitation
24.20 mm (28,192,986.00 L)
Duration of Storm
5.42 hr
Time of Concentration (Tc) 1
65 min
Peak Precipitation Intensity Over Tc 2
6.80 mm/hr
Return Period over Tc 3
< 2 Yr
Measured Flow
I/I Flow
Time of Peak Measured Flow
Jun 27, 2023 13:55
Time of Peak I/I Flow (TD)
Jun 27, 2023 13:55
Estimated Dry Weather Flow at TD
7.92 L/s
Peak Measured Flow
46.23 L/s
Peak I/I Flow 4
38.31 L/s
Peak I/I Rate 5
0.33 L/s/ha
Peak Measured Depth
233.00 mm
Total I/I Flow Volume during event
1,019,423.80 L
Volumetric Coefficient (Cv%) 6
3.62%
Total Measured Flow Volume during Event
1,526,533.20 L
Peak I/I Coefficient 7
0.0173
Hourly Wet-Weather Peaking Factor 8
5.31
Instantaneous Wet-Weather Peaking Factor 9
5.74
1
Time of Concentration (Tc): The estimated time for the flow to travel from the furthest point in the upstream area to the point of monitoring, assume flow is travelling at 1.00 m/s Peak Precipitation Intensity Over Tc: The peak rainfall intensity for the duration of the storm with the time interval defined by time of concentration 3 Return Period over Tc: The estimated time to elapse before a storm of equal or greater intensity will likely occur again, based on design storm criteria 4 Peak I/I Flow: The greatest difference captured between measured flow and estimated dry weather flow, Peak I/I Flow = Maximum (Measured Flow – Estimated Dry Weather Flow) 5 Peak I/I Rate: A normalized peak I/I flow based on catchment area size, Peak I/I Rate = Peak I/I Flow / Catchment Area 6 Volumetric Coefficient (Cv%): The ratio of total I/I volume and total rainfall volume, Cv% = Total I/I Flow Volume / Total Precipitation Volume * 100% 7 Peak I/ I Coefficient: The ratio of peak I/I flow and peak rainfall intensity, Peak I/ I Coefficient = Peak I/I Flow / (Peak Rainfall Intensity over Tc * Catchment Area) 8 Hourly Wet‐Weather Peaking Factor: The ratio of peak hourly wet‐weather measured flow and average dry‐weather flow, Wet‐Weather Peaking Factor = Peak Hourly Wet‐Weather Measured Flow / Average Dry-Weather Flow 9 Instantaneous Wet‐Weather Peaking Factor: The ratio of peak wet‐weather measured flow and average dry‐weather flow, Wet‐Weather Peaking Factor = Peak Wet‐Weather Measured Flow / Average Dry-Weather Flow 2
484 Civica Infrastructure Inc. www.civi.ca
Civica Infrastructures Inc. Kawartha Lakes Flow Monitoring Report
Appendix - A June 03, 2024
I/I Analysis Graph Station: L2
485 Civica Infrastructure Inc. www.civi.ca
Civica Infrastructures Inc. Kawartha Lakes Flow Monitoring Report
Appendix - A June 03, 2024
Infiltration/Inflow Event Analysis Station: L2 Aug 03, 2023 03:55 – Aug 04, 2023 08:45, Total Precipitation: 41.40 mm (48,230,995.30 L) Station Details
Storm Details
Catchment Area
116.50 ha
Total Precipitation
41.40 mm (48,230,995.30 L)
Duration of Storm
4.83 hr
Time of Concentration (Tc) 1
65 min
Peak Precipitation Intensity Over Tc 2
29.40 mm/hr
Return Period over Tc 3
2 - 5 Yr
Measured Flow
I/I Flow
Time of Peak Measured Flow
Aug 03, 2023 16:55
Time of Peak I/I Flow (TD)
Aug 03, 2023 16:55
Estimated Dry Weather Flow at TD
9.18 L/s
Peak Measured Flow
59.47 L/s
Peak I/I Flow 4
50.29 L/s
Peak I/I Rate 5
0.43 L/s/ha
Peak Measured Depth
250.00 mm
Total I/I Flow Volume during event
1,195,283.10 L
Volumetric Coefficient (Cv%) 6
2.48%
Total Measured Flow Volume during Event
1,649,505.10 L
Peak I/I Coefficient 7
0.0053
Hourly Wet-Weather Peaking Factor 8
5.89
Instantaneous Wet-Weather Peaking Factor 9
7.97
1
Time of Concentration (Tc): The estimated time for the flow to travel from the furthest point in the upstream area to the point of monitoring, assume flow is travelling at 1.00 m/s Peak Precipitation Intensity Over Tc: The peak rainfall intensity for the duration of the storm with the time interval defined by time of concentration 3 Return Period over Tc: The estimated time to elapse before a storm of equal or greater intensity will likely occur again, based on design storm criteria 4 Peak I/I Flow: The greatest difference captured between measured flow and estimated dry weather flow, Peak I/I Flow = Maximum (Measured Flow – Estimated Dry Weather Flow) 5 Peak I/I Rate: A normalized peak I/I flow based on catchment area size, Peak I/I Rate = Peak I/I Flow / Catchment Area 6 Volumetric Coefficient (Cv%): The ratio of total I/I volume and total rainfall volume, Cv% = Total I/I Flow Volume / Total Precipitation Volume * 100% 7 Peak I/ I Coefficient: The ratio of peak I/I flow and peak rainfall intensity, Peak I/ I Coefficient = Peak I/I Flow / (Peak Rainfall Intensity over Tc * Catchment Area) 8 Hourly Wet‐Weather Peaking Factor: The ratio of peak hourly wet‐weather measured flow and average dry‐weather flow, Wet‐Weather Peaking Factor = Peak Hourly Wet‐Weather Measured Flow / Average Dry-Weather Flow 9 Instantaneous Wet‐Weather Peaking Factor: The ratio of peak wet‐weather measured flow and average dry‐weather flow, Wet‐Weather Peaking Factor = Peak Wet‐Weather Measured Flow / Average Dry-Weather Flow 2
486 Civica Infrastructure Inc. www.civi.ca
Civica Infrastructures Inc. Kawartha Lakes Flow Monitoring Report
Appendix - A June 03, 2024
I/I Analysis Graph Station: L2
487 Civica Infrastructure Inc. www.civi.ca
Civica Infrastructures Inc. Kawartha Lakes Flow Monitoring Report
Appendix - A June 03, 2024
Infiltration/Inflow Event Analysis Station: L2 Sep 07, 2023 03:00 – Sep 08, 2023 03:50, Total Precipitation: 21.80 mm (25,396,993.00 L) Station Details
Storm Details
Catchment Area
116.50 ha
Total Precipitation
21.80 mm (25,396,993.00 L)
Duration of Storm
0.83 hr
Time of Concentration (Tc) 1
65 min
Peak Precipitation Intensity Over Tc 2
20.10 mm/hr
Return Period over Tc 3
< 2 Yr
Measured Flow
I/I Flow
Time of Peak Measured Flow
Sep 07, 2023 16:15
Time of Peak I/I Flow (TD)
Sep 07, 2023 16:15
Estimated Dry Weather Flow at TD
8.50 L/s
Peak Measured Flow
36.65 L/s
Peak I/I Flow 4
28.16 L/s
Peak I/I Rate 5
0.24 L/s/ha
Peak Measured Depth
200.00 mm
Total I/I Flow Volume during event
233,395.30 L
Volumetric Coefficient (Cv%) 6
0.92%
Total Measured Flow Volume during Event
530,100.60 L
Peak I/I Coefficient 7
0.0043
Hourly Wet-Weather Peaking Factor 8
4.92
Instantaneous Wet-Weather Peaking Factor 9
5.74
1
Time of Concentration (Tc): The estimated time for the flow to travel from the furthest point in the upstream area to the point of monitoring, assume flow is travelling at 1.00 m/s Peak Precipitation Intensity Over Tc: The peak rainfall intensity for the duration of the storm with the time interval defined by time of concentration 3 Return Period over Tc: The estimated time to elapse before a storm of equal or greater intensity will likely occur again, based on design storm criteria 4 Peak I/I Flow: The greatest difference captured between measured flow and estimated dry weather flow, Peak I/I Flow = Maximum (Measured Flow – Estimated Dry Weather Flow) 5 Peak I/I Rate: A normalized peak I/I flow based on catchment area size, Peak I/I Rate = Peak I/I Flow / Catchment Area 6 Volumetric Coefficient (Cv%): The ratio of total I/I volume and total rainfall volume, Cv% = Total I/I Flow Volume / Total Precipitation Volume * 100% 7 Peak I/ I Coefficient: The ratio of peak I/I flow and peak rainfall intensity, Peak I/ I Coefficient = Peak I/I Flow / (Peak Rainfall Intensity over Tc * Catchment Area) 8 Hourly Wet‐Weather Peaking Factor: The ratio of peak hourly wet‐weather measured flow and average dry‐weather flow, Wet‐Weather Peaking Factor = Peak Hourly Wet‐Weather Measured Flow / Average Dry-Weather Flow 9 Instantaneous Wet‐Weather Peaking Factor: The ratio of peak wet‐weather measured flow and average dry‐weather flow, Wet‐Weather Peaking Factor = Peak Wet‐Weather Measured Flow / Average Dry-Weather Flow 2
488 Civica Infrastructure Inc. www.civi.ca
Civica Infrastructures Inc. Kawartha Lakes Flow Monitoring Report
Appendix - A June 03, 2024
Activity Log Station: L2 Date Time
Type
Purpose of Visit
Comment
Calibration Measurement
12-Jan-2023 10:32:00 AM
Installation Log
INSTALLATION
MEASUREMENTS TAKEN, PHOTOS TAKEN, LOGGER INSTALLED
Yes
01-Mar-2023 12:05:00 PM
Maintenance Log
CALIBRATION
TC SET,DATA DOWNLOADED,TELEMETRY SENT,DEBRIS AND SILT REMOVED,SITE CALIBRATED,ANTENNA IN GOOD CONDITION,PHOTOS AND VIDEOS TAKEN
Yes
09-May-2023 10:17:00 AM
Maintenance Log
CALIBRATION
TC SET,SURVEY SENT,DOWNLOADED DATA, SENT TELEMETRY, MADE ENTRY, TOOK PHOTOS/VIDEOS, TOOK MEASUREMENTS,DEBRIS AND SILT CLEARED, CALIBRATED SITE,SITE CLEARED
Yes
Yes
21-Jun-2023 11:46:00 AM
Maintenance Log
CALIBRATION
DATA DOWNLOADED, TELEMETRY FORCE SENT NOT REFLECTED IN FZ ENTRY MADE PHOTOS/VIDEOS TAKEN, MEASUREMENTS TAKEN, SITE CALIBRATED
21-Jul-2023 11:33:00 AM
Maintenance Log
DATA DOWNLOAD
TC SET,SURVEY SENT,DATA DOWNLOADED,TELEMETRY SENT NOT REFLECTED IN FZ,SITE CLEARED
Yes
22-Aug-2023 08:55:00 AM
Maintenance Log
DATA DOWNLOAD
TC SET,DATA DOWNLOADED,TELEMETRY SENTNOT REFLECTED IN FZ,DESSICANT CHECKED,ANTENNA CHECKED,SITE CLEARED
Yes
03-Oct-2023 10:10:00 AM
Removal Log
REMOVAL
TRAFFIC CONTROL SENT, DATA DOWNLOADED, TELEMETRY UNABLE TO SENT, CALIBRATION DONE, EQUIPMENT REMOVED, LOGGER TAG, PHOTOS AND VIDEOS BEFORE AND AFTER TAKEN.
Yes
489 Civica Infrastructure Inc. www.civi.ca
Civica Infrastructures Inc. Kawartha Lakes Flow Monitoring Report
Appendix - A June 03, 2024
Aggregate Data Station: L3
Precipitation Date From
Date To
Days
Min (mm)
Avg (mm)
Max (mm)
Sum (mm)
Count
Time of Min1
Time of Max1
Jan 12, 2023
Oct 03, 2023
257
0.00
0.01
12.00
504.30
73,454
Thu Jan 12, 2023 00:00
Thu Aug 03, 2023 16:10
Level Date From
Date To
Days
Min (mm)
Avg (mm)
Max (mm)
Count
Time of Min1
Time of Max1
Jan 12, 2023
Oct 03, 2023
265
0.09
0.14
0.31
76,008
Sun Jan 29, 2023 03:15
Thu Feb 09, 2023 18:15
Velocity Date From
Date To
Days
Min (m/s)
Avg (m/s)
Max (m/s)
Count
Time of Min1
Time of Max1
Jan 12, 2023
Oct 03, 2023
265
0.11
0.30
0.68
76,008
Thu Feb 09, 2023 04:40
Thu Feb 09, 2023 19:05
Flow
1
Date From
Date To
Days
Min (L/s)
Avg (L/s)
Max (L/s)
Total Volume (1,000,000 L)
Count
Time of Min1
Time of Max1
Jan 12, 2023
Oct 03, 2023
265
3.69
14.49
84.91
330.47
76,008
Mon Oct 02, 2023 01:35
Thu Feb 09, 2023 18:35
Time of Min and Time of Max will be displayed by first occurrence
490 Civica Infrastructure Inc. www.civi.ca
Civica Infrastructures Inc. Kawartha Lakes Flow Monitoring Report
Appendix - A June 03, 2024
Data Chart Station: L3 Jan 12, 2023 – Jan 31, 2023
491 Civica Infrastructure Inc. www.civi.ca
Civica Infrastructures Inc. Kawartha Lakes Flow Monitoring Report
Appendix - A June 03, 2024
Data Chart Station: L3 Feb 01, 2023 – Feb 28, 2023
492 Civica Infrastructure Inc. www.civi.ca
Civica Infrastructures Inc. Kawartha Lakes Flow Monitoring Report
Appendix - A June 03, 2024
Data Chart Station: L3 Mar 01, 2023 – Mar 31, 2023
493 Civica Infrastructure Inc. www.civi.ca
Civica Infrastructures Inc. Kawartha Lakes Flow Monitoring Report
Appendix - A June 03, 2024
Data Chart Station: L3 Apr 01, 2023 – Apr 30, 2023
494 Civica Infrastructure Inc. www.civi.ca
Civica Infrastructures Inc. Kawartha Lakes Flow Monitoring Report
Appendix - A June 03, 2024
Data Chart Station: L3 May 01, 2023 – May 31, 2023
495 Civica Infrastructure Inc. www.civi.ca
Civica Infrastructures Inc. Kawartha Lakes Flow Monitoring Report
Appendix - A June 03, 2024
Data Chart Station: L3 Jun 01, 2023 – Jun 30, 2023
496 Civica Infrastructure Inc. www.civi.ca
Civica Infrastructures Inc. Kawartha Lakes Flow Monitoring Report
Appendix - A June 03, 2024
Data Chart Station: L3 Jul 01, 2023 – Jul 31, 2023
497 Civica Infrastructure Inc. www.civi.ca
Civica Infrastructures Inc. Kawartha Lakes Flow Monitoring Report
Appendix - A June 03, 2024
Data Chart Station: L3 Aug 01, 2023 – Aug 31, 2023
498 Civica Infrastructure Inc. www.civi.ca
Civica Infrastructures Inc. Kawartha Lakes Flow Monitoring Report
Appendix - A June 03, 2024
Data Chart Station: L3 Sep 01, 2023 – Sep 30, 2023
499 Civica Infrastructure Inc. www.civi.ca
Civica Infrastructures Inc. Kawartha Lakes Flow Monitoring Report
Appendix - A June 03, 2024
Data Chart Station: L3 Oct 01, 2023 – Oct 03, 2023
500 Civica Infrastructure Inc. www.civi.ca
Civica Infrastructures Inc. Kawartha Lakes Flow Monitoring Report
Appendix - A June 03, 2024
Sanitary Report Station: L3
1
Average Dry Weather Flow (L/s)
Average Dry Weather Flow (L/c/d)
Average Daily Minimum Dry Weather Flow (L/s)
Average Daily Peak Dry Weather Flow (L/s)
12.421
323.842
8.489
17.007
Peaking Factor
Groundwater Infiltration (L/s)1
Groundwater Infiltration (L/ha/d)
% of GWI in Average DWF
1.369
7.215
10,742.324
58.087
Groundwater infiltration (GWI) is assumed as 85% of the daily minimum flow averaged over the monitoring period
501 Civica Infrastructure Inc. www.civi.ca
Civica Infrastructures Inc. Kawartha Lakes Flow Monitoring Report
Appendix - A June 03, 2024
I/I Analysis Table
1
Event1
Total Precipitation (mm)
Duration (hours)
Peak Intensity Over Tc at Station (mm/hr)
Feb 09, 2023
39.75
14.42
Mar 31, 2023
19.00
Apr 05, 2023
L3 Measured Peak Flow (L/s)
Peak I/I Flow (L/s)
Peak I/I Rate (L/s/ha)
Volumetric Runoff Coefficient (CV%)
Peaking Factor (PF)
6.20
84.91
66.54
1.15
16.63 %
4.43
23.33
4.50
58.55
31.80
0.55
15.16 %
1.37
18.00
12.50
4.80
59.82
40.39
0.70
17.71 %
2.04
Apr 30, 2023
16.40
9.50
3.80
54.98
37.17
0.64
17.64 %
2.34
May 19, 2023
32.00
18.92
6.60
60.79
43.07
0.74
8.46 %
2.98
Jun 11, 2023
35.40
25.75
5.00
33.98
22.74
0.39
4.25 %
2.23
Jun 26, 2023
18.40
8.42
7.20
36.31
24.94
0.43
3.38 %
2.26
Jun 27, 2023
24.20
5.42
5.90
63.53
53.29
0.92
8.60 %
4.90
Aug 03, 2023
41.40
4.83
25.40
66.33
55.31
0.95
5.98 %
5.68
Sep 07, 2023
21.80
0.83
17.40
43.76
34.24
0.59
1.57 %
4.01
Average
26.64
12.39
8.68
56.30
40.95
0.71
9.94 %
3.22
Maximum
41.40
25.75
25.40
84.91
66.54
1.15
17.71 %
5.68
Flow KPIs
Measured Storms
Station: L3
An event is a storm with a minimum volume of 15mm and a minimum inter-event dry period of 12 hours
502 Civica Infrastructure Inc. www.civi.ca
Civica Infrastructures Inc. Kawartha Lakes Flow Monitoring Report
Appendix - A June 03, 2024
I/I Analysis Graph Station: L3
503 Civica Infrastructure Inc. www.civi.ca
Civica Infrastructures Inc. Kawartha Lakes Flow Monitoring Report
Appendix - A June 03, 2024
Infiltration/Inflow Event Analysis Station: L3 Feb 08, 2023 21:00 – Feb 10, 2023 11:25, Total Precipitation: 39.75 mm (23,067,709.00 L) Station Details
Storm Details
Catchment Area
58.03 ha
Total Precipitation
39.75 mm (23,067,709.00 L)
Duration of Storm
14.42 hr
Time of Concentration (Tc) 1
75 min
Peak Precipitation Intensity Over Tc 2
6.20 mm/hr
Return Period over Tc 3
< 2 Yr
Measured Flow
I/I Flow
Time of Peak Measured Flow
Feb 09, 2023 18:35
Time of Peak I/I Flow (TD)
Feb 09, 2023 18:35
Estimated Dry Weather Flow at TD
18.37 L/s
Peak Measured Flow
84.91 L/s
Peak I/I Flow 4
66.54 L/s
Peak I/I Rate 5
1.15 L/s/ha
Peak Measured Depth
0.31 mm
Total I/I Flow Volume during event
3,836,096.60 L
Volumetric Coefficient (Cv%) 6
16.63%
Total Measured Flow Volume during Event
5,269,785.60 L
Peak I/I Coefficient 7
0.0666
Hourly Wet-Weather Peaking Factor 8
5.24
Instantaneous Wet-Weather Peaking Factor 9
5.65
1
Time of Concentration (Tc): The estimated time for the flow to travel from the furthest point in the upstream area to the point of monitoring, assume flow is travelling at 1.00 m/s Peak Precipitation Intensity Over Tc: The peak rainfall intensity for the duration of the storm with the time interval defined by time of concentration 3 Return Period over Tc: The estimated time to elapse before a storm of equal or greater intensity will likely occur again, based on design storm criteria 4 Peak I/I Flow: The greatest difference captured between measured flow and estimated dry weather flow, Peak I/I Flow = Maximum (Measured Flow – Estimated Dry Weather Flow) 5 Peak I/I Rate: A normalized peak I/I flow based on catchment area size, Peak I/I Rate = Peak I/I Flow / Catchment Area 6 Volumetric Coefficient (Cv%): The ratio of total I/I volume and total rainfall volume, Cv% = Total I/I Flow Volume / Total Precipitation Volume * 100% 7 Peak I/ I Coefficient: The ratio of peak I/I flow and peak rainfall intensity, Peak I/ I Coefficient = Peak I/I Flow / (Peak Rainfall Intensity over Tc * Catchment Area) 8 Hourly Wet‐Weather Peaking Factor: The ratio of peak hourly wet‐weather measured flow and average dry‐weather flow, Wet‐Weather Peaking Factor = Peak Hourly Wet‐Weather Measured Flow / Average Dry-Weather Flow 9 Instantaneous Wet‐Weather Peaking Factor: The ratio of peak wet‐weather measured flow and average dry‐weather flow, Wet‐Weather Peaking Factor = Peak Wet‐Weather Measured Flow / Average Dry-Weather Flow 2
504 Civica Infrastructure Inc. www.civi.ca
Civica Infrastructures Inc. Kawartha Lakes Flow Monitoring Report
Appendix - A June 03, 2024
I/I Analysis Graph Station: L3
505 Civica Infrastructure Inc. www.civi.ca
Civica Infrastructures Inc. Kawartha Lakes Flow Monitoring Report
Appendix - A June 03, 2024
Infiltration/Inflow Event Analysis Station: L3 Mar 30, 2023 21:40 – Apr 01, 2023 21:00, Total Precipitation: 19.00 mm (11,026,071.30 L) Station Details
Storm Details
Catchment Area
58.03 ha
Total Precipitation
19.00 mm (11,026,071.30 L)
Duration of Storm
23.33 hr
Time of Concentration (Tc) 1
75 min
Peak Precipitation Intensity Over Tc 2
4.50 mm/hr
Return Period over Tc 3
< 2 Yr
Measured Flow
I/I Flow
Time of Peak Measured Flow
Apr 01, 2023 14:25
Time of Peak I/I Flow (TD)
Apr 01, 2023 14:25
Estimated Dry Weather Flow at TD
26.76 L/s
Peak Measured Flow
58.55 L/s
Peak I/I Flow 4
31.80 L/s
Peak I/I Rate 5
0.55 L/s/ha
Peak Measured Depth
0.29 mm
Total I/I Flow Volume during event
1,671,861.80 L
Volumetric Coefficient (Cv%) 6
15.16%
Total Measured Flow Volume during Event
4,634,784.00 L
Peak I/I Coefficient 7
0.0440
Hourly Wet-Weather Peaking Factor 8
2.35
Instantaneous Wet-Weather Peaking Factor 9
2.52
1
Time of Concentration (Tc): The estimated time for the flow to travel from the furthest point in the upstream area to the point of monitoring, assume flow is travelling at 1.00 m/s Peak Precipitation Intensity Over Tc: The peak rainfall intensity for the duration of the storm with the time interval defined by time of concentration 3 Return Period over Tc: The estimated time to elapse before a storm of equal or greater intensity will likely occur again, based on design storm criteria 4 Peak I/I Flow: The greatest difference captured between measured flow and estimated dry weather flow, Peak I/I Flow = Maximum (Measured Flow – Estimated Dry Weather Flow) 5 Peak I/I Rate: A normalized peak I/I flow based on catchment area size, Peak I/I Rate = Peak I/I Flow / Catchment Area 6 Volumetric Coefficient (Cv%): The ratio of total I/I volume and total rainfall volume, Cv% = Total I/I Flow Volume / Total Precipitation Volume * 100% 7 Peak I/ I Coefficient: The ratio of peak I/I flow and peak rainfall intensity, Peak I/ I Coefficient = Peak I/I Flow / (Peak Rainfall Intensity over Tc * Catchment Area) 8 Hourly Wet‐Weather Peaking Factor: The ratio of peak hourly wet‐weather measured flow and average dry‐weather flow, Wet‐Weather Peaking Factor = Peak Hourly Wet‐Weather Measured Flow / Average Dry-Weather Flow 9 Instantaneous Wet‐Weather Peaking Factor: The ratio of peak wet‐weather measured flow and average dry‐weather flow, Wet‐Weather Peaking Factor = Peak Wet‐Weather Measured Flow / Average Dry-Weather Flow 2
506 Civica Infrastructure Inc. www.civi.ca
Civica Infrastructures Inc. Kawartha Lakes Flow Monitoring Report
Appendix - A June 03, 2024
I/I Analysis Graph Station: L3
507 Civica Infrastructure Inc. www.civi.ca
Civica Infrastructures Inc. Kawartha Lakes Flow Monitoring Report
Appendix - A June 03, 2024
Infiltration/Inflow Event Analysis Station: L3 Apr 04, 2023 17:45 – Apr 06, 2023 06:15, Total Precipitation: 18.00 mm (10,445,751.00 L) Station Details
Storm Details
Catchment Area
58.03 ha
Total Precipitation
18.00 mm (10,445,751.00 L)
Duration of Storm
12.50 hr
Time of Concentration (Tc) 1
75 min
Peak Precipitation Intensity Over Tc 2
4.80 mm/hr
Return Period over Tc 3
< 2 Yr
Measured Flow
I/I Flow
Time of Peak Measured Flow
Apr 05, 2023 16:30
Time of Peak I/I Flow (TD)
Apr 05, 2023 16:30
Estimated Dry Weather Flow at TD
19.44 L/s
Peak Measured Flow
59.82 L/s
Peak I/I Flow 4
40.39 L/s
Peak I/I Rate 5
0.70 L/s/ha
Peak Measured Depth
0.28 mm
Total I/I Flow Volume during event
1,850,376.10 L
Volumetric Coefficient (Cv%) 6
17.71%
Total Measured Flow Volume during Event
3,599,372.80 L
Peak I/I Coefficient 7
0.0522
Hourly Wet-Weather Peaking Factor 8
2.98
Instantaneous Wet-Weather Peaking Factor 9
3.03
1
Time of Concentration (Tc): The estimated time for the flow to travel from the furthest point in the upstream area to the point of monitoring, assume flow is travelling at 1.00 m/s Peak Precipitation Intensity Over Tc: The peak rainfall intensity for the duration of the storm with the time interval defined by time of concentration 3 Return Period over Tc: The estimated time to elapse before a storm of equal or greater intensity will likely occur again, based on design storm criteria 4 Peak I/I Flow: The greatest difference captured between measured flow and estimated dry weather flow, Peak I/I Flow = Maximum (Measured Flow – Estimated Dry Weather Flow) 5 Peak I/I Rate: A normalized peak I/I flow based on catchment area size, Peak I/I Rate = Peak I/I Flow / Catchment Area 6 Volumetric Coefficient (Cv%): The ratio of total I/I volume and total rainfall volume, Cv% = Total I/I Flow Volume / Total Precipitation Volume * 100% 7 Peak I/ I Coefficient: The ratio of peak I/I flow and peak rainfall intensity, Peak I/ I Coefficient = Peak I/I Flow / (Peak Rainfall Intensity over Tc * Catchment Area) 8 Hourly Wet‐Weather Peaking Factor: The ratio of peak hourly wet‐weather measured flow and average dry‐weather flow, Wet‐Weather Peaking Factor = Peak Hourly Wet‐Weather Measured Flow / Average Dry-Weather Flow 9 Instantaneous Wet‐Weather Peaking Factor: The ratio of peak wet‐weather measured flow and average dry‐weather flow, Wet‐Weather Peaking Factor = Peak Wet‐Weather Measured Flow / Average Dry-Weather Flow 2
508 Civica Infrastructure Inc. www.civi.ca
Civica Infrastructures Inc. Kawartha Lakes Flow Monitoring Report
Appendix - A June 03, 2024
I/I Analysis Graph Station: L3
509 Civica Infrastructure Inc. www.civi.ca
Civica Infrastructures Inc. Kawartha Lakes Flow Monitoring Report
Appendix - A June 03, 2024
Infiltration/Inflow Event Analysis Station: L3 Apr 30, 2023 00:30 – May 01, 2023 10:00, Total Precipitation: 16.40 mm (9,517,241.70 L) Station Details
Storm Details
Catchment Area
58.03 ha
Total Precipitation
16.40 mm (9,517,241.70 L)
Duration of Storm
9.50 hr
Time of Concentration (Tc) 1
75 min
Peak Precipitation Intensity Over Tc 2
3.80 mm/hr
Return Period over Tc 3
< 2 Yr
Measured Flow
I/I Flow
Time of Peak Measured Flow
Apr 30, 2023 21:10
Time of Peak I/I Flow (TD)
Apr 30, 2023 21:10
Estimated Dry Weather Flow at TD
17.80 L/s
Peak Measured Flow
54.98 L/s
Peak I/I Flow 4
37.17 L/s
Peak I/I Rate 5
0.64 L/s/ha
Peak Measured Depth
0.25 mm
Total I/I Flow Volume during event
1,679,114.50 L
Volumetric Coefficient (Cv%) 6
17.64%
Total Measured Flow Volume during Event
2,914,726.60 L
Peak I/I Coefficient 7
0.0601
Hourly Wet-Weather Peaking Factor 8
3.33
Instantaneous Wet-Weather Peaking Factor 9
3.46
1
Time of Concentration (Tc): The estimated time for the flow to travel from the furthest point in the upstream area to the point of monitoring, assume flow is travelling at 1.00 m/s Peak Precipitation Intensity Over Tc: The peak rainfall intensity for the duration of the storm with the time interval defined by time of concentration 3 Return Period over Tc: The estimated time to elapse before a storm of equal or greater intensity will likely occur again, based on design storm criteria 4 Peak I/I Flow: The greatest difference captured between measured flow and estimated dry weather flow, Peak I/I Flow = Maximum (Measured Flow – Estimated Dry Weather Flow) 5 Peak I/I Rate: A normalized peak I/I flow based on catchment area size, Peak I/I Rate = Peak I/I Flow / Catchment Area 6 Volumetric Coefficient (Cv%): The ratio of total I/I volume and total rainfall volume, Cv% = Total I/I Flow Volume / Total Precipitation Volume * 100% 7 Peak I/ I Coefficient: The ratio of peak I/I flow and peak rainfall intensity, Peak I/ I Coefficient = Peak I/I Flow / (Peak Rainfall Intensity over Tc * Catchment Area) 8 Hourly Wet‐Weather Peaking Factor: The ratio of peak hourly wet‐weather measured flow and average dry‐weather flow, Wet‐Weather Peaking Factor = Peak Hourly Wet‐Weather Measured Flow / Average Dry-Weather Flow 9 Instantaneous Wet‐Weather Peaking Factor: The ratio of peak wet‐weather measured flow and average dry‐weather flow, Wet‐Weather Peaking Factor = Peak Wet‐Weather Measured Flow / Average Dry-Weather Flow 2
510 Civica Infrastructure Inc. www.civi.ca
Civica Infrastructures Inc. Kawartha Lakes Flow Monitoring Report
Appendix - A June 03, 2024
I/I Analysis Graph Station: L3
511 Civica Infrastructure Inc. www.civi.ca
Civica Infrastructures Inc. Kawartha Lakes Flow Monitoring Report
Appendix - A June 03, 2024
Infiltration/Inflow Event Analysis Station: L3 May 19, 2023 08:15 – May 21, 2023 03:10, Total Precipitation: 32.00 mm (18,570,225.40 L) Station Details
Storm Details
Catchment Area
58.03 ha
Total Precipitation
32.00 mm (18,570,225.40 L)
Duration of Storm
18.92 hr
Time of Concentration (Tc) 1
75 min
Peak Precipitation Intensity Over Tc 2
6.60 mm/hr
Return Period over Tc 3
< 2 Yr
Measured Flow
I/I Flow
Time of Peak Measured Flow
May 20, 2023 07:50
Time of Peak I/I Flow (TD)
May 20, 2023 07:50
Estimated Dry Weather Flow at TD
17.72 L/s
Peak Measured Flow
60.79 L/s
Peak I/I Flow 4
43.07 L/s
Peak I/I Rate 5
0.74 L/s/ha
Peak Measured Depth
0.26 mm
Total I/I Flow Volume during event
1,571,056.60 L
Volumetric Coefficient (Cv%) 6
8.46%
Total Measured Flow Volume during Event
3,182,421.70 L
Peak I/I Coefficient 7
0.0407
Hourly Wet-Weather Peaking Factor 8
3.99
Instantaneous Wet-Weather Peaking Factor 9
4.21
1
Time of Concentration (Tc): The estimated time for the flow to travel from the furthest point in the upstream area to the point of monitoring, assume flow is travelling at 1.00 m/s Peak Precipitation Intensity Over Tc: The peak rainfall intensity for the duration of the storm with the time interval defined by time of concentration 3 Return Period over Tc: The estimated time to elapse before a storm of equal or greater intensity will likely occur again, based on design storm criteria 4 Peak I/I Flow: The greatest difference captured between measured flow and estimated dry weather flow, Peak I/I Flow = Maximum (Measured Flow – Estimated Dry Weather Flow) 5 Peak I/I Rate: A normalized peak I/I flow based on catchment area size, Peak I/I Rate = Peak I/I Flow / Catchment Area 6 Volumetric Coefficient (Cv%): The ratio of total I/I volume and total rainfall volume, Cv% = Total I/I Flow Volume / Total Precipitation Volume * 100% 7 Peak I/ I Coefficient: The ratio of peak I/I flow and peak rainfall intensity, Peak I/ I Coefficient = Peak I/I Flow / (Peak Rainfall Intensity over Tc * Catchment Area) 8 Hourly Wet‐Weather Peaking Factor: The ratio of peak hourly wet‐weather measured flow and average dry‐weather flow, Wet‐Weather Peaking Factor = Peak Hourly Wet‐Weather Measured Flow / Average Dry-Weather Flow 9 Instantaneous Wet‐Weather Peaking Factor: The ratio of peak wet‐weather measured flow and average dry‐weather flow, Wet‐Weather Peaking Factor = Peak Wet‐Weather Measured Flow / Average Dry-Weather Flow 2
512 Civica Infrastructure Inc. www.civi.ca
Civica Infrastructures Inc. Kawartha Lakes Flow Monitoring Report
Appendix - A June 03, 2024
I/I Analysis Graph Station: L3
513 Civica Infrastructure Inc. www.civi.ca
Civica Infrastructures Inc. Kawartha Lakes Flow Monitoring Report
Appendix - A June 03, 2024
Infiltration/Inflow Event Analysis Station: L3 Jun 11, 2023 07:25 – Jun 13, 2023 09:10, Total Precipitation: 35.40 mm (20,543,314.20 L) Station Details
Storm Details
Catchment Area
58.03 ha
Total Precipitation
35.40 mm (20,543,314.20 L)
Duration of Storm
25.75 hr
Time of Concentration (Tc) 1
75 min
Peak Precipitation Intensity Over Tc 2
5.00 mm/hr
Return Period over Tc 3
< 2 Yr
Measured Flow
I/I Flow
Time of Peak Measured Flow
Jun 12, 2023 11:45
Time of Peak I/I Flow (TD)
Jun 12, 2023 11:45
Estimated Dry Weather Flow at TD
11.24 L/s
Peak Measured Flow
33.98 L/s
Peak I/I Flow 4
22.74 L/s
Peak I/I Rate 5
0.39 L/s/ha
Peak Measured Depth
0.19 mm
Total I/I Flow Volume during event
872,305.70 L
Volumetric Coefficient (Cv%) 6
4.25%
Total Measured Flow Volume during Event
2,263,639.10 L
Peak I/I Coefficient 7
0.0284
Hourly Wet-Weather Peaking Factor 8
3.01
Instantaneous Wet-Weather Peaking Factor 9
3.33
1
Time of Concentration (Tc): The estimated time for the flow to travel from the furthest point in the upstream area to the point of monitoring, assume flow is travelling at 1.00 m/s Peak Precipitation Intensity Over Tc: The peak rainfall intensity for the duration of the storm with the time interval defined by time of concentration 3 Return Period over Tc: The estimated time to elapse before a storm of equal or greater intensity will likely occur again, based on design storm criteria 4 Peak I/I Flow: The greatest difference captured between measured flow and estimated dry weather flow, Peak I/I Flow = Maximum (Measured Flow – Estimated Dry Weather Flow) 5 Peak I/I Rate: A normalized peak I/I flow based on catchment area size, Peak I/I Rate = Peak I/I Flow / Catchment Area 6 Volumetric Coefficient (Cv%): The ratio of total I/I volume and total rainfall volume, Cv% = Total I/I Flow Volume / Total Precipitation Volume * 100% 7 Peak I/ I Coefficient: The ratio of peak I/I flow and peak rainfall intensity, Peak I/ I Coefficient = Peak I/I Flow / (Peak Rainfall Intensity over Tc * Catchment Area) 8 Hourly Wet‐Weather Peaking Factor: The ratio of peak hourly wet‐weather measured flow and average dry‐weather flow, Wet‐Weather Peaking Factor = Peak Hourly Wet‐Weather Measured Flow / Average Dry-Weather Flow 9 Instantaneous Wet‐Weather Peaking Factor: The ratio of peak wet‐weather measured flow and average dry‐weather flow, Wet‐Weather Peaking Factor = Peak Wet‐Weather Measured Flow / Average Dry-Weather Flow 2
514 Civica Infrastructure Inc. www.civi.ca
Civica Infrastructures Inc. Kawartha Lakes Flow Monitoring Report
Appendix - A June 03, 2024
I/I Analysis Graph Station: L3
515 Civica Infrastructure Inc. www.civi.ca
Civica Infrastructures Inc. Kawartha Lakes Flow Monitoring Report
Appendix - A June 03, 2024
Infiltration/Inflow Event Analysis Station: L3 Jun 25, 2023 15:05 – Jun 26, 2023 23:30, Total Precipitation: 18.40 mm (10,677,880.00 L) Station Details
Storm Details
Catchment Area
58.03 ha
Total Precipitation
18.40 mm (10,677,880.00 L)
Duration of Storm
8.42 hr
Time of Concentration (Tc) 1
75 min
Peak Precipitation Intensity Over Tc 2
7.20 mm/hr
Return Period over Tc 3
< 2 Yr
Measured Flow
I/I Flow
Time of Peak Measured Flow
Jun 26, 2023 12:10
Time of Peak I/I Flow (TD)
Jun 26, 2023 12:10
Estimated Dry Weather Flow at TD
11.37 L/s
Peak Measured Flow
36.31 L/s
Peak I/I Flow 4
24.94 L/s
Peak I/I Rate 5
0.43 L/s/ha
Peak Measured Depth
0.21 mm
Total I/I Flow Volume during event
360,560.70 L
Volumetric Coefficient (Cv%) 6
3.38%
Total Measured Flow Volume during Event
1,175,950.40 L
Peak I/I Coefficient 7
0.0215
Hourly Wet-Weather Peaking Factor 8
2.84
Instantaneous Wet-Weather Peaking Factor 9
3.29
1
Time of Concentration (Tc): The estimated time for the flow to travel from the furthest point in the upstream area to the point of monitoring, assume flow is travelling at 1.00 m/s Peak Precipitation Intensity Over Tc: The peak rainfall intensity for the duration of the storm with the time interval defined by time of concentration 3 Return Period over Tc: The estimated time to elapse before a storm of equal or greater intensity will likely occur again, based on design storm criteria 4 Peak I/I Flow: The greatest difference captured between measured flow and estimated dry weather flow, Peak I/I Flow = Maximum (Measured Flow – Estimated Dry Weather Flow) 5 Peak I/I Rate: A normalized peak I/I flow based on catchment area size, Peak I/I Rate = Peak I/I Flow / Catchment Area 6 Volumetric Coefficient (Cv%): The ratio of total I/I volume and total rainfall volume, Cv% = Total I/I Flow Volume / Total Precipitation Volume * 100% 7 Peak I/ I Coefficient: The ratio of peak I/I flow and peak rainfall intensity, Peak I/ I Coefficient = Peak I/I Flow / (Peak Rainfall Intensity over Tc * Catchment Area) 8 Hourly Wet‐Weather Peaking Factor: The ratio of peak hourly wet‐weather measured flow and average dry‐weather flow, Wet‐Weather Peaking Factor = Peak Hourly Wet‐Weather Measured Flow / Average Dry-Weather Flow 9 Instantaneous Wet‐Weather Peaking Factor: The ratio of peak wet‐weather measured flow and average dry‐weather flow, Wet‐Weather Peaking Factor = Peak Wet‐Weather Measured Flow / Average Dry-Weather Flow 2
516 Civica Infrastructure Inc. www.civi.ca
Civica Infrastructures Inc. Kawartha Lakes Flow Monitoring Report
Appendix - A June 03, 2024
I/I Analysis Graph Station: L3
517 Civica Infrastructure Inc. www.civi.ca
Civica Infrastructures Inc. Kawartha Lakes Flow Monitoring Report
Appendix - A June 03, 2024
Infiltration/Inflow Event Analysis Station: L3 Jun 26, 2023 21:00 – Jun 28, 2023 02:25, Total Precipitation: 24.20 mm (14,043,730.40 L) Station Details
Storm Details
Catchment Area
58.03 ha
Total Precipitation
24.20 mm (14,043,730.40 L)
Duration of Storm
5.42 hr
Time of Concentration (Tc) 1
75 min
Peak Precipitation Intensity Over Tc 2
5.90 mm/hr
Return Period over Tc 3
< 2 Yr
Measured Flow
I/I Flow
Time of Peak Measured Flow
Jun 27, 2023 14:00
Time of Peak I/I Flow (TD)
Jun 27, 2023 14:10
Estimated Dry Weather Flow at TD
10.25 L/s
Peak Measured Flow
63.53 L/s
Peak I/I Flow 4
53.29 L/s
Peak I/I Rate 5
0.92 L/s/ha
Peak Measured Depth
0.27 mm
Total I/I Flow Volume during event
1,207,991.30 L
Volumetric Coefficient (Cv%) 6
8.60%
Total Measured Flow Volume during Event
1,892,442.50 L
Peak I/I Coefficient 7
0.0558
Hourly Wet-Weather Peaking Factor 8
5.62
Instantaneous Wet-Weather Peaking Factor 9
5.85
1
Time of Concentration (Tc): The estimated time for the flow to travel from the furthest point in the upstream area to the point of monitoring, assume flow is travelling at 1.00 m/s Peak Precipitation Intensity Over Tc: The peak rainfall intensity for the duration of the storm with the time interval defined by time of concentration 3 Return Period over Tc: The estimated time to elapse before a storm of equal or greater intensity will likely occur again, based on design storm criteria 4 Peak I/I Flow: The greatest difference captured between measured flow and estimated dry weather flow, Peak I/I Flow = Maximum (Measured Flow – Estimated Dry Weather Flow) 5 Peak I/I Rate: A normalized peak I/I flow based on catchment area size, Peak I/I Rate = Peak I/I Flow / Catchment Area 6 Volumetric Coefficient (Cv%): The ratio of total I/I volume and total rainfall volume, Cv% = Total I/I Flow Volume / Total Precipitation Volume * 100% 7 Peak I/ I Coefficient: The ratio of peak I/I flow and peak rainfall intensity, Peak I/ I Coefficient = Peak I/I Flow / (Peak Rainfall Intensity over Tc * Catchment Area) 8 Hourly Wet‐Weather Peaking Factor: The ratio of peak hourly wet‐weather measured flow and average dry‐weather flow, Wet‐Weather Peaking Factor = Peak Hourly Wet‐Weather Measured Flow / Average Dry-Weather Flow 9 Instantaneous Wet‐Weather Peaking Factor: The ratio of peak wet‐weather measured flow and average dry‐weather flow, Wet‐Weather Peaking Factor = Peak Wet‐Weather Measured Flow / Average Dry-Weather Flow 2
518 Civica Infrastructure Inc. www.civi.ca
Civica Infrastructures Inc. Kawartha Lakes Flow Monitoring Report
Appendix - A June 03, 2024
I/I Analysis Graph Station: L3
519 Civica Infrastructure Inc. www.civi.ca
Civica Infrastructures Inc. Kawartha Lakes Flow Monitoring Report
Appendix - A June 03, 2024
Infiltration/Inflow Event Analysis Station: L3 Aug 03, 2023 03:55 – Aug 04, 2023 08:45, Total Precipitation: 41.40 mm (24,025,234.30 L) Station Details
Storm Details
Catchment Area
58.03 ha
Total Precipitation
41.40 mm (24,025,234.30 L)
Duration of Storm
4.83 hr
Time of Concentration (Tc) 1
75 min
Peak Precipitation Intensity Over Tc 2
25.40 mm/hr
Return Period over Tc 3
2 - 5 Yr
Measured Flow
I/I Flow
Time of Peak Measured Flow
Aug 03, 2023 17:00
Time of Peak I/I Flow (TD)
Aug 03, 2023 17:00
Estimated Dry Weather Flow at TD
11.02 L/s
Peak Measured Flow
66.33 L/s
Peak I/I Flow 4
55.31 L/s
Peak I/I Rate 5
0.95 L/s/ha
Peak Measured Depth
0.27 mm
Total I/I Flow Volume during event
1,436,329.00 L
Volumetric Coefficient (Cv%) 6
5.98%
Total Measured Flow Volume during Event
2,029,579.40 L
Peak I/I Coefficient 7
0.0135
Hourly Wet-Weather Peaking Factor 8
6.34
Instantaneous Wet-Weather Peaking Factor 9
6.81
1
Time of Concentration (Tc): The estimated time for the flow to travel from the furthest point in the upstream area to the point of monitoring, assume flow is travelling at 1.00 m/s Peak Precipitation Intensity Over Tc: The peak rainfall intensity for the duration of the storm with the time interval defined by time of concentration 3 Return Period over Tc: The estimated time to elapse before a storm of equal or greater intensity will likely occur again, based on design storm criteria 4 Peak I/I Flow: The greatest difference captured between measured flow and estimated dry weather flow, Peak I/I Flow = Maximum (Measured Flow – Estimated Dry Weather Flow) 5 Peak I/I Rate: A normalized peak I/I flow based on catchment area size, Peak I/I Rate = Peak I/I Flow / Catchment Area 6 Volumetric Coefficient (Cv%): The ratio of total I/I volume and total rainfall volume, Cv% = Total I/I Flow Volume / Total Precipitation Volume * 100% 7 Peak I/ I Coefficient: The ratio of peak I/I flow and peak rainfall intensity, Peak I/ I Coefficient = Peak I/I Flow / (Peak Rainfall Intensity over Tc * Catchment Area) 8 Hourly Wet‐Weather Peaking Factor: The ratio of peak hourly wet‐weather measured flow and average dry‐weather flow, Wet‐Weather Peaking Factor = Peak Hourly Wet‐Weather Measured Flow / Average Dry-Weather Flow 9 Instantaneous Wet‐Weather Peaking Factor: The ratio of peak wet‐weather measured flow and average dry‐weather flow, Wet‐Weather Peaking Factor = Peak Wet‐Weather Measured Flow / Average Dry-Weather Flow 2
520 Civica Infrastructure Inc. www.civi.ca
Civica Infrastructures Inc. Kawartha Lakes Flow Monitoring Report
Appendix - A June 03, 2024
I/I Analysis Graph Station: L3
521 Civica Infrastructure Inc. www.civi.ca
Civica Infrastructures Inc. Kawartha Lakes Flow Monitoring Report
Appendix - A June 03, 2024
Infiltration/Inflow Event Analysis Station: L3 Sep 07, 2023 03:00 – Sep 08, 2023 03:50, Total Precipitation: 21.80 mm (12,650,966.50 L) Station Details
Storm Details
Catchment Area
58.03 ha
Total Precipitation
21.80 mm (12,650,966.50 L)
Duration of Storm
0.83 hr
Time of Concentration (Tc) 1
75 min
Peak Precipitation Intensity Over Tc 2
17.40 mm/hr
Return Period over Tc 3
< 2 Yr
Measured Flow
I/I Flow
Time of Peak Measured Flow
Sep 07, 2023 16:20
Time of Peak I/I Flow (TD)
Sep 07, 2023 16:20
Estimated Dry Weather Flow at TD
9.52 L/s
Peak Measured Flow
43.76 L/s
Peak I/I Flow 4
34.24 L/s
Peak I/I Rate 5
0.59 L/s/ha
Peak Measured Depth
0.23 mm
Total I/I Flow Volume during event
198,644.10 L
Volumetric Coefficient (Cv%) 6
1.57%
Total Measured Flow Volume during Event
595,333.10 L
Peak I/I Coefficient 7
0.0122
Hourly Wet-Weather Peaking Factor 8
4.13
Instantaneous Wet-Weather Peaking Factor 9
5.13
1
Time of Concentration (Tc): The estimated time for the flow to travel from the furthest point in the upstream area to the point of monitoring, assume flow is travelling at 1.00 m/s Peak Precipitation Intensity Over Tc: The peak rainfall intensity for the duration of the storm with the time interval defined by time of concentration 3 Return Period over Tc: The estimated time to elapse before a storm of equal or greater intensity will likely occur again, based on design storm criteria 4 Peak I/I Flow: The greatest difference captured between measured flow and estimated dry weather flow, Peak I/I Flow = Maximum (Measured Flow – Estimated Dry Weather Flow) 5 Peak I/I Rate: A normalized peak I/I flow based on catchment area size, Peak I/I Rate = Peak I/I Flow / Catchment Area 6 Volumetric Coefficient (Cv%): The ratio of total I/I volume and total rainfall volume, Cv% = Total I/I Flow Volume / Total Precipitation Volume * 100% 7 Peak I/ I Coefficient: The ratio of peak I/I flow and peak rainfall intensity, Peak I/ I Coefficient = Peak I/I Flow / (Peak Rainfall Intensity over Tc * Catchment Area) 8 Hourly Wet‐Weather Peaking Factor: The ratio of peak hourly wet‐weather measured flow and average dry‐weather flow, Wet‐Weather Peaking Factor = Peak Hourly Wet‐Weather Measured Flow / Average Dry-Weather Flow 9 Instantaneous Wet‐Weather Peaking Factor: The ratio of peak wet‐weather measured flow and average dry‐weather flow, Wet‐Weather Peaking Factor = Peak Wet‐Weather Measured Flow / Average Dry-Weather Flow 2
522 Civica Infrastructure Inc. www.civi.ca
Civica Infrastructures Inc. Kawartha Lakes Flow Monitoring Report
Appendix - A June 03, 2024
Activity Log Station: L3 Date Time
Type
Purpose of Visit
Comment
Calibration Measurement
12-Jan-2023 11:55:00 AM
Installation Log
INSTALLATION
MEASUREMENTS TAKEN, PHOTOS TAKEN, LOGGER INSTALLED, SENSORS INSTALLED, SITE CALIBRATED
Yes
01-Feb-2023 12:30:00 PM
Maintenance Log
CALIBRATION
DATA DOWNLOADED, TELEMETRY SENT, PHOTOS TAKEN, SITE CALIBRATED, SENSORS ADJUSTED, MEASUREMENTS TAKEN
Yes
01-Mar-2023 12:55:00 PM
Maintenance Log
CALIBRATION
TC SET,DATA DOWNLOADED,TELEMETRY SENT,DEBRIS AND SILT REMOVED,SITE CALIBRATED,ANTENNA IN GOOD CONDITION,PHOTOS AND VIDEOS TAKEN
Yes
09-May-2023 10:55:00 AM
Maintenance Log
CALIBRATION
TC SET,SURVEY SENT,DOWNLOADED DATA, SENT TELEMETRY, MADE ENTRY, TOOK PHOTOS/VIDEOS, TOOK MEASUREMENTS,DEBRIS AND SILT CLEARED, CALIBRATED SITE,SITE CLEARED
Yes
Yes
21-Jun-2023 01:18:00 PM
Maintenance Log
CALIBRATION
DATA DOWNLOADED, TELEMETRY NOT SENT,SIGNAL TEST DONE ENTRY MADE PHOTOS/VIDEOS TAKEN, MEASUREMENTS TAKEN, SITE CALIBRATED BATTERY REPLACED
21-Jul-2023 11:47:00 AM
Maintenance Log
DATA DOWNLOAD
TC SET,SURVEY SENT,DATA DOWNLOADED,TELEMETRY SENT REFLECTED IN FZ,SITE CLEARED
Yes
22-Aug-2023 09:20:00 AM
Maintenance Log
DATA DOWNLOAD
TC SET,SURVEY SENT,SURVEY SENT,DATA DOWNLOADED,TELEMETRY SENT,DESSICANT CHECKED,ANTENNA CHECKED,SITE CLEARED
Yes
03-Oct-2023 11:00:00 AM
Removal Log
REMOVAL
TRAFFIC CONTROL SENT, DATA DOWNLOADED, TELEMETRY SENT, CALIBRATION DONE, EQUIPMENT REMOVED, LOGGER TAG, PHOTOS AND VIDEOS BEFORE AND AFTER TAKEN.
Yes
523 Civica Infrastructure Inc. www.civi.ca
Civica Infrastructures Inc. Kawartha Lakes Flow Monitoring Report
Appendix - A June 03, 2024
Aggregate Data Station: L4
Precipitation Date From
Date To
Days
Min (mm)
Avg (mm)
Max (mm)
Sum (mm)
Count
Time of Min1
Time of Max1
Jan 10, 2023
Oct 03, 2023
259
0.00
0.01
12.00
504.55
74,030
Tue Jan 10, 2023 00:00
Thu Aug 03, 2023 16:10
Level Date From
Date To
Days
Min (m)
Avg (m)
Max (m)
Count
Time of Min1
Time of Max1
Jan 10, 2023
Oct 03, 2023
267
0.00
0.02
0.09
76,459
Thu Mar 16, 2023 02:20
Thu Aug 03, 2023 16:15
Velocity Date From
Date To
Days
Min (m/s)
Avg (m/s)
Max (m/s)
Count
Time of Min1
Time of Max1
Jan 10, 2023
Oct 03, 2023
267
0.00
0.00
0.34
76,459
Tue Jan 10, 2023 13:25
Thu Aug 31, 2023 05:05
Flow
1
Date From
Date To
Days
Min (L/s)
Avg (L/s)
Max (L/s)
Total Volume (1,000,000 L)
Count
Time of Min1
Time of Max1
Jan 10, 2023
Oct 03, 2023
267
0.01
0.25
6.78
5.72
76,459
Thu Mar 16, 2023 02:20
Thu Aug 03, 2023 16:15
Time of Min and Time of Max will be displayed by first occurrence
524 Civica Infrastructure Inc. www.civi.ca
Civica Infrastructures Inc. Kawartha Lakes Flow Monitoring Report
Appendix - A June 03, 2024
Data Chart Station: L4 Jan 10, 2023 – Jan 31, 2023
525 Civica Infrastructure Inc. www.civi.ca
Civica Infrastructures Inc. Kawartha Lakes Flow Monitoring Report
Appendix - A June 03, 2024
Data Chart Station: L4 Feb 01, 2023 – Feb 28, 2023
526 Civica Infrastructure Inc. www.civi.ca
Civica Infrastructures Inc. Kawartha Lakes Flow Monitoring Report
Appendix - A June 03, 2024
Data Chart Station: L4 Mar 01, 2023 – Mar 31, 2023
527 Civica Infrastructure Inc. www.civi.ca
Civica Infrastructures Inc. Kawartha Lakes Flow Monitoring Report
Appendix - A June 03, 2024
Data Chart Station: L4 Apr 01, 2023 – Apr 30, 2023
528 Civica Infrastructure Inc. www.civi.ca
Civica Infrastructures Inc. Kawartha Lakes Flow Monitoring Report
Appendix - A June 03, 2024
Data Chart Station: L4 May 01, 2023 – May 31, 2023
529 Civica Infrastructure Inc. www.civi.ca
Civica Infrastructures Inc. Kawartha Lakes Flow Monitoring Report
Appendix - A June 03, 2024
Data Chart Station: L4 Jun 01, 2023 – Jun 30, 2023
530 Civica Infrastructure Inc. www.civi.ca
Civica Infrastructures Inc. Kawartha Lakes Flow Monitoring Report
Appendix - A June 03, 2024
Data Chart Station: L4 Jul 01, 2023 – Jul 31, 2023
531 Civica Infrastructure Inc. www.civi.ca
Civica Infrastructures Inc. Kawartha Lakes Flow Monitoring Report
Appendix - A June 03, 2024
Data Chart Station: L4 Aug 01, 2023 – Aug 31, 2023
532 Civica Infrastructure Inc. www.civi.ca
Civica Infrastructures Inc. Kawartha Lakes Flow Monitoring Report
Appendix - A June 03, 2024
Data Chart Station: L4 Sep 01, 2023 – Sep 30, 2023
533 Civica Infrastructure Inc. www.civi.ca
Civica Infrastructures Inc. Kawartha Lakes Flow Monitoring Report
Appendix - A June 03, 2024
Data Chart Station: L4 Oct 01, 2023 – Oct 03, 2023
534 Civica Infrastructure Inc. www.civi.ca
Civica Infrastructures Inc. Kawartha Lakes Flow Monitoring Report
Appendix - A June 03, 2024
Sanitary Report Station: L4
1
Average Dry Weather Flow (L/s)
Average Dry Weather Flow (L/c/d)
Average Daily Minimum Dry Weather Flow (L/s)
Average Daily Peak Dry Weather Flow (L/s)
0.199
197.540
0.019
1.694
Peaking Factor
Groundwater Infiltration (L/s)1
Groundwater Infiltration (L/ha/d)
% of GWI in Average DWF
8.519
0.017
250.300
8.302
Groundwater infiltration (GWI) is assumed as 85% of the daily minimum flow averaged over the monitoring period
535 Civica Infrastructure Inc. www.civi.ca
Civica Infrastructures Inc. Kawartha Lakes Flow Monitoring Report
Appendix - A June 03, 2024
I/I Analysis Table
1
Event1
Total Precipitation (mm)
Duration (hours)
Peak Intensity Over Tc at Station (mm/hr)
Feb 09, 2023
39.75
14.42
Mar 31, 2023
19.00
Apr 05, 2023
L4 Measured Peak Flow (L/s)
Peak I/I Flow (L/s)
Peak I/I Rate (L/s/ha)
Volumetric Runoff Coefficient (CV%)
Peaking Factor (PF)
13.00
2.27
2.02
0.35
0.95 %
10.58
23.33
6.40
1.13
1.04
0.18
1.31 %
5.58
18.00
12.50
18.40
1.23
1.02
0.18
1.28 %
6.14
Apr 30, 2023
16.40
9.50
6.40
1.81
1.55
0.27
0.68 %
8.65
May 19, 2023
32.00
18.92
12.00
1.97
1.72
0.30
0.51 %
11.11
Jun 11, 2023
35.40
25.75
8.80
2.59
2.38
0.42
0.62 %
15.43
Jun 26, 2023
18.40
8.42
35.20
2.31
2.08
0.36
1.51 %
11.39
Jun 27, 2023
24.20
5.42
16.80
1.81
1.59
0.28
0.48 %
9.80
Aug 03, 2023
41.40
4.83
101.60
6.78
6.48
1.14
0.47 %
50.59
Sep 07, 2023
21.80
0.83
40.80
1.31
1.08
0.19
0.37 %
7.29
Average
26.64
12.39
25.94
2.32
2.10
0.37
0.82 %
13.66
Maximum
41.40
25.75
101.60
6.78
6.48
1.14
1.51 %
50.59
Flow KPIs
Measured Storms
Station: L4
An event is a storm with a minimum volume of 15mm and a minimum inter-event dry period of 12 hours
536 Civica Infrastructure Inc. www.civi.ca
Civica Infrastructures Inc. Kawartha Lakes Flow Monitoring Report
Appendix - A June 03, 2024
I/I Analysis Graph Station: L4
537 Civica Infrastructure Inc. www.civi.ca
Civica Infrastructures Inc. Kawartha Lakes Flow Monitoring Report
Appendix - A June 03, 2024
Infiltration/Inflow Event Analysis Station: L4 Feb 08, 2023 21:00 – Feb 10, 2023 11:25, Total Precipitation: 39.75 mm (2,265,750.00 L) Station Details
Storm Details
Catchment Area
5.70 ha
Total Precipitation
39.75 mm (2,265,750.00 L)
Duration of Storm
14.42 hr
Time of Concentration (Tc) 1
15 min
Peak Precipitation Intensity Over Tc 2
13.00 mm/hr
Return Period over Tc 3
< 2 Yr
Measured Flow
I/I Flow
Time of Peak Measured Flow
Feb 09, 2023 12:30
Time of Peak I/I Flow (TD)
Feb 09, 2023 12:30
Estimated Dry Weather Flow at TD
0.25 L/s
Peak Measured Flow
2.27 L/s
Peak I/I Flow 4
2.02 L/s
Peak I/I Rate 5
0.35 L/s/ha
Peak Measured Depth
56.50 mm
Total I/I Flow Volume during event
21,453.90 L
Volumetric Coefficient (Cv%) 6
0.95%
Total Measured Flow Volume during Event
39,634.70 L
Peak I/I Coefficient 7
0.0098
Hourly Wet-Weather Peaking Factor 8
5.07
Instantaneous Wet-Weather Peaking Factor 9
11.90
1
Time of Concentration (Tc): The estimated time for the flow to travel from the furthest point in the upstream area to the point of monitoring, assume flow is travelling at 1.00 m/s Peak Precipitation Intensity Over Tc: The peak rainfall intensity for the duration of the storm with the time interval defined by time of concentration 3 Return Period over Tc: The estimated time to elapse before a storm of equal or greater intensity will likely occur again, based on design storm criteria 4 Peak I/I Flow: The greatest difference captured between measured flow and estimated dry weather flow, Peak I/I Flow = Maximum (Measured Flow – Estimated Dry Weather Flow) 5 Peak I/I Rate: A normalized peak I/I flow based on catchment area size, Peak I/I Rate = Peak I/I Flow / Catchment Area 6 Volumetric Coefficient (Cv%): The ratio of total I/I volume and total rainfall volume, Cv% = Total I/I Flow Volume / Total Precipitation Volume * 100% 7 Peak I/ I Coefficient: The ratio of peak I/I flow and peak rainfall intensity, Peak I/ I Coefficient = Peak I/I Flow / (Peak Rainfall Intensity over Tc * Catchment Area) 8 Hourly Wet‐Weather Peaking Factor: The ratio of peak hourly wet‐weather measured flow and average dry‐weather flow, Wet‐Weather Peaking Factor = Peak Hourly Wet‐Weather Measured Flow / Average Dry-Weather Flow 9 Instantaneous Wet‐Weather Peaking Factor: The ratio of peak wet‐weather measured flow and average dry‐weather flow, Wet‐Weather Peaking Factor = Peak Wet‐Weather Measured Flow / Average Dry-Weather Flow 2
538 Civica Infrastructure Inc. www.civi.ca
Civica Infrastructures Inc. Kawartha Lakes Flow Monitoring Report
Appendix - A June 03, 2024
I/I Analysis Graph Station: L4
539 Civica Infrastructure Inc. www.civi.ca
Civica Infrastructures Inc. Kawartha Lakes Flow Monitoring Report
Appendix - A June 03, 2024
Infiltration/Inflow Event Analysis Station: L4 Mar 30, 2023 21:40 – Apr 01, 2023 21:00, Total Precipitation: 19.00 mm (1,082,999.70 L) Station Details
Storm Details
Catchment Area
5.70 ha
Total Precipitation
19.00 mm (1,082,999.70 L)
Duration of Storm
23.33 hr
Time of Concentration (Tc) 1
15 min
Peak Precipitation Intensity Over Tc 2
6.40 mm/hr
Return Period over Tc 3
< 2 Yr
Measured Flow
I/I Flow
Time of Peak Measured Flow
Mar 31, 2023 09:55
Time of Peak I/I Flow (TD)
Apr 01, 2023 05:55
Estimated Dry Weather Flow at TD
0.09 L/s
Peak Measured Flow
1.13 L/s
Peak I/I Flow 4
1.04 L/s
Peak I/I Rate 5
0.18 L/s/ha
Peak Measured Depth
53.00 mm
Total I/I Flow Volume during event
14,205.00 L
Volumetric Coefficient (Cv%) 6
1.31%
Total Measured Flow Volume during Event
37,927.80 L
Peak I/I Coefficient 7
0.0103
Hourly Wet-Weather Peaking Factor 8
4.21
Instantaneous Wet-Weather Peaking Factor 9
6.06
1
Time of Concentration (Tc): The estimated time for the flow to travel from the furthest point in the upstream area to the point of monitoring, assume flow is travelling at 1.00 m/s Peak Precipitation Intensity Over Tc: The peak rainfall intensity for the duration of the storm with the time interval defined by time of concentration 3 Return Period over Tc: The estimated time to elapse before a storm of equal or greater intensity will likely occur again, based on design storm criteria 4 Peak I/I Flow: The greatest difference captured between measured flow and estimated dry weather flow, Peak I/I Flow = Maximum (Measured Flow – Estimated Dry Weather Flow) 5 Peak I/I Rate: A normalized peak I/I flow based on catchment area size, Peak I/I Rate = Peak I/I Flow / Catchment Area 6 Volumetric Coefficient (Cv%): The ratio of total I/I volume and total rainfall volume, Cv% = Total I/I Flow Volume / Total Precipitation Volume * 100% 7 Peak I/ I Coefficient: The ratio of peak I/I flow and peak rainfall intensity, Peak I/ I Coefficient = Peak I/I Flow / (Peak Rainfall Intensity over Tc * Catchment Area) 8 Hourly Wet‐Weather Peaking Factor: The ratio of peak hourly wet‐weather measured flow and average dry‐weather flow, Wet‐Weather Peaking Factor = Peak Hourly Wet‐Weather Measured Flow / Average Dry-Weather Flow 9 Instantaneous Wet‐Weather Peaking Factor: The ratio of peak wet‐weather measured flow and average dry‐weather flow, Wet‐Weather Peaking Factor = Peak Wet‐Weather Measured Flow / Average Dry-Weather Flow 2
540 Civica Infrastructure Inc. www.civi.ca
Civica Infrastructures Inc. Kawartha Lakes Flow Monitoring Report
Appendix - A June 03, 2024
I/I Analysis Graph Station: L4
541 Civica Infrastructure Inc. www.civi.ca
Civica Infrastructures Inc. Kawartha Lakes Flow Monitoring Report
Appendix - A June 03, 2024
Infiltration/Inflow Event Analysis Station: L4 Apr 04, 2023 17:45 – Apr 06, 2023 06:15, Total Precipitation: 18.00 mm (1,025,999.60 L) Station Details
Storm Details
Catchment Area
5.70 ha
Total Precipitation
18.00 mm (1,025,999.60 L)
Duration of Storm
12.50 hr
Time of Concentration (Tc) 1
15 min
Peak Precipitation Intensity Over Tc 2
18.40 mm/hr
Return Period over Tc 3
< 2 Yr
Measured Flow
I/I Flow
Time of Peak Measured Flow
Apr 05, 2023 06:20
Time of Peak I/I Flow (TD)
Apr 05, 2023 21:00
Estimated Dry Weather Flow at TD
0.21 L/s
Peak Measured Flow
1.23 L/s
Peak I/I Flow 4
1.02 L/s
Peak I/I Rate 5
0.18 L/s/ha
Peak Measured Depth
42.70 mm
Total I/I Flow Volume during event
13,133.90 L
Volumetric Coefficient (Cv%) 6
1.28%
Total Measured Flow Volume during Event
27,818.50 L
Peak I/I Coefficient 7
0.0035
Hourly Wet-Weather Peaking Factor 8
4.03
Instantaneous Wet-Weather Peaking Factor 9
7.41
1
Time of Concentration (Tc): The estimated time for the flow to travel from the furthest point in the upstream area to the point of monitoring, assume flow is travelling at 1.00 m/s Peak Precipitation Intensity Over Tc: The peak rainfall intensity for the duration of the storm with the time interval defined by time of concentration 3 Return Period over Tc: The estimated time to elapse before a storm of equal or greater intensity will likely occur again, based on design storm criteria 4 Peak I/I Flow: The greatest difference captured between measured flow and estimated dry weather flow, Peak I/I Flow = Maximum (Measured Flow – Estimated Dry Weather Flow) 5 Peak I/I Rate: A normalized peak I/I flow based on catchment area size, Peak I/I Rate = Peak I/I Flow / Catchment Area 6 Volumetric Coefficient (Cv%): The ratio of total I/I volume and total rainfall volume, Cv% = Total I/I Flow Volume / Total Precipitation Volume * 100% 7 Peak I/ I Coefficient: The ratio of peak I/I flow and peak rainfall intensity, Peak I/ I Coefficient = Peak I/I Flow / (Peak Rainfall Intensity over Tc * Catchment Area) 8 Hourly Wet‐Weather Peaking Factor: The ratio of peak hourly wet‐weather measured flow and average dry‐weather flow, Wet‐Weather Peaking Factor = Peak Hourly Wet‐Weather Measured Flow / Average Dry-Weather Flow 9 Instantaneous Wet‐Weather Peaking Factor: The ratio of peak wet‐weather measured flow and average dry‐weather flow, Wet‐Weather Peaking Factor = Peak Wet‐Weather Measured Flow / Average Dry-Weather Flow 2
542 Civica Infrastructure Inc. www.civi.ca
Civica Infrastructures Inc. Kawartha Lakes Flow Monitoring Report
Appendix - A June 03, 2024
I/I Analysis Graph Station: L4
543 Civica Infrastructure Inc. www.civi.ca
Civica Infrastructures Inc. Kawartha Lakes Flow Monitoring Report
Appendix - A June 03, 2024
Infiltration/Inflow Event Analysis Station: L4 Apr 30, 2023 00:30 – May 01, 2023 10:00, Total Precipitation: 16.40 mm (934,799.80 L) Station Details
Storm Details
Catchment Area
5.70 ha
Total Precipitation
16.40 mm (934,799.80 L)
Duration of Storm
9.50 hr
Time of Concentration (Tc) 1
15 min
Peak Precipitation Intensity Over Tc 2
6.40 mm/hr
Return Period over Tc 3
< 2 Yr
Measured Flow
I/I Flow
Time of Peak Measured Flow
May 01, 2023 08:15
Time of Peak I/I Flow (TD)
May 01, 2023 08:15
Estimated Dry Weather Flow at TD
0.26 L/s
Peak Measured Flow
1.81 L/s
Peak I/I Flow 4
1.55 L/s
Peak I/I Rate 5
0.27 L/s/ha
Peak Measured Depth
51.00 mm
Total I/I Flow Volume during event
6,327.40 L
Volumetric Coefficient (Cv%) 6
0.68%
Total Measured Flow Volume during Event
20,234.30 L
Peak I/I Coefficient 7
0.0153
Hourly Wet-Weather Peaking Factor 8
3.12
Instantaneous Wet-Weather Peaking Factor 9
10.12
1
Time of Concentration (Tc): The estimated time for the flow to travel from the furthest point in the upstream area to the point of monitoring, assume flow is travelling at 1.00 m/s Peak Precipitation Intensity Over Tc: The peak rainfall intensity for the duration of the storm with the time interval defined by time of concentration 3 Return Period over Tc: The estimated time to elapse before a storm of equal or greater intensity will likely occur again, based on design storm criteria 4 Peak I/I Flow: The greatest difference captured between measured flow and estimated dry weather flow, Peak I/I Flow = Maximum (Measured Flow – Estimated Dry Weather Flow) 5 Peak I/I Rate: A normalized peak I/I flow based on catchment area size, Peak I/I Rate = Peak I/I Flow / Catchment Area 6 Volumetric Coefficient (Cv%): The ratio of total I/I volume and total rainfall volume, Cv% = Total I/I Flow Volume / Total Precipitation Volume * 100% 7 Peak I/ I Coefficient: The ratio of peak I/I flow and peak rainfall intensity, Peak I/ I Coefficient = Peak I/I Flow / (Peak Rainfall Intensity over Tc * Catchment Area) 8 Hourly Wet‐Weather Peaking Factor: The ratio of peak hourly wet‐weather measured flow and average dry‐weather flow, Wet‐Weather Peaking Factor = Peak Hourly Wet‐Weather Measured Flow / Average Dry-Weather Flow 9 Instantaneous Wet‐Weather Peaking Factor: The ratio of peak wet‐weather measured flow and average dry‐weather flow, Wet‐Weather Peaking Factor = Peak Wet‐Weather Measured Flow / Average Dry-Weather Flow 2
544 Civica Infrastructure Inc. www.civi.ca
Civica Infrastructures Inc. Kawartha Lakes Flow Monitoring Report
Appendix - A June 03, 2024
I/I Analysis Graph Station: L4
545 Civica Infrastructure Inc. www.civi.ca
Civica Infrastructures Inc. Kawartha Lakes Flow Monitoring Report
Appendix - A June 03, 2024
Infiltration/Inflow Event Analysis Station: L4 May 19, 2023 08:15 – May 21, 2023 03:10, Total Precipitation: 32.00 mm (1,823,999.40 L) Station Details
Storm Details
Catchment Area
5.70 ha
Total Precipitation
32.00 mm (1,823,999.40 L)
Duration of Storm
18.92 hr
Time of Concentration (Tc) 1
15 min
Peak Precipitation Intensity Over Tc 2
12.00 mm/hr
Return Period over Tc 3
< 2 Yr
Measured Flow
I/I Flow
Time of Peak Measured Flow
May 20, 2023 12:40
Time of Peak I/I Flow (TD)
May 20, 2023 12:40
Estimated Dry Weather Flow at TD
0.25 L/s
Peak Measured Flow
1.97 L/s
Peak I/I Flow 4
1.72 L/s
Peak I/I Rate 5
0.30 L/s/ha
Peak Measured Depth
53.00 mm
Total I/I Flow Volume during event
9,204.50 L
Volumetric Coefficient (Cv%) 6
0.51%
Total Measured Flow Volume during Event
26,521.10 L
Peak I/I Coefficient 7
0.0091
Hourly Wet-Weather Peaking Factor 8
5.20
Instantaneous Wet-Weather Peaking Factor 9
12.69
1
Time of Concentration (Tc): The estimated time for the flow to travel from the furthest point in the upstream area to the point of monitoring, assume flow is travelling at 1.00 m/s Peak Precipitation Intensity Over Tc: The peak rainfall intensity for the duration of the storm with the time interval defined by time of concentration 3 Return Period over Tc: The estimated time to elapse before a storm of equal or greater intensity will likely occur again, based on design storm criteria 4 Peak I/I Flow: The greatest difference captured between measured flow and estimated dry weather flow, Peak I/I Flow = Maximum (Measured Flow – Estimated Dry Weather Flow) 5 Peak I/I Rate: A normalized peak I/I flow based on catchment area size, Peak I/I Rate = Peak I/I Flow / Catchment Area 6 Volumetric Coefficient (Cv%): The ratio of total I/I volume and total rainfall volume, Cv% = Total I/I Flow Volume / Total Precipitation Volume * 100% 7 Peak I/ I Coefficient: The ratio of peak I/I flow and peak rainfall intensity, Peak I/ I Coefficient = Peak I/I Flow / (Peak Rainfall Intensity over Tc * Catchment Area) 8 Hourly Wet‐Weather Peaking Factor: The ratio of peak hourly wet‐weather measured flow and average dry‐weather flow, Wet‐Weather Peaking Factor = Peak Hourly Wet‐Weather Measured Flow / Average Dry-Weather Flow 9 Instantaneous Wet‐Weather Peaking Factor: The ratio of peak wet‐weather measured flow and average dry‐weather flow, Wet‐Weather Peaking Factor = Peak Wet‐Weather Measured Flow / Average Dry-Weather Flow 2
546 Civica Infrastructure Inc. www.civi.ca
Civica Infrastructures Inc. Kawartha Lakes Flow Monitoring Report
Appendix - A June 03, 2024
I/I Analysis Graph Station: L4
547 Civica Infrastructure Inc. www.civi.ca
Civica Infrastructures Inc. Kawartha Lakes Flow Monitoring Report
Appendix - A June 03, 2024
Infiltration/Inflow Event Analysis Station: L4 Jun 11, 2023 07:25 – Jun 13, 2023 09:10, Total Precipitation: 35.40 mm (2,017,799.60 L) Station Details
Storm Details
Catchment Area
5.70 ha
Total Precipitation
35.40 mm (2,017,799.60 L)
Duration of Storm
25.75 hr
Time of Concentration (Tc) 1
15 min
Peak Precipitation Intensity Over Tc 2
8.80 mm/hr
Return Period over Tc 3
< 2 Yr
Measured Flow
I/I Flow
Time of Peak Measured Flow
Jun 12, 2023 11:10
Time of Peak I/I Flow (TD)
Jun 12, 2023 11:10
Estimated Dry Weather Flow at TD
0.21 L/s
Peak Measured Flow
2.59 L/s
Peak I/I Flow 4
2.38 L/s
Peak I/I Rate 5
0.42 L/s/ha
Peak Measured Depth
64.00 mm
Total I/I Flow Volume during event
12,568.80 L
Volumetric Coefficient (Cv%) 6
0.62%
Total Measured Flow Volume during Event
33,598.50 L
Peak I/I Coefficient 7
0.0171
Hourly Wet-Weather Peaking Factor 8
6.88
Instantaneous Wet-Weather Peaking Factor 9
16.77
1
Time of Concentration (Tc): The estimated time for the flow to travel from the furthest point in the upstream area to the point of monitoring, assume flow is travelling at 1.00 m/s Peak Precipitation Intensity Over Tc: The peak rainfall intensity for the duration of the storm with the time interval defined by time of concentration 3 Return Period over Tc: The estimated time to elapse before a storm of equal or greater intensity will likely occur again, based on design storm criteria 4 Peak I/I Flow: The greatest difference captured between measured flow and estimated dry weather flow, Peak I/I Flow = Maximum (Measured Flow – Estimated Dry Weather Flow) 5 Peak I/I Rate: A normalized peak I/I flow based on catchment area size, Peak I/I Rate = Peak I/I Flow / Catchment Area 6 Volumetric Coefficient (Cv%): The ratio of total I/I volume and total rainfall volume, Cv% = Total I/I Flow Volume / Total Precipitation Volume * 100% 7 Peak I/ I Coefficient: The ratio of peak I/I flow and peak rainfall intensity, Peak I/ I Coefficient = Peak I/I Flow / (Peak Rainfall Intensity over Tc * Catchment Area) 8 Hourly Wet‐Weather Peaking Factor: The ratio of peak hourly wet‐weather measured flow and average dry‐weather flow, Wet‐Weather Peaking Factor = Peak Hourly Wet‐Weather Measured Flow / Average Dry-Weather Flow 9 Instantaneous Wet‐Weather Peaking Factor: The ratio of peak wet‐weather measured flow and average dry‐weather flow, Wet‐Weather Peaking Factor = Peak Wet‐Weather Measured Flow / Average Dry-Weather Flow 2
548 Civica Infrastructure Inc. www.civi.ca
Civica Infrastructures Inc. Kawartha Lakes Flow Monitoring Report
Appendix - A June 03, 2024
I/I Analysis Graph Station: L4
549 Civica Infrastructure Inc. www.civi.ca
Civica Infrastructures Inc. Kawartha Lakes Flow Monitoring Report
Appendix - A June 03, 2024
Infiltration/Inflow Event Analysis Station: L4 Jun 25, 2023 15:05 – Jun 26, 2023 23:30, Total Precipitation: 18.40 mm (1,048,799.70 L) Station Details
Storm Details
Catchment Area
5.70 ha
Total Precipitation
18.40 mm (1,048,799.70 L)
Duration of Storm
8.42 hr
Time of Concentration (Tc) 1
15 min
Peak Precipitation Intensity Over Tc 2
35.20 mm/hr
Return Period over Tc 3
< 2 Yr
Measured Flow
I/I Flow
Time of Peak Measured Flow
Jun 26, 2023 21:20
Time of Peak I/I Flow (TD)
Jun 26, 2023 21:20
Estimated Dry Weather Flow at TD
0.24 L/s
Peak Measured Flow
2.31 L/s
Peak I/I Flow 4
2.08 L/s
Peak I/I Rate 5
0.36 L/s/ha
Peak Measured Depth
57.00 mm
Total I/I Flow Volume during event
15,847.20 L
Volumetric Coefficient (Cv%) 6
1.51%
Total Measured Flow Volume during Event
29,299.60 L
Peak I/I Coefficient 7
0.0037
Hourly Wet-Weather Peaking Factor 8
5.00
Instantaneous Wet-Weather Peaking Factor 9
12.68
1
Time of Concentration (Tc): The estimated time for the flow to travel from the furthest point in the upstream area to the point of monitoring, assume flow is travelling at 1.00 m/s Peak Precipitation Intensity Over Tc: The peak rainfall intensity for the duration of the storm with the time interval defined by time of concentration 3 Return Period over Tc: The estimated time to elapse before a storm of equal or greater intensity will likely occur again, based on design storm criteria 4 Peak I/I Flow: The greatest difference captured between measured flow and estimated dry weather flow, Peak I/I Flow = Maximum (Measured Flow – Estimated Dry Weather Flow) 5 Peak I/I Rate: A normalized peak I/I flow based on catchment area size, Peak I/I Rate = Peak I/I Flow / Catchment Area 6 Volumetric Coefficient (Cv%): The ratio of total I/I volume and total rainfall volume, Cv% = Total I/I Flow Volume / Total Precipitation Volume * 100% 7 Peak I/ I Coefficient: The ratio of peak I/I flow and peak rainfall intensity, Peak I/ I Coefficient = Peak I/I Flow / (Peak Rainfall Intensity over Tc * Catchment Area) 8 Hourly Wet‐Weather Peaking Factor: The ratio of peak hourly wet‐weather measured flow and average dry‐weather flow, Wet‐Weather Peaking Factor = Peak Hourly Wet‐Weather Measured Flow / Average Dry-Weather Flow 9 Instantaneous Wet‐Weather Peaking Factor: The ratio of peak wet‐weather measured flow and average dry‐weather flow, Wet‐Weather Peaking Factor = Peak Wet‐Weather Measured Flow / Average Dry-Weather Flow 2
550 Civica Infrastructure Inc. www.civi.ca
Civica Infrastructures Inc. Kawartha Lakes Flow Monitoring Report
Appendix - A June 03, 2024
I/I Analysis Graph Station: L4
551 Civica Infrastructure Inc. www.civi.ca
Civica Infrastructures Inc. Kawartha Lakes Flow Monitoring Report
Appendix - A June 03, 2024
Infiltration/Inflow Event Analysis Station: L4 Jun 26, 2023 21:00 – Jun 28, 2023 02:25, Total Precipitation: 24.20 mm (1,379,399.30 L) Station Details
Storm Details
Catchment Area
5.70 ha
Total Precipitation
24.20 mm (1,379,399.30 L)
Duration of Storm
5.42 hr
Time of Concentration (Tc) 1
15 min
Peak Precipitation Intensity Over Tc 2
16.80 mm/hr
Return Period over Tc 3
< 2 Yr
Measured Flow
I/I Flow
Time of Peak Measured Flow
Jun 27, 2023 09:30
Time of Peak I/I Flow (TD)
Jun 27, 2023 09:30
Estimated Dry Weather Flow at TD
0.22 L/s
Peak Measured Flow
1.81 L/s
Peak I/I Flow 4
1.59 L/s
Peak I/I Rate 5
0.28 L/s/ha
Peak Measured Depth
63.00 mm
Total I/I Flow Volume during event
6,572.20 L
Volumetric Coefficient (Cv%) 6
0.48%
Total Measured Flow Volume during Event
16,779.60 L
Peak I/I Coefficient 7
0.0060
Hourly Wet-Weather Peaking Factor 8
4.27
Instantaneous Wet-Weather Peaking Factor 9
11.17
1
Time of Concentration (Tc): The estimated time for the flow to travel from the furthest point in the upstream area to the point of monitoring, assume flow is travelling at 1.00 m/s Peak Precipitation Intensity Over Tc: The peak rainfall intensity for the duration of the storm with the time interval defined by time of concentration 3 Return Period over Tc: The estimated time to elapse before a storm of equal or greater intensity will likely occur again, based on design storm criteria 4 Peak I/I Flow: The greatest difference captured between measured flow and estimated dry weather flow, Peak I/I Flow = Maximum (Measured Flow – Estimated Dry Weather Flow) 5 Peak I/I Rate: A normalized peak I/I flow based on catchment area size, Peak I/I Rate = Peak I/I Flow / Catchment Area 6 Volumetric Coefficient (Cv%): The ratio of total I/I volume and total rainfall volume, Cv% = Total I/I Flow Volume / Total Precipitation Volume * 100% 7 Peak I/ I Coefficient: The ratio of peak I/I flow and peak rainfall intensity, Peak I/ I Coefficient = Peak I/I Flow / (Peak Rainfall Intensity over Tc * Catchment Area) 8 Hourly Wet‐Weather Peaking Factor: The ratio of peak hourly wet‐weather measured flow and average dry‐weather flow, Wet‐Weather Peaking Factor = Peak Hourly Wet‐Weather Measured Flow / Average Dry-Weather Flow 9 Instantaneous Wet‐Weather Peaking Factor: The ratio of peak wet‐weather measured flow and average dry‐weather flow, Wet‐Weather Peaking Factor = Peak Wet‐Weather Measured Flow / Average Dry-Weather Flow 2
552 Civica Infrastructure Inc. www.civi.ca
Civica Infrastructures Inc. Kawartha Lakes Flow Monitoring Report
Appendix - A June 03, 2024
I/I Analysis Graph Station: L4
553 Civica Infrastructure Inc. www.civi.ca
Civica Infrastructures Inc. Kawartha Lakes Flow Monitoring Report
Appendix - A June 03, 2024
Infiltration/Inflow Event Analysis Station: L4 Aug 03, 2023 03:55 – Aug 04, 2023 08:45, Total Precipitation: 41.40 mm (2,359,799.80 L) Station Details
Storm Details
Catchment Area
5.70 ha
Total Precipitation
41.40 mm (2,359,799.80 L)
Duration of Storm
4.83 hr
Time of Concentration (Tc) 1
15 min
Peak Precipitation Intensity Over Tc 2
101.60 mm/hr
Return Period over Tc 3
10 - 25 Yr
Measured Flow
I/I Flow
Time of Peak Measured Flow
Aug 03, 2023 16:15
Time of Peak I/I Flow (TD)
Aug 03, 2023 16:15
Estimated Dry Weather Flow at TD
0.30 L/s
Peak Measured Flow
6.78 L/s
Peak I/I Flow 4
6.48 L/s
Peak I/I Rate 5
1.14 L/s/ha
Peak Measured Depth
92.00 mm
Total I/I Flow Volume during event
11,056.00 L
Volumetric Coefficient (Cv%) 6
0.47%
Total Measured Flow Volume during Event
18,860.70 L
Peak I/I Coefficient 7
0.0040
Hourly Wet-Weather Peaking Factor 8
16.48
Instantaneous Wet-Weather Peaking Factor 9
52.93
1
Time of Concentration (Tc): The estimated time for the flow to travel from the furthest point in the upstream area to the point of monitoring, assume flow is travelling at 1.00 m/s Peak Precipitation Intensity Over Tc: The peak rainfall intensity for the duration of the storm with the time interval defined by time of concentration 3 Return Period over Tc: The estimated time to elapse before a storm of equal or greater intensity will likely occur again, based on design storm criteria 4 Peak I/I Flow: The greatest difference captured between measured flow and estimated dry weather flow, Peak I/I Flow = Maximum (Measured Flow – Estimated Dry Weather Flow) 5 Peak I/I Rate: A normalized peak I/I flow based on catchment area size, Peak I/I Rate = Peak I/I Flow / Catchment Area 6 Volumetric Coefficient (Cv%): The ratio of total I/I volume and total rainfall volume, Cv% = Total I/I Flow Volume / Total Precipitation Volume * 100% 7 Peak I/ I Coefficient: The ratio of peak I/I flow and peak rainfall intensity, Peak I/ I Coefficient = Peak I/I Flow / (Peak Rainfall Intensity over Tc * Catchment Area) 8 Hourly Wet‐Weather Peaking Factor: The ratio of peak hourly wet‐weather measured flow and average dry‐weather flow, Wet‐Weather Peaking Factor = Peak Hourly Wet‐Weather Measured Flow / Average Dry-Weather Flow 9 Instantaneous Wet‐Weather Peaking Factor: The ratio of peak wet‐weather measured flow and average dry‐weather flow, Wet‐Weather Peaking Factor = Peak Wet‐Weather Measured Flow / Average Dry-Weather Flow 2
554 Civica Infrastructure Inc. www.civi.ca
Civica Infrastructures Inc. Kawartha Lakes Flow Monitoring Report
Appendix - A June 03, 2024
I/I Analysis Graph Station: L4
555 Civica Infrastructure Inc. www.civi.ca
Civica Infrastructures Inc. Kawartha Lakes Flow Monitoring Report
Appendix - A June 03, 2024
Infiltration/Inflow Event Analysis Station: L4 Sep 07, 2023 03:00 – Sep 08, 2023 03:50, Total Precipitation: 21.80 mm (1,242,599.70 L) Station Details
Storm Details
Catchment Area
5.70 ha
Total Precipitation
21.80 mm (1,242,599.70 L)
Duration of Storm
0.83 hr
Time of Concentration (Tc) 1
15 min
Peak Precipitation Intensity Over Tc 2
40.80 mm/hr
Return Period over Tc 3
< 2 Yr
Measured Flow
I/I Flow
Time of Peak Measured Flow
Sep 07, 2023 15:20
Time of Peak I/I Flow (TD)
Sep 07, 2023 15:20
Estimated Dry Weather Flow at TD
0.23 L/s
Peak Measured Flow
1.31 L/s
Peak I/I Flow 4
1.08 L/s
Peak I/I Rate 5
0.19 L/s/ha
Peak Measured Depth
47.00 mm
Total I/I Flow Volume during event
4,601.50 L
Volumetric Coefficient (Cv%) 6
0.37%
Total Measured Flow Volume during Event
11,505.80 L
Peak I/I Coefficient 7
0.0017
Hourly Wet-Weather Peaking Factor 8
5.29
Instantaneous Wet-Weather Peaking Factor 9
8.84
1
Time of Concentration (Tc): The estimated time for the flow to travel from the furthest point in the upstream area to the point of monitoring, assume flow is travelling at 1.00 m/s Peak Precipitation Intensity Over Tc: The peak rainfall intensity for the duration of the storm with the time interval defined by time of concentration 3 Return Period over Tc: The estimated time to elapse before a storm of equal or greater intensity will likely occur again, based on design storm criteria 4 Peak I/I Flow: The greatest difference captured between measured flow and estimated dry weather flow, Peak I/I Flow = Maximum (Measured Flow – Estimated Dry Weather Flow) 5 Peak I/I Rate: A normalized peak I/I flow based on catchment area size, Peak I/I Rate = Peak I/I Flow / Catchment Area 6 Volumetric Coefficient (Cv%): The ratio of total I/I volume and total rainfall volume, Cv% = Total I/I Flow Volume / Total Precipitation Volume * 100% 7 Peak I/ I Coefficient: The ratio of peak I/I flow and peak rainfall intensity, Peak I/ I Coefficient = Peak I/I Flow / (Peak Rainfall Intensity over Tc * Catchment Area) 8 Hourly Wet‐Weather Peaking Factor: The ratio of peak hourly wet‐weather measured flow and average dry‐weather flow, Wet‐Weather Peaking Factor = Peak Hourly Wet‐Weather Measured Flow / Average Dry-Weather Flow 9 Instantaneous Wet‐Weather Peaking Factor: The ratio of peak wet‐weather measured flow and average dry‐weather flow, Wet‐Weather Peaking Factor = Peak Wet‐Weather Measured Flow / Average Dry-Weather Flow 2
556 Civica Infrastructure Inc. www.civi.ca
Civica Infrastructures Inc. Kawartha Lakes Flow Monitoring Report
Appendix - A June 03, 2024
Activity Log Station: L4 Date Time
Type
Purpose of Visit
Comment
Calibration Measurement
10-Jan-2023 01:12:00 PM
Installation Log
INSTALLATION
MEASUREMENTS TAKEN. PHOTOS TAKEN LOGGER AND FLUME INSTALLED
Yes
22-Feb-2023 06:11:00 PM
Maintenance Log
MAINTENANCE AND CALIBRATION
Data Downloaded, Telemetry sent, Downward sensor fixed.
Yes
22-Feb-2023 06:29:00 PM
Maintenance Log
MAINTENANCE / CALIBRATION
DATA DOWNLOADED, TELEMETRY SENT.
Yes
09-May-2023 12:03:00 PM
Maintenance Log
CALIBRATION
TC SET,SURVEY SENT,DOWNLOADED DATA, SENT TELEMETRY, MADE ENTRY, TOOK PHOTOS/VIDEOS, TOOK MEASUREMENTS,DEBRIS AND SILT CLEARED, CALIBRATED SITE,SITE CLEARED
Yes
Yes
21-Jun-2023 03:20:00 PM
Maintenance Log
CALIBRATION
DATA DOWNLOADED, TELEMETRY SENT ENTRY MADE PHOTOS/VIDEOS TAKEN, MEASUREMENTS TAKEN, SITE CALIBRATED BATTERY REPLACED
22-Aug-2023 09:50:00 AM
Maintenance Log
DATA DOWNLOAD
TC SET,DATA DOWNLOADED,TELEMETRY SENT NOT REFLECTED IN FZ,DESSICANT CHECKED,ANTENNA CHECKED,SITE CLEARED
Yes
03-Oct-2023 12:05:00 PM
Removal Log
REMOVAL
TRAFFIC CONTROL SENT, DATA DOWNLOADED, TELEMETRY SENT, CALIBRATION DONE, EQUIPMENT REMOVED, LOGGER TAG, PHOTOS AND VIDEOS BEFORE AND AFTER TAKEN.
Yes
557 Civica Infrastructure Inc. www.civi.ca
Civica Infrastructures Inc. Kawartha Lakes Flow Monitoring Report
Appendix - A June 03, 2024
Aggregate Data Station: L5
Precipitation Date From
Date To
Days
Min (mm)
Avg (mm)
Max (mm)
Sum (mm)
Count
Time of Min1
Time of Max1
Jan 12, 2023
Oct 03, 2023
265
0.00
0.01
15.75
655.25
76,224
Thu Jan 12, 2023 00:00
Thu Aug 03, 2023 16:20
Level Date From
Date To
Days
Min (m)
Avg (m)
Max (m)
Count
Time of Min1
Time of Max1
Jan 12, 2023
Oct 03, 2023
265
0.02
0.04
0.12
76,074
Wed Sep 20, 2023 04:10
Thu Aug 03, 2023 16:35
Velocity Date From
Date To
Days
Min (m/s)
Avg (m/s)
Max (m/s)
Count
Time of Min1
Time of Max1
Jan 12, 2023
Oct 03, 2023
265
0.00
0.18
0.68
76,074
Sun Sep 10, 2023 21:45
Fri Mar 17, 2023 17:45
Flow
1
Date From
Date To
Days
Min (L/s)
Avg (L/s)
Max (L/s)
Total Volume (1,000,000 L)
Count
Time of Min1
Time of Max1
Jan 12, 2023
Oct 03, 2023
265
0.00
1.76
21.45
40.24
76,074
Sun Sep 10, 2023 21:45
Thu Aug 03, 2023 16:35
Time of Min and Time of Max will be displayed by first occurrence
558 Civica Infrastructure Inc. www.civi.ca
Civica Infrastructures Inc. Kawartha Lakes Flow Monitoring Report
Appendix - A June 03, 2024
Data Chart Station: L5 Jan 12, 2023 – Jan 31, 2023
559 Civica Infrastructure Inc. www.civi.ca
Civica Infrastructures Inc. Kawartha Lakes Flow Monitoring Report
Appendix - A June 03, 2024
Data Chart Station: L5 Feb 01, 2023 – Feb 28, 2023
560 Civica Infrastructure Inc. www.civi.ca
Civica Infrastructures Inc. Kawartha Lakes Flow Monitoring Report
Appendix - A June 03, 2024
Data Chart Station: L5 Mar 01, 2023 – Mar 31, 2023
561 Civica Infrastructure Inc. www.civi.ca
Civica Infrastructures Inc. Kawartha Lakes Flow Monitoring Report
Appendix - A June 03, 2024
Data Chart Station: L5 Apr 01, 2023 – Apr 30, 2023
562 Civica Infrastructure Inc. www.civi.ca
Civica Infrastructures Inc. Kawartha Lakes Flow Monitoring Report
Appendix - A June 03, 2024
Data Chart Station: L5 May 01, 2023 – May 31, 2023
563 Civica Infrastructure Inc. www.civi.ca
Civica Infrastructures Inc. Kawartha Lakes Flow Monitoring Report
Appendix - A June 03, 2024
Data Chart Station: L5 Jun 01, 2023 – Jun 30, 2023
564 Civica Infrastructure Inc. www.civi.ca
Civica Infrastructures Inc. Kawartha Lakes Flow Monitoring Report
Appendix - A June 03, 2024
Data Chart Station: L5 Jul 01, 2023 – Jul 31, 2023
565 Civica Infrastructure Inc. www.civi.ca
Civica Infrastructures Inc. Kawartha Lakes Flow Monitoring Report
Appendix - A June 03, 2024
Data Chart Station: L5 Aug 01, 2023 – Aug 31, 2023
566 Civica Infrastructure Inc. www.civi.ca
Civica Infrastructures Inc. Kawartha Lakes Flow Monitoring Report
Appendix - A June 03, 2024
Data Chart Station: L5 Sep 01, 2023 – Sep 30, 2023
567 Civica Infrastructure Inc. www.civi.ca
Civica Infrastructures Inc. Kawartha Lakes Flow Monitoring Report
Appendix - A June 03, 2024
Data Chart Station: L5 Oct 01, 2023 – Oct 03, 2023
568 Civica Infrastructure Inc. www.civi.ca
Civica Infrastructures Inc. Kawartha Lakes Flow Monitoring Report
Appendix - A June 03, 2024
Sanitary Report Station: L5
1
Average Dry Weather Flow (L/s)
Average Dry Weather Flow (L/c/d)
Average Daily Minimum Dry Weather Flow (L/s)
Average Daily Peak Dry Weather Flow (L/s)
1.585
590.133
0.558
3.086
Peaking Factor
Groundwater Infiltration (L/s)1
Groundwater Infiltration (L/ha/d)
% of GWI in Average DWF
1.948
0.474
1,473.763
29.925
Groundwater infiltration (GWI) is assumed as 85% of the daily minimum flow averaged over the monitoring period
569 Civica Infrastructure Inc. www.civi.ca
Civica Infrastructures Inc. Kawartha Lakes Flow Monitoring Report
Appendix - A June 03, 2024
I/I Analysis Table
1
Event1
Total Precipitation (mm)
Duration (hours)
Peak Intensity Over Tc at Station (mm/hr)
Feb 09, 2023
35.75
21.58
Mar 16, 2023
19.00
Mar 31, 2023
L5 Measured Peak Flow (L/s)
Peak I/I Flow (L/s)
Peak I/I Rate (L/s/ha)
Volumetric Runoff Coefficient (CV%)
Peaking Factor (PF)
6.00
11.67
10.43
0.38
3.46 %
7.37
12.67
3.40
12.91
11.05
0.40
4.73 %
6.87
27.00
18.25
6.90
9.25
7.07
0.25
2.54 %
2.96
Apr 05, 2023
24.50
10.58
12.40
7.40
5.38
0.19
1.64 %
2.55
Apr 16, 2023
16.25
4.50
7.70
3.92
2.18
0.08
0.93 %
1.17
Apr 30, 2023
22.00
11.42
6.40
4.62
2.77
0.10
1.77 %
1.56
May 19, 2023
42.00
18.75
10.30
6.22
4.02
0.14
0.79 %
2.51
Jun 11, 2023
48.50
25.25
8.60
4.87
3.31
0.12
0.80 %
2.26
Jun 23, 2023
19.75
32.08
19.30
3.26
1.56
0.06
1.15 %
0.83
Jun 27, 2023
30.50
5.75
14.10
10.88
8.71
0.31
2.02 %
4.25
Jul 13, 2023
15.00
4.08
8.10
4.85
2.38
0.09
0.90 %
1.19
Jul 15, 2023
16.25
18.67
17.60
3.26
1.18
0.04
0.39 %
0.66
Jul 20, 2023
19.75
2.00
26.10
4.85
3.04
0.11
1.10 %
1.92
Aug 03, 2023
39.25
11.25
49.30
21.45
19.56
0.70
1.72 %
12.23
Aug 17, 2023
19.75
21.83
15.00
4.10
2.35
0.08
1.56 %
1.60
Sep 07, 2023
24.50
0.67
40.70
6.11
4.88
0.18
0.26 %
4.41
Average
26.23
13.71
15.74
7.48
5.62
0.20
1.61 %
3.40
Maximum
48.50
32.08
49.30
21.45
19.56
0.70
4.73 %
12.23
Flow KPIs
Measured Storms
Station: L5
An event is a storm with a minimum volume of 15mm and a minimum inter-event dry period of 12 hours
570 Civica Infrastructure Inc. www.civi.ca
Civica Infrastructures Inc. Kawartha Lakes Flow Monitoring Report
Appendix - A June 03, 2024
I/I Analysis Graph Station: L5
571 Civica Infrastructure Inc. www.civi.ca
Civica Infrastructures Inc. Kawartha Lakes Flow Monitoring Report
Appendix - A June 03, 2024
Infiltration/Inflow Event Analysis Station: L5 Feb 08, 2023 20:55 – Feb 10, 2023 18:30, Total Precipitation: 35.75 mm (9,938,500.00 L) Station Details
Storm Details
Catchment Area
27.80 ha
Total Precipitation
35.75 mm (9,938,500.00 L)
Duration of Storm
21.58 hr
Time of Concentration (Tc) 1
35 min
Peak Precipitation Intensity Over Tc 2
6.00 mm/hr
Return Period over Tc 3
< 2 Yr
Measured Flow
I/I Flow
Time of Peak Measured Flow
Feb 09, 2023 15:35
Time of Peak I/I Flow (TD)
Feb 09, 2023 15:35
Estimated Dry Weather Flow at TD
1.24 L/s
Peak Measured Flow
11.67 L/s
Peak I/I Flow 4
10.43 L/s
Peak I/I Rate 5
0.38 L/s/ha
Peak Measured Depth
72.00 mm
Total I/I Flow Volume during event
343,938.90 L
Volumetric Coefficient (Cv%) 6
3.46%
Total Measured Flow Volume during Event
515,382.10 L
Peak I/I Coefficient 7
0.0225
Hourly Wet-Weather Peaking Factor 8
6.55
Instantaneous Wet-Weather Peaking Factor 9
8.25
1
Time of Concentration (Tc): The estimated time for the flow to travel from the furthest point in the upstream area to the point of monitoring, assume flow is travelling at 1.00 m/s Peak Precipitation Intensity Over Tc: The peak rainfall intensity for the duration of the storm with the time interval defined by time of concentration 3 Return Period over Tc: The estimated time to elapse before a storm of equal or greater intensity will likely occur again, based on design storm criteria 4 Peak I/I Flow: The greatest difference captured between measured flow and estimated dry weather flow, Peak I/I Flow = Maximum (Measured Flow – Estimated Dry Weather Flow) 5 Peak I/I Rate: A normalized peak I/I flow based on catchment area size, Peak I/I Rate = Peak I/I Flow / Catchment Area 6 Volumetric Coefficient (Cv%): The ratio of total I/I volume and total rainfall volume, Cv% = Total I/I Flow Volume / Total Precipitation Volume * 100% 7 Peak I/ I Coefficient: The ratio of peak I/I flow and peak rainfall intensity, Peak I/ I Coefficient = Peak I/I Flow / (Peak Rainfall Intensity over Tc * Catchment Area) 8 Hourly Wet‐Weather Peaking Factor: The ratio of peak hourly wet‐weather measured flow and average dry‐weather flow, Wet‐Weather Peaking Factor = Peak Hourly Wet‐Weather Measured Flow / Average Dry-Weather Flow 9 Instantaneous Wet‐Weather Peaking Factor: The ratio of peak wet‐weather measured flow and average dry‐weather flow, Wet‐Weather Peaking Factor = Peak Wet‐Weather Measured Flow / Average Dry-Weather Flow 2
572 Civica Infrastructure Inc. www.civi.ca
Civica Infrastructures Inc. Kawartha Lakes Flow Monitoring Report
Appendix - A June 03, 2024
I/I Analysis Graph Station: L5
573 Civica Infrastructure Inc. www.civi.ca
Civica Infrastructures Inc. Kawartha Lakes Flow Monitoring Report
Appendix - A June 03, 2024
Infiltration/Inflow Event Analysis Station: L5 Mar 16, 2023 10:45 – Mar 17, 2023 23:25, Total Precipitation: 19.00 mm (5,282,000.00 L) Station Details
Storm Details
Catchment Area
27.80 ha
Total Precipitation
19.00 mm (5,282,000.00 L)
Duration of Storm
12.67 hr
Time of Concentration (Tc) 1
35 min
Peak Precipitation Intensity Over Tc 2
3.40 mm/hr
Return Period over Tc 3
< 2 Yr
Measured Flow
I/I Flow
Time of Peak Measured Flow
Mar 17, 2023 17:45
Time of Peak I/I Flow (TD)
Mar 17, 2023 17:45
Estimated Dry Weather Flow at TD
1.86 L/s
Peak Measured Flow
12.91 L/s
Peak I/I Flow 4
11.05 L/s
Peak I/I Rate 5
0.40 L/s/ha
Peak Measured Depth
71.33 mm
Total I/I Flow Volume during event
249,834.40 L
Volumetric Coefficient (Cv%) 6
4.73%
Total Measured Flow Volume during Event
393,194.90 L
Peak I/I Coefficient 7
0.0417
Hourly Wet-Weather Peaking Factor 8
7.19
Instantaneous Wet-Weather Peaking Factor 9
8.03
1
Time of Concentration (Tc): The estimated time for the flow to travel from the furthest point in the upstream area to the point of monitoring, assume flow is travelling at 1.00 m/s Peak Precipitation Intensity Over Tc: The peak rainfall intensity for the duration of the storm with the time interval defined by time of concentration 3 Return Period over Tc: The estimated time to elapse before a storm of equal or greater intensity will likely occur again, based on design storm criteria 4 Peak I/I Flow: The greatest difference captured between measured flow and estimated dry weather flow, Peak I/I Flow = Maximum (Measured Flow – Estimated Dry Weather Flow) 5 Peak I/I Rate: A normalized peak I/I flow based on catchment area size, Peak I/I Rate = Peak I/I Flow / Catchment Area 6 Volumetric Coefficient (Cv%): The ratio of total I/I volume and total rainfall volume, Cv% = Total I/I Flow Volume / Total Precipitation Volume * 100% 7 Peak I/ I Coefficient: The ratio of peak I/I flow and peak rainfall intensity, Peak I/ I Coefficient = Peak I/I Flow / (Peak Rainfall Intensity over Tc * Catchment Area) 8 Hourly Wet‐Weather Peaking Factor: The ratio of peak hourly wet‐weather measured flow and average dry‐weather flow, Wet‐Weather Peaking Factor = Peak Hourly Wet‐Weather Measured Flow / Average Dry-Weather Flow 9 Instantaneous Wet‐Weather Peaking Factor: The ratio of peak wet‐weather measured flow and average dry‐weather flow, Wet‐Weather Peaking Factor = Peak Wet‐Weather Measured Flow / Average Dry-Weather Flow 2
574 Civica Infrastructure Inc. www.civi.ca
Civica Infrastructures Inc. Kawartha Lakes Flow Monitoring Report
Appendix - A June 03, 2024
I/I Analysis Graph Station: L5
575 Civica Infrastructure Inc. www.civi.ca
Civica Infrastructures Inc. Kawartha Lakes Flow Monitoring Report
Appendix - A June 03, 2024
Infiltration/Inflow Event Analysis Station: L5 Mar 31, 2023 00:15 – Apr 01, 2023 18:30, Total Precipitation: 27.00 mm (7,506,000.00 L) Station Details
Storm Details
Catchment Area
27.80 ha
Total Precipitation
27.00 mm (7,506,000.00 L)
Duration of Storm
18.25 hr
Time of Concentration (Tc) 1
35 min
Peak Precipitation Intensity Over Tc 2
6.90 mm/hr
Return Period over Tc 3
< 2 Yr
Measured Flow
I/I Flow
Time of Peak Measured Flow
Apr 01, 2023 06:20
Time of Peak I/I Flow (TD)
Apr 01, 2023 06:20
Estimated Dry Weather Flow at TD
2.19 L/s
Peak Measured Flow
9.25 L/s
Peak I/I Flow 4
7.07 L/s
Peak I/I Rate 5
0.25 L/s/ha
Peak Measured Depth
64.00 mm
Total I/I Flow Volume during event
190,446.30 L
Volumetric Coefficient (Cv%) 6
2.54%
Total Measured Flow Volume during Event
450,798.10 L
Peak I/I Coefficient 7
0.0133
Hourly Wet-Weather Peaking Factor 8
3.14
Instantaneous Wet-Weather Peaking Factor 9
3.88
1
Time of Concentration (Tc): The estimated time for the flow to travel from the furthest point in the upstream area to the point of monitoring, assume flow is travelling at 1.00 m/s Peak Precipitation Intensity Over Tc: The peak rainfall intensity for the duration of the storm with the time interval defined by time of concentration 3 Return Period over Tc: The estimated time to elapse before a storm of equal or greater intensity will likely occur again, based on design storm criteria 4 Peak I/I Flow: The greatest difference captured between measured flow and estimated dry weather flow, Peak I/I Flow = Maximum (Measured Flow – Estimated Dry Weather Flow) 5 Peak I/I Rate: A normalized peak I/I flow based on catchment area size, Peak I/I Rate = Peak I/I Flow / Catchment Area 6 Volumetric Coefficient (Cv%): The ratio of total I/I volume and total rainfall volume, Cv% = Total I/I Flow Volume / Total Precipitation Volume * 100% 7 Peak I/ I Coefficient: The ratio of peak I/I flow and peak rainfall intensity, Peak I/ I Coefficient = Peak I/I Flow / (Peak Rainfall Intensity over Tc * Catchment Area) 8 Hourly Wet‐Weather Peaking Factor: The ratio of peak hourly wet‐weather measured flow and average dry‐weather flow, Wet‐Weather Peaking Factor = Peak Hourly Wet‐Weather Measured Flow / Average Dry-Weather Flow 9 Instantaneous Wet‐Weather Peaking Factor: The ratio of peak wet‐weather measured flow and average dry‐weather flow, Wet‐Weather Peaking Factor = Peak Wet‐Weather Measured Flow / Average Dry-Weather Flow 2
576 Civica Infrastructure Inc. www.civi.ca
Civica Infrastructures Inc. Kawartha Lakes Flow Monitoring Report
Appendix - A June 03, 2024
I/I Analysis Graph Station: L5
577 Civica Infrastructure Inc. www.civi.ca
Civica Infrastructures Inc. Kawartha Lakes Flow Monitoring Report
Appendix - A June 03, 2024
Infiltration/Inflow Event Analysis Station: L5 Apr 04, 2023 17:50 – Apr 06, 2023 04:25, Total Precipitation: 24.50 mm (6,811,000.00 L) Station Details
Storm Details
Catchment Area
27.80 ha
Total Precipitation
24.50 mm (6,811,000.00 L)
Duration of Storm
10.58 hr
Time of Concentration (Tc) 1
35 min
Peak Precipitation Intensity Over Tc 2
12.40 mm/hr
Return Period over Tc 3
< 2 Yr
Measured Flow
I/I Flow
Time of Peak Measured Flow
Apr 05, 2023 15:10
Time of Peak I/I Flow (TD)
Apr 05, 2023 15:10
Estimated Dry Weather Flow at TD
2.03 L/s
Peak Measured Flow
7.40 L/s
Peak I/I Flow 4
5.38 L/s
Peak I/I Rate 5
0.19 L/s/ha
Peak Measured Depth
58.67 mm
Total I/I Flow Volume during event
112,001.30 L
Volumetric Coefficient (Cv%) 6
1.64%
Total Measured Flow Volume during Event
283,782.40 L
Peak I/I Coefficient 7
0.0056
Hourly Wet-Weather Peaking Factor 8
2.51
Instantaneous Wet-Weather Peaking Factor 9
3.52
1
Time of Concentration (Tc): The estimated time for the flow to travel from the furthest point in the upstream area to the point of monitoring, assume flow is travelling at 1.00 m/s Peak Precipitation Intensity Over Tc: The peak rainfall intensity for the duration of the storm with the time interval defined by time of concentration 3 Return Period over Tc: The estimated time to elapse before a storm of equal or greater intensity will likely occur again, based on design storm criteria 4 Peak I/I Flow: The greatest difference captured between measured flow and estimated dry weather flow, Peak I/I Flow = Maximum (Measured Flow – Estimated Dry Weather Flow) 5 Peak I/I Rate: A normalized peak I/I flow based on catchment area size, Peak I/I Rate = Peak I/I Flow / Catchment Area 6 Volumetric Coefficient (Cv%): The ratio of total I/I volume and total rainfall volume, Cv% = Total I/I Flow Volume / Total Precipitation Volume * 100% 7 Peak I/ I Coefficient: The ratio of peak I/I flow and peak rainfall intensity, Peak I/ I Coefficient = Peak I/I Flow / (Peak Rainfall Intensity over Tc * Catchment Area) 8 Hourly Wet‐Weather Peaking Factor: The ratio of peak hourly wet‐weather measured flow and average dry‐weather flow, Wet‐Weather Peaking Factor = Peak Hourly Wet‐Weather Measured Flow / Average Dry-Weather Flow 9 Instantaneous Wet‐Weather Peaking Factor: The ratio of peak wet‐weather measured flow and average dry‐weather flow, Wet‐Weather Peaking Factor = Peak Wet‐Weather Measured Flow / Average Dry-Weather Flow 2
578 Civica Infrastructure Inc. www.civi.ca
Civica Infrastructures Inc. Kawartha Lakes Flow Monitoring Report
Appendix - A June 03, 2024
I/I Analysis Graph Station: L5
579 Civica Infrastructure Inc. www.civi.ca
Civica Infrastructures Inc. Kawartha Lakes Flow Monitoring Report
Appendix - A June 03, 2024
Infiltration/Inflow Event Analysis Station: L5 Apr 16, 2023 10:25 – Apr 17, 2023 14:55, Total Precipitation: 16.25 mm (4,517,500.00 L) Station Details
Storm Details
Catchment Area
27.80 ha
Total Precipitation
16.25 mm (4,517,500.00 L)
Duration of Storm
4.50 hr
Time of Concentration (Tc) 1
35 min
Peak Precipitation Intensity Over Tc 2
7.70 mm/hr
Return Period over Tc 3
< 2 Yr
Measured Flow
I/I Flow
Time of Peak Measured Flow
Apr 17, 2023 11:50
Time of Peak I/I Flow (TD)
Apr 17, 2023 14:25
Estimated Dry Weather Flow at TD
1.74 L/s
Peak Measured Flow
3.92 L/s
Peak I/I Flow 4
2.18 L/s
Peak I/I Rate 5
0.08 L/s/ha
Peak Measured Depth
48.33 mm
Total I/I Flow Volume during event
41,969.00 L
Volumetric Coefficient (Cv%) 6
0.93%
Total Measured Flow Volume during Event
153,235.50 L
Peak I/I Coefficient 7
0.0037
Hourly Wet-Weather Peaking Factor 8
1.91
Instantaneous Wet-Weather Peaking Factor 9
2.11
1
Time of Concentration (Tc): The estimated time for the flow to travel from the furthest point in the upstream area to the point of monitoring, assume flow is travelling at 1.00 m/s Peak Precipitation Intensity Over Tc: The peak rainfall intensity for the duration of the storm with the time interval defined by time of concentration 3 Return Period over Tc: The estimated time to elapse before a storm of equal or greater intensity will likely occur again, based on design storm criteria 4 Peak I/I Flow: The greatest difference captured between measured flow and estimated dry weather flow, Peak I/I Flow = Maximum (Measured Flow – Estimated Dry Weather Flow) 5 Peak I/I Rate: A normalized peak I/I flow based on catchment area size, Peak I/I Rate = Peak I/I Flow / Catchment Area 6 Volumetric Coefficient (Cv%): The ratio of total I/I volume and total rainfall volume, Cv% = Total I/I Flow Volume / Total Precipitation Volume * 100% 7 Peak I/ I Coefficient: The ratio of peak I/I flow and peak rainfall intensity, Peak I/ I Coefficient = Peak I/I Flow / (Peak Rainfall Intensity over Tc * Catchment Area) 8 Hourly Wet‐Weather Peaking Factor: The ratio of peak hourly wet‐weather measured flow and average dry‐weather flow, Wet‐Weather Peaking Factor = Peak Hourly Wet‐Weather Measured Flow / Average Dry-Weather Flow 9 Instantaneous Wet‐Weather Peaking Factor: The ratio of peak wet‐weather measured flow and average dry‐weather flow, Wet‐Weather Peaking Factor = Peak Wet‐Weather Measured Flow / Average Dry-Weather Flow 2
580 Civica Infrastructure Inc. www.civi.ca
Civica Infrastructures Inc. Kawartha Lakes Flow Monitoring Report
Appendix - A June 03, 2024
I/I Analysis Graph Station: L5
581 Civica Infrastructure Inc. www.civi.ca
Civica Infrastructures Inc. Kawartha Lakes Flow Monitoring Report
Appendix - A June 03, 2024
Infiltration/Inflow Event Analysis Station: L5 Apr 30, 2023 00:40 – May 01, 2023 12:05, Total Precipitation: 22.00 mm (6,116,000.00 L) Station Details
Storm Details
Catchment Area
27.80 ha
Total Precipitation
22.00 mm (6,116,000.00 L)
Duration of Storm
11.42 hr
Time of Concentration (Tc) 1
35 min
Peak Precipitation Intensity Over Tc 2
6.40 mm/hr
Return Period over Tc 3
< 2 Yr
Measured Flow
I/I Flow
Time of Peak Measured Flow
Apr 30, 2023 20:50
Time of Peak I/I Flow (TD)
Apr 30, 2023 20:50
Estimated Dry Weather Flow at TD
1.85 L/s
Peak Measured Flow
4.62 L/s
Peak I/I Flow 4
2.77 L/s
Peak I/I Rate 5
0.10 L/s/ha
Peak Measured Depth
53.00 mm
Total I/I Flow Volume during event
108,203.00 L
Volumetric Coefficient (Cv%) 6
1.77%
Total Measured Flow Volume during Event
258,838.30 L
Peak I/I Coefficient 7
0.0056
Hourly Wet-Weather Peaking Factor 8
2.36
Instantaneous Wet-Weather Peaking Factor 9
2.59
1
Time of Concentration (Tc): The estimated time for the flow to travel from the furthest point in the upstream area to the point of monitoring, assume flow is travelling at 1.00 m/s Peak Precipitation Intensity Over Tc: The peak rainfall intensity for the duration of the storm with the time interval defined by time of concentration 3 Return Period over Tc: The estimated time to elapse before a storm of equal or greater intensity will likely occur again, based on design storm criteria 4 Peak I/I Flow: The greatest difference captured between measured flow and estimated dry weather flow, Peak I/I Flow = Maximum (Measured Flow – Estimated Dry Weather Flow) 5 Peak I/I Rate: A normalized peak I/I flow based on catchment area size, Peak I/I Rate = Peak I/I Flow / Catchment Area 6 Volumetric Coefficient (Cv%): The ratio of total I/I volume and total rainfall volume, Cv% = Total I/I Flow Volume / Total Precipitation Volume * 100% 7 Peak I/ I Coefficient: The ratio of peak I/I flow and peak rainfall intensity, Peak I/ I Coefficient = Peak I/I Flow / (Peak Rainfall Intensity over Tc * Catchment Area) 8 Hourly Wet‐Weather Peaking Factor: The ratio of peak hourly wet‐weather measured flow and average dry‐weather flow, Wet‐Weather Peaking Factor = Peak Hourly Wet‐Weather Measured Flow / Average Dry-Weather Flow 9 Instantaneous Wet‐Weather Peaking Factor: The ratio of peak wet‐weather measured flow and average dry‐weather flow, Wet‐Weather Peaking Factor = Peak Wet‐Weather Measured Flow / Average Dry-Weather Flow 2
582 Civica Infrastructure Inc. www.civi.ca
Civica Infrastructures Inc. Kawartha Lakes Flow Monitoring Report
Appendix - A June 03, 2024
I/I Analysis Graph Station: L5
583 Civica Infrastructure Inc. www.civi.ca
Civica Infrastructures Inc. Kawartha Lakes Flow Monitoring Report
Appendix - A June 03, 2024
Infiltration/Inflow Event Analysis Station: L5 May 19, 2023 08:30 – May 21, 2023 03:15, Total Precipitation: 42.00 mm (11,676,000.00 L) Station Details
Storm Details
Catchment Area
27.80 ha
Total Precipitation
42.00 mm (11,676,000.00 L)
Duration of Storm
18.75 hr
Time of Concentration (Tc) 1
35 min
Peak Precipitation Intensity Over Tc 2
10.30 mm/hr
Return Period over Tc 3
< 2 Yr
Measured Flow
I/I Flow
Time of Peak Measured Flow
May 20, 2023 07:35
Time of Peak I/I Flow (TD)
May 20, 2023 07:35
Estimated Dry Weather Flow at TD
2.20 L/s
Peak Measured Flow
6.22 L/s
Peak I/I Flow 4
4.02 L/s
Peak I/I Rate 5
0.14 L/s/ha
Peak Measured Depth
54.00 mm
Total I/I Flow Volume during event
92,701.10 L
Volumetric Coefficient (Cv%) 6
0.79%
Total Measured Flow Volume during Event
270,598.80 L
Peak I/I Coefficient 7
0.0051
Hourly Wet-Weather Peaking Factor 8
2.83
Instantaneous Wet-Weather Peaking Factor 9
3.88
1
Time of Concentration (Tc): The estimated time for the flow to travel from the furthest point in the upstream area to the point of monitoring, assume flow is travelling at 1.00 m/s Peak Precipitation Intensity Over Tc: The peak rainfall intensity for the duration of the storm with the time interval defined by time of concentration 3 Return Period over Tc: The estimated time to elapse before a storm of equal or greater intensity will likely occur again, based on design storm criteria 4 Peak I/I Flow: The greatest difference captured between measured flow and estimated dry weather flow, Peak I/I Flow = Maximum (Measured Flow – Estimated Dry Weather Flow) 5 Peak I/I Rate: A normalized peak I/I flow based on catchment area size, Peak I/I Rate = Peak I/I Flow / Catchment Area 6 Volumetric Coefficient (Cv%): The ratio of total I/I volume and total rainfall volume, Cv% = Total I/I Flow Volume / Total Precipitation Volume * 100% 7 Peak I/ I Coefficient: The ratio of peak I/I flow and peak rainfall intensity, Peak I/ I Coefficient = Peak I/I Flow / (Peak Rainfall Intensity over Tc * Catchment Area) 8 Hourly Wet‐Weather Peaking Factor: The ratio of peak hourly wet‐weather measured flow and average dry‐weather flow, Wet‐Weather Peaking Factor = Peak Hourly Wet‐Weather Measured Flow / Average Dry-Weather Flow 9 Instantaneous Wet‐Weather Peaking Factor: The ratio of peak wet‐weather measured flow and average dry‐weather flow, Wet‐Weather Peaking Factor = Peak Wet‐Weather Measured Flow / Average Dry-Weather Flow 2
584 Civica Infrastructure Inc. www.civi.ca
Civica Infrastructures Inc. Kawartha Lakes Flow Monitoring Report
Appendix - A June 03, 2024
I/I Analysis Graph Station: L5
585 Civica Infrastructure Inc. www.civi.ca
Civica Infrastructures Inc. Kawartha Lakes Flow Monitoring Report
Appendix - A June 03, 2024
Infiltration/Inflow Event Analysis Station: L5 Jun 11, 2023 07:45 – Jun 13, 2023 09:00, Total Precipitation: 48.50 mm (13,483,000.00 L) Station Details
Storm Details
Catchment Area
27.80 ha
Total Precipitation
48.50 mm (13,483,000.00 L)
Duration of Storm
25.25 hr
Time of Concentration (Tc) 1
35 min
Peak Precipitation Intensity Over Tc 2
8.60 mm/hr
Return Period over Tc 3
< 2 Yr
Measured Flow
I/I Flow
Time of Peak Measured Flow
Jun 12, 2023 13:40
Time of Peak I/I Flow (TD)
Jun 12, 2023 13:40
Estimated Dry Weather Flow at TD
1.56 L/s
Peak Measured Flow
4.87 L/s
Peak I/I Flow 4
3.31 L/s
Peak I/I Rate 5
0.12 L/s/ha
Peak Measured Depth
55.33 mm
Total I/I Flow Volume during event
108,187.60 L
Volumetric Coefficient (Cv%) 6
0.80%
Total Measured Flow Volume during Event
305,459.40 L
Peak I/I Coefficient 7
0.0050
Hourly Wet-Weather Peaking Factor 8
2.91
Instantaneous Wet-Weather Peaking Factor 9
3.32
1
Time of Concentration (Tc): The estimated time for the flow to travel from the furthest point in the upstream area to the point of monitoring, assume flow is travelling at 1.00 m/s Peak Precipitation Intensity Over Tc: The peak rainfall intensity for the duration of the storm with the time interval defined by time of concentration 3 Return Period over Tc: The estimated time to elapse before a storm of equal or greater intensity will likely occur again, based on design storm criteria 4 Peak I/I Flow: The greatest difference captured between measured flow and estimated dry weather flow, Peak I/I Flow = Maximum (Measured Flow – Estimated Dry Weather Flow) 5 Peak I/I Rate: A normalized peak I/I flow based on catchment area size, Peak I/I Rate = Peak I/I Flow / Catchment Area 6 Volumetric Coefficient (Cv%): The ratio of total I/I volume and total rainfall volume, Cv% = Total I/I Flow Volume / Total Precipitation Volume * 100% 7 Peak I/ I Coefficient: The ratio of peak I/I flow and peak rainfall intensity, Peak I/ I Coefficient = Peak I/I Flow / (Peak Rainfall Intensity over Tc * Catchment Area) 8 Hourly Wet‐Weather Peaking Factor: The ratio of peak hourly wet‐weather measured flow and average dry‐weather flow, Wet‐Weather Peaking Factor = Peak Hourly Wet‐Weather Measured Flow / Average Dry-Weather Flow 9 Instantaneous Wet‐Weather Peaking Factor: The ratio of peak wet‐weather measured flow and average dry‐weather flow, Wet‐Weather Peaking Factor = Peak Wet‐Weather Measured Flow / Average Dry-Weather Flow 2
586 Civica Infrastructure Inc. www.civi.ca
Civica Infrastructures Inc. Kawartha Lakes Flow Monitoring Report
Appendix - A June 03, 2024
I/I Analysis Graph Station: L5
587 Civica Infrastructure Inc. www.civi.ca
Civica Infrastructures Inc. Kawartha Lakes Flow Monitoring Report
Appendix - A June 03, 2024
Infiltration/Inflow Event Analysis Station: L5 Jun 22, 2023 17:40 – Jun 25, 2023 01:45, Total Precipitation: 19.75 mm (5,490,500.00 L) Station Details
Storm Details
Catchment Area
27.80 ha
Total Precipitation
19.75 mm (5,490,500.00 L)
Duration of Storm
32.08 hr
Time of Concentration (Tc) 1
35 min
Peak Precipitation Intensity Over Tc 2
19.30 mm/hr
Return Period over Tc 3
< 2 Yr
Measured Flow
I/I Flow
Time of Peak Measured Flow
Jun 23, 2023 06:35
Time of Peak I/I Flow (TD)
Jun 24, 2023 15:55
Estimated Dry Weather Flow at TD
1.70 L/s
Peak Measured Flow
3.26 L/s
Peak I/I Flow 4
1.56 L/s
Peak I/I Rate 5
0.06 L/s/ha
Peak Measured Depth
45.67 mm
Total I/I Flow Volume during event
62,983.40 L
Volumetric Coefficient (Cv%) 6
1.15%
Total Measured Flow Volume during Event
362,702.40 L
Peak I/I Coefficient 7
0.0010
Hourly Wet-Weather Peaking Factor 8
1.62
Instantaneous Wet-Weather Peaking Factor 9
1.73
1
Time of Concentration (Tc): The estimated time for the flow to travel from the furthest point in the upstream area to the point of monitoring, assume flow is travelling at 1.00 m/s Peak Precipitation Intensity Over Tc: The peak rainfall intensity for the duration of the storm with the time interval defined by time of concentration 3 Return Period over Tc: The estimated time to elapse before a storm of equal or greater intensity will likely occur again, based on design storm criteria 4 Peak I/I Flow: The greatest difference captured between measured flow and estimated dry weather flow, Peak I/I Flow = Maximum (Measured Flow – Estimated Dry Weather Flow) 5 Peak I/I Rate: A normalized peak I/I flow based on catchment area size, Peak I/I Rate = Peak I/I Flow / Catchment Area 6 Volumetric Coefficient (Cv%): The ratio of total I/I volume and total rainfall volume, Cv% = Total I/I Flow Volume / Total Precipitation Volume * 100% 7 Peak I/ I Coefficient: The ratio of peak I/I flow and peak rainfall intensity, Peak I/ I Coefficient = Peak I/I Flow / (Peak Rainfall Intensity over Tc * Catchment Area) 8 Hourly Wet‐Weather Peaking Factor: The ratio of peak hourly wet‐weather measured flow and average dry‐weather flow, Wet‐Weather Peaking Factor = Peak Hourly Wet‐Weather Measured Flow / Average Dry-Weather Flow 9 Instantaneous Wet‐Weather Peaking Factor: The ratio of peak wet‐weather measured flow and average dry‐weather flow, Wet‐Weather Peaking Factor = Peak Wet‐Weather Measured Flow / Average Dry-Weather Flow 2
588 Civica Infrastructure Inc. www.civi.ca
Civica Infrastructures Inc. Kawartha Lakes Flow Monitoring Report
Appendix - A June 03, 2024
I/I Analysis Graph Station: L5
589 Civica Infrastructure Inc. www.civi.ca
Civica Infrastructures Inc. Kawartha Lakes Flow Monitoring Report
Appendix - A June 03, 2024
Infiltration/Inflow Event Analysis Station: L5 Jun 26, 2023 20:55 – Jun 28, 2023 02:40, Total Precipitation: 30.50 mm (8,479,000.00 L) Station Details
Storm Details
Catchment Area
27.80 ha
Total Precipitation
30.50 mm (8,479,000.00 L)
Duration of Storm
5.75 hr
Time of Concentration (Tc) 1
35 min
Peak Precipitation Intensity Over Tc 2
14.10 mm/hr
Return Period over Tc 3
< 2 Yr
Measured Flow
I/I Flow
Time of Peak Measured Flow
Jun 27, 2023 13:20
Time of Peak I/I Flow (TD)
Jun 27, 2023 14:00
Estimated Dry Weather Flow at TD
1.84 L/s
Peak Measured Flow
10.88 L/s
Peak I/I Flow 4
8.71 L/s
Peak I/I Rate 5
0.31 L/s/ha
Peak Measured Depth
95.00 mm
Total I/I Flow Volume during event
171,557.40 L
Volumetric Coefficient (Cv%) 6
2.02%
Total Measured Flow Volume during Event
303,171.50 L
Peak I/I Coefficient 7
0.0080
Hourly Wet-Weather Peaking Factor 8
4.94
Instantaneous Wet-Weather Peaking Factor 9
5.31
1
Time of Concentration (Tc): The estimated time for the flow to travel from the furthest point in the upstream area to the point of monitoring, assume flow is travelling at 1.00 m/s Peak Precipitation Intensity Over Tc: The peak rainfall intensity for the duration of the storm with the time interval defined by time of concentration 3 Return Period over Tc: The estimated time to elapse before a storm of equal or greater intensity will likely occur again, based on design storm criteria 4 Peak I/I Flow: The greatest difference captured between measured flow and estimated dry weather flow, Peak I/I Flow = Maximum (Measured Flow – Estimated Dry Weather Flow) 5 Peak I/I Rate: A normalized peak I/I flow based on catchment area size, Peak I/I Rate = Peak I/I Flow / Catchment Area 6 Volumetric Coefficient (Cv%): The ratio of total I/I volume and total rainfall volume, Cv% = Total I/I Flow Volume / Total Precipitation Volume * 100% 7 Peak I/ I Coefficient: The ratio of peak I/I flow and peak rainfall intensity, Peak I/ I Coefficient = Peak I/I Flow / (Peak Rainfall Intensity over Tc * Catchment Area) 8 Hourly Wet‐Weather Peaking Factor: The ratio of peak hourly wet‐weather measured flow and average dry‐weather flow, Wet‐Weather Peaking Factor = Peak Hourly Wet‐Weather Measured Flow / Average Dry-Weather Flow 9 Instantaneous Wet‐Weather Peaking Factor: The ratio of peak wet‐weather measured flow and average dry‐weather flow, Wet‐Weather Peaking Factor = Peak Wet‐Weather Measured Flow / Average Dry-Weather Flow 2
590 Civica Infrastructure Inc. www.civi.ca
Civica Infrastructures Inc. Kawartha Lakes Flow Monitoring Report
Appendix - A June 03, 2024
I/I Analysis Graph Station: L5
591 Civica Infrastructure Inc. www.civi.ca
Civica Infrastructures Inc. Kawartha Lakes Flow Monitoring Report
Appendix - A June 03, 2024
Infiltration/Inflow Event Analysis Station: L5 Jul 12, 2023 14:45 – Jul 13, 2023 18:50, Total Precipitation: 15.00 mm (4,170,000.00 L) Station Details
Storm Details
Catchment Area
27.80 ha
Total Precipitation
15.00 mm (4,170,000.00 L)
Duration of Storm
4.08 hr
Time of Concentration (Tc) 1
35 min
Peak Precipitation Intensity Over Tc 2
8.10 mm/hr
Return Period over Tc 3
< 2 Yr
Measured Flow
I/I Flow
Time of Peak Measured Flow
Jul 13, 2023 08:25
Time of Peak I/I Flow (TD)
Jul 13, 2023 08:25
Estimated Dry Weather Flow at TD
2.48 L/s
Peak Measured Flow
4.85 L/s
Peak I/I Flow 4
2.38 L/s
Peak I/I Rate 5
0.09 L/s/ha
Peak Measured Depth
53.00 mm
Total I/I Flow Volume during event
37,327.50 L
Volumetric Coefficient (Cv%) 6
0.90%
Total Measured Flow Volume during Event
153,165.60 L
Peak I/I Coefficient 7
0.0038
Hourly Wet-Weather Peaking Factor 8
1.95
Instantaneous Wet-Weather Peaking Factor 9
2.44
1
Time of Concentration (Tc): The estimated time for the flow to travel from the furthest point in the upstream area to the point of monitoring, assume flow is travelling at 1.00 m/s Peak Precipitation Intensity Over Tc: The peak rainfall intensity for the duration of the storm with the time interval defined by time of concentration 3 Return Period over Tc: The estimated time to elapse before a storm of equal or greater intensity will likely occur again, based on design storm criteria 4 Peak I/I Flow: The greatest difference captured between measured flow and estimated dry weather flow, Peak I/I Flow = Maximum (Measured Flow – Estimated Dry Weather Flow) 5 Peak I/I Rate: A normalized peak I/I flow based on catchment area size, Peak I/I Rate = Peak I/I Flow / Catchment Area 6 Volumetric Coefficient (Cv%): The ratio of total I/I volume and total rainfall volume, Cv% = Total I/I Flow Volume / Total Precipitation Volume * 100% 7 Peak I/ I Coefficient: The ratio of peak I/I flow and peak rainfall intensity, Peak I/ I Coefficient = Peak I/I Flow / (Peak Rainfall Intensity over Tc * Catchment Area) 8 Hourly Wet‐Weather Peaking Factor: The ratio of peak hourly wet‐weather measured flow and average dry‐weather flow, Wet‐Weather Peaking Factor = Peak Hourly Wet‐Weather Measured Flow / Average Dry-Weather Flow 9 Instantaneous Wet‐Weather Peaking Factor: The ratio of peak wet‐weather measured flow and average dry‐weather flow, Wet‐Weather Peaking Factor = Peak Wet‐Weather Measured Flow / Average Dry-Weather Flow 2
592 Civica Infrastructure Inc. www.civi.ca
Civica Infrastructures Inc. Kawartha Lakes Flow Monitoring Report
Appendix - A June 03, 2024
I/I Analysis Graph Station: L5
593 Civica Infrastructure Inc. www.civi.ca
Civica Infrastructures Inc. Kawartha Lakes Flow Monitoring Report
Appendix - A June 03, 2024
Infiltration/Inflow Event Analysis Station: L5 Jul 14, 2023 23:20 – Jul 16, 2023 18:00, Total Precipitation: 16.25 mm (4,517,500.00 L) Station Details
Storm Details
Catchment Area
27.80 ha
Total Precipitation
16.25 mm (4,517,500.00 L)
Duration of Storm
18.67 hr
Time of Concentration (Tc) 1
35 min
Peak Precipitation Intensity Over Tc 2
17.60 mm/hr
Return Period over Tc 3
< 2 Yr
Measured Flow
I/I Flow
Time of Peak Measured Flow
Jul 15, 2023 10:20
Time of Peak I/I Flow (TD)
Jul 16, 2023 17:05
Estimated Dry Weather Flow at TD
1.84 L/s
Peak Measured Flow
3.26 L/s
Peak I/I Flow 4
1.18 L/s
Peak I/I Rate 5
0.04 L/s/ha
Peak Measured Depth
45.00 mm
Total I/I Flow Volume during event
17,455.80 L
Volumetric Coefficient (Cv%) 6
0.39%
Total Measured Flow Volume during Event
215,156.80 L
Peak I/I Coefficient 7
0.0009
Hourly Wet-Weather Peaking Factor 8
1.54
Instantaneous Wet-Weather Peaking Factor 9
1.82
1
Time of Concentration (Tc): The estimated time for the flow to travel from the furthest point in the upstream area to the point of monitoring, assume flow is travelling at 1.00 m/s Peak Precipitation Intensity Over Tc: The peak rainfall intensity for the duration of the storm with the time interval defined by time of concentration 3 Return Period over Tc: The estimated time to elapse before a storm of equal or greater intensity will likely occur again, based on design storm criteria 4 Peak I/I Flow: The greatest difference captured between measured flow and estimated dry weather flow, Peak I/I Flow = Maximum (Measured Flow – Estimated Dry Weather Flow) 5 Peak I/I Rate: A normalized peak I/I flow based on catchment area size, Peak I/I Rate = Peak I/I Flow / Catchment Area 6 Volumetric Coefficient (Cv%): The ratio of total I/I volume and total rainfall volume, Cv% = Total I/I Flow Volume / Total Precipitation Volume * 100% 7 Peak I/ I Coefficient: The ratio of peak I/I flow and peak rainfall intensity, Peak I/ I Coefficient = Peak I/I Flow / (Peak Rainfall Intensity over Tc * Catchment Area) 8 Hourly Wet‐Weather Peaking Factor: The ratio of peak hourly wet‐weather measured flow and average dry‐weather flow, Wet‐Weather Peaking Factor = Peak Hourly Wet‐Weather Measured Flow / Average Dry-Weather Flow 9 Instantaneous Wet‐Weather Peaking Factor: The ratio of peak wet‐weather measured flow and average dry‐weather flow, Wet‐Weather Peaking Factor = Peak Wet‐Weather Measured Flow / Average Dry-Weather Flow 2
594 Civica Infrastructure Inc. www.civi.ca
Civica Infrastructures Inc. Kawartha Lakes Flow Monitoring Report
Appendix - A June 03, 2024
I/I Analysis Graph Station: L5
595 Civica Infrastructure Inc. www.civi.ca
Civica Infrastructures Inc. Kawartha Lakes Flow Monitoring Report
Appendix - A June 03, 2024
Infiltration/Inflow Event Analysis Station: L5 Jul 20, 2023 07:10 – Jul 21, 2023 09:10, Total Precipitation: 19.75 mm (5,490,500.00 L) Station Details
Storm Details
Catchment Area
27.80 ha
Total Precipitation
19.75 mm (5,490,500.00 L)
Duration of Storm
2.00 hr
Time of Concentration (Tc) 1
35 min
Peak Precipitation Intensity Over Tc 2
26.10 mm/hr
Return Period over Tc 3
< 2 Yr
Measured Flow
I/I Flow
Time of Peak Measured Flow
Jul 20, 2023 21:10
Time of Peak I/I Flow (TD)
Jul 20, 2023 21:10
Estimated Dry Weather Flow at TD
1.82 L/s
Peak Measured Flow
4.85 L/s
Peak I/I Flow 4
3.04 L/s
Peak I/I Rate 5
0.11 L/s/ha
Peak Measured Depth
51.00 mm
Total I/I Flow Volume during event
60,217.80 L
Volumetric Coefficient (Cv%) 6
1.10%
Total Measured Flow Volume during Event
140,347.40 L
Peak I/I Coefficient 7
0.0015
Hourly Wet-Weather Peaking Factor 8
2.81
Instantaneous Wet-Weather Peaking Factor 9
3.07
1
Time of Concentration (Tc): The estimated time for the flow to travel from the furthest point in the upstream area to the point of monitoring, assume flow is travelling at 1.00 m/s Peak Precipitation Intensity Over Tc: The peak rainfall intensity for the duration of the storm with the time interval defined by time of concentration 3 Return Period over Tc: The estimated time to elapse before a storm of equal or greater intensity will likely occur again, based on design storm criteria 4 Peak I/I Flow: The greatest difference captured between measured flow and estimated dry weather flow, Peak I/I Flow = Maximum (Measured Flow – Estimated Dry Weather Flow) 5 Peak I/I Rate: A normalized peak I/I flow based on catchment area size, Peak I/I Rate = Peak I/I Flow / Catchment Area 6 Volumetric Coefficient (Cv%): The ratio of total I/I volume and total rainfall volume, Cv% = Total I/I Flow Volume / Total Precipitation Volume * 100% 7 Peak I/ I Coefficient: The ratio of peak I/I flow and peak rainfall intensity, Peak I/ I Coefficient = Peak I/I Flow / (Peak Rainfall Intensity over Tc * Catchment Area) 8 Hourly Wet‐Weather Peaking Factor: The ratio of peak hourly wet‐weather measured flow and average dry‐weather flow, Wet‐Weather Peaking Factor = Peak Hourly Wet‐Weather Measured Flow / Average Dry-Weather Flow 9 Instantaneous Wet‐Weather Peaking Factor: The ratio of peak wet‐weather measured flow and average dry‐weather flow, Wet‐Weather Peaking Factor = Peak Wet‐Weather Measured Flow / Average Dry-Weather Flow 2
596 Civica Infrastructure Inc. www.civi.ca
Civica Infrastructures Inc. Kawartha Lakes Flow Monitoring Report
Appendix - A June 03, 2024
I/I Analysis Graph Station: L5
597 Civica Infrastructure Inc. www.civi.ca
Civica Infrastructures Inc. Kawartha Lakes Flow Monitoring Report
Appendix - A June 03, 2024
Infiltration/Inflow Event Analysis Station: L5 Aug 03, 2023 04:10 – Aug 04, 2023 15:25, Total Precipitation: 39.25 mm (10,911,500.00 L) Station Details
Storm Details
Catchment Area
27.80 ha
Total Precipitation
39.25 mm (10,911,500.00 L)
Duration of Storm
11.25 hr
Time of Concentration (Tc) 1
35 min
Peak Precipitation Intensity Over Tc 2
49.30 mm/hr
Return Period over Tc 3
2 - 5 Yr
Measured Flow
I/I Flow
Time of Peak Measured Flow
Aug 03, 2023 16:35
Time of Peak I/I Flow (TD)
Aug 03, 2023 16:35
Estimated Dry Weather Flow at TD
1.89 L/s
Peak Measured Flow
21.45 L/s
Peak I/I Flow 4
19.56 L/s
Peak I/I Rate 5
0.70 L/s/ha
Peak Measured Depth
124.00 mm
Total I/I Flow Volume during event
187,771.60 L
Volumetric Coefficient (Cv%) 6
1.72%
Total Measured Flow Volume during Event
322,035.60 L
Peak I/I Coefficient 7
0.0051
Hourly Wet-Weather Peaking Factor 8
7.45
Instantaneous Wet-Weather Peaking Factor 9
13.42
1
Time of Concentration (Tc): The estimated time for the flow to travel from the furthest point in the upstream area to the point of monitoring, assume flow is travelling at 1.00 m/s Peak Precipitation Intensity Over Tc: The peak rainfall intensity for the duration of the storm with the time interval defined by time of concentration 3 Return Period over Tc: The estimated time to elapse before a storm of equal or greater intensity will likely occur again, based on design storm criteria 4 Peak I/I Flow: The greatest difference captured between measured flow and estimated dry weather flow, Peak I/I Flow = Maximum (Measured Flow – Estimated Dry Weather Flow) 5 Peak I/I Rate: A normalized peak I/I flow based on catchment area size, Peak I/I Rate = Peak I/I Flow / Catchment Area 6 Volumetric Coefficient (Cv%): The ratio of total I/I volume and total rainfall volume, Cv% = Total I/I Flow Volume / Total Precipitation Volume * 100% 7 Peak I/ I Coefficient: The ratio of peak I/I flow and peak rainfall intensity, Peak I/ I Coefficient = Peak I/I Flow / (Peak Rainfall Intensity over Tc * Catchment Area) 8 Hourly Wet‐Weather Peaking Factor: The ratio of peak hourly wet‐weather measured flow and average dry‐weather flow, Wet‐Weather Peaking Factor = Peak Hourly Wet‐Weather Measured Flow / Average Dry-Weather Flow 9 Instantaneous Wet‐Weather Peaking Factor: The ratio of peak wet‐weather measured flow and average dry‐weather flow, Wet‐Weather Peaking Factor = Peak Wet‐Weather Measured Flow / Average Dry-Weather Flow 2
598 Civica Infrastructure Inc. www.civi.ca
Civica Infrastructures Inc. Kawartha Lakes Flow Monitoring Report
Appendix - A June 03, 2024
I/I Analysis Graph Station: L5
599 Civica Infrastructure Inc. www.civi.ca
Civica Infrastructures Inc. Kawartha Lakes Flow Monitoring Report
Appendix - A June 03, 2024
Infiltration/Inflow Event Analysis Station: L5 Aug 17, 2023 10:30 – Aug 19, 2023 08:20, Total Precipitation: 19.75 mm (5,490,500.00 L) Station Details
Storm Details
Catchment Area
27.80 ha
Total Precipitation
19.75 mm (5,490,500.00 L)
Duration of Storm
21.83 hr
Time of Concentration (Tc) 1
35 min
Peak Precipitation Intensity Over Tc 2
15.00 mm/hr
Return Period over Tc 3
< 2 Yr
Measured Flow
I/I Flow
Time of Peak Measured Flow
Aug 18, 2023 13:35
Time of Peak I/I Flow (TD)
Aug 18, 2023 13:35
Estimated Dry Weather Flow at TD
1.75 L/s
Peak Measured Flow
4.10 L/s
Peak I/I Flow 4
2.35 L/s
Peak I/I Rate 5
0.08 L/s/ha
Peak Measured Depth
48.33 mm
Total I/I Flow Volume during event
85,724.30 L
Volumetric Coefficient (Cv%) 6
1.56%
Total Measured Flow Volume during Event
264,435.90 L
Peak I/I Coefficient 7
0.0020
Hourly Wet-Weather Peaking Factor 8
2.52
Instantaneous Wet-Weather Peaking Factor 9
2.80
1
Time of Concentration (Tc): The estimated time for the flow to travel from the furthest point in the upstream area to the point of monitoring, assume flow is travelling at 1.00 m/s Peak Precipitation Intensity Over Tc: The peak rainfall intensity for the duration of the storm with the time interval defined by time of concentration 3 Return Period over Tc: The estimated time to elapse before a storm of equal or greater intensity will likely occur again, based on design storm criteria 4 Peak I/I Flow: The greatest difference captured between measured flow and estimated dry weather flow, Peak I/I Flow = Maximum (Measured Flow – Estimated Dry Weather Flow) 5 Peak I/I Rate: A normalized peak I/I flow based on catchment area size, Peak I/I Rate = Peak I/I Flow / Catchment Area 6 Volumetric Coefficient (Cv%): The ratio of total I/I volume and total rainfall volume, Cv% = Total I/I Flow Volume / Total Precipitation Volume * 100% 7 Peak I/ I Coefficient: The ratio of peak I/I flow and peak rainfall intensity, Peak I/ I Coefficient = Peak I/I Flow / (Peak Rainfall Intensity over Tc * Catchment Area) 8 Hourly Wet‐Weather Peaking Factor: The ratio of peak hourly wet‐weather measured flow and average dry‐weather flow, Wet‐Weather Peaking Factor = Peak Hourly Wet‐Weather Measured Flow / Average Dry-Weather Flow 9 Instantaneous Wet‐Weather Peaking Factor: The ratio of peak wet‐weather measured flow and average dry‐weather flow, Wet‐Weather Peaking Factor = Peak Wet‐Weather Measured Flow / Average Dry-Weather Flow 2
600 Civica Infrastructure Inc. www.civi.ca
Civica Infrastructures Inc. Kawartha Lakes Flow Monitoring Report
Appendix - A June 03, 2024
I/I Analysis Graph Station: L5
601 Civica Infrastructure Inc. www.civi.ca
Civica Infrastructures Inc. Kawartha Lakes Flow Monitoring Report
Appendix - A June 03, 2024
Infiltration/Inflow Event Analysis Station: L5 Sep 07, 2023 03:10 – Sep 08, 2023 03:50, Total Precipitation: 24.50 mm (6,811,000.00 L) Station Details
Storm Details
Catchment Area
27.80 ha
Total Precipitation
24.50 mm (6,811,000.00 L)
Duration of Storm
0.67 hr
Time of Concentration (Tc) 1
35 min
Peak Precipitation Intensity Over Tc 2
40.70 mm/hr
Return Period over Tc 3
< 2 Yr
Measured Flow
I/I Flow
Time of Peak Measured Flow
Sep 07, 2023 15:45
Time of Peak I/I Flow (TD)
Sep 07, 2023 15:45
Estimated Dry Weather Flow at TD
1.23 L/s
Peak Measured Flow
6.11 L/s
Peak I/I Flow 4
4.88 L/s
Peak I/I Rate 5
0.18 L/s/ha
Peak Measured Depth
55.00 mm
Total I/I Flow Volume during event
17,645.40 L
Volumetric Coefficient (Cv%) 6
0.26%
Total Measured Flow Volume during Event
68,403.50 L
Peak I/I Coefficient 7
0.0016
Hourly Wet-Weather Peaking Factor 8
3.39
Instantaneous Wet-Weather Peaking Factor 9
5.52
1
Time of Concentration (Tc): The estimated time for the flow to travel from the furthest point in the upstream area to the point of monitoring, assume flow is travelling at 1.00 m/s Peak Precipitation Intensity Over Tc: The peak rainfall intensity for the duration of the storm with the time interval defined by time of concentration 3 Return Period over Tc: The estimated time to elapse before a storm of equal or greater intensity will likely occur again, based on design storm criteria 4 Peak I/I Flow: The greatest difference captured between measured flow and estimated dry weather flow, Peak I/I Flow = Maximum (Measured Flow – Estimated Dry Weather Flow) 5 Peak I/I Rate: A normalized peak I/I flow based on catchment area size, Peak I/I Rate = Peak I/I Flow / Catchment Area 6 Volumetric Coefficient (Cv%): The ratio of total I/I volume and total rainfall volume, Cv% = Total I/I Flow Volume / Total Precipitation Volume * 100% 7 Peak I/ I Coefficient: The ratio of peak I/I flow and peak rainfall intensity, Peak I/ I Coefficient = Peak I/I Flow / (Peak Rainfall Intensity over Tc * Catchment Area) 8 Hourly Wet‐Weather Peaking Factor: The ratio of peak hourly wet‐weather measured flow and average dry‐weather flow, Wet‐Weather Peaking Factor = Peak Hourly Wet‐Weather Measured Flow / Average Dry-Weather Flow 9 Instantaneous Wet‐Weather Peaking Factor: The ratio of peak wet‐weather measured flow and average dry‐weather flow, Wet‐Weather Peaking Factor = Peak Wet‐Weather Measured Flow / Average Dry-Weather Flow 2
602 Civica Infrastructure Inc. www.civi.ca
Civica Infrastructures Inc. Kawartha Lakes Flow Monitoring Report
Appendix - A June 03, 2024
Activity Log Station: L5 Date Time
Type
Purpose of Visit
Comment
Calibration Measurement
12-Jan-2023 08:57:00 AM
Installation Log
INSTALLATION
MEASUREMENTS TAKEN, PHOTOS TAKEN, LOGGER INSTALLED
Yes
CALIBRATION
DATA DOWNLOADED, TELEMETRY SENT ENTRY MADE PHOTOS/VIDEOS TAKEN, MEASUREMENTS TAKEN, SITE CALIBRATED
Yes
Yes
18-Jan-2023 04:06:00 PM
Maintenance Log
15-Mar-2023 01:06:00 PM
Maintenance Log
CALIBRATION
DATA DOWNLOADED, TELEMETRY SENT AND CHECKED, ENTRY MADE, SITE CALIBRATED, PHOTO AND VIDEO TAKEN DESICCANT CHANGED DEBRIS CLEARED CSO BRACKET SWAPPED
09-May-2023 12:25:00 PM
Maintenance Log
CALIBRATION
TC SET,SURVEY SENT,DOWNLOADED DATA, SENT TELEMETRY, MADE ENTRY, TOOK PHOTOS/VIDEOS, TOOK MEASUREMENTS,DEBRIS AND SILT CLEARED, CALIBRATED SITE,SITE CLEARED
Yes
Yes
21-Jun-2023 04:10:00 PM
Maintenance Log
CALIBRATION
DATA DOWNLOADED, TELEMETRY SENT NOT RECEIVED IN FZ ENTRY MADE PHOTOS/VIDEOS TAKEN, MEASUREMENTS TAKEN, SITE CALIBRATED
21-Jul-2023 12:08:00 PM
Maintenance Log
DATA DOWNLOAD
TC SET,SURVEY SENT,DATA DOWNLOADED,TELEMETRY SENT NOT REFLECTED IN FZ,SITE CLEARED
Yes
22-Aug-2023 10:10:00 AM
Maintenance Log
DATA DOWNLOAD
TC SET,DATA DOWNLOADED,TELEMETRY SENT NOT REFLECTED IN FZ,DESSICANT CHECKED,ANTENNA CHECKED,SITE CLEARED
Yes
REMOVAL
TRAFFIC CONTROL SENT, DATA DOWNLOADED, TELEMETRY UNABLE TO SENT, CALIBRATION DONE, BRACKET FOR LIDOTT WAS BROKEN, LIDOTT WAS NO LEVEL, BAD READINGS,VELOCITY READING WAS ZERO, EVEN CLEANING THE DEBRIS,EQUIPMENT REMOVED, LOGGER TAG, BUT NO SHUT DOWN,, PHOTOS AND VIDEOS BEFORE AND AFTER TAKEN.
Yes
03-Oct-2023 01:00:00 PM
Removal Log
603 Civica Infrastructure Inc. www.civi.ca
Civica Infrastructures Inc. Kawartha Lakes Flow Monitoring Report
Appendix - A June 03, 2024
Aggregate Data Station: L6
Precipitation Date From
Date To
Days
Min (mm)
Avg (mm)
Max (mm)
Sum (mm)
Count
Time of Min1
Time of Max1
Jan 10, 2023
Oct 03, 2023
267
0.00
0.01
15.75
655.50
76,782
Tue Jan 10, 2023 00:00
Thu Aug 03, 2023 16:20
Level Date From
Date To
Days
Min (m)
Avg (m)
Max (m)
Count
Time of Min1
Time of Max1
Jan 10, 2023
Oct 03, 2023
262
0.05
0.07
0.15
75,028
Wed Jan 25, 2023 05:25
Sat May 20, 2023 07:15
Velocity Date From
Date To
Days
Min (m/s)
Avg (m/s)
Max (m/s)
Count
Time of Min1
Time of Max1
Jan 10, 2023
Oct 03, 2023
262
0.02
0.16
0.59
75,028
Fri Sep 15, 2023 03:10
Sun May 07, 2023 18:30
Flow
1
Date From
Date To
Days
Min (L/s)
Avg (L/s)
Max (L/s)
Total Volume (1,000,000 L)
Count
Time of Min1
Time of Max1
Jan 10, 2023
Oct 03, 2023
262
0.10
1.20
8.20
26.94
75,028
Fri Sep 29, 2023 00:00
Sat Apr 01, 2023 05:40
Time of Min and Time of Max will be displayed by first occurrence
604 Civica Infrastructure Inc. www.civi.ca
Civica Infrastructures Inc. Kawartha Lakes Flow Monitoring Report
Appendix - A June 03, 2024
Data Chart Station: L6 Jan 10, 2023 – Jan 31, 2023
605 Civica Infrastructure Inc. www.civi.ca
Civica Infrastructures Inc. Kawartha Lakes Flow Monitoring Report
Appendix - A June 03, 2024
Data Chart Station: L6 Feb 01, 2023 – Feb 28, 2023
606 Civica Infrastructure Inc. www.civi.ca
Civica Infrastructures Inc. Kawartha Lakes Flow Monitoring Report
Appendix - A June 03, 2024
Data Chart Station: L6 Mar 01, 2023 – Mar 31, 2023
607 Civica Infrastructure Inc. www.civi.ca
Civica Infrastructures Inc. Kawartha Lakes Flow Monitoring Report
Appendix - A June 03, 2024
Data Chart Station: L6 Apr 01, 2023 – Apr 30, 2023
608 Civica Infrastructure Inc. www.civi.ca
Civica Infrastructures Inc. Kawartha Lakes Flow Monitoring Report
Appendix - A June 03, 2024
Data Chart Station: L6 May 01, 2023 – May 31, 2023
609 Civica Infrastructure Inc. www.civi.ca
Civica Infrastructures Inc. Kawartha Lakes Flow Monitoring Report
Appendix - A June 03, 2024
Data Chart Station: L6 Jun 01, 2023 – Jun 30, 2023
610 Civica Infrastructure Inc. www.civi.ca
Civica Infrastructures Inc. Kawartha Lakes Flow Monitoring Report
Appendix - A June 03, 2024
Data Chart Station: L6 Jul 01, 2023 – Jul 31, 2023
611 Civica Infrastructure Inc. www.civi.ca
Civica Infrastructures Inc. Kawartha Lakes Flow Monitoring Report
Appendix - A June 03, 2024
Data Chart Station: L6 Aug 01, 2023 – Aug 31, 2023
612 Civica Infrastructure Inc. www.civi.ca
Civica Infrastructures Inc. Kawartha Lakes Flow Monitoring Report
Appendix - A June 03, 2024
Data Chart Station: L6 Sep 01, 2023 – Sep 30, 2023
613 Civica Infrastructure Inc. www.civi.ca
Civica Infrastructures Inc. Kawartha Lakes Flow Monitoring Report
Appendix - A June 03, 2024
Data Chart Station: L6 Oct 01, 2023 – Oct 03, 2023
614 Civica Infrastructure Inc. www.civi.ca
Civica Infrastructures Inc. Kawartha Lakes Flow Monitoring Report
Appendix - A June 03, 2024
Sanitary Report Station: L6
1
Average Dry Weather Flow (L/s)
Average Dry Weather Flow (L/c/d)
Average Daily Minimum Dry Weather Flow (L/s)
Average Daily Peak Dry Weather Flow (L/s)
1.056
807.204
0.575
2.094
Peaking Factor
Groundwater Infiltration (L/s)1
Groundwater Infiltration (L/ha/d)
% of GWI in Average DWF
1.983
0.489
6,925.071
46.312
Groundwater infiltration (GWI) is assumed as 85% of the daily minimum flow averaged over the monitoring period
615 Civica Infrastructure Inc. www.civi.ca
Civica Infrastructures Inc. Kawartha Lakes Flow Monitoring Report
Appendix - A June 03, 2024
I/I Analysis Table
1 2
Event1
Total Precipitation (mm)
Duration (hours)
Peak Intensity Over Tc at Station (mm/hr)
Feb 09, 2023
35.75
21.58
Mar 16, 2023
19.00
Mar 31, 2023
L6 Measured Peak Flow (L/s)
Peak I/I Flow (L/s)
Peak I/I Rate (L/s/ha)
Volumetric Runoff Coefficient (CV%)
Peaking Factor (PF)
7.80
7.17
5.99
0.98
13.37 %
6.08
12.67
3.60
4.82
3.33
0.55
11.19 %
2.79
27.00
18.25
7.20
8.20
6.66
1.09
15.31 %
3.91
Apr 05, 2023
24.50
10.58
17.40
7.51
5.99
0.98
10.76 %
4.28
Apr 16, 2023
16.25
4.50
8.40
2.37
1.28
0.21
2.10 %
1.12
Apr 30, 2023
22.00
11.42
7.80
4.24
2.74
0.45
4.78 %
2.45
May 19, 2023
42.00
18.75
13.20
7.01
5.70
0.94
2.65 %
5.43
Jun 11, 2023
48.50
25.25
10.20
3.47
2.26
0.37
1.92 %
2.27
Jun 23, 2023
19.75
32.08
25.80
1.89
0.87
0.14
1.10 %
0.90
Jun 27, 2023
30.50
5.75
15.60
5.45
4.53
0.74
4.20 %
4.76
Jul 13, 2023
15.00
4.08
9.60
Jul 15, 2023
16.25
18.67
24.60
3.26
2.21
0.36
1.33 %
2.27
Jul 20, 2023
19.75
2.00
34.20
3.18
1.98
0.33
1.08 %
2.08
Aug 03, 2023
39.25
11.25
67.80
4.58
3.47
0.57
3.55 %
3.11
Aug 17, 2023
19.75
21.83
19.20
3.01
1.99
0.33
2.03 %
2.01
Sep 07, 2023
24.50
0.67
52.80
5.36
4.42
0.72
1.41 %
4.85
Average
26.23
13.71
20.33
4.77
3.56
0.58
5.12 %
3.22
Maximum
48.50
32.08
67.80
8.20
6.66
1.09
15.31 %
6.08
Flow KPIs
Measured Storms
Station: L6
N/A 2
An event is a storm with a minimum volume of 15mm and a minimum inter-event dry period of 12 hours I/I event analysis unable to be completed due to missing flow monitoring data during event
616 Civica Infrastructure Inc. www.civi.ca
Civica Infrastructures Inc. Kawartha Lakes Flow Monitoring Report
Appendix - A June 03, 2024
I/I Analysis Graph Station: L6
617 Civica Infrastructure Inc. www.civi.ca
Civica Infrastructures Inc. Kawartha Lakes Flow Monitoring Report
Appendix - A June 03, 2024
Infiltration/Inflow Event Analysis Station: L6 Feb 08, 2023 20:55 – Feb 10, 2023 18:30, Total Precipitation: 35.75 mm (2,180,750.00 L) Station Details
Storm Details
Catchment Area
6.10 ha
Total Precipitation
35.75 mm (2,180,750.00 L)
Duration of Storm
21.58 hr
Time of Concentration (Tc) 1
25 min
Peak Precipitation Intensity Over Tc 2
7.80 mm/hr
Return Period over Tc 3
< 2 Yr
Measured Flow
I/I Flow
Time of Peak Measured Flow
Feb 09, 2023 18:00
Time of Peak I/I Flow (TD)
Feb 09, 2023 18:00
Estimated Dry Weather Flow at TD
1.18 L/s
Peak Measured Flow
7.17 L/s
Peak I/I Flow 4
5.99 L/s
Peak I/I Rate 5
0.98 L/s/ha
Peak Measured Depth
119.92 mm
Total I/I Flow Volume during event
291,502.00 L
Volumetric Coefficient (Cv%) 6
13.37%
Total Measured Flow Volume during Event
410,877.70 L
Peak I/I Coefficient 7
0.0453
Hourly Wet-Weather Peaking Factor 8
5.53
Instantaneous Wet-Weather Peaking Factor 9
7.28
1
Time of Concentration (Tc): The estimated time for the flow to travel from the furthest point in the upstream area to the point of monitoring, assume flow is travelling at 1.00 m/s Peak Precipitation Intensity Over Tc: The peak rainfall intensity for the duration of the storm with the time interval defined by time of concentration 3 Return Period over Tc: The estimated time to elapse before a storm of equal or greater intensity will likely occur again, based on design storm criteria 4 Peak I/I Flow: The greatest difference captured between measured flow and estimated dry weather flow, Peak I/I Flow = Maximum (Measured Flow – Estimated Dry Weather Flow) 5 Peak I/I Rate: A normalized peak I/I flow based on catchment area size, Peak I/I Rate = Peak I/I Flow / Catchment Area 6 Volumetric Coefficient (Cv%): The ratio of total I/I volume and total rainfall volume, Cv% = Total I/I Flow Volume / Total Precipitation Volume * 100% 7 Peak I/ I Coefficient: The ratio of peak I/I flow and peak rainfall intensity, Peak I/ I Coefficient = Peak I/I Flow / (Peak Rainfall Intensity over Tc * Catchment Area) 8 Hourly Wet‐Weather Peaking Factor: The ratio of peak hourly wet‐weather measured flow and average dry‐weather flow, Wet‐Weather Peaking Factor = Peak Hourly Wet‐Weather Measured Flow / Average Dry-Weather Flow 9 Instantaneous Wet‐Weather Peaking Factor: The ratio of peak wet‐weather measured flow and average dry‐weather flow, Wet‐Weather Peaking Factor = Peak Wet‐Weather Measured Flow / Average Dry-Weather Flow 2
618 Civica Infrastructure Inc. www.civi.ca
Civica Infrastructures Inc. Kawartha Lakes Flow Monitoring Report
Appendix - A June 03, 2024
I/I Analysis Graph Station: L6
619 Civica Infrastructure Inc. www.civi.ca
Civica Infrastructures Inc. Kawartha Lakes Flow Monitoring Report
Appendix - A June 03, 2024
Infiltration/Inflow Event Analysis Station: L6 Mar 16, 2023 10:45 – Mar 17, 2023 23:25, Total Precipitation: 19.00 mm (1,159,000.00 L) Station Details
Storm Details
Catchment Area
6.10 ha
Total Precipitation
19.00 mm (1,159,000.00 L)
Duration of Storm
12.67 hr
Time of Concentration (Tc) 1
25 min
Peak Precipitation Intensity Over Tc 2
3.60 mm/hr
Return Period over Tc 3
< 2 Yr
Measured Flow
I/I Flow
Time of Peak Measured Flow
Mar 17, 2023 17:45
Time of Peak I/I Flow (TD)
Mar 17, 2023 17:45
Estimated Dry Weather Flow at TD
1.49 L/s
Peak Measured Flow
4.82 L/s
Peak I/I Flow 4
3.33 L/s
Peak I/I Rate 5
0.55 L/s/ha
Peak Measured Depth
107.51 mm
Total I/I Flow Volume during event
129,725.30 L
Volumetric Coefficient (Cv%) 6
11.19%
Total Measured Flow Volume during Event
236,200.50 L
Peak I/I Coefficient 7
0.0546
Hourly Wet-Weather Peaking Factor 8
3.48
Instantaneous Wet-Weather Peaking Factor 9
4.04
1
Time of Concentration (Tc): The estimated time for the flow to travel from the furthest point in the upstream area to the point of monitoring, assume flow is travelling at 1.00 m/s Peak Precipitation Intensity Over Tc: The peak rainfall intensity for the duration of the storm with the time interval defined by time of concentration 3 Return Period over Tc: The estimated time to elapse before a storm of equal or greater intensity will likely occur again, based on design storm criteria 4 Peak I/I Flow: The greatest difference captured between measured flow and estimated dry weather flow, Peak I/I Flow = Maximum (Measured Flow – Estimated Dry Weather Flow) 5 Peak I/I Rate: A normalized peak I/I flow based on catchment area size, Peak I/I Rate = Peak I/I Flow / Catchment Area 6 Volumetric Coefficient (Cv%): The ratio of total I/I volume and total rainfall volume, Cv% = Total I/I Flow Volume / Total Precipitation Volume * 100% 7 Peak I/ I Coefficient: The ratio of peak I/I flow and peak rainfall intensity, Peak I/ I Coefficient = Peak I/I Flow / (Peak Rainfall Intensity over Tc * Catchment Area) 8 Hourly Wet‐Weather Peaking Factor: The ratio of peak hourly wet‐weather measured flow and average dry‐weather flow, Wet‐Weather Peaking Factor = Peak Hourly Wet‐Weather Measured Flow / Average Dry-Weather Flow 9 Instantaneous Wet‐Weather Peaking Factor: The ratio of peak wet‐weather measured flow and average dry‐weather flow, Wet‐Weather Peaking Factor = Peak Wet‐Weather Measured Flow / Average Dry-Weather Flow 2
620 Civica Infrastructure Inc. www.civi.ca
Civica Infrastructures Inc. Kawartha Lakes Flow Monitoring Report
Appendix - A June 03, 2024
I/I Analysis Graph Station: L6
621 Civica Infrastructure Inc. www.civi.ca
Civica Infrastructures Inc. Kawartha Lakes Flow Monitoring Report
Appendix - A June 03, 2024
Infiltration/Inflow Event Analysis Station: L6 Mar 31, 2023 00:15 – Apr 01, 2023 18:30, Total Precipitation: 27.00 mm (1,647,000.00 L) Station Details
Storm Details
Catchment Area
6.10 ha
Total Precipitation
27.00 mm (1,647,000.00 L)
Duration of Storm
18.25 hr
Time of Concentration (Tc) 1
25 min
Peak Precipitation Intensity Over Tc 2
7.20 mm/hr
Return Period over Tc 3
< 2 Yr
Measured Flow
I/I Flow
Time of Peak Measured Flow
Apr 01, 2023 05:40
Time of Peak I/I Flow (TD)
Apr 01, 2023 05:40
Estimated Dry Weather Flow at TD
1.54 L/s
Peak Measured Flow
8.20 L/s
Peak I/I Flow 4
6.66 L/s
Peak I/I Rate 5
1.09 L/s/ha
Peak Measured Depth
125.72 mm
Total I/I Flow Volume during event
252,184.50 L
Volumetric Coefficient (Cv%) 6
15.31%
Total Measured Flow Volume during Event
438,147.30 L
Peak I/I Coefficient 7
0.0546
Hourly Wet-Weather Peaking Factor 8
4.25
Instantaneous Wet-Weather Peaking Factor 9
4.82
1
Time of Concentration (Tc): The estimated time for the flow to travel from the furthest point in the upstream area to the point of monitoring, assume flow is travelling at 1.00 m/s Peak Precipitation Intensity Over Tc: The peak rainfall intensity for the duration of the storm with the time interval defined by time of concentration 3 Return Period over Tc: The estimated time to elapse before a storm of equal or greater intensity will likely occur again, based on design storm criteria 4 Peak I/I Flow: The greatest difference captured between measured flow and estimated dry weather flow, Peak I/I Flow = Maximum (Measured Flow – Estimated Dry Weather Flow) 5 Peak I/I Rate: A normalized peak I/I flow based on catchment area size, Peak I/I Rate = Peak I/I Flow / Catchment Area 6 Volumetric Coefficient (Cv%): The ratio of total I/I volume and total rainfall volume, Cv% = Total I/I Flow Volume / Total Precipitation Volume * 100% 7 Peak I/ I Coefficient: The ratio of peak I/I flow and peak rainfall intensity, Peak I/ I Coefficient = Peak I/I Flow / (Peak Rainfall Intensity over Tc * Catchment Area) 8 Hourly Wet‐Weather Peaking Factor: The ratio of peak hourly wet‐weather measured flow and average dry‐weather flow, Wet‐Weather Peaking Factor = Peak Hourly Wet‐Weather Measured Flow / Average Dry-Weather Flow 9 Instantaneous Wet‐Weather Peaking Factor: The ratio of peak wet‐weather measured flow and average dry‐weather flow, Wet‐Weather Peaking Factor = Peak Wet‐Weather Measured Flow / Average Dry-Weather Flow 2
622 Civica Infrastructure Inc. www.civi.ca
Civica Infrastructures Inc. Kawartha Lakes Flow Monitoring Report
Appendix - A June 03, 2024
I/I Analysis Graph Station: L6
623 Civica Infrastructure Inc. www.civi.ca
Civica Infrastructures Inc. Kawartha Lakes Flow Monitoring Report
Appendix - A June 03, 2024
Infiltration/Inflow Event Analysis Station: L6 Apr 04, 2023 17:50 – Apr 06, 2023 04:25, Total Precipitation: 24.50 mm (1,494,500.00 L) Station Details
Storm Details
Catchment Area
6.10 ha
Total Precipitation
24.50 mm (1,494,500.00 L)
Duration of Storm
10.58 hr
Time of Concentration (Tc) 1
25 min
Peak Precipitation Intensity Over Tc 2
17.40 mm/hr
Return Period over Tc 3
< 2 Yr
Measured Flow
I/I Flow
Time of Peak Measured Flow
Apr 05, 2023 15:45
Time of Peak I/I Flow (TD)
Apr 05, 2023 15:45
Estimated Dry Weather Flow at TD
1.52 L/s
Peak Measured Flow
7.51 L/s
Peak I/I Flow 4
5.99 L/s
Peak I/I Rate 5
0.98 L/s/ha
Peak Measured Depth
121.76 mm
Total I/I Flow Volume during event
160,848.50 L
Volumetric Coefficient (Cv%) 6
10.76%
Total Measured Flow Volume during Event
275,067.70 L
Peak I/I Coefficient 7
0.0203
Hourly Wet-Weather Peaking Factor 8
4.95
Instantaneous Wet-Weather Peaking Factor 9
5.37
1
Time of Concentration (Tc): The estimated time for the flow to travel from the furthest point in the upstream area to the point of monitoring, assume flow is travelling at 1.00 m/s Peak Precipitation Intensity Over Tc: The peak rainfall intensity for the duration of the storm with the time interval defined by time of concentration 3 Return Period over Tc: The estimated time to elapse before a storm of equal or greater intensity will likely occur again, based on design storm criteria 4 Peak I/I Flow: The greatest difference captured between measured flow and estimated dry weather flow, Peak I/I Flow = Maximum (Measured Flow – Estimated Dry Weather Flow) 5 Peak I/I Rate: A normalized peak I/I flow based on catchment area size, Peak I/I Rate = Peak I/I Flow / Catchment Area 6 Volumetric Coefficient (Cv%): The ratio of total I/I volume and total rainfall volume, Cv% = Total I/I Flow Volume / Total Precipitation Volume * 100% 7 Peak I/ I Coefficient: The ratio of peak I/I flow and peak rainfall intensity, Peak I/ I Coefficient = Peak I/I Flow / (Peak Rainfall Intensity over Tc * Catchment Area) 8 Hourly Wet‐Weather Peaking Factor: The ratio of peak hourly wet‐weather measured flow and average dry‐weather flow, Wet‐Weather Peaking Factor = Peak Hourly Wet‐Weather Measured Flow / Average Dry-Weather Flow 9 Instantaneous Wet‐Weather Peaking Factor: The ratio of peak wet‐weather measured flow and average dry‐weather flow, Wet‐Weather Peaking Factor = Peak Wet‐Weather Measured Flow / Average Dry-Weather Flow 2
624 Civica Infrastructure Inc. www.civi.ca
Civica Infrastructures Inc. Kawartha Lakes Flow Monitoring Report
Appendix - A June 03, 2024
I/I Analysis Graph Station: L6
625 Civica Infrastructure Inc. www.civi.ca
Civica Infrastructures Inc. Kawartha Lakes Flow Monitoring Report
Appendix - A June 03, 2024
Infiltration/Inflow Event Analysis Station: L6 Apr 16, 2023 10:25 – Apr 17, 2023 14:55, Total Precipitation: 16.25 mm (991,250.00 L) Station Details
Storm Details
Catchment Area
6.10 ha
Total Precipitation
16.25 mm (991,250.00 L)
Duration of Storm
4.50 hr
Time of Concentration (Tc) 1
25 min
Peak Precipitation Intensity Over Tc 2
8.40 mm/hr
Return Period over Tc 3
< 2 Yr
Measured Flow
I/I Flow
Time of Peak Measured Flow
Apr 17, 2023 06:45
Time of Peak I/I Flow (TD)
Apr 17, 2023 01:30
Estimated Dry Weather Flow at TD
0.93 L/s
Peak Measured Flow
2.37 L/s
Peak I/I Flow 4
1.28 L/s
Peak I/I Rate 5
0.21 L/s/ha
Peak Measured Depth
86.08 mm
Total I/I Flow Volume during event
20,783.90 L
Volumetric Coefficient (Cv%) 6
2.10%
Total Measured Flow Volume during Event
88,940.00 L
Peak I/I Coefficient 7
0.0090
Hourly Wet-Weather Peaking Factor 8
1.78
Instantaneous Wet-Weather Peaking Factor 9
2.07
1
Time of Concentration (Tc): The estimated time for the flow to travel from the furthest point in the upstream area to the point of monitoring, assume flow is travelling at 1.00 m/s Peak Precipitation Intensity Over Tc: The peak rainfall intensity for the duration of the storm with the time interval defined by time of concentration 3 Return Period over Tc: The estimated time to elapse before a storm of equal or greater intensity will likely occur again, based on design storm criteria 4 Peak I/I Flow: The greatest difference captured between measured flow and estimated dry weather flow, Peak I/I Flow = Maximum (Measured Flow – Estimated Dry Weather Flow) 5 Peak I/I Rate: A normalized peak I/I flow based on catchment area size, Peak I/I Rate = Peak I/I Flow / Catchment Area 6 Volumetric Coefficient (Cv%): The ratio of total I/I volume and total rainfall volume, Cv% = Total I/I Flow Volume / Total Precipitation Volume * 100% 7 Peak I/ I Coefficient: The ratio of peak I/I flow and peak rainfall intensity, Peak I/ I Coefficient = Peak I/I Flow / (Peak Rainfall Intensity over Tc * Catchment Area) 8 Hourly Wet‐Weather Peaking Factor: The ratio of peak hourly wet‐weather measured flow and average dry‐weather flow, Wet‐Weather Peaking Factor = Peak Hourly Wet‐Weather Measured Flow / Average Dry-Weather Flow 9 Instantaneous Wet‐Weather Peaking Factor: The ratio of peak wet‐weather measured flow and average dry‐weather flow, Wet‐Weather Peaking Factor = Peak Wet‐Weather Measured Flow / Average Dry-Weather Flow 2
626 Civica Infrastructure Inc. www.civi.ca
Civica Infrastructures Inc. Kawartha Lakes Flow Monitoring Report
Appendix - A June 03, 2024
I/I Analysis Graph Station: L6
627 Civica Infrastructure Inc. www.civi.ca
Civica Infrastructures Inc. Kawartha Lakes Flow Monitoring Report
Appendix - A June 03, 2024
Infiltration/Inflow Event Analysis Station: L6 Apr 30, 2023 00:40 – May 01, 2023 12:05, Total Precipitation: 22.00 mm (1,342,000.00 L) Station Details
Storm Details
Catchment Area
6.10 ha
Total Precipitation
22.00 mm (1,342,000.00 L)
Duration of Storm
11.42 hr
Time of Concentration (Tc) 1
25 min
Peak Precipitation Intensity Over Tc 2
7.80 mm/hr
Return Period over Tc 3
< 2 Yr
Measured Flow
I/I Flow
Time of Peak Measured Flow
Apr 30, 2023 18:05
Time of Peak I/I Flow (TD)
Apr 30, 2023 18:05
Estimated Dry Weather Flow at TD
1.50 L/s
Peak Measured Flow
4.24 L/s
Peak I/I Flow 4
2.74 L/s
Peak I/I Rate 5
0.45 L/s/ha
Peak Measured Depth
102.78 mm
Total I/I Flow Volume during event
64,187.70 L
Volumetric Coefficient (Cv%) 6
4.78%
Total Measured Flow Volume during Event
158,842.30 L
Peak I/I Coefficient 7
0.0208
Hourly Wet-Weather Peaking Factor 8
3.07
Instantaneous Wet-Weather Peaking Factor 9
3.79
1
Time of Concentration (Tc): The estimated time for the flow to travel from the furthest point in the upstream area to the point of monitoring, assume flow is travelling at 1.00 m/s Peak Precipitation Intensity Over Tc: The peak rainfall intensity for the duration of the storm with the time interval defined by time of concentration 3 Return Period over Tc: The estimated time to elapse before a storm of equal or greater intensity will likely occur again, based on design storm criteria 4 Peak I/I Flow: The greatest difference captured between measured flow and estimated dry weather flow, Peak I/I Flow = Maximum (Measured Flow – Estimated Dry Weather Flow) 5 Peak I/I Rate: A normalized peak I/I flow based on catchment area size, Peak I/I Rate = Peak I/I Flow / Catchment Area 6 Volumetric Coefficient (Cv%): The ratio of total I/I volume and total rainfall volume, Cv% = Total I/I Flow Volume / Total Precipitation Volume * 100% 7 Peak I/ I Coefficient: The ratio of peak I/I flow and peak rainfall intensity, Peak I/ I Coefficient = Peak I/I Flow / (Peak Rainfall Intensity over Tc * Catchment Area) 8 Hourly Wet‐Weather Peaking Factor: The ratio of peak hourly wet‐weather measured flow and average dry‐weather flow, Wet‐Weather Peaking Factor = Peak Hourly Wet‐Weather Measured Flow / Average Dry-Weather Flow 9 Instantaneous Wet‐Weather Peaking Factor: The ratio of peak wet‐weather measured flow and average dry‐weather flow, Wet‐Weather Peaking Factor = Peak Wet‐Weather Measured Flow / Average Dry-Weather Flow 2
628 Civica Infrastructure Inc. www.civi.ca
Civica Infrastructures Inc. Kawartha Lakes Flow Monitoring Report
Appendix - A June 03, 2024
I/I Analysis Graph Station: L6
629 Civica Infrastructure Inc. www.civi.ca
Civica Infrastructures Inc. Kawartha Lakes Flow Monitoring Report
Appendix - A June 03, 2024
Infiltration/Inflow Event Analysis Station: L6 May 19, 2023 08:30 – May 21, 2023 03:15, Total Precipitation: 42.00 mm (2,562,000.00 L) Station Details
Storm Details
Catchment Area
6.10 ha
Total Precipitation
42.00 mm (2,562,000.00 L)
Duration of Storm
18.75 hr
Time of Concentration (Tc) 1
25 min
Peak Precipitation Intensity Over Tc 2
13.20 mm/hr
Return Period over Tc 3
< 2 Yr
Measured Flow
I/I Flow
Time of Peak Measured Flow
May 20, 2023 07:20
Time of Peak I/I Flow (TD)
May 20, 2023 07:20
Estimated Dry Weather Flow at TD
1.31 L/s
Peak Measured Flow
7.01 L/s
Peak I/I Flow 4
5.70 L/s
Peak I/I Rate 5
0.94 L/s/ha
Peak Measured Depth
153.51 mm
Total I/I Flow Volume during event
67,903.30 L
Volumetric Coefficient (Cv%) 6
2.65%
Total Measured Flow Volume during Event
184,525.80 L
Peak I/I Coefficient 7
0.0255
Hourly Wet-Weather Peaking Factor 8
3.85
Instantaneous Wet-Weather Peaking Factor 9
6.67
1
Time of Concentration (Tc): The estimated time for the flow to travel from the furthest point in the upstream area to the point of monitoring, assume flow is travelling at 1.00 m/s Peak Precipitation Intensity Over Tc: The peak rainfall intensity for the duration of the storm with the time interval defined by time of concentration 3 Return Period over Tc: The estimated time to elapse before a storm of equal or greater intensity will likely occur again, based on design storm criteria 4 Peak I/I Flow: The greatest difference captured between measured flow and estimated dry weather flow, Peak I/I Flow = Maximum (Measured Flow – Estimated Dry Weather Flow) 5 Peak I/I Rate: A normalized peak I/I flow based on catchment area size, Peak I/I Rate = Peak I/I Flow / Catchment Area 6 Volumetric Coefficient (Cv%): The ratio of total I/I volume and total rainfall volume, Cv% = Total I/I Flow Volume / Total Precipitation Volume * 100% 7 Peak I/ I Coefficient: The ratio of peak I/I flow and peak rainfall intensity, Peak I/ I Coefficient = Peak I/I Flow / (Peak Rainfall Intensity over Tc * Catchment Area) 8 Hourly Wet‐Weather Peaking Factor: The ratio of peak hourly wet‐weather measured flow and average dry‐weather flow, Wet‐Weather Peaking Factor = Peak Hourly Wet‐Weather Measured Flow / Average Dry-Weather Flow 9 Instantaneous Wet‐Weather Peaking Factor: The ratio of peak wet‐weather measured flow and average dry‐weather flow, Wet‐Weather Peaking Factor = Peak Wet‐Weather Measured Flow / Average Dry-Weather Flow 2
630 Civica Infrastructure Inc. www.civi.ca
Civica Infrastructures Inc. Kawartha Lakes Flow Monitoring Report
Appendix - A June 03, 2024
I/I Analysis Graph Station: L6
631 Civica Infrastructure Inc. www.civi.ca
Civica Infrastructures Inc. Kawartha Lakes Flow Monitoring Report
Appendix - A June 03, 2024
Infiltration/Inflow Event Analysis Station: L6 Jun 11, 2023 07:45 – Jun 13, 2023 09:00, Total Precipitation: 48.50 mm (2,958,500.00 L) Station Details
Storm Details
Catchment Area
6.10 ha
Total Precipitation
48.50 mm (2,958,500.00 L)
Duration of Storm
25.25 hr
Time of Concentration (Tc) 1
25 min
Peak Precipitation Intensity Over Tc 2
10.20 mm/hr
Return Period over Tc 3
< 2 Yr
Measured Flow
I/I Flow
Time of Peak Measured Flow
Jun 12, 2023 15:45
Time of Peak I/I Flow (TD)
Jun 12, 2023 15:45
Estimated Dry Weather Flow at TD
1.21 L/s
Peak Measured Flow
3.47 L/s
Peak I/I Flow 4
2.26 L/s
Peak I/I Rate 5
0.37 L/s/ha
Peak Measured Depth
97.34 mm
Total I/I Flow Volume during event
56,859.00 L
Volumetric Coefficient (Cv%) 6
1.92%
Total Measured Flow Volume during Event
190,713.50 L
Peak I/I Coefficient 7
0.0131
Hourly Wet-Weather Peaking Factor 8
2.80
Instantaneous Wet-Weather Peaking Factor 9
3.48
1
Time of Concentration (Tc): The estimated time for the flow to travel from the furthest point in the upstream area to the point of monitoring, assume flow is travelling at 1.00 m/s Peak Precipitation Intensity Over Tc: The peak rainfall intensity for the duration of the storm with the time interval defined by time of concentration 3 Return Period over Tc: The estimated time to elapse before a storm of equal or greater intensity will likely occur again, based on design storm criteria 4 Peak I/I Flow: The greatest difference captured between measured flow and estimated dry weather flow, Peak I/I Flow = Maximum (Measured Flow – Estimated Dry Weather Flow) 5 Peak I/I Rate: A normalized peak I/I flow based on catchment area size, Peak I/I Rate = Peak I/I Flow / Catchment Area 6 Volumetric Coefficient (Cv%): The ratio of total I/I volume and total rainfall volume, Cv% = Total I/I Flow Volume / Total Precipitation Volume * 100% 7 Peak I/ I Coefficient: The ratio of peak I/I flow and peak rainfall intensity, Peak I/ I Coefficient = Peak I/I Flow / (Peak Rainfall Intensity over Tc * Catchment Area) 8 Hourly Wet‐Weather Peaking Factor: The ratio of peak hourly wet‐weather measured flow and average dry‐weather flow, Wet‐Weather Peaking Factor = Peak Hourly Wet‐Weather Measured Flow / Average Dry-Weather Flow 9 Instantaneous Wet‐Weather Peaking Factor: The ratio of peak wet‐weather measured flow and average dry‐weather flow, Wet‐Weather Peaking Factor = Peak Wet‐Weather Measured Flow / Average Dry-Weather Flow 2
632 Civica Infrastructure Inc. www.civi.ca
Civica Infrastructures Inc. Kawartha Lakes Flow Monitoring Report
Appendix - A June 03, 2024
I/I Analysis Graph Station: L6
633 Civica Infrastructure Inc. www.civi.ca
Civica Infrastructures Inc. Kawartha Lakes Flow Monitoring Report
Appendix - A June 03, 2024
Infiltration/Inflow Event Analysis Station: L6 Jun 22, 2023 17:40 – Jun 25, 2023 01:45, Total Precipitation: 19.75 mm (1,204,750.00 L) Station Details
Storm Details
Catchment Area
6.10 ha
Total Precipitation
19.75 mm (1,204,750.00 L)
Duration of Storm
32.08 hr
Time of Concentration (Tc) 1
25 min
Peak Precipitation Intensity Over Tc 2
25.80 mm/hr
Return Period over Tc 3
< 2 Yr
Measured Flow
I/I Flow
Time of Peak Measured Flow
Jun 23, 2023 07:50
Time of Peak I/I Flow (TD)
Jun 23, 2023 07:50
Estimated Dry Weather Flow at TD
1.02 L/s
Peak Measured Flow
1.89 L/s
Peak I/I Flow 4
0.87 L/s
Peak I/I Rate 5
0.14 L/s/ha
Peak Measured Depth
92.05 mm
Total I/I Flow Volume during event
13,230.30 L
Volumetric Coefficient (Cv%) 6
1.10%
Total Measured Flow Volume during Event
167,628.20 L
Peak I/I Coefficient 7
0.0020
Hourly Wet-Weather Peaking Factor 8
1.60
Instantaneous Wet-Weather Peaking Factor 9
1.95
1
Time of Concentration (Tc): The estimated time for the flow to travel from the furthest point in the upstream area to the point of monitoring, assume flow is travelling at 1.00 m/s Peak Precipitation Intensity Over Tc: The peak rainfall intensity for the duration of the storm with the time interval defined by time of concentration 3 Return Period over Tc: The estimated time to elapse before a storm of equal or greater intensity will likely occur again, based on design storm criteria 4 Peak I/I Flow: The greatest difference captured between measured flow and estimated dry weather flow, Peak I/I Flow = Maximum (Measured Flow – Estimated Dry Weather Flow) 5 Peak I/I Rate: A normalized peak I/I flow based on catchment area size, Peak I/I Rate = Peak I/I Flow / Catchment Area 6 Volumetric Coefficient (Cv%): The ratio of total I/I volume and total rainfall volume, Cv% = Total I/I Flow Volume / Total Precipitation Volume * 100% 7 Peak I/ I Coefficient: The ratio of peak I/I flow and peak rainfall intensity, Peak I/ I Coefficient = Peak I/I Flow / (Peak Rainfall Intensity over Tc * Catchment Area) 8 Hourly Wet‐Weather Peaking Factor: The ratio of peak hourly wet‐weather measured flow and average dry‐weather flow, Wet‐Weather Peaking Factor = Peak Hourly Wet‐Weather Measured Flow / Average Dry-Weather Flow 9 Instantaneous Wet‐Weather Peaking Factor: The ratio of peak wet‐weather measured flow and average dry‐weather flow, Wet‐Weather Peaking Factor = Peak Wet‐Weather Measured Flow / Average Dry-Weather Flow 2
634 Civica Infrastructure Inc. www.civi.ca
Civica Infrastructures Inc. Kawartha Lakes Flow Monitoring Report
Appendix - A June 03, 2024
I/I Analysis Graph Station: L6
635 Civica Infrastructure Inc. www.civi.ca
Civica Infrastructures Inc. Kawartha Lakes Flow Monitoring Report
Appendix - A June 03, 2024
Infiltration/Inflow Event Analysis Station: L6 Jun 26, 2023 20:55 – Jun 28, 2023 02:40, Total Precipitation: 30.50 mm (1,860,500.00 L) Station Details
Storm Details
Catchment Area
6.10 ha
Total Precipitation
30.50 mm (1,860,500.00 L)
Duration of Storm
5.75 hr
Time of Concentration (Tc) 1
25 min
Peak Precipitation Intensity Over Tc 2
15.60 mm/hr
Return Period over Tc 3
< 2 Yr
Measured Flow
I/I Flow
Time of Peak Measured Flow
Jun 27, 2023 14:10
Time of Peak I/I Flow (TD)
Jun 27, 2023 14:10
Estimated Dry Weather Flow at TD
0.93 L/s
Peak Measured Flow
5.45 L/s
Peak I/I Flow 4
4.53 L/s
Peak I/I Rate 5
0.74 L/s/ha
Peak Measured Depth
89.23 mm
Total I/I Flow Volume during event
78,066.10 L
Volumetric Coefficient (Cv%) 6
4.20%
Total Measured Flow Volume during Event
139,133.50 L
Peak I/I Coefficient 7
0.0171
Hourly Wet-Weather Peaking Factor 8
5.08
Instantaneous Wet-Weather Peaking Factor 9
5.73
1
Time of Concentration (Tc): The estimated time for the flow to travel from the furthest point in the upstream area to the point of monitoring, assume flow is travelling at 1.00 m/s Peak Precipitation Intensity Over Tc: The peak rainfall intensity for the duration of the storm with the time interval defined by time of concentration 3 Return Period over Tc: The estimated time to elapse before a storm of equal or greater intensity will likely occur again, based on design storm criteria 4 Peak I/I Flow: The greatest difference captured between measured flow and estimated dry weather flow, Peak I/I Flow = Maximum (Measured Flow – Estimated Dry Weather Flow) 5 Peak I/I Rate: A normalized peak I/I flow based on catchment area size, Peak I/I Rate = Peak I/I Flow / Catchment Area 6 Volumetric Coefficient (Cv%): The ratio of total I/I volume and total rainfall volume, Cv% = Total I/I Flow Volume / Total Precipitation Volume * 100% 7 Peak I/ I Coefficient: The ratio of peak I/I flow and peak rainfall intensity, Peak I/ I Coefficient = Peak I/I Flow / (Peak Rainfall Intensity over Tc * Catchment Area) 8 Hourly Wet‐Weather Peaking Factor: The ratio of peak hourly wet‐weather measured flow and average dry‐weather flow, Wet‐Weather Peaking Factor = Peak Hourly Wet‐Weather Measured Flow / Average Dry-Weather Flow 9 Instantaneous Wet‐Weather Peaking Factor: The ratio of peak wet‐weather measured flow and average dry‐weather flow, Wet‐Weather Peaking Factor = Peak Wet‐Weather Measured Flow / Average Dry-Weather Flow 2
636 Civica Infrastructure Inc. www.civi.ca
Civica Infrastructures Inc. Kawartha Lakes Flow Monitoring Report
Appendix - A June 03, 2024
I/I Analysis Graph Station: L6
637 Civica Infrastructure Inc. www.civi.ca
Civica Infrastructures Inc. Kawartha Lakes Flow Monitoring Report
Appendix - A June 03, 2024
Infiltration/Inflow Event Analysis Station: L6 Jul 14, 2023 23:20 – Jul 16, 2023 18:00, Total Precipitation: 16.25 mm (991,250.00 L) Station Details
Storm Details
Catchment Area
6.10 ha
Total Precipitation
16.25 mm (991,250.00 L)
Duration of Storm
18.67 hr
Time of Concentration (Tc) 1
25 min
Peak Precipitation Intensity Over Tc 2
24.60 mm/hr
Return Period over Tc 3
< 2 Yr
Measured Flow
I/I Flow
Time of Peak Measured Flow
Jul 15, 2023 12:45
Time of Peak I/I Flow (TD)
Jul 15, 2023 12:45
Estimated Dry Weather Flow at TD
1.05 L/s
Peak Measured Flow
3.26 L/s
Peak I/I Flow 4
2.21 L/s
Peak I/I Rate 5
0.36 L/s/ha
Peak Measured Depth
96.04 mm
Total I/I Flow Volume during event
13,221.30 L
Volumetric Coefficient (Cv%) 6
1.33%
Total Measured Flow Volume during Event
121,005.90 L
Peak I/I Coefficient 7
0.0053
Hourly Wet-Weather Peaking Factor 8
1.82
Instantaneous Wet-Weather Peaking Factor 9
3.34
1
Time of Concentration (Tc): The estimated time for the flow to travel from the furthest point in the upstream area to the point of monitoring, assume flow is travelling at 1.00 m/s Peak Precipitation Intensity Over Tc: The peak rainfall intensity for the duration of the storm with the time interval defined by time of concentration 3 Return Period over Tc: The estimated time to elapse before a storm of equal or greater intensity will likely occur again, based on design storm criteria 4 Peak I/I Flow: The greatest difference captured between measured flow and estimated dry weather flow, Peak I/I Flow = Maximum (Measured Flow – Estimated Dry Weather Flow) 5 Peak I/I Rate: A normalized peak I/I flow based on catchment area size, Peak I/I Rate = Peak I/I Flow / Catchment Area 6 Volumetric Coefficient (Cv%): The ratio of total I/I volume and total rainfall volume, Cv% = Total I/I Flow Volume / Total Precipitation Volume * 100% 7 Peak I/ I Coefficient: The ratio of peak I/I flow and peak rainfall intensity, Peak I/ I Coefficient = Peak I/I Flow / (Peak Rainfall Intensity over Tc * Catchment Area) 8 Hourly Wet‐Weather Peaking Factor: The ratio of peak hourly wet‐weather measured flow and average dry‐weather flow, Wet‐Weather Peaking Factor = Peak Hourly Wet‐Weather Measured Flow / Average Dry-Weather Flow 9 Instantaneous Wet‐Weather Peaking Factor: The ratio of peak wet‐weather measured flow and average dry‐weather flow, Wet‐Weather Peaking Factor = Peak Wet‐Weather Measured Flow / Average Dry-Weather Flow 2
638 Civica Infrastructure Inc. www.civi.ca
Civica Infrastructures Inc. Kawartha Lakes Flow Monitoring Report
Appendix - A June 03, 2024
I/I Analysis Graph Station: L6
639 Civica Infrastructure Inc. www.civi.ca
Civica Infrastructures Inc. Kawartha Lakes Flow Monitoring Report
Appendix - A June 03, 2024
Infiltration/Inflow Event Analysis Station: L6 Jul 20, 2023 07:10 – Jul 21, 2023 09:10, Total Precipitation: 19.75 mm (1,204,750.00 L) Station Details
Storm Details
Catchment Area
6.10 ha
Total Precipitation
19.75 mm (1,204,750.00 L)
Duration of Storm
2.00 hr
Time of Concentration (Tc) 1
25 min
Peak Precipitation Intensity Over Tc 2
34.20 mm/hr
Return Period over Tc 3
< 2 Yr
Measured Flow
I/I Flow
Time of Peak Measured Flow
Jul 20, 2023 19:35
Time of Peak I/I Flow (TD)
Jul 20, 2023 19:35
Estimated Dry Weather Flow at TD
1.20 L/s
Peak Measured Flow
3.18 L/s
Peak I/I Flow 4
1.98 L/s
Peak I/I Rate 5
0.33 L/s/ha
Peak Measured Depth
100.07 mm
Total I/I Flow Volume during event
12,996.80 L
Volumetric Coefficient (Cv%) 6
1.08%
Total Measured Flow Volume during Event
61,274.40 L
Peak I/I Coefficient 7
0.0034
Hourly Wet-Weather Peaking Factor 8
2.54
Instantaneous Wet-Weather Peaking Factor 9
3.34
1
Time of Concentration (Tc): The estimated time for the flow to travel from the furthest point in the upstream area to the point of monitoring, assume flow is travelling at 1.00 m/s Peak Precipitation Intensity Over Tc: The peak rainfall intensity for the duration of the storm with the time interval defined by time of concentration 3 Return Period over Tc: The estimated time to elapse before a storm of equal or greater intensity will likely occur again, based on design storm criteria 4 Peak I/I Flow: The greatest difference captured between measured flow and estimated dry weather flow, Peak I/I Flow = Maximum (Measured Flow – Estimated Dry Weather Flow) 5 Peak I/I Rate: A normalized peak I/I flow based on catchment area size, Peak I/I Rate = Peak I/I Flow / Catchment Area 6 Volumetric Coefficient (Cv%): The ratio of total I/I volume and total rainfall volume, Cv% = Total I/I Flow Volume / Total Precipitation Volume * 100% 7 Peak I/ I Coefficient: The ratio of peak I/I flow and peak rainfall intensity, Peak I/ I Coefficient = Peak I/I Flow / (Peak Rainfall Intensity over Tc * Catchment Area) 8 Hourly Wet‐Weather Peaking Factor: The ratio of peak hourly wet‐weather measured flow and average dry‐weather flow, Wet‐Weather Peaking Factor = Peak Hourly Wet‐Weather Measured Flow / Average Dry-Weather Flow 9 Instantaneous Wet‐Weather Peaking Factor: The ratio of peak wet‐weather measured flow and average dry‐weather flow, Wet‐Weather Peaking Factor = Peak Wet‐Weather Measured Flow / Average Dry-Weather Flow 2
640 Civica Infrastructure Inc. www.civi.ca
Civica Infrastructures Inc. Kawartha Lakes Flow Monitoring Report
Appendix - A June 03, 2024
I/I Analysis Graph Station: L6
641 Civica Infrastructure Inc. www.civi.ca
Civica Infrastructures Inc. Kawartha Lakes Flow Monitoring Report
Appendix - A June 03, 2024
Infiltration/Inflow Event Analysis Station: L6 Aug 03, 2023 04:10 – Aug 04, 2023 15:25, Total Precipitation: 39.25 mm (2,394,250.00 L) Station Details
Storm Details
Catchment Area
6.10 ha
Total Precipitation
39.25 mm (2,394,250.00 L)
Duration of Storm
11.25 hr
Time of Concentration (Tc) 1
25 min
Peak Precipitation Intensity Over Tc 2
67.80 mm/hr
Return Period over Tc 3
5 - 10 Yr
Measured Flow
I/I Flow
Time of Peak Measured Flow
Aug 03, 2023 16:30
Time of Peak I/I Flow (TD)
Aug 03, 2023 16:25
Estimated Dry Weather Flow at TD
1.11 L/s
Peak Measured Flow
4.58 L/s
Peak I/I Flow 4
3.47 L/s
Peak I/I Rate 5
0.57 L/s/ha
Peak Measured Depth
107.24 mm
Total I/I Flow Volume during event
84,917.20 L
Volumetric Coefficient (Cv%) 6
3.55%
Total Measured Flow Volume during Event
178,365.00 L
Peak I/I Coefficient 7
0.0030
Hourly Wet-Weather Peaking Factor 8
3.19
Instantaneous Wet-Weather Peaking Factor 9
4.12
1
Time of Concentration (Tc): The estimated time for the flow to travel from the furthest point in the upstream area to the point of monitoring, assume flow is travelling at 1.00 m/s Peak Precipitation Intensity Over Tc: The peak rainfall intensity for the duration of the storm with the time interval defined by time of concentration 3 Return Period over Tc: The estimated time to elapse before a storm of equal or greater intensity will likely occur again, based on design storm criteria 4 Peak I/I Flow: The greatest difference captured between measured flow and estimated dry weather flow, Peak I/I Flow = Maximum (Measured Flow – Estimated Dry Weather Flow) 5 Peak I/I Rate: A normalized peak I/I flow based on catchment area size, Peak I/I Rate = Peak I/I Flow / Catchment Area 6 Volumetric Coefficient (Cv%): The ratio of total I/I volume and total rainfall volume, Cv% = Total I/I Flow Volume / Total Precipitation Volume * 100% 7 Peak I/ I Coefficient: The ratio of peak I/I flow and peak rainfall intensity, Peak I/ I Coefficient = Peak I/I Flow / (Peak Rainfall Intensity over Tc * Catchment Area) 8 Hourly Wet‐Weather Peaking Factor: The ratio of peak hourly wet‐weather measured flow and average dry‐weather flow, Wet‐Weather Peaking Factor = Peak Hourly Wet‐Weather Measured Flow / Average Dry-Weather Flow 9 Instantaneous Wet‐Weather Peaking Factor: The ratio of peak wet‐weather measured flow and average dry‐weather flow, Wet‐Weather Peaking Factor = Peak Wet‐Weather Measured Flow / Average Dry-Weather Flow 2
642 Civica Infrastructure Inc. www.civi.ca
Civica Infrastructures Inc. Kawartha Lakes Flow Monitoring Report
Appendix - A June 03, 2024
I/I Analysis Graph Station: L6
643 Civica Infrastructure Inc. www.civi.ca
Civica Infrastructures Inc. Kawartha Lakes Flow Monitoring Report
Appendix - A June 03, 2024
Infiltration/Inflow Event Analysis Station: L6 Aug 17, 2023 10:30 – Aug 19, 2023 08:20, Total Precipitation: 19.75 mm (1,204,750.00 L) Station Details
Storm Details
Catchment Area
6.10 ha
Total Precipitation
19.75 mm (1,204,750.00 L)
Duration of Storm
21.83 hr
Time of Concentration (Tc) 1
25 min
Peak Precipitation Intensity Over Tc 2
19.20 mm/hr
Return Period over Tc 3
< 2 Yr
Measured Flow
I/I Flow
Time of Peak Measured Flow
Aug 18, 2023 13:05
Time of Peak I/I Flow (TD)
Aug 18, 2023 13:05
Estimated Dry Weather Flow at TD
1.02 L/s
Peak Measured Flow
3.01 L/s
Peak I/I Flow 4
1.99 L/s
Peak I/I Rate 5
0.33 L/s/ha
Peak Measured Depth
94.62 mm
Total I/I Flow Volume during event
24,399.30 L
Volumetric Coefficient (Cv%) 6
2.03%
Total Measured Flow Volume during Event
145,179.20 L
Peak I/I Coefficient 7
0.0061
Hourly Wet-Weather Peaking Factor 8
2.73
Instantaneous Wet-Weather Peaking Factor 9
3.04
1
Time of Concentration (Tc): The estimated time for the flow to travel from the furthest point in the upstream area to the point of monitoring, assume flow is travelling at 1.00 m/s Peak Precipitation Intensity Over Tc: The peak rainfall intensity for the duration of the storm with the time interval defined by time of concentration 3 Return Period over Tc: The estimated time to elapse before a storm of equal or greater intensity will likely occur again, based on design storm criteria 4 Peak I/I Flow: The greatest difference captured between measured flow and estimated dry weather flow, Peak I/I Flow = Maximum (Measured Flow – Estimated Dry Weather Flow) 5 Peak I/I Rate: A normalized peak I/I flow based on catchment area size, Peak I/I Rate = Peak I/I Flow / Catchment Area 6 Volumetric Coefficient (Cv%): The ratio of total I/I volume and total rainfall volume, Cv% = Total I/I Flow Volume / Total Precipitation Volume * 100% 7 Peak I/ I Coefficient: The ratio of peak I/I flow and peak rainfall intensity, Peak I/ I Coefficient = Peak I/I Flow / (Peak Rainfall Intensity over Tc * Catchment Area) 8 Hourly Wet‐Weather Peaking Factor: The ratio of peak hourly wet‐weather measured flow and average dry‐weather flow, Wet‐Weather Peaking Factor = Peak Hourly Wet‐Weather Measured Flow / Average Dry-Weather Flow 9 Instantaneous Wet‐Weather Peaking Factor: The ratio of peak wet‐weather measured flow and average dry‐weather flow, Wet‐Weather Peaking Factor = Peak Wet‐Weather Measured Flow / Average Dry-Weather Flow 2
644 Civica Infrastructure Inc. www.civi.ca
Civica Infrastructures Inc. Kawartha Lakes Flow Monitoring Report
Appendix - A June 03, 2024
I/I Analysis Graph Station: L6
645 Civica Infrastructure Inc. www.civi.ca
Civica Infrastructures Inc. Kawartha Lakes Flow Monitoring Report
Appendix - A June 03, 2024
Infiltration/Inflow Event Analysis Station: L6 Sep 07, 2023 03:10 – Sep 08, 2023 03:50, Total Precipitation: 24.50 mm (1,494,500.00 L) Station Details
Storm Details
Catchment Area
6.10 ha
Total Precipitation
24.50 mm (1,494,500.00 L)
Duration of Storm
0.67 hr
Time of Concentration (Tc) 1
25 min
Peak Precipitation Intensity Over Tc 2
52.80 mm/hr
Return Period over Tc 3
2 - 5 Yr
Measured Flow
I/I Flow
Time of Peak Measured Flow
Sep 07, 2023 15:35
Time of Peak I/I Flow (TD)
Sep 07, 2023 15:35
Estimated Dry Weather Flow at TD
0.94 L/s
Peak Measured Flow
5.36 L/s
Peak I/I Flow 4
4.42 L/s
Peak I/I Rate 5
0.72 L/s/ha
Peak Measured Depth
111.20 mm
Total I/I Flow Volume during event
21,047.00 L
Volumetric Coefficient (Cv%) 6
1.41%
Total Measured Flow Volume during Event
62,839.00 L
Peak I/I Coefficient 7
0.0049
Hourly Wet-Weather Peaking Factor 8
3.56
Instantaneous Wet-Weather Peaking Factor 9
5.89
1
Time of Concentration (Tc): The estimated time for the flow to travel from the furthest point in the upstream area to the point of monitoring, assume flow is travelling at 1.00 m/s Peak Precipitation Intensity Over Tc: The peak rainfall intensity for the duration of the storm with the time interval defined by time of concentration 3 Return Period over Tc: The estimated time to elapse before a storm of equal or greater intensity will likely occur again, based on design storm criteria 4 Peak I/I Flow: The greatest difference captured between measured flow and estimated dry weather flow, Peak I/I Flow = Maximum (Measured Flow – Estimated Dry Weather Flow) 5 Peak I/I Rate: A normalized peak I/I flow based on catchment area size, Peak I/I Rate = Peak I/I Flow / Catchment Area 6 Volumetric Coefficient (Cv%): The ratio of total I/I volume and total rainfall volume, Cv% = Total I/I Flow Volume / Total Precipitation Volume * 100% 7 Peak I/ I Coefficient: The ratio of peak I/I flow and peak rainfall intensity, Peak I/ I Coefficient = Peak I/I Flow / (Peak Rainfall Intensity over Tc * Catchment Area) 8 Hourly Wet‐Weather Peaking Factor: The ratio of peak hourly wet‐weather measured flow and average dry‐weather flow, Wet‐Weather Peaking Factor = Peak Hourly Wet‐Weather Measured Flow / Average Dry-Weather Flow 9 Instantaneous Wet‐Weather Peaking Factor: The ratio of peak wet‐weather measured flow and average dry‐weather flow, Wet‐Weather Peaking Factor = Peak Wet‐Weather Measured Flow / Average Dry-Weather Flow 2
646 Civica Infrastructure Inc. www.civi.ca
Civica Infrastructures Inc. Kawartha Lakes Flow Monitoring Report
Appendix - A June 03, 2024
Activity Log Station: L6 Date Time
Type
Purpose of Visit
Comment
Calibration Measurement
10-Jan-2023 02:01:00 PM
Installation Log
INSTALLATION
MEASUREMENTS TAKEN, PHOTOS TAKEN, LOGGER INSTALLED
Yes
18-Jan-2023 01:19:00 PM
Maintenance Log
CALIBRATION
ANTENNA INSTALLED, ENSURED DATA MEASUREMENTS READING PROPERLY
Yes
02-Feb-2023 12:25:00 PM
Maintenance Log
CALIBRATION
DATA DOWNLOADED, TELEMETRY SENT, MEASUREMENTS TAKEN, DEBRIS CLEARED, SITE CALIBRATED
Yes
01-Mar-2023 01:45:00 PM
Maintenance Log
CALIBRATION
TC SET,DATA DOWNLOADED,TELEMETRY SENT,DEBRIS AND SILT REMOVED,SITE CALIBRATED,ANTENNA IN GOOD CONDITION,PHOTOS AND VIDEOS TAKEN
Yes
09-May-2023 01:25:00 PM
Maintenance Log
CALIBRATION
TC SET,SURVEY SENT,MADE ENTRY, TOOK PHOTOS/VIDEOS, TOOK MEASUREMENTS,DEBRIS AND SILT CLEARED, CALIBRATED SITE,SITE CLEARED
Yes
Yes
Yes
22-Jun-2023 10:30:00 AM
Maintenance Log
CALIBRATION
BATTERIES TO B REPLACED,LOGGER NOT CONNECTED ENTRY MADE PHOTOS/VIDEOS TAKEN, MEASUREMENTS TAKEN, SITE CALIBRATED
03-Oct-2023 02:00:00 PM
Removal Log
REMOVAL
TRAFFIC CONTROL SENT, UNABLE TO CONNECT TO THE LOGGER, CALIBRATION DONE, EQUIPMENT REMOVED, LOGGER TAG, PHOTOS AND VIDEOS BEFORE AND AFTER TAKEN.
647 Civica Infrastructure Inc. www.civi.ca
Civica Infrastructures Inc. Kawartha Lakes Flow Monitoring Report
Appendix - A June 03, 2024
Aggregate Data Station: L7
Precipitation Date From
Date To
Days
Min (mm)
Avg (mm)
Max (mm)
Sum (mm)
Count
Time of Min1
Time of Max1
Jan 23, 2023
Oct 04, 2023
255
0.00
0.01
15.75
644.75
73,320
Mon Jan 23, 2023 00:00
Thu Aug 03, 2023 16:20
Level Date From
Date To
Days
Min (m)
Avg (m)
Max (m)
Count
Time of Min1
Time of Max1
Jan 23, 2023
Oct 04, 2023
255
0.02
0.04
0.09
73,094
Mon Oct 02, 2023 03:00
Thu Feb 09, 2023 18:00
Flow
1
Date From
Date To
Days
Min (L/s)
Avg (L/s)
Max (L/s)
Total Volume (1,000,000 L)
Count
Time of Min1
Time of Max1
Jan 23, 2023
Oct 04, 2023
255
0.26
1.24
6.37
27.22
73,094
Mon Oct 02, 2023 03:00
Thu Feb 09, 2023 18:00
Time of Min and Time of Max will be displayed by first occurrence
648 Civica Infrastructure Inc. www.civi.ca
Civica Infrastructures Inc. Kawartha Lakes Flow Monitoring Report
Appendix - A June 03, 2024
Data Chart Station: L7 Jan 23, 2023 – Jan 31, 2023
649 Civica Infrastructure Inc. www.civi.ca
Civica Infrastructures Inc. Kawartha Lakes Flow Monitoring Report
Appendix - A June 03, 2024
Data Chart Station: L7 Feb 01, 2023 – Feb 28, 2023
650 Civica Infrastructure Inc. www.civi.ca
Civica Infrastructures Inc. Kawartha Lakes Flow Monitoring Report
Appendix - A June 03, 2024
Data Chart Station: L7 Mar 01, 2023 – Mar 31, 2023
651 Civica Infrastructure Inc. www.civi.ca
Civica Infrastructures Inc. Kawartha Lakes Flow Monitoring Report
Appendix - A June 03, 2024
Data Chart Station: L7 Apr 01, 2023 – Apr 30, 2023
652 Civica Infrastructure Inc. www.civi.ca
Civica Infrastructures Inc. Kawartha Lakes Flow Monitoring Report
Appendix - A June 03, 2024
Data Chart Station: L7 May 01, 2023 – May 31, 2023
653 Civica Infrastructure Inc. www.civi.ca
Civica Infrastructures Inc. Kawartha Lakes Flow Monitoring Report
Appendix - A June 03, 2024
Data Chart Station: L7 Jun 01, 2023 – Jun 30, 2023
654 Civica Infrastructure Inc. www.civi.ca
Civica Infrastructures Inc. Kawartha Lakes Flow Monitoring Report
Appendix - A June 03, 2024
Data Chart Station: L7 Jul 01, 2023 – Jul 31, 2023
655 Civica Infrastructure Inc. www.civi.ca
Civica Infrastructures Inc. Kawartha Lakes Flow Monitoring Report
Appendix - A June 03, 2024
Data Chart Station: L7 Aug 01, 2023 – Aug 31, 2023
656 Civica Infrastructure Inc. www.civi.ca
Civica Infrastructures Inc. Kawartha Lakes Flow Monitoring Report
Appendix - A June 03, 2024
Data Chart Station: L7 Sep 01, 2023 – Sep 30, 2023
657 Civica Infrastructure Inc. www.civi.ca
Civica Infrastructures Inc. Kawartha Lakes Flow Monitoring Report
Appendix - A June 03, 2024
Data Chart Station: L7 Oct 01, 2023 – Oct 04, 2023
658 Civica Infrastructure Inc. www.civi.ca
Civica Infrastructures Inc. Kawartha Lakes Flow Monitoring Report
Appendix - A June 03, 2024
Sanitary Report Station: L7
1
Average Dry Weather Flow (L/s)
Average Dry Weather Flow (L/c/d)
Average Daily Minimum Dry Weather Flow (L/s)
Average Daily Peak Dry Weather Flow (L/s)
1.080
162.263
0.614
2.139
Peaking Factor
Groundwater Infiltration (L/s)1
Groundwater Infiltration (L/ha/d)
% of GWI in Average DWF
1.981
0.522
3,919.375
48.309
Groundwater infiltration (GWI) is assumed as 85% of the daily minimum flow averaged over the monitoring period
659 Civica Infrastructure Inc. www.civi.ca
Civica Infrastructures Inc. Kawartha Lakes Flow Monitoring Report
Appendix - A June 03, 2024
I/I Analysis Table
1
Event1
Total Precipitation (mm)
Duration (hours)
Peak Intensity Over Tc at Station (mm/hr)
Feb 09, 2023
35.75
21.58
Mar 16, 2023
19.00
Mar 31, 2023
L7 Measured Peak Flow (L/s)
Peak I/I Flow (L/s)
Peak I/I Rate (L/s/ha)
Volumetric Runoff Coefficient (CV%)
Peaking Factor (PF)
8.20
6.37
4.75
0.41
5.91 %
3.24
12.67
3.80
5.03
3.39
0.30
5.28 %
2.28
27.00
18.25
7.50
5.77
3.89
0.34
5.19 %
1.98
Apr 05, 2023
24.50
10.58
21.80
5.03
3.31
0.29
4.05 %
1.93
Apr 16, 2023
16.25
4.50
9.00
2.96
1.58
0.14
1.50 %
1.11
Apr 30, 2023
22.00
11.42
8.20
3.39
2.01
0.17
2.41 %
1.66
May 19, 2023
42.00
18.75
15.00
5.62
4.58
0.40
1.31 %
4.66
Jun 11, 2023
48.50
25.25
10.50
2.62
1.74
0.15
1.13 %
2.02
Jun 23, 2023
19.75
32.08
30.00
2.25
1.30
0.11
0.74 %
1.60
Jun 27, 2023
30.50
5.75
16.50
4.10
3.22
0.28
1.61 %
3.60
Jul 13, 2023
15.00
4.08
10.50
2.29
1.48
0.13
0.54 %
1.66
Jul 15, 2023
16.25
18.67
30.70
2.03
1.10
0.10
0.99 %
1.25
Jul 20, 2023
19.75
2.00
38.20
3.85
2.96
0.26
0.17 %
3.59
Aug 03, 2023
39.25
11.25
83.20
2.96
2.04
0.18
0.71 %
2.32
Aug 17, 2023
19.75
21.83
21.00
2.47
1.54
0.13
0.81 %
1.92
Sep 07, 2023
24.50
0.67
57.00
2.86
1.88
0.16
0.22 %
2.26
Average
26.23
13.71
23.19
3.73
2.55
0.22
2.04 %
2.32
Maximum
48.50
32.08
83.20
6.37
4.75
0.41
5.91 %
4.66
Flow KPIs
Measured Storms
Station: L7
An event is a storm with a minimum volume of 15mm and a minimum inter-event dry period of 12 hours
660 Civica Infrastructure Inc. www.civi.ca
Civica Infrastructures Inc. Kawartha Lakes Flow Monitoring Report
Appendix - A June 03, 2024
I/I Analysis Graph Station: L7
661 Civica Infrastructure Inc. www.civi.ca
Civica Infrastructures Inc. Kawartha Lakes Flow Monitoring Report
Appendix - A June 03, 2024
Infiltration/Inflow Event Analysis Station: L7 Feb 08, 2023 20:55 – Feb 10, 2023 18:30, Total Precipitation: 35.75 mm (4,111,250.00 L) Station Details
Storm Details
Catchment Area
11.50 ha
Total Precipitation
35.75 mm (4,111,250.00 L)
Duration of Storm
21.58 hr
Time of Concentration (Tc) 1
20 min
Peak Precipitation Intensity Over Tc 2
8.20 mm/hr
Return Period over Tc 3
< 2 Yr
Measured Flow
I/I Flow
Time of Peak Measured Flow
Feb 09, 2023 18:00
Time of Peak I/I Flow (TD)
Feb 09, 2023 18:00
Estimated Dry Weather Flow at TD
1.62 L/s
Peak Measured Flow
6.37 L/s
Peak I/I Flow 4
4.75 L/s
Peak I/I Rate 5
0.41 L/s/ha
Peak Measured Depth
89.50 mm
Total I/I Flow Volume during event
242,968.10 L
Volumetric Coefficient (Cv%) 6
5.91%
Total Measured Flow Volume during Event
420,395.10 L
Peak I/I Coefficient 7
0.0180
Hourly Wet-Weather Peaking Factor 8
3.79
Instantaneous Wet-Weather Peaking Factor 9
4.35
1
Time of Concentration (Tc): The estimated time for the flow to travel from the furthest point in the upstream area to the point of monitoring, assume flow is travelling at 1.00 m/s Peak Precipitation Intensity Over Tc: The peak rainfall intensity for the duration of the storm with the time interval defined by time of concentration 3 Return Period over Tc: The estimated time to elapse before a storm of equal or greater intensity will likely occur again, based on design storm criteria 4 Peak I/I Flow: The greatest difference captured between measured flow and estimated dry weather flow, Peak I/I Flow = Maximum (Measured Flow – Estimated Dry Weather Flow) 5 Peak I/I Rate: A normalized peak I/I flow based on catchment area size, Peak I/I Rate = Peak I/I Flow / Catchment Area 6 Volumetric Coefficient (Cv%): The ratio of total I/I volume and total rainfall volume, Cv% = Total I/I Flow Volume / Total Precipitation Volume * 100% 7 Peak I/ I Coefficient: The ratio of peak I/I flow and peak rainfall intensity, Peak I/ I Coefficient = Peak I/I Flow / (Peak Rainfall Intensity over Tc * Catchment Area) 8 Hourly Wet‐Weather Peaking Factor: The ratio of peak hourly wet‐weather measured flow and average dry‐weather flow, Wet‐Weather Peaking Factor = Peak Hourly Wet‐Weather Measured Flow / Average Dry-Weather Flow 9 Instantaneous Wet‐Weather Peaking Factor: The ratio of peak wet‐weather measured flow and average dry‐weather flow, Wet‐Weather Peaking Factor = Peak Wet‐Weather Measured Flow / Average Dry-Weather Flow 2
662 Civica Infrastructure Inc. www.civi.ca
Civica Infrastructures Inc. Kawartha Lakes Flow Monitoring Report
Appendix - A June 03, 2024
I/I Analysis Graph Station: L7
663 Civica Infrastructure Inc. www.civi.ca
Civica Infrastructures Inc. Kawartha Lakes Flow Monitoring Report
Appendix - A June 03, 2024
Infiltration/Inflow Event Analysis Station: L7 Mar 16, 2023 10:45 – Mar 17, 2023 23:25, Total Precipitation: 19.00 mm (2,185,000.00 L) Station Details
Storm Details
Catchment Area
11.50 ha
Total Precipitation
19.00 mm (2,185,000.00 L)
Duration of Storm
12.67 hr
Time of Concentration (Tc) 1
20 min
Peak Precipitation Intensity Over Tc 2
3.80 mm/hr
Return Period over Tc 3
< 2 Yr
Measured Flow
I/I Flow
Time of Peak Measured Flow
Mar 17, 2023 17:05
Time of Peak I/I Flow (TD)
Mar 17, 2023 17:05
Estimated Dry Weather Flow at TD
1.64 L/s
Peak Measured Flow
5.03 L/s
Peak I/I Flow 4
3.39 L/s
Peak I/I Rate 5
0.30 L/s/ha
Peak Measured Depth
80.70 mm
Total I/I Flow Volume during event
115,280.00 L
Volumetric Coefficient (Cv%) 6
5.28%
Total Measured Flow Volume during Event
247,584.40 L
Peak I/I Coefficient 7
0.0283
Hourly Wet-Weather Peaking Factor 8
2.91
Instantaneous Wet-Weather Peaking Factor 9
3.39
1
Time of Concentration (Tc): The estimated time for the flow to travel from the furthest point in the upstream area to the point of monitoring, assume flow is travelling at 1.00 m/s Peak Precipitation Intensity Over Tc: The peak rainfall intensity for the duration of the storm with the time interval defined by time of concentration 3 Return Period over Tc: The estimated time to elapse before a storm of equal or greater intensity will likely occur again, based on design storm criteria 4 Peak I/I Flow: The greatest difference captured between measured flow and estimated dry weather flow, Peak I/I Flow = Maximum (Measured Flow – Estimated Dry Weather Flow) 5 Peak I/I Rate: A normalized peak I/I flow based on catchment area size, Peak I/I Rate = Peak I/I Flow / Catchment Area 6 Volumetric Coefficient (Cv%): The ratio of total I/I volume and total rainfall volume, Cv% = Total I/I Flow Volume / Total Precipitation Volume * 100% 7 Peak I/ I Coefficient: The ratio of peak I/I flow and peak rainfall intensity, Peak I/ I Coefficient = Peak I/I Flow / (Peak Rainfall Intensity over Tc * Catchment Area) 8 Hourly Wet‐Weather Peaking Factor: The ratio of peak hourly wet‐weather measured flow and average dry‐weather flow, Wet‐Weather Peaking Factor = Peak Hourly Wet‐Weather Measured Flow / Average Dry-Weather Flow 9 Instantaneous Wet‐Weather Peaking Factor: The ratio of peak wet‐weather measured flow and average dry‐weather flow, Wet‐Weather Peaking Factor = Peak Wet‐Weather Measured Flow / Average Dry-Weather Flow 2
664 Civica Infrastructure Inc. www.civi.ca
Civica Infrastructures Inc. Kawartha Lakes Flow Monitoring Report
Appendix - A June 03, 2024
I/I Analysis Graph Station: L7
665 Civica Infrastructure Inc. www.civi.ca
Civica Infrastructures Inc. Kawartha Lakes Flow Monitoring Report
Appendix - A June 03, 2024
Infiltration/Inflow Event Analysis Station: L7 Mar 31, 2023 00:15 – Apr 01, 2023 18:30, Total Precipitation: 27.00 mm (3,105,000.00 L) Station Details
Storm Details
Catchment Area
11.50 ha
Total Precipitation
27.00 mm (3,105,000.00 L)
Duration of Storm
18.25 hr
Time of Concentration (Tc) 1
20 min
Peak Precipitation Intensity Over Tc 2
7.50 mm/hr
Return Period over Tc 3
< 2 Yr
Measured Flow
I/I Flow
Time of Peak Measured Flow
Apr 01, 2023 04:45
Time of Peak I/I Flow (TD)
Apr 01, 2023 04:45
Estimated Dry Weather Flow at TD
1.88 L/s
Peak Measured Flow
5.77 L/s
Peak I/I Flow 4
3.89 L/s
Peak I/I Rate 5
0.34 L/s/ha
Peak Measured Depth
85.70 mm
Total I/I Flow Volume during event
161,201.40 L
Volumetric Coefficient (Cv%) 6
5.19%
Total Measured Flow Volume during Event
376,101.70 L
Peak I/I Coefficient 7
0.0162
Hourly Wet-Weather Peaking Factor 8
2.61
Instantaneous Wet-Weather Peaking Factor 9
2.93
1
Time of Concentration (Tc): The estimated time for the flow to travel from the furthest point in the upstream area to the point of monitoring, assume flow is travelling at 1.00 m/s Peak Precipitation Intensity Over Tc: The peak rainfall intensity for the duration of the storm with the time interval defined by time of concentration 3 Return Period over Tc: The estimated time to elapse before a storm of equal or greater intensity will likely occur again, based on design storm criteria 4 Peak I/I Flow: The greatest difference captured between measured flow and estimated dry weather flow, Peak I/I Flow = Maximum (Measured Flow – Estimated Dry Weather Flow) 5 Peak I/I Rate: A normalized peak I/I flow based on catchment area size, Peak I/I Rate = Peak I/I Flow / Catchment Area 6 Volumetric Coefficient (Cv%): The ratio of total I/I volume and total rainfall volume, Cv% = Total I/I Flow Volume / Total Precipitation Volume * 100% 7 Peak I/ I Coefficient: The ratio of peak I/I flow and peak rainfall intensity, Peak I/ I Coefficient = Peak I/I Flow / (Peak Rainfall Intensity over Tc * Catchment Area) 8 Hourly Wet‐Weather Peaking Factor: The ratio of peak hourly wet‐weather measured flow and average dry‐weather flow, Wet‐Weather Peaking Factor = Peak Hourly Wet‐Weather Measured Flow / Average Dry-Weather Flow 9 Instantaneous Wet‐Weather Peaking Factor: The ratio of peak wet‐weather measured flow and average dry‐weather flow, Wet‐Weather Peaking Factor = Peak Wet‐Weather Measured Flow / Average Dry-Weather Flow 2
666 Civica Infrastructure Inc. www.civi.ca
Civica Infrastructures Inc. Kawartha Lakes Flow Monitoring Report
Appendix - A June 03, 2024
I/I Analysis Graph Station: L7
667 Civica Infrastructure Inc. www.civi.ca
Civica Infrastructures Inc. Kawartha Lakes Flow Monitoring Report
Appendix - A June 03, 2024
Infiltration/Inflow Event Analysis Station: L7 Apr 04, 2023 17:50 – Apr 06, 2023 04:25, Total Precipitation: 24.50 mm (2,817,500.00 L) Station Details
Storm Details
Catchment Area
11.50 ha
Total Precipitation
24.50 mm (2,817,500.00 L)
Duration of Storm
10.58 hr
Time of Concentration (Tc) 1
20 min
Peak Precipitation Intensity Over Tc 2
21.80 mm/hr
Return Period over Tc 3
< 2 Yr
Measured Flow
I/I Flow
Time of Peak Measured Flow
Apr 05, 2023 17:10
Time of Peak I/I Flow (TD)
Apr 05, 2023 17:25
Estimated Dry Weather Flow at TD
1.72 L/s
Peak Measured Flow
5.03 L/s
Peak I/I Flow 4
3.31 L/s
Peak I/I Rate 5
0.29 L/s/ha
Peak Measured Depth
80.70 mm
Total I/I Flow Volume during event
113,973.90 L
Volumetric Coefficient (Cv%) 6
4.05%
Total Measured Flow Volume during Event
254,074.60 L
Peak I/I Coefficient 7
0.0048
Hourly Wet-Weather Peaking Factor 8
2.61
Instantaneous Wet-Weather Peaking Factor 9
2.93
1
Time of Concentration (Tc): The estimated time for the flow to travel from the furthest point in the upstream area to the point of monitoring, assume flow is travelling at 1.00 m/s Peak Precipitation Intensity Over Tc: The peak rainfall intensity for the duration of the storm with the time interval defined by time of concentration 3 Return Period over Tc: The estimated time to elapse before a storm of equal or greater intensity will likely occur again, based on design storm criteria 4 Peak I/I Flow: The greatest difference captured between measured flow and estimated dry weather flow, Peak I/I Flow = Maximum (Measured Flow – Estimated Dry Weather Flow) 5 Peak I/I Rate: A normalized peak I/I flow based on catchment area size, Peak I/I Rate = Peak I/I Flow / Catchment Area 6 Volumetric Coefficient (Cv%): The ratio of total I/I volume and total rainfall volume, Cv% = Total I/I Flow Volume / Total Precipitation Volume * 100% 7 Peak I/ I Coefficient: The ratio of peak I/I flow and peak rainfall intensity, Peak I/ I Coefficient = Peak I/I Flow / (Peak Rainfall Intensity over Tc * Catchment Area) 8 Hourly Wet‐Weather Peaking Factor: The ratio of peak hourly wet‐weather measured flow and average dry‐weather flow, Wet‐Weather Peaking Factor = Peak Hourly Wet‐Weather Measured Flow / Average Dry-Weather Flow 9 Instantaneous Wet‐Weather Peaking Factor: The ratio of peak wet‐weather measured flow and average dry‐weather flow, Wet‐Weather Peaking Factor = Peak Wet‐Weather Measured Flow / Average Dry-Weather Flow 2
668 Civica Infrastructure Inc. www.civi.ca
Civica Infrastructures Inc. Kawartha Lakes Flow Monitoring Report
Appendix - A June 03, 2024
I/I Analysis Graph Station: L7
669 Civica Infrastructure Inc. www.civi.ca
Civica Infrastructures Inc. Kawartha Lakes Flow Monitoring Report
Appendix - A June 03, 2024
Infiltration/Inflow Event Analysis Station: L7 Apr 16, 2023 10:25 – Apr 17, 2023 14:55, Total Precipitation: 16.25 mm (1,868,750.00 L) Station Details
Storm Details
Catchment Area
11.50 ha
Total Precipitation
16.25 mm (1,868,750.00 L)
Duration of Storm
4.50 hr
Time of Concentration (Tc) 1
20 min
Peak Precipitation Intensity Over Tc 2
9.00 mm/hr
Return Period over Tc 3
< 2 Yr
Measured Flow
I/I Flow
Time of Peak Measured Flow
Apr 17, 2023 02:30
Time of Peak I/I Flow (TD)
Apr 17, 2023 02:10
Estimated Dry Weather Flow at TD
1.27 L/s
Peak Measured Flow
2.96 L/s
Peak I/I Flow 4
1.58 L/s
Peak I/I Rate 5
0.14 L/s/ha
Peak Measured Depth
63.70 mm
Total I/I Flow Volume during event
27,978.80 L
Volumetric Coefficient (Cv%) 6
1.50%
Total Measured Flow Volume during Event
112,959.70 L
Peak I/I Coefficient 7
0.0055
Hourly Wet-Weather Peaking Factor 8
1.93
Instantaneous Wet-Weather Peaking Factor 9
2.08
1
Time of Concentration (Tc): The estimated time for the flow to travel from the furthest point in the upstream area to the point of monitoring, assume flow is travelling at 1.00 m/s Peak Precipitation Intensity Over Tc: The peak rainfall intensity for the duration of the storm with the time interval defined by time of concentration 3 Return Period over Tc: The estimated time to elapse before a storm of equal or greater intensity will likely occur again, based on design storm criteria 4 Peak I/I Flow: The greatest difference captured between measured flow and estimated dry weather flow, Peak I/I Flow = Maximum (Measured Flow – Estimated Dry Weather Flow) 5 Peak I/I Rate: A normalized peak I/I flow based on catchment area size, Peak I/I Rate = Peak I/I Flow / Catchment Area 6 Volumetric Coefficient (Cv%): The ratio of total I/I volume and total rainfall volume, Cv% = Total I/I Flow Volume / Total Precipitation Volume * 100% 7 Peak I/ I Coefficient: The ratio of peak I/I flow and peak rainfall intensity, Peak I/ I Coefficient = Peak I/I Flow / (Peak Rainfall Intensity over Tc * Catchment Area) 8 Hourly Wet‐Weather Peaking Factor: The ratio of peak hourly wet‐weather measured flow and average dry‐weather flow, Wet‐Weather Peaking Factor = Peak Hourly Wet‐Weather Measured Flow / Average Dry-Weather Flow 9 Instantaneous Wet‐Weather Peaking Factor: The ratio of peak wet‐weather measured flow and average dry‐weather flow, Wet‐Weather Peaking Factor = Peak Wet‐Weather Measured Flow / Average Dry-Weather Flow 2
670 Civica Infrastructure Inc. www.civi.ca
Civica Infrastructures Inc. Kawartha Lakes Flow Monitoring Report
Appendix - A June 03, 2024
I/I Analysis Graph Station: L7
671 Civica Infrastructure Inc. www.civi.ca
Civica Infrastructures Inc. Kawartha Lakes Flow Monitoring Report
Appendix - A June 03, 2024
Infiltration/Inflow Event Analysis Station: L7 Apr 30, 2023 00:40 – May 01, 2023 12:05, Total Precipitation: 22.00 mm (2,530,000.00 L) Station Details
Storm Details
Catchment Area
11.50 ha
Total Precipitation
22.00 mm (2,530,000.00 L)
Duration of Storm
11.42 hr
Time of Concentration (Tc) 1
20 min
Peak Precipitation Intensity Over Tc 2
8.20 mm/hr
Return Period over Tc 3
< 2 Yr
Measured Flow
I/I Flow
Time of Peak Measured Flow
Apr 30, 2023 18:20
Time of Peak I/I Flow (TD)
Apr 30, 2023 18:20
Estimated Dry Weather Flow at TD
1.38 L/s
Peak Measured Flow
3.39 L/s
Peak I/I Flow 4
2.01 L/s
Peak I/I Rate 5
0.17 L/s/ha
Peak Measured Depth
67.70 mm
Total I/I Flow Volume during event
61,086.40 L
Volumetric Coefficient (Cv%) 6
2.41%
Total Measured Flow Volume during Event
163,113.90 L
Peak I/I Coefficient 7
0.0076
Hourly Wet-Weather Peaking Factor 8
2.35
Instantaneous Wet-Weather Peaking Factor 9
2.81
1
Time of Concentration (Tc): The estimated time for the flow to travel from the furthest point in the upstream area to the point of monitoring, assume flow is travelling at 1.00 m/s Peak Precipitation Intensity Over Tc: The peak rainfall intensity for the duration of the storm with the time interval defined by time of concentration 3 Return Period over Tc: The estimated time to elapse before a storm of equal or greater intensity will likely occur again, based on design storm criteria 4 Peak I/I Flow: The greatest difference captured between measured flow and estimated dry weather flow, Peak I/I Flow = Maximum (Measured Flow – Estimated Dry Weather Flow) 5 Peak I/I Rate: A normalized peak I/I flow based on catchment area size, Peak I/I Rate = Peak I/I Flow / Catchment Area 6 Volumetric Coefficient (Cv%): The ratio of total I/I volume and total rainfall volume, Cv% = Total I/I Flow Volume / Total Precipitation Volume * 100% 7 Peak I/ I Coefficient: The ratio of peak I/I flow and peak rainfall intensity, Peak I/ I Coefficient = Peak I/I Flow / (Peak Rainfall Intensity over Tc * Catchment Area) 8 Hourly Wet‐Weather Peaking Factor: The ratio of peak hourly wet‐weather measured flow and average dry‐weather flow, Wet‐Weather Peaking Factor = Peak Hourly Wet‐Weather Measured Flow / Average Dry-Weather Flow 9 Instantaneous Wet‐Weather Peaking Factor: The ratio of peak wet‐weather measured flow and average dry‐weather flow, Wet‐Weather Peaking Factor = Peak Wet‐Weather Measured Flow / Average Dry-Weather Flow 2
672 Civica Infrastructure Inc. www.civi.ca
Civica Infrastructures Inc. Kawartha Lakes Flow Monitoring Report
Appendix - A June 03, 2024
I/I Analysis Graph Station: L7
673 Civica Infrastructure Inc. www.civi.ca
Civica Infrastructures Inc. Kawartha Lakes Flow Monitoring Report
Appendix - A June 03, 2024
Infiltration/Inflow Event Analysis Station: L7 May 19, 2023 08:30 – May 21, 2023 03:15, Total Precipitation: 42.00 mm (4,830,000.00 L) Station Details
Storm Details
Catchment Area
11.50 ha
Total Precipitation
42.00 mm (4,830,000.00 L)
Duration of Storm
18.75 hr
Time of Concentration (Tc) 1
20 min
Peak Precipitation Intensity Over Tc 2
15.00 mm/hr
Return Period over Tc 3
< 2 Yr
Measured Flow
I/I Flow
Time of Peak Measured Flow
May 20, 2023 07:20
Time of Peak I/I Flow (TD)
May 20, 2023 07:20
Estimated Dry Weather Flow at TD
1.03 L/s
Peak Measured Flow
5.62 L/s
Peak I/I Flow 4
4.58 L/s
Peak I/I Rate 5
0.40 L/s/ha
Peak Measured Depth
84.70 mm
Total I/I Flow Volume during event
63,085.60 L
Volumetric Coefficient (Cv%) 6
1.31%
Total Measured Flow Volume during Event
172,193.20 L
Peak I/I Coefficient 7
0.0096
Hourly Wet-Weather Peaking Factor 8
3.21
Instantaneous Wet-Weather Peaking Factor 9
5.71
1
Time of Concentration (Tc): The estimated time for the flow to travel from the furthest point in the upstream area to the point of monitoring, assume flow is travelling at 1.00 m/s Peak Precipitation Intensity Over Tc: The peak rainfall intensity for the duration of the storm with the time interval defined by time of concentration 3 Return Period over Tc: The estimated time to elapse before a storm of equal or greater intensity will likely occur again, based on design storm criteria 4 Peak I/I Flow: The greatest difference captured between measured flow and estimated dry weather flow, Peak I/I Flow = Maximum (Measured Flow – Estimated Dry Weather Flow) 5 Peak I/I Rate: A normalized peak I/I flow based on catchment area size, Peak I/I Rate = Peak I/I Flow / Catchment Area 6 Volumetric Coefficient (Cv%): The ratio of total I/I volume and total rainfall volume, Cv% = Total I/I Flow Volume / Total Precipitation Volume * 100% 7 Peak I/ I Coefficient: The ratio of peak I/I flow and peak rainfall intensity, Peak I/ I Coefficient = Peak I/I Flow / (Peak Rainfall Intensity over Tc * Catchment Area) 8 Hourly Wet‐Weather Peaking Factor: The ratio of peak hourly wet‐weather measured flow and average dry‐weather flow, Wet‐Weather Peaking Factor = Peak Hourly Wet‐Weather Measured Flow / Average Dry-Weather Flow 9 Instantaneous Wet‐Weather Peaking Factor: The ratio of peak wet‐weather measured flow and average dry‐weather flow, Wet‐Weather Peaking Factor = Peak Wet‐Weather Measured Flow / Average Dry-Weather Flow 2
674 Civica Infrastructure Inc. www.civi.ca
Civica Infrastructures Inc. Kawartha Lakes Flow Monitoring Report
Appendix - A June 03, 2024
I/I Analysis Graph Station: L7
675 Civica Infrastructure Inc. www.civi.ca
Civica Infrastructures Inc. Kawartha Lakes Flow Monitoring Report
Appendix - A June 03, 2024
Infiltration/Inflow Event Analysis Station: L7 Jun 11, 2023 07:45 – Jun 13, 2023 09:00, Total Precipitation: 48.50 mm (5,577,500.00 L) Station Details
Storm Details
Catchment Area
11.50 ha
Total Precipitation
48.50 mm (5,577,500.00 L)
Duration of Storm
25.25 hr
Time of Concentration (Tc) 1
20 min
Peak Precipitation Intensity Over Tc 2
10.50 mm/hr
Return Period over Tc 3
< 2 Yr
Measured Flow
I/I Flow
Time of Peak Measured Flow
Jun 12, 2023 10:50
Time of Peak I/I Flow (TD)
Jun 12, 2023 10:50
Estimated Dry Weather Flow at TD
0.88 L/s
Peak Measured Flow
2.62 L/s
Peak I/I Flow 4
1.74 L/s
Peak I/I Rate 5
0.15 L/s/ha
Peak Measured Depth
60.30 mm
Total I/I Flow Volume during event
62,740.40 L
Volumetric Coefficient (Cv%) 6
1.13%
Total Measured Flow Volume during Event
178,322.00 L
Peak I/I Coefficient 7
0.0052
Hourly Wet-Weather Peaking Factor 8
2.83
Instantaneous Wet-Weather Peaking Factor 9
3.04
1
Time of Concentration (Tc): The estimated time for the flow to travel from the furthest point in the upstream area to the point of monitoring, assume flow is travelling at 1.00 m/s Peak Precipitation Intensity Over Tc: The peak rainfall intensity for the duration of the storm with the time interval defined by time of concentration 3 Return Period over Tc: The estimated time to elapse before a storm of equal or greater intensity will likely occur again, based on design storm criteria 4 Peak I/I Flow: The greatest difference captured between measured flow and estimated dry weather flow, Peak I/I Flow = Maximum (Measured Flow – Estimated Dry Weather Flow) 5 Peak I/I Rate: A normalized peak I/I flow based on catchment area size, Peak I/I Rate = Peak I/I Flow / Catchment Area 6 Volumetric Coefficient (Cv%): The ratio of total I/I volume and total rainfall volume, Cv% = Total I/I Flow Volume / Total Precipitation Volume * 100% 7 Peak I/ I Coefficient: The ratio of peak I/I flow and peak rainfall intensity, Peak I/ I Coefficient = Peak I/I Flow / (Peak Rainfall Intensity over Tc * Catchment Area) 8 Hourly Wet‐Weather Peaking Factor: The ratio of peak hourly wet‐weather measured flow and average dry‐weather flow, Wet‐Weather Peaking Factor = Peak Hourly Wet‐Weather Measured Flow / Average Dry-Weather Flow 9 Instantaneous Wet‐Weather Peaking Factor: The ratio of peak wet‐weather measured flow and average dry‐weather flow, Wet‐Weather Peaking Factor = Peak Wet‐Weather Measured Flow / Average Dry-Weather Flow 2
676 Civica Infrastructure Inc. www.civi.ca
Civica Infrastructures Inc. Kawartha Lakes Flow Monitoring Report
Appendix - A June 03, 2024
I/I Analysis Graph Station: L7
677 Civica Infrastructure Inc. www.civi.ca
Civica Infrastructures Inc. Kawartha Lakes Flow Monitoring Report
Appendix - A June 03, 2024
Infiltration/Inflow Event Analysis Station: L7 Jun 22, 2023 17:40 – Jun 25, 2023 01:45, Total Precipitation: 19.75 mm (2,271,250.00 L) Station Details
Storm Details
Catchment Area
11.50 ha
Total Precipitation
19.75 mm (2,271,250.00 L)
Duration of Storm
32.08 hr
Time of Concentration (Tc) 1
20 min
Peak Precipitation Intensity Over Tc 2
30.00 mm/hr
Return Period over Tc 3
< 2 Yr
Measured Flow
I/I Flow
Time of Peak Measured Flow
Jun 23, 2023 16:00
Time of Peak I/I Flow (TD)
Jun 23, 2023 16:00
Estimated Dry Weather Flow at TD
0.95 L/s
Peak Measured Flow
2.25 L/s
Peak I/I Flow 4
1.30 L/s
Peak I/I Rate 5
0.11 L/s/ha
Peak Measured Depth
56.30 mm
Total I/I Flow Volume during event
16,837.60 L
Volumetric Coefficient (Cv%) 6
0.74%
Total Measured Flow Volume during Event
145,877.40 L
Peak I/I Coefficient 7
0.0014
Hourly Wet-Weather Peaking Factor 8
2.12
Instantaneous Wet-Weather Peaking Factor 9
2.77
1
Time of Concentration (Tc): The estimated time for the flow to travel from the furthest point in the upstream area to the point of monitoring, assume flow is travelling at 1.00 m/s Peak Precipitation Intensity Over Tc: The peak rainfall intensity for the duration of the storm with the time interval defined by time of concentration 3 Return Period over Tc: The estimated time to elapse before a storm of equal or greater intensity will likely occur again, based on design storm criteria 4 Peak I/I Flow: The greatest difference captured between measured flow and estimated dry weather flow, Peak I/I Flow = Maximum (Measured Flow – Estimated Dry Weather Flow) 5 Peak I/I Rate: A normalized peak I/I flow based on catchment area size, Peak I/I Rate = Peak I/I Flow / Catchment Area 6 Volumetric Coefficient (Cv%): The ratio of total I/I volume and total rainfall volume, Cv% = Total I/I Flow Volume / Total Precipitation Volume * 100% 7 Peak I/ I Coefficient: The ratio of peak I/I flow and peak rainfall intensity, Peak I/ I Coefficient = Peak I/I Flow / (Peak Rainfall Intensity over Tc * Catchment Area) 8 Hourly Wet‐Weather Peaking Factor: The ratio of peak hourly wet‐weather measured flow and average dry‐weather flow, Wet‐Weather Peaking Factor = Peak Hourly Wet‐Weather Measured Flow / Average Dry-Weather Flow 9 Instantaneous Wet‐Weather Peaking Factor: The ratio of peak wet‐weather measured flow and average dry‐weather flow, Wet‐Weather Peaking Factor = Peak Wet‐Weather Measured Flow / Average Dry-Weather Flow 2
678 Civica Infrastructure Inc. www.civi.ca
Civica Infrastructures Inc. Kawartha Lakes Flow Monitoring Report
Appendix - A June 03, 2024
I/I Analysis Graph Station: L7
679 Civica Infrastructure Inc. www.civi.ca
Civica Infrastructures Inc. Kawartha Lakes Flow Monitoring Report
Appendix - A June 03, 2024
Infiltration/Inflow Event Analysis Station: L7 Jun 26, 2023 20:55 – Jun 28, 2023 02:40, Total Precipitation: 30.50 mm (3,507,500.00 L) Station Details
Storm Details
Catchment Area
11.50 ha
Total Precipitation
30.50 mm (3,507,500.00 L)
Duration of Storm
5.75 hr
Time of Concentration (Tc) 1
20 min
Peak Precipitation Intensity Over Tc 2
16.50 mm/hr
Return Period over Tc 3
< 2 Yr
Measured Flow
I/I Flow
Time of Peak Measured Flow
Jun 27, 2023 13:15
Time of Peak I/I Flow (TD)
Jun 27, 2023 13:15
Estimated Dry Weather Flow at TD
0.88 L/s
Peak Measured Flow
4.10 L/s
Peak I/I Flow 4
3.22 L/s
Peak I/I Rate 5
0.28 L/s/ha
Peak Measured Depth
73.70 mm
Total I/I Flow Volume during event
56,380.40 L
Volumetric Coefficient (Cv%) 6
1.61%
Total Measured Flow Volume during Event
113,844.00 L
Peak I/I Coefficient 7
0.0061
Hourly Wet-Weather Peaking Factor 8
4.19
Instantaneous Wet-Weather Peaking Factor 9
4.58
1
Time of Concentration (Tc): The estimated time for the flow to travel from the furthest point in the upstream area to the point of monitoring, assume flow is travelling at 1.00 m/s Peak Precipitation Intensity Over Tc: The peak rainfall intensity for the duration of the storm with the time interval defined by time of concentration 3 Return Period over Tc: The estimated time to elapse before a storm of equal or greater intensity will likely occur again, based on design storm criteria 4 Peak I/I Flow: The greatest difference captured between measured flow and estimated dry weather flow, Peak I/I Flow = Maximum (Measured Flow – Estimated Dry Weather Flow) 5 Peak I/I Rate: A normalized peak I/I flow based on catchment area size, Peak I/I Rate = Peak I/I Flow / Catchment Area 6 Volumetric Coefficient (Cv%): The ratio of total I/I volume and total rainfall volume, Cv% = Total I/I Flow Volume / Total Precipitation Volume * 100% 7 Peak I/ I Coefficient: The ratio of peak I/I flow and peak rainfall intensity, Peak I/ I Coefficient = Peak I/I Flow / (Peak Rainfall Intensity over Tc * Catchment Area) 8 Hourly Wet‐Weather Peaking Factor: The ratio of peak hourly wet‐weather measured flow and average dry‐weather flow, Wet‐Weather Peaking Factor = Peak Hourly Wet‐Weather Measured Flow / Average Dry-Weather Flow 9 Instantaneous Wet‐Weather Peaking Factor: The ratio of peak wet‐weather measured flow and average dry‐weather flow, Wet‐Weather Peaking Factor = Peak Wet‐Weather Measured Flow / Average Dry-Weather Flow 2
680 Civica Infrastructure Inc. www.civi.ca
Civica Infrastructures Inc. Kawartha Lakes Flow Monitoring Report
Appendix - A June 03, 2024
I/I Analysis Graph Station: L7
681 Civica Infrastructure Inc. www.civi.ca
Civica Infrastructures Inc. Kawartha Lakes Flow Monitoring Report
Appendix - A June 03, 2024
Infiltration/Inflow Event Analysis Station: L7 Jul 12, 2023 14:45 – Jul 13, 2023 18:50, Total Precipitation: 15.00 mm (1,725,000.00 L) Station Details
Storm Details
Catchment Area
11.50 ha
Total Precipitation
15.00 mm (1,725,000.00 L)
Duration of Storm
4.08 hr
Time of Concentration (Tc) 1
20 min
Peak Precipitation Intensity Over Tc 2
10.50 mm/hr
Return Period over Tc 3
< 2 Yr
Measured Flow
I/I Flow
Time of Peak Measured Flow
Jul 13, 2023 04:35
Time of Peak I/I Flow (TD)
Jul 13, 2023 04:35
Estimated Dry Weather Flow at TD
0.81 L/s
Peak Measured Flow
2.29 L/s
Peak I/I Flow 4
1.48 L/s
Peak I/I Rate 5
0.13 L/s/ha
Peak Measured Depth
56.70 mm
Total I/I Flow Volume during event
9,283.30 L
Volumetric Coefficient (Cv%) 6
0.54%
Total Measured Flow Volume during Event
61,058.80 L
Peak I/I Coefficient 7
0.0044
Hourly Wet-Weather Peaking Factor 8
1.71
Instantaneous Wet-Weather Peaking Factor 9
2.57
1
Time of Concentration (Tc): The estimated time for the flow to travel from the furthest point in the upstream area to the point of monitoring, assume flow is travelling at 1.00 m/s Peak Precipitation Intensity Over Tc: The peak rainfall intensity for the duration of the storm with the time interval defined by time of concentration 3 Return Period over Tc: The estimated time to elapse before a storm of equal or greater intensity will likely occur again, based on design storm criteria 4 Peak I/I Flow: The greatest difference captured between measured flow and estimated dry weather flow, Peak I/I Flow = Maximum (Measured Flow – Estimated Dry Weather Flow) 5 Peak I/I Rate: A normalized peak I/I flow based on catchment area size, Peak I/I Rate = Peak I/I Flow / Catchment Area 6 Volumetric Coefficient (Cv%): The ratio of total I/I volume and total rainfall volume, Cv% = Total I/I Flow Volume / Total Precipitation Volume * 100% 7 Peak I/ I Coefficient: The ratio of peak I/I flow and peak rainfall intensity, Peak I/ I Coefficient = Peak I/I Flow / (Peak Rainfall Intensity over Tc * Catchment Area) 8 Hourly Wet‐Weather Peaking Factor: The ratio of peak hourly wet‐weather measured flow and average dry‐weather flow, Wet‐Weather Peaking Factor = Peak Hourly Wet‐Weather Measured Flow / Average Dry-Weather Flow 9 Instantaneous Wet‐Weather Peaking Factor: The ratio of peak wet‐weather measured flow and average dry‐weather flow, Wet‐Weather Peaking Factor = Peak Wet‐Weather Measured Flow / Average Dry-Weather Flow 2
682 Civica Infrastructure Inc. www.civi.ca
Civica Infrastructures Inc. Kawartha Lakes Flow Monitoring Report
Appendix - A June 03, 2024
I/I Analysis Graph Station: L7
683 Civica Infrastructure Inc. www.civi.ca
Civica Infrastructures Inc. Kawartha Lakes Flow Monitoring Report
Appendix - A June 03, 2024
Infiltration/Inflow Event Analysis Station: L7 Jul 14, 2023 23:20 – Jul 16, 2023 18:00, Total Precipitation: 16.25 mm (1,868,750.00 L) Station Details
Storm Details
Catchment Area
11.50 ha
Total Precipitation
16.25 mm (1,868,750.00 L)
Duration of Storm
18.67 hr
Time of Concentration (Tc) 1
20 min
Peak Precipitation Intensity Over Tc 2
30.70 mm/hr
Return Period over Tc 3
< 2 Yr
Measured Flow
I/I Flow
Time of Peak Measured Flow
Jul 16, 2023 15:10
Time of Peak I/I Flow (TD)
Jul 16, 2023 15:10
Estimated Dry Weather Flow at TD
0.93 L/s
Peak Measured Flow
2.03 L/s
Peak I/I Flow 4
1.10 L/s
Peak I/I Rate 5
0.10 L/s/ha
Peak Measured Depth
53.70 mm
Total I/I Flow Volume during event
18,405.30 L
Volumetric Coefficient (Cv%) 6
0.99%
Total Measured Flow Volume during Event
116,024.90 L
Peak I/I Coefficient 7
0.0011
Hourly Wet-Weather Peaking Factor 8
1.65
Instantaneous Wet-Weather Peaking Factor 9
2.30
1
Time of Concentration (Tc): The estimated time for the flow to travel from the furthest point in the upstream area to the point of monitoring, assume flow is travelling at 1.00 m/s Peak Precipitation Intensity Over Tc: The peak rainfall intensity for the duration of the storm with the time interval defined by time of concentration 3 Return Period over Tc: The estimated time to elapse before a storm of equal or greater intensity will likely occur again, based on design storm criteria 4 Peak I/I Flow: The greatest difference captured between measured flow and estimated dry weather flow, Peak I/I Flow = Maximum (Measured Flow – Estimated Dry Weather Flow) 5 Peak I/I Rate: A normalized peak I/I flow based on catchment area size, Peak I/I Rate = Peak I/I Flow / Catchment Area 6 Volumetric Coefficient (Cv%): The ratio of total I/I volume and total rainfall volume, Cv% = Total I/I Flow Volume / Total Precipitation Volume * 100% 7 Peak I/ I Coefficient: The ratio of peak I/I flow and peak rainfall intensity, Peak I/ I Coefficient = Peak I/I Flow / (Peak Rainfall Intensity over Tc * Catchment Area) 8 Hourly Wet‐Weather Peaking Factor: The ratio of peak hourly wet‐weather measured flow and average dry‐weather flow, Wet‐Weather Peaking Factor = Peak Hourly Wet‐Weather Measured Flow / Average Dry-Weather Flow 9 Instantaneous Wet‐Weather Peaking Factor: The ratio of peak wet‐weather measured flow and average dry‐weather flow, Wet‐Weather Peaking Factor = Peak Wet‐Weather Measured Flow / Average Dry-Weather Flow 2
684 Civica Infrastructure Inc. www.civi.ca
Civica Infrastructures Inc. Kawartha Lakes Flow Monitoring Report
Appendix - A June 03, 2024
I/I Analysis Graph Station: L7
685 Civica Infrastructure Inc. www.civi.ca
Civica Infrastructures Inc. Kawartha Lakes Flow Monitoring Report
Appendix - A June 03, 2024
Infiltration/Inflow Event Analysis Station: L7 Jul 20, 2023 07:10 – Jul 21, 2023 09:10, Total Precipitation: 19.75 mm (2,271,250.00 L) Station Details
Storm Details
Catchment Area
11.50 ha
Total Precipitation
19.75 mm (2,271,250.00 L)
Duration of Storm
2.00 hr
Time of Concentration (Tc) 1
20 min
Peak Precipitation Intensity Over Tc 2
38.20 mm/hr
Return Period over Tc 3
< 2 Yr
Measured Flow
I/I Flow
Time of Peak Measured Flow
Jul 21, 2023 08:55
Time of Peak I/I Flow (TD)
Jul 21, 2023 08:55
Estimated Dry Weather Flow at TD
0.89 L/s
Peak Measured Flow
3.85 L/s
Peak I/I Flow 4
2.96 L/s
Peak I/I Rate 5
0.26 L/s/ha
Peak Measured Depth
71.70 mm
Total I/I Flow Volume during event
3,804.50 L
Volumetric Coefficient (Cv%) 6
0.17%
Total Measured Flow Volume during Event
45,624.10 L
Peak I/I Coefficient 7
0.0024
Hourly Wet-Weather Peaking Factor 8
1.39
Instantaneous Wet-Weather Peaking Factor 9
4.67
1
Time of Concentration (Tc): The estimated time for the flow to travel from the furthest point in the upstream area to the point of monitoring, assume flow is travelling at 1.00 m/s Peak Precipitation Intensity Over Tc: The peak rainfall intensity for the duration of the storm with the time interval defined by time of concentration 3 Return Period over Tc: The estimated time to elapse before a storm of equal or greater intensity will likely occur again, based on design storm criteria 4 Peak I/I Flow: The greatest difference captured between measured flow and estimated dry weather flow, Peak I/I Flow = Maximum (Measured Flow – Estimated Dry Weather Flow) 5 Peak I/I Rate: A normalized peak I/I flow based on catchment area size, Peak I/I Rate = Peak I/I Flow / Catchment Area 6 Volumetric Coefficient (Cv%): The ratio of total I/I volume and total rainfall volume, Cv% = Total I/I Flow Volume / Total Precipitation Volume * 100% 7 Peak I/ I Coefficient: The ratio of peak I/I flow and peak rainfall intensity, Peak I/ I Coefficient = Peak I/I Flow / (Peak Rainfall Intensity over Tc * Catchment Area) 8 Hourly Wet‐Weather Peaking Factor: The ratio of peak hourly wet‐weather measured flow and average dry‐weather flow, Wet‐Weather Peaking Factor = Peak Hourly Wet‐Weather Measured Flow / Average Dry-Weather Flow 9 Instantaneous Wet‐Weather Peaking Factor: The ratio of peak wet‐weather measured flow and average dry‐weather flow, Wet‐Weather Peaking Factor = Peak Wet‐Weather Measured Flow / Average Dry-Weather Flow 2
686 Civica Infrastructure Inc. www.civi.ca
Civica Infrastructures Inc. Kawartha Lakes Flow Monitoring Report
Appendix - A June 03, 2024
I/I Analysis Graph Station: L7
687 Civica Infrastructure Inc. www.civi.ca
Civica Infrastructures Inc. Kawartha Lakes Flow Monitoring Report
Appendix - A June 03, 2024
Infiltration/Inflow Event Analysis Station: L7 Aug 03, 2023 04:10 – Aug 04, 2023 15:25, Total Precipitation: 39.25 mm (4,513,750.00 L) Station Details
Storm Details
Catchment Area
11.50 ha
Total Precipitation
39.25 mm (4,513,750.00 L)
Duration of Storm
11.25 hr
Time of Concentration (Tc) 1
20 min
Peak Precipitation Intensity Over Tc 2
83.20 mm/hr
Return Period over Tc 3
10 - 25 Yr
Measured Flow
I/I Flow
Time of Peak Measured Flow
Aug 03, 2023 20:00
Time of Peak I/I Flow (TD)
Aug 03, 2023 20:00
Estimated Dry Weather Flow at TD
0.91 L/s
Peak Measured Flow
2.96 L/s
Peak I/I Flow 4
2.04 L/s
Peak I/I Rate 5
0.18 L/s/ha
Peak Measured Depth
63.70 mm
Total I/I Flow Volume during event
31,918.00 L
Volumetric Coefficient (Cv%) 6
0.71%
Total Measured Flow Volume during Event
105,731.10 L
Peak I/I Coefficient 7
0.0008
Hourly Wet-Weather Peaking Factor 8
2.45
Instantaneous Wet-Weather Peaking Factor 9
3.36
1
Time of Concentration (Tc): The estimated time for the flow to travel from the furthest point in the upstream area to the point of monitoring, assume flow is travelling at 1.00 m/s Peak Precipitation Intensity Over Tc: The peak rainfall intensity for the duration of the storm with the time interval defined by time of concentration 3 Return Period over Tc: The estimated time to elapse before a storm of equal or greater intensity will likely occur again, based on design storm criteria 4 Peak I/I Flow: The greatest difference captured between measured flow and estimated dry weather flow, Peak I/I Flow = Maximum (Measured Flow – Estimated Dry Weather Flow) 5 Peak I/I Rate: A normalized peak I/I flow based on catchment area size, Peak I/I Rate = Peak I/I Flow / Catchment Area 6 Volumetric Coefficient (Cv%): The ratio of total I/I volume and total rainfall volume, Cv% = Total I/I Flow Volume / Total Precipitation Volume * 100% 7 Peak I/ I Coefficient: The ratio of peak I/I flow and peak rainfall intensity, Peak I/ I Coefficient = Peak I/I Flow / (Peak Rainfall Intensity over Tc * Catchment Area) 8 Hourly Wet‐Weather Peaking Factor: The ratio of peak hourly wet‐weather measured flow and average dry‐weather flow, Wet‐Weather Peaking Factor = Peak Hourly Wet‐Weather Measured Flow / Average Dry-Weather Flow 9 Instantaneous Wet‐Weather Peaking Factor: The ratio of peak wet‐weather measured flow and average dry‐weather flow, Wet‐Weather Peaking Factor = Peak Wet‐Weather Measured Flow / Average Dry-Weather Flow 2
688 Civica Infrastructure Inc. www.civi.ca
Civica Infrastructures Inc. Kawartha Lakes Flow Monitoring Report
Appendix - A June 03, 2024
I/I Analysis Graph Station: L7
689 Civica Infrastructure Inc. www.civi.ca
Civica Infrastructures Inc. Kawartha Lakes Flow Monitoring Report
Appendix - A June 03, 2024
Infiltration/Inflow Event Analysis Station: L7 Aug 17, 2023 10:30 – Aug 19, 2023 08:20, Total Precipitation: 19.75 mm (2,271,250.00 L) Station Details
Storm Details
Catchment Area
11.50 ha
Total Precipitation
19.75 mm (2,271,250.00 L)
Duration of Storm
21.83 hr
Time of Concentration (Tc) 1
20 min
Peak Precipitation Intensity Over Tc 2
21.00 mm/hr
Return Period over Tc 3
< 2 Yr
Measured Flow
I/I Flow
Time of Peak Measured Flow
Aug 18, 2023 13:15
Time of Peak I/I Flow (TD)
Aug 18, 2023 13:35
Estimated Dry Weather Flow at TD
0.93 L/s
Peak Measured Flow
2.47 L/s
Peak I/I Flow 4
1.54 L/s
Peak I/I Rate 5
0.13 L/s/ha
Peak Measured Depth
58.70 mm
Total I/I Flow Volume during event
18,433.40 L
Volumetric Coefficient (Cv%) 6
0.81%
Total Measured Flow Volume during Event
116,198.20 L
Peak I/I Coefficient 7
0.0023
Hourly Wet-Weather Peaking Factor 8
2.71
Instantaneous Wet-Weather Peaking Factor 9
3.08
1
Time of Concentration (Tc): The estimated time for the flow to travel from the furthest point in the upstream area to the point of monitoring, assume flow is travelling at 1.00 m/s Peak Precipitation Intensity Over Tc: The peak rainfall intensity for the duration of the storm with the time interval defined by time of concentration 3 Return Period over Tc: The estimated time to elapse before a storm of equal or greater intensity will likely occur again, based on design storm criteria 4 Peak I/I Flow: The greatest difference captured between measured flow and estimated dry weather flow, Peak I/I Flow = Maximum (Measured Flow – Estimated Dry Weather Flow) 5 Peak I/I Rate: A normalized peak I/I flow based on catchment area size, Peak I/I Rate = Peak I/I Flow / Catchment Area 6 Volumetric Coefficient (Cv%): The ratio of total I/I volume and total rainfall volume, Cv% = Total I/I Flow Volume / Total Precipitation Volume * 100% 7 Peak I/ I Coefficient: The ratio of peak I/I flow and peak rainfall intensity, Peak I/ I Coefficient = Peak I/I Flow / (Peak Rainfall Intensity over Tc * Catchment Area) 8 Hourly Wet‐Weather Peaking Factor: The ratio of peak hourly wet‐weather measured flow and average dry‐weather flow, Wet‐Weather Peaking Factor = Peak Hourly Wet‐Weather Measured Flow / Average Dry-Weather Flow 9 Instantaneous Wet‐Weather Peaking Factor: The ratio of peak wet‐weather measured flow and average dry‐weather flow, Wet‐Weather Peaking Factor = Peak Wet‐Weather Measured Flow / Average Dry-Weather Flow 2
690 Civica Infrastructure Inc. www.civi.ca
Civica Infrastructures Inc. Kawartha Lakes Flow Monitoring Report
Appendix - A June 03, 2024
I/I Analysis Graph Station: L7
691 Civica Infrastructure Inc. www.civi.ca
Civica Infrastructures Inc. Kawartha Lakes Flow Monitoring Report
Appendix - A June 03, 2024
Infiltration/Inflow Event Analysis Station: L7 Sep 07, 2023 03:10 – Sep 08, 2023 03:50, Total Precipitation: 24.50 mm (2,817,500.00 L) Station Details
Storm Details
Catchment Area
11.50 ha
Total Precipitation
24.50 mm (2,817,500.00 L)
Duration of Storm
0.67 hr
Time of Concentration (Tc) 1
20 min
Peak Precipitation Intensity Over Tc 2
57.00 mm/hr
Return Period over Tc 3
< 2 Yr
Measured Flow
I/I Flow
Time of Peak Measured Flow
Sep 07, 2023 15:45
Time of Peak I/I Flow (TD)
Sep 07, 2023 15:45
Estimated Dry Weather Flow at TD
0.97 L/s
Peak Measured Flow
2.86 L/s
Peak I/I Flow 4
1.88 L/s
Peak I/I Rate 5
0.16 L/s/ha
Peak Measured Depth
62.70 mm
Total I/I Flow Volume during event
6,069.80 L
Volumetric Coefficient (Cv%) 6
0.22%
Total Measured Flow Volume during Event
44,296.10 L
Peak I/I Coefficient 7
0.0010
Hourly Wet-Weather Peaking Factor 8
2.43
Instantaneous Wet-Weather Peaking Factor 9
3.43
1
Time of Concentration (Tc): The estimated time for the flow to travel from the furthest point in the upstream area to the point of monitoring, assume flow is travelling at 1.00 m/s Peak Precipitation Intensity Over Tc: The peak rainfall intensity for the duration of the storm with the time interval defined by time of concentration 3 Return Period over Tc: The estimated time to elapse before a storm of equal or greater intensity will likely occur again, based on design storm criteria 4 Peak I/I Flow: The greatest difference captured between measured flow and estimated dry weather flow, Peak I/I Flow = Maximum (Measured Flow – Estimated Dry Weather Flow) 5 Peak I/I Rate: A normalized peak I/I flow based on catchment area size, Peak I/I Rate = Peak I/I Flow / Catchment Area 6 Volumetric Coefficient (Cv%): The ratio of total I/I volume and total rainfall volume, Cv% = Total I/I Flow Volume / Total Precipitation Volume * 100% 7 Peak I/ I Coefficient: The ratio of peak I/I flow and peak rainfall intensity, Peak I/ I Coefficient = Peak I/I Flow / (Peak Rainfall Intensity over Tc * Catchment Area) 8 Hourly Wet‐Weather Peaking Factor: The ratio of peak hourly wet‐weather measured flow and average dry‐weather flow, Wet‐Weather Peaking Factor = Peak Hourly Wet‐Weather Measured Flow / Average Dry-Weather Flow 9 Instantaneous Wet‐Weather Peaking Factor: The ratio of peak wet‐weather measured flow and average dry‐weather flow, Wet‐Weather Peaking Factor = Peak Wet‐Weather Measured Flow / Average Dry-Weather Flow 2
692 Civica Infrastructure Inc. www.civi.ca
Civica Infrastructures Inc. Kawartha Lakes Flow Monitoring Report
Appendix - A June 03, 2024
Activity Log Station: L7 Date Time
Type
Purpose of Visit
Comment
23-Jan-2023 01:35:00 PM
Installation Log
INSTALLATION
01-Mar-2023 02:10:00 PM
Maintenance Log
CALIBRATION
09-May-2023 01:42:00 PM
Maintenance Log
CALIBRATION
DOWNLOADED DATA, SENT TELEMETRY, MADE ENTRY, TOOK PHOTOS/VIDEOS, TOOK MEASUREMENTS, CALIBRATED SITE
Yes
Yes
Yes
TC SETUP, PHOTOS TAKEN,VIDEOS TAKEN,SENSOR INSTALLED,FLUME INSTALLLED,LOGGER STARTED,ANTENNA DRILLED TC SET,DATA DOWNLOADED,TELEMETRY SENT,DEBRIS AND SILT REMOVED,SITE CALIBRATED,ANTENNA IN GOOD CONDITION,PHOTOS AND VIDEOS TAKEN
21-Jul-2023 11:05:00 AM
Maintenance Log
CALIBRATION
TC SET,SURVEY SENT,DATA DOWNLOADED,TELEMETRY SENT,ANTENNA CHECKED,ENTRY MADE, DEBRIS AND SILT CLEARED,LIDOTT WAS NOT LEVELED UPON ARRIVAL, LIDOTT LEVELED, CALIBRATION DONE,MEASUREMENTS NOTED,SITE CLEARED
04-Oct-2023 09:05:00 AM
Removal Log
REMOVAL
TRAFFIC CONTROL SENT, DATA DOWNLOADED, TELEMETRY SENT, CALIBRATION DONE, EQUIPMENT REMOVED, LOGGER TAG, PHOTOS AND VIDEOS BEFORE AND AFTER TAKEN.
693 Civica Infrastructure Inc. www.civi.ca
Calibration Measurement Yes Yes
Civica Infrastructures Inc. Kawartha Lakes Flow Monitoring Report
Appendix - A June 03, 2024
Aggregate Data Station: L8
Precipitation Date From
Date To
Days
Min (mm)
Avg (mm)
Max (mm)
Sum (mm)
Count
Time of Min1
Time of Max1
Jan 11, 2023
Jul 21, 2023
192
0.00
0.01
11.25
553.50
55,206
Wed Jan 11, 2023 00:00
Mon Jun 26, 2023 03:05
Level Date From
Date To
Days
Min (m)
Avg (m)
Max (m)
Count
Time of Min1
Time of Max1
Jan 11, 2023
Jul 21, 2023
192
0.04
0.08
0.13
54,999
Thu Mar 02, 2023 04:15
Sat May 20, 2023 10:35
Velocity Date From
Date To
Days
Min (m/s)
Avg (m/s)
Max (m/s)
Count
Time of Min1
Time of Max1
Jan 11, 2023
Jul 21, 2023
192
0.02
0.37
0.95
54,999
Wed Mar 08, 2023 05:15
Sat Apr 01, 2023 02:45
Flow
1
Date From
Date To
Days
Min (L/s)
Avg (L/s)
Max (L/s)
Total Volume (1,000,000 L)
Count
Time of Min1
Time of Max1
Jan 11, 2023
Jul 21, 2023
192
0.19
7.54
37.07
124.46
54,999
Thu Mar 02, 2023 04:15
Sat May 20, 2023 10:35
Time of Min and Time of Max will be displayed by first occurrence
694 Civica Infrastructure Inc. www.civi.ca
Civica Infrastructures Inc. Kawartha Lakes Flow Monitoring Report
Appendix - A June 03, 2024
Data Chart Station: L8 Jan 11, 2023 – Jan 31, 2023
695 Civica Infrastructure Inc. www.civi.ca
Civica Infrastructures Inc. Kawartha Lakes Flow Monitoring Report
Appendix - A June 03, 2024
Data Chart Station: L8 Feb 01, 2023 – Feb 28, 2023
696 Civica Infrastructure Inc. www.civi.ca
Civica Infrastructures Inc. Kawartha Lakes Flow Monitoring Report
Appendix - A June 03, 2024
Data Chart Station: L8 Mar 01, 2023 – Mar 31, 2023
697 Civica Infrastructure Inc. www.civi.ca
Civica Infrastructures Inc. Kawartha Lakes Flow Monitoring Report
Appendix - A June 03, 2024
Data Chart Station: L8 Apr 01, 2023 – Apr 30, 2023
698 Civica Infrastructure Inc. www.civi.ca
Civica Infrastructures Inc. Kawartha Lakes Flow Monitoring Report
Appendix - A June 03, 2024
Data Chart Station: L8 May 01, 2023 – May 31, 2023
699 Civica Infrastructure Inc. www.civi.ca
Civica Infrastructures Inc. Kawartha Lakes Flow Monitoring Report
Appendix - A June 03, 2024
Data Chart Station: L8 Jun 01, 2023 – Jun 30, 2023
700 Civica Infrastructure Inc. www.civi.ca
Civica Infrastructures Inc. Kawartha Lakes Flow Monitoring Report
Appendix - A June 03, 2024
Data Chart Station: L8 Jul 01, 2023 – Jul 21, 2023
701 Civica Infrastructure Inc. www.civi.ca
Civica Infrastructures Inc. Kawartha Lakes Flow Monitoring Report
Appendix - A June 03, 2024
Sanitary Report Station: L8
1
Average Dry Weather Flow (L/s)
Average Dry Weather Flow (L/c/d)
Average Daily Minimum Dry Weather Flow (L/s)
Average Daily Peak Dry Weather Flow (L/s)
6.713
785.898
2.173
14.345
Peaking Factor
Groundwater Infiltration (L/s)1
Groundwater Infiltration (L/ha/d)
% of GWI in Average DWF
2.137
1.847
1,025.571
27.514
Groundwater infiltration (GWI) is assumed as 85% of the daily minimum flow averaged over the monitoring period
702 Civica Infrastructure Inc. www.civi.ca
Civica Infrastructures Inc. Kawartha Lakes Flow Monitoring Report
Appendix - A June 03, 2024
I/I Analysis Table
1
Event1
Total Precipitation (mm)
Duration (hours)
Peak Intensity Over Tc at Station (mm/hr)
Feb 09, 2023
35.75
21.58
Mar 16, 2023
20.75
Mar 31, 2023
L8 Measured Peak Flow (L/s)
Peak I/I Flow (L/s)
Peak I/I Rate (L/s/ha)
Volumetric Runoff Coefficient (CV%)
Peaking Factor (PF)
6.00
27.00
20.22
0.13
0.94 %
2.85
20.17
3.40
28.24
17.37
0.11
3.15 %
2.43
29.25
16.00
7.50
28.56
23.96
0.15
1.65 %
2.61
Apr 05, 2023
21.75
16.42
8.20
26.36
15.82
0.10
1.29 %
1.86
Apr 16, 2023
17.25
4.08
9.00
15.98
9.44
0.06
0.67 %
1.31
Apr 28, 2023
40.25
51.42
6.00
22.39
14.66
0.09
1.17 %
2.13
May 19, 2023
47.50
19.33
10.50
37.07
27.67
0.18
0.97 %
4.47
Jun 11, 2023
55.25
25.17
10.50
29.05
21.36
0.14
0.91 %
3.72
Jun 26, 2023
41.50
8.33
39.00
35.95
27.66
0.18
0.56 %
3.99
Jun 27, 2023
27.75
5.92
9.80
31.30
22.70
0.15
1.16 %
3.38
Jul 13, 2023
20.25
4.17
11.60
16.19
13.77
0.09
0.28 %
2.41
Jul 20, 2023
16.50
2.33
20.60
18.89
12.34
0.08
0.12 %
3.60
Average
31.15
16.24
11.84
26.42
18.91
0.12
1.07 %
2.90
Maximum
55.25
51.42
39.00
37.07
27.67
0.18
3.15 %
4.47
Flow KPIs
Measured Storms
Station: L8
An event is a storm with a minimum volume of 15mm and a minimum inter-event dry period of 12 hours
703 Civica Infrastructure Inc. www.civi.ca
Civica Infrastructures Inc. Kawartha Lakes Flow Monitoring Report
Appendix - A June 03, 2024
I/I Analysis Graph Station: L8
704 Civica Infrastructure Inc. www.civi.ca
Civica Infrastructures Inc. Kawartha Lakes Flow Monitoring Report
Appendix - A June 03, 2024
Infiltration/Inflow Event Analysis Station: L8 Feb 08, 2023 20:55 – Feb 10, 2023 18:30, Total Precipitation: 35.75 mm (55,627,000.00 L) Station Details
Storm Details
Catchment Area
155.60 ha
Total Precipitation
35.75 mm (55,627,000.00 L)
Duration of Storm
21.58 hr
Time of Concentration (Tc) 1
40 min
Peak Precipitation Intensity Over Tc 2
6.00 mm/hr
Return Period over Tc 3
< 2 Yr
Measured Flow
I/I Flow
Time of Peak Measured Flow
Feb 09, 2023 17:55
Time of Peak I/I Flow (TD)
Feb 09, 2023 23:50
Estimated Dry Weather Flow at TD
4.77 L/s
Peak Measured Flow
27.00 L/s
Peak I/I Flow 4
20.22 L/s
Peak I/I Rate 5
0.13 L/s/ha
Peak Measured Depth
116.00 mm
Total I/I Flow Volume during event
523,893.40 L
Volumetric Coefficient (Cv%) 6
0.94%
Total Measured Flow Volume during Event
1,382,363.50 L
Peak I/I Coefficient 7
0.0078
Hourly Wet-Weather Peaking Factor 8
2.85
Instantaneous Wet-Weather Peaking Factor 9
3.81
1
Time of Concentration (Tc): The estimated time for the flow to travel from the furthest point in the upstream area to the point of monitoring, assume flow is travelling at 1.00 m/s Peak Precipitation Intensity Over Tc: The peak rainfall intensity for the duration of the storm with the time interval defined by time of concentration 3 Return Period over Tc: The estimated time to elapse before a storm of equal or greater intensity will likely occur again, based on design storm criteria 4 Peak I/I Flow: The greatest difference captured between measured flow and estimated dry weather flow, Peak I/I Flow = Maximum (Measured Flow – Estimated Dry Weather Flow) 5 Peak I/I Rate: A normalized peak I/I flow based on catchment area size, Peak I/I Rate = Peak I/I Flow / Catchment Area 6 Volumetric Coefficient (Cv%): The ratio of total I/I volume and total rainfall volume, Cv% = Total I/I Flow Volume / Total Precipitation Volume * 100% 7 Peak I/ I Coefficient: The ratio of peak I/I flow and peak rainfall intensity, Peak I/ I Coefficient = Peak I/I Flow / (Peak Rainfall Intensity over Tc * Catchment Area) 8 Hourly Wet‐Weather Peaking Factor: The ratio of peak hourly wet‐weather measured flow and average dry‐weather flow, Wet‐Weather Peaking Factor = Peak Hourly Wet‐Weather Measured Flow / Average Dry-Weather Flow 9 Instantaneous Wet‐Weather Peaking Factor: The ratio of peak wet‐weather measured flow and average dry‐weather flow, Wet‐Weather Peaking Factor = Peak Wet‐Weather Measured Flow / Average Dry-Weather Flow 2
705 Civica Infrastructure Inc. www.civi.ca
Civica Infrastructures Inc. Kawartha Lakes Flow Monitoring Report
Appendix - A June 03, 2024
I/I Analysis Graph Station: L8
706 Civica Infrastructure Inc. www.civi.ca
Civica Infrastructures Inc. Kawartha Lakes Flow Monitoring Report
Appendix - A June 03, 2024
Infiltration/Inflow Event Analysis Station: L8 Mar 16, 2023 10:35 – Mar 18, 2023 06:45, Total Precipitation: 20.75 mm (32,287,000.00 L) Station Details
Storm Details
Catchment Area
155.60 ha
Total Precipitation
20.75 mm (32,287,000.00 L)
Duration of Storm
20.17 hr
Time of Concentration (Tc) 1
40 min
Peak Precipitation Intensity Over Tc 2
3.40 mm/hr
Return Period over Tc 3
< 2 Yr
Measured Flow
I/I Flow
Time of Peak Measured Flow
Mar 17, 2023 14:45
Time of Peak I/I Flow (TD)
Mar 17, 2023 15:10
Estimated Dry Weather Flow at TD
10.70 L/s
Peak Measured Flow
28.24 L/s
Peak I/I Flow 4
17.37 L/s
Peak I/I Rate 5
0.11 L/s/ha
Peak Measured Depth
109.00 mm
Total I/I Flow Volume during event
1,016,989.90 L
Volumetric Coefficient (Cv%) 6
3.15%
Total Measured Flow Volume during Event
1,847,422.70 L
Peak I/I Coefficient 7
0.0119
Hourly Wet-Weather Peaking Factor 8
3.73
Instantaneous Wet-Weather Peaking Factor 9
3.95
1
Time of Concentration (Tc): The estimated time for the flow to travel from the furthest point in the upstream area to the point of monitoring, assume flow is travelling at 1.00 m/s Peak Precipitation Intensity Over Tc: The peak rainfall intensity for the duration of the storm with the time interval defined by time of concentration 3 Return Period over Tc: The estimated time to elapse before a storm of equal or greater intensity will likely occur again, based on design storm criteria 4 Peak I/I Flow: The greatest difference captured between measured flow and estimated dry weather flow, Peak I/I Flow = Maximum (Measured Flow – Estimated Dry Weather Flow) 5 Peak I/I Rate: A normalized peak I/I flow based on catchment area size, Peak I/I Rate = Peak I/I Flow / Catchment Area 6 Volumetric Coefficient (Cv%): The ratio of total I/I volume and total rainfall volume, Cv% = Total I/I Flow Volume / Total Precipitation Volume * 100% 7 Peak I/ I Coefficient: The ratio of peak I/I flow and peak rainfall intensity, Peak I/ I Coefficient = Peak I/I Flow / (Peak Rainfall Intensity over Tc * Catchment Area) 8 Hourly Wet‐Weather Peaking Factor: The ratio of peak hourly wet‐weather measured flow and average dry‐weather flow, Wet‐Weather Peaking Factor = Peak Hourly Wet‐Weather Measured Flow / Average Dry-Weather Flow 9 Instantaneous Wet‐Weather Peaking Factor: The ratio of peak wet‐weather measured flow and average dry‐weather flow, Wet‐Weather Peaking Factor = Peak Wet‐Weather Measured Flow / Average Dry-Weather Flow 2
707 Civica Infrastructure Inc. www.civi.ca
Civica Infrastructures Inc. Kawartha Lakes Flow Monitoring Report
Appendix - A June 03, 2024
I/I Analysis Graph Station: L8
708 Civica Infrastructure Inc. www.civi.ca
Civica Infrastructures Inc. Kawartha Lakes Flow Monitoring Report
Appendix - A June 03, 2024
Infiltration/Inflow Event Analysis Station: L8 Mar 31, 2023 00:55 – Apr 01, 2023 16:55, Total Precipitation: 29.25 mm (45,513,000.00 L) Station Details
Storm Details
Catchment Area
155.60 ha
Total Precipitation
29.25 mm (45,513,000.00 L)
Duration of Storm
16.00 hr
Time of Concentration (Tc) 1
40 min
Peak Precipitation Intensity Over Tc 2
7.50 mm/hr
Return Period over Tc 3
< 2 Yr
Measured Flow
I/I Flow
Time of Peak Measured Flow
Apr 01, 2023 02:45
Time of Peak I/I Flow (TD)
Apr 01, 2023 02:45
Estimated Dry Weather Flow at TD
4.60 L/s
Peak Measured Flow
28.56 L/s
Peak I/I Flow 4
23.96 L/s
Peak I/I Rate 5
0.15 L/s/ha
Peak Measured Depth
103.00 mm
Total I/I Flow Volume during event
748,586.70 L
Volumetric Coefficient (Cv%) 6
1.65%
Total Measured Flow Volume during Event
1,678,343.60 L
Peak I/I Coefficient 7
0.0074
Hourly Wet-Weather Peaking Factor 8
2.73
Instantaneous Wet-Weather Peaking Factor 9
3.11
1
Time of Concentration (Tc): The estimated time for the flow to travel from the furthest point in the upstream area to the point of monitoring, assume flow is travelling at 1.00 m/s Peak Precipitation Intensity Over Tc: The peak rainfall intensity for the duration of the storm with the time interval defined by time of concentration 3 Return Period over Tc: The estimated time to elapse before a storm of equal or greater intensity will likely occur again, based on design storm criteria 4 Peak I/I Flow: The greatest difference captured between measured flow and estimated dry weather flow, Peak I/I Flow = Maximum (Measured Flow – Estimated Dry Weather Flow) 5 Peak I/I Rate: A normalized peak I/I flow based on catchment area size, Peak I/I Rate = Peak I/I Flow / Catchment Area 6 Volumetric Coefficient (Cv%): The ratio of total I/I volume and total rainfall volume, Cv% = Total I/I Flow Volume / Total Precipitation Volume * 100% 7 Peak I/ I Coefficient: The ratio of peak I/I flow and peak rainfall intensity, Peak I/ I Coefficient = Peak I/I Flow / (Peak Rainfall Intensity over Tc * Catchment Area) 8 Hourly Wet‐Weather Peaking Factor: The ratio of peak hourly wet‐weather measured flow and average dry‐weather flow, Wet‐Weather Peaking Factor = Peak Hourly Wet‐Weather Measured Flow / Average Dry-Weather Flow 9 Instantaneous Wet‐Weather Peaking Factor: The ratio of peak wet‐weather measured flow and average dry‐weather flow, Wet‐Weather Peaking Factor = Peak Wet‐Weather Measured Flow / Average Dry-Weather Flow 2
709 Civica Infrastructure Inc. www.civi.ca
Civica Infrastructures Inc. Kawartha Lakes Flow Monitoring Report
Appendix - A June 03, 2024
I/I Analysis Graph Station: L8
710 Civica Infrastructure Inc. www.civi.ca
Civica Infrastructures Inc. Kawartha Lakes Flow Monitoring Report
Appendix - A June 03, 2024
Infiltration/Inflow Event Analysis Station: L8 Apr 04, 2023 17:45 – Apr 06, 2023 10:10, Total Precipitation: 21.75 mm (33,843,000.00 L) Station Details
Storm Details
Catchment Area
155.60 ha
Total Precipitation
21.75 mm (33,843,000.00 L)
Duration of Storm
16.42 hr
Time of Concentration (Tc) 1
40 min
Peak Precipitation Intensity Over Tc 2
8.20 mm/hr
Return Period over Tc 3
< 2 Yr
Measured Flow
I/I Flow
Time of Peak Measured Flow
Apr 05, 2023 16:05
Time of Peak I/I Flow (TD)
Apr 05, 2023 16:05
Estimated Dry Weather Flow at TD
10.55 L/s
Peak Measured Flow
26.36 L/s
Peak I/I Flow 4
15.82 L/s
Peak I/I Rate 5
0.10 L/s/ha
Peak Measured Depth
112.00 mm
Total I/I Flow Volume during event
436,881.00 L
Volumetric Coefficient (Cv%) 6
1.29%
Total Measured Flow Volume during Event
1,309,836.10 L
Peak I/I Coefficient 7
0.0044
Hourly Wet-Weather Peaking Factor 8
2.76
Instantaneous Wet-Weather Peaking Factor 9
3.10
1
Time of Concentration (Tc): The estimated time for the flow to travel from the furthest point in the upstream area to the point of monitoring, assume flow is travelling at 1.00 m/s Peak Precipitation Intensity Over Tc: The peak rainfall intensity for the duration of the storm with the time interval defined by time of concentration 3 Return Period over Tc: The estimated time to elapse before a storm of equal or greater intensity will likely occur again, based on design storm criteria 4 Peak I/I Flow: The greatest difference captured between measured flow and estimated dry weather flow, Peak I/I Flow = Maximum (Measured Flow – Estimated Dry Weather Flow) 5 Peak I/I Rate: A normalized peak I/I flow based on catchment area size, Peak I/I Rate = Peak I/I Flow / Catchment Area 6 Volumetric Coefficient (Cv%): The ratio of total I/I volume and total rainfall volume, Cv% = Total I/I Flow Volume / Total Precipitation Volume * 100% 7 Peak I/ I Coefficient: The ratio of peak I/I flow and peak rainfall intensity, Peak I/ I Coefficient = Peak I/I Flow / (Peak Rainfall Intensity over Tc * Catchment Area) 8 Hourly Wet‐Weather Peaking Factor: The ratio of peak hourly wet‐weather measured flow and average dry‐weather flow, Wet‐Weather Peaking Factor = Peak Hourly Wet‐Weather Measured Flow / Average Dry-Weather Flow 9 Instantaneous Wet‐Weather Peaking Factor: The ratio of peak wet‐weather measured flow and average dry‐weather flow, Wet‐Weather Peaking Factor = Peak Wet‐Weather Measured Flow / Average Dry-Weather Flow 2
711 Civica Infrastructure Inc. www.civi.ca
Civica Infrastructures Inc. Kawartha Lakes Flow Monitoring Report
Appendix - A June 03, 2024
I/I Analysis Graph Station: L8
712 Civica Infrastructure Inc. www.civi.ca
Civica Infrastructures Inc. Kawartha Lakes Flow Monitoring Report
Appendix - A June 03, 2024
Infiltration/Inflow Event Analysis Station: L8 Apr 16, 2023 10:15 – Apr 17, 2023 14:20, Total Precipitation: 17.25 mm (26,841,000.00 L) Station Details
Storm Details
Catchment Area
155.60 ha
Total Precipitation
17.25 mm (26,841,000.00 L)
Duration of Storm
4.08 hr
Time of Concentration (Tc) 1
40 min
Peak Precipitation Intensity Over Tc 2
9.00 mm/hr
Return Period over Tc 3
< 2 Yr
Measured Flow
I/I Flow
Time of Peak Measured Flow
Apr 17, 2023 07:10
Time of Peak I/I Flow (TD)
Apr 16, 2023 23:55
Estimated Dry Weather Flow at TD
5.13 L/s
Peak Measured Flow
15.98 L/s
Peak I/I Flow 4
9.44 L/s
Peak I/I Rate 5
0.06 L/s/ha
Peak Measured Depth
111.00 mm
Total I/I Flow Volume during event
179,323.90 L
Volumetric Coefficient (Cv%) 6
0.67%
Total Measured Flow Volume during Event
598,507.80 L
Peak I/I Coefficient 7
0.0024
Hourly Wet-Weather Peaking Factor 8
1.95
Instantaneous Wet-Weather Peaking Factor 9
2.22
1
Time of Concentration (Tc): The estimated time for the flow to travel from the furthest point in the upstream area to the point of monitoring, assume flow is travelling at 1.00 m/s Peak Precipitation Intensity Over Tc: The peak rainfall intensity for the duration of the storm with the time interval defined by time of concentration 3 Return Period over Tc: The estimated time to elapse before a storm of equal or greater intensity will likely occur again, based on design storm criteria 4 Peak I/I Flow: The greatest difference captured between measured flow and estimated dry weather flow, Peak I/I Flow = Maximum (Measured Flow – Estimated Dry Weather Flow) 5 Peak I/I Rate: A normalized peak I/I flow based on catchment area size, Peak I/I Rate = Peak I/I Flow / Catchment Area 6 Volumetric Coefficient (Cv%): The ratio of total I/I volume and total rainfall volume, Cv% = Total I/I Flow Volume / Total Precipitation Volume * 100% 7 Peak I/ I Coefficient: The ratio of peak I/I flow and peak rainfall intensity, Peak I/ I Coefficient = Peak I/I Flow / (Peak Rainfall Intensity over Tc * Catchment Area) 8 Hourly Wet‐Weather Peaking Factor: The ratio of peak hourly wet‐weather measured flow and average dry‐weather flow, Wet‐Weather Peaking Factor = Peak Hourly Wet‐Weather Measured Flow / Average Dry-Weather Flow 9 Instantaneous Wet‐Weather Peaking Factor: The ratio of peak wet‐weather measured flow and average dry‐weather flow, Wet‐Weather Peaking Factor = Peak Wet‐Weather Measured Flow / Average Dry-Weather Flow 2
713 Civica Infrastructure Inc. www.civi.ca
Civica Infrastructures Inc. Kawartha Lakes Flow Monitoring Report
Appendix - A June 03, 2024
I/I Analysis Graph Station: L8
714 Civica Infrastructure Inc. www.civi.ca
Civica Infrastructures Inc. Kawartha Lakes Flow Monitoring Report
Appendix - A June 03, 2024
Infiltration/Inflow Event Analysis Station: L8 Apr 28, 2023 06:45 – May 01, 2023 10:10, Total Precipitation: 40.25 mm (62,629,000.00 L) Station Details
Storm Details
Catchment Area
155.60 ha
Total Precipitation
40.25 mm (62,629,000.00 L)
Duration of Storm
51.42 hr
Time of Concentration (Tc) 1
40 min
Peak Precipitation Intensity Over Tc 2
6.00 mm/hr
Return Period over Tc 3
< 2 Yr
Measured Flow
I/I Flow
Time of Peak Measured Flow
Apr 30, 2023 18:30
Time of Peak I/I Flow (TD)
Apr 30, 2023 18:30
Estimated Dry Weather Flow at TD
7.73 L/s
Peak Measured Flow
22.39 L/s
Peak I/I Flow 4
14.66 L/s
Peak I/I Rate 5
0.09 L/s/ha
Peak Measured Depth
102.00 mm
Total I/I Flow Volume during event
733,306.80 L
Volumetric Coefficient (Cv%) 6
1.17%
Total Measured Flow Volume during Event
2,305,364.40 L
Peak I/I Coefficient 7
0.0057
Hourly Wet-Weather Peaking Factor 8
2.93
Instantaneous Wet-Weather Peaking Factor 9
3.26
1
Time of Concentration (Tc): The estimated time for the flow to travel from the furthest point in the upstream area to the point of monitoring, assume flow is travelling at 1.00 m/s Peak Precipitation Intensity Over Tc: The peak rainfall intensity for the duration of the storm with the time interval defined by time of concentration 3 Return Period over Tc: The estimated time to elapse before a storm of equal or greater intensity will likely occur again, based on design storm criteria 4 Peak I/I Flow: The greatest difference captured between measured flow and estimated dry weather flow, Peak I/I Flow = Maximum (Measured Flow – Estimated Dry Weather Flow) 5 Peak I/I Rate: A normalized peak I/I flow based on catchment area size, Peak I/I Rate = Peak I/I Flow / Catchment Area 6 Volumetric Coefficient (Cv%): The ratio of total I/I volume and total rainfall volume, Cv% = Total I/I Flow Volume / Total Precipitation Volume * 100% 7 Peak I/ I Coefficient: The ratio of peak I/I flow and peak rainfall intensity, Peak I/ I Coefficient = Peak I/I Flow / (Peak Rainfall Intensity over Tc * Catchment Area) 8 Hourly Wet‐Weather Peaking Factor: The ratio of peak hourly wet‐weather measured flow and average dry‐weather flow, Wet‐Weather Peaking Factor = Peak Hourly Wet‐Weather Measured Flow / Average Dry-Weather Flow 9 Instantaneous Wet‐Weather Peaking Factor: The ratio of peak wet‐weather measured flow and average dry‐weather flow, Wet‐Weather Peaking Factor = Peak Wet‐Weather Measured Flow / Average Dry-Weather Flow 2
715 Civica Infrastructure Inc. www.civi.ca
Civica Infrastructures Inc. Kawartha Lakes Flow Monitoring Report
Appendix - A June 03, 2024
I/I Analysis Graph Station: L8
716 Civica Infrastructure Inc. www.civi.ca
Civica Infrastructures Inc. Kawartha Lakes Flow Monitoring Report
Appendix - A June 03, 2024
Infiltration/Inflow Event Analysis Station: L8 May 19, 2023 08:10 – May 21, 2023 03:30, Total Precipitation: 47.50 mm (73,910,000.00 L) Station Details
Storm Details
Catchment Area
155.60 ha
Total Precipitation
47.50 mm (73,910,000.00 L)
Duration of Storm
19.33 hr
Time of Concentration (Tc) 1
40 min
Peak Precipitation Intensity Over Tc 2
10.50 mm/hr
Return Period over Tc 3
< 2 Yr
Measured Flow
I/I Flow
Time of Peak Measured Flow
May 20, 2023 10:35
Time of Peak I/I Flow (TD)
May 20, 2023 10:35
Estimated Dry Weather Flow at TD
9.40 L/s
Peak Measured Flow
37.07 L/s
Peak I/I Flow 4
27.67 L/s
Peak I/I Rate 5
0.18 L/s/ha
Peak Measured Depth
129.39 mm
Total I/I Flow Volume during event
715,981.60 L
Volumetric Coefficient (Cv%) 6
0.97%
Total Measured Flow Volume during Event
1,416,186.70 L
Peak I/I Coefficient 7
0.0061
Hourly Wet-Weather Peaking Factor 8
4.47
Instantaneous Wet-Weather Peaking Factor 9
5.99
1
Time of Concentration (Tc): The estimated time for the flow to travel from the furthest point in the upstream area to the point of monitoring, assume flow is travelling at 1.00 m/s Peak Precipitation Intensity Over Tc: The peak rainfall intensity for the duration of the storm with the time interval defined by time of concentration 3 Return Period over Tc: The estimated time to elapse before a storm of equal or greater intensity will likely occur again, based on design storm criteria 4 Peak I/I Flow: The greatest difference captured between measured flow and estimated dry weather flow, Peak I/I Flow = Maximum (Measured Flow – Estimated Dry Weather Flow) 5 Peak I/I Rate: A normalized peak I/I flow based on catchment area size, Peak I/I Rate = Peak I/I Flow / Catchment Area 6 Volumetric Coefficient (Cv%): The ratio of total I/I volume and total rainfall volume, Cv% = Total I/I Flow Volume / Total Precipitation Volume * 100% 7 Peak I/ I Coefficient: The ratio of peak I/I flow and peak rainfall intensity, Peak I/ I Coefficient = Peak I/I Flow / (Peak Rainfall Intensity over Tc * Catchment Area) 8 Hourly Wet‐Weather Peaking Factor: The ratio of peak hourly wet‐weather measured flow and average dry‐weather flow, Wet‐Weather Peaking Factor = Peak Hourly Wet‐Weather Measured Flow / Average Dry-Weather Flow 9 Instantaneous Wet‐Weather Peaking Factor: The ratio of peak wet‐weather measured flow and average dry‐weather flow, Wet‐Weather Peaking Factor = Peak Wet‐Weather Measured Flow / Average Dry-Weather Flow 2
717 Civica Infrastructure Inc. www.civi.ca
Civica Infrastructures Inc. Kawartha Lakes Flow Monitoring Report
Appendix - A June 03, 2024
I/I Analysis Graph Station: L8
718 Civica Infrastructure Inc. www.civi.ca
Civica Infrastructures Inc. Kawartha Lakes Flow Monitoring Report
Appendix - A June 03, 2024
Infiltration/Inflow Event Analysis Station: L8 Jun 11, 2023 07:50 – Jun 13, 2023 09:00, Total Precipitation: 55.25 mm (85,969,000.00 L) Station Details
Storm Details
Catchment Area
155.60 ha
Total Precipitation
55.25 mm (85,969,000.00 L)
Duration of Storm
25.17 hr
Time of Concentration (Tc) 1
40 min
Peak Precipitation Intensity Over Tc 2
10.50 mm/hr
Return Period over Tc 3
< 2 Yr
Measured Flow
I/I Flow
Time of Peak Measured Flow
Jun 12, 2023 14:05
Time of Peak I/I Flow (TD)
Jun 12, 2023 14:05
Estimated Dry Weather Flow at TD
7.69 L/s
Peak Measured Flow
29.05 L/s
Peak I/I Flow 4
21.36 L/s
Peak I/I Rate 5
0.14 L/s/ha
Peak Measured Depth
118.92 mm
Total I/I Flow Volume during event
782,473.80 L
Volumetric Coefficient (Cv%) 6
0.91%
Total Measured Flow Volume during Event
1,552,408.10 L
Peak I/I Coefficient 7
0.0047
Hourly Wet-Weather Peaking Factor 8
3.87
Instantaneous Wet-Weather Peaking Factor 9
5.06
1
Time of Concentration (Tc): The estimated time for the flow to travel from the furthest point in the upstream area to the point of monitoring, assume flow is travelling at 1.00 m/s Peak Precipitation Intensity Over Tc: The peak rainfall intensity for the duration of the storm with the time interval defined by time of concentration 3 Return Period over Tc: The estimated time to elapse before a storm of equal or greater intensity will likely occur again, based on design storm criteria 4 Peak I/I Flow: The greatest difference captured between measured flow and estimated dry weather flow, Peak I/I Flow = Maximum (Measured Flow – Estimated Dry Weather Flow) 5 Peak I/I Rate: A normalized peak I/I flow based on catchment area size, Peak I/I Rate = Peak I/I Flow / Catchment Area 6 Volumetric Coefficient (Cv%): The ratio of total I/I volume and total rainfall volume, Cv% = Total I/I Flow Volume / Total Precipitation Volume * 100% 7 Peak I/ I Coefficient: The ratio of peak I/I flow and peak rainfall intensity, Peak I/ I Coefficient = Peak I/I Flow / (Peak Rainfall Intensity over Tc * Catchment Area) 8 Hourly Wet‐Weather Peaking Factor: The ratio of peak hourly wet‐weather measured flow and average dry‐weather flow, Wet‐Weather Peaking Factor = Peak Hourly Wet‐Weather Measured Flow / Average Dry-Weather Flow 9 Instantaneous Wet‐Weather Peaking Factor: The ratio of peak wet‐weather measured flow and average dry‐weather flow, Wet‐Weather Peaking Factor = Peak Wet‐Weather Measured Flow / Average Dry-Weather Flow 2
719 Civica Infrastructure Inc. www.civi.ca
Civica Infrastructures Inc. Kawartha Lakes Flow Monitoring Report
Appendix - A June 03, 2024
I/I Analysis Graph Station: L8
720 Civica Infrastructure Inc. www.civi.ca
Civica Infrastructures Inc. Kawartha Lakes Flow Monitoring Report
Appendix - A June 03, 2024
Infiltration/Inflow Event Analysis Station: L8 Jun 25, 2023 15:00 – Jun 26, 2023 23:20, Total Precipitation: 41.50 mm (64,574,000.00 L) Station Details
Storm Details
Catchment Area
155.60 ha
Total Precipitation
41.50 mm (64,574,000.00 L)
Duration of Storm
8.33 hr
Time of Concentration (Tc) 1
40 min
Peak Precipitation Intensity Over Tc 2
39.00 mm/hr
Return Period over Tc 3
2 - 5 Yr
Measured Flow
I/I Flow
Time of Peak Measured Flow
Jun 26, 2023 11:50
Time of Peak I/I Flow (TD)
Jun 26, 2023 03:40
Estimated Dry Weather Flow at TD
2.89 L/s
Peak Measured Flow
35.95 L/s
Peak I/I Flow 4
27.66 L/s
Peak I/I Rate 5
0.18 L/s/ha
Peak Measured Depth
128.00 mm
Total I/I Flow Volume during event
359,798.70 L
Volumetric Coefficient (Cv%) 6
0.56%
Total Measured Flow Volume during Event
869,242.10 L
Peak I/I Coefficient 7
0.0016
Hourly Wet-Weather Peaking Factor 8
3.24
Instantaneous Wet-Weather Peaking Factor 9
5.19
1
Time of Concentration (Tc): The estimated time for the flow to travel from the furthest point in the upstream area to the point of monitoring, assume flow is travelling at 1.00 m/s Peak Precipitation Intensity Over Tc: The peak rainfall intensity for the duration of the storm with the time interval defined by time of concentration 3 Return Period over Tc: The estimated time to elapse before a storm of equal or greater intensity will likely occur again, based on design storm criteria 4 Peak I/I Flow: The greatest difference captured between measured flow and estimated dry weather flow, Peak I/I Flow = Maximum (Measured Flow – Estimated Dry Weather Flow) 5 Peak I/I Rate: A normalized peak I/I flow based on catchment area size, Peak I/I Rate = Peak I/I Flow / Catchment Area 6 Volumetric Coefficient (Cv%): The ratio of total I/I volume and total rainfall volume, Cv% = Total I/I Flow Volume / Total Precipitation Volume * 100% 7 Peak I/ I Coefficient: The ratio of peak I/I flow and peak rainfall intensity, Peak I/ I Coefficient = Peak I/I Flow / (Peak Rainfall Intensity over Tc * Catchment Area) 8 Hourly Wet‐Weather Peaking Factor: The ratio of peak hourly wet‐weather measured flow and average dry‐weather flow, Wet‐Weather Peaking Factor = Peak Hourly Wet‐Weather Measured Flow / Average Dry-Weather Flow 9 Instantaneous Wet‐Weather Peaking Factor: The ratio of peak wet‐weather measured flow and average dry‐weather flow, Wet‐Weather Peaking Factor = Peak Wet‐Weather Measured Flow / Average Dry-Weather Flow 2
721 Civica Infrastructure Inc. www.civi.ca
Civica Infrastructures Inc. Kawartha Lakes Flow Monitoring Report
Appendix - A June 03, 2024
I/I Analysis Graph Station: L8
722 Civica Infrastructure Inc. www.civi.ca
Civica Infrastructures Inc. Kawartha Lakes Flow Monitoring Report
Appendix - A June 03, 2024
Infiltration/Inflow Event Analysis Station: L8 Jun 26, 2023 20:50 – Jun 28, 2023 02:45, Total Precipitation: 27.75 mm (43,179,000.00 L) Station Details
Storm Details
Catchment Area
155.60 ha
Total Precipitation
27.75 mm (43,179,000.00 L)
Duration of Storm
5.92 hr
Time of Concentration (Tc) 1
40 min
Peak Precipitation Intensity Over Tc 2
9.80 mm/hr
Return Period over Tc 3
< 2 Yr
Measured Flow
I/I Flow
Time of Peak Measured Flow
Jun 27, 2023 13:00
Time of Peak I/I Flow (TD)
Jun 27, 2023 13:00
Estimated Dry Weather Flow at TD
8.59 L/s
Peak Measured Flow
31.30 L/s
Peak I/I Flow 4
22.70 L/s
Peak I/I Rate 5
0.15 L/s/ha
Peak Measured Depth
122.00 mm
Total I/I Flow Volume during event
501,968.70 L
Volumetric Coefficient (Cv%) 6
1.16%
Total Measured Flow Volume during Event
937,518.50 L
Peak I/I Coefficient 7
0.0054
Hourly Wet-Weather Peaking Factor 8
4.23
Instantaneous Wet-Weather Peaking Factor 9
4.66
1
Time of Concentration (Tc): The estimated time for the flow to travel from the furthest point in the upstream area to the point of monitoring, assume flow is travelling at 1.00 m/s Peak Precipitation Intensity Over Tc: The peak rainfall intensity for the duration of the storm with the time interval defined by time of concentration 3 Return Period over Tc: The estimated time to elapse before a storm of equal or greater intensity will likely occur again, based on design storm criteria 4 Peak I/I Flow: The greatest difference captured between measured flow and estimated dry weather flow, Peak I/I Flow = Maximum (Measured Flow – Estimated Dry Weather Flow) 5 Peak I/I Rate: A normalized peak I/I flow based on catchment area size, Peak I/I Rate = Peak I/I Flow / Catchment Area 6 Volumetric Coefficient (Cv%): The ratio of total I/I volume and total rainfall volume, Cv% = Total I/I Flow Volume / Total Precipitation Volume * 100% 7 Peak I/ I Coefficient: The ratio of peak I/I flow and peak rainfall intensity, Peak I/ I Coefficient = Peak I/I Flow / (Peak Rainfall Intensity over Tc * Catchment Area) 8 Hourly Wet‐Weather Peaking Factor: The ratio of peak hourly wet‐weather measured flow and average dry‐weather flow, Wet‐Weather Peaking Factor = Peak Hourly Wet‐Weather Measured Flow / Average Dry-Weather Flow 9 Instantaneous Wet‐Weather Peaking Factor: The ratio of peak wet‐weather measured flow and average dry‐weather flow, Wet‐Weather Peaking Factor = Peak Wet‐Weather Measured Flow / Average Dry-Weather Flow 2
723 Civica Infrastructure Inc. www.civi.ca
Civica Infrastructures Inc. Kawartha Lakes Flow Monitoring Report
Appendix - A June 03, 2024
I/I Analysis Graph Station: L8
724 Civica Infrastructure Inc. www.civi.ca
Civica Infrastructures Inc. Kawartha Lakes Flow Monitoring Report
Appendix - A June 03, 2024
Infiltration/Inflow Event Analysis Station: L8 Jul 12, 2023 14:40 – Jul 13, 2023 18:50, Total Precipitation: 20.25 mm (31,509,000.00 L) Station Details
Storm Details
Catchment Area
155.60 ha
Total Precipitation
20.25 mm (31,509,000.00 L)
Duration of Storm
4.17 hr
Time of Concentration (Tc) 1
40 min
Peak Precipitation Intensity Over Tc 2
11.60 mm/hr
Return Period over Tc 3
< 2 Yr
Measured Flow
I/I Flow
Time of Peak Measured Flow
Jul 13, 2023 04:30
Time of Peak I/I Flow (TD)
Jul 13, 2023 04:30
Estimated Dry Weather Flow at TD
2.42 L/s
Peak Measured Flow
16.19 L/s
Peak I/I Flow 4
13.77 L/s
Peak I/I Rate 5
0.09 L/s/ha
Peak Measured Depth
98.00 mm
Total I/I Flow Volume during event
87,671.00 L
Volumetric Coefficient (Cv%) 6
0.28%
Total Measured Flow Volume during Event
422,572.50 L
Peak I/I Coefficient 7
0.0027
Hourly Wet-Weather Peaking Factor 8
2.14
Instantaneous Wet-Weather Peaking Factor 9
2.83
1
Time of Concentration (Tc): The estimated time for the flow to travel from the furthest point in the upstream area to the point of monitoring, assume flow is travelling at 1.00 m/s Peak Precipitation Intensity Over Tc: The peak rainfall intensity for the duration of the storm with the time interval defined by time of concentration 3 Return Period over Tc: The estimated time to elapse before a storm of equal or greater intensity will likely occur again, based on design storm criteria 4 Peak I/I Flow: The greatest difference captured between measured flow and estimated dry weather flow, Peak I/I Flow = Maximum (Measured Flow – Estimated Dry Weather Flow) 5 Peak I/I Rate: A normalized peak I/I flow based on catchment area size, Peak I/I Rate = Peak I/I Flow / Catchment Area 6 Volumetric Coefficient (Cv%): The ratio of total I/I volume and total rainfall volume, Cv% = Total I/I Flow Volume / Total Precipitation Volume * 100% 7 Peak I/ I Coefficient: The ratio of peak I/I flow and peak rainfall intensity, Peak I/ I Coefficient = Peak I/I Flow / (Peak Rainfall Intensity over Tc * Catchment Area) 8 Hourly Wet‐Weather Peaking Factor: The ratio of peak hourly wet‐weather measured flow and average dry‐weather flow, Wet‐Weather Peaking Factor = Peak Hourly Wet‐Weather Measured Flow / Average Dry-Weather Flow 9 Instantaneous Wet‐Weather Peaking Factor: The ratio of peak wet‐weather measured flow and average dry‐weather flow, Wet‐Weather Peaking Factor = Peak Wet‐Weather Measured Flow / Average Dry-Weather Flow 2
725 Civica Infrastructure Inc. www.civi.ca
Civica Infrastructures Inc. Kawartha Lakes Flow Monitoring Report
Appendix - A June 03, 2024
I/I Analysis Graph Station: L8
726 Civica Infrastructure Inc. www.civi.ca
Civica Infrastructures Inc. Kawartha Lakes Flow Monitoring Report
Appendix - A June 03, 2024
Infiltration/Inflow Event Analysis Station: L8 Jul 20, 2023 07:00 – Jul 21, 2023 09:20, Total Precipitation: 16.50 mm (25,674,000.00 L) Station Details
Storm Details
Catchment Area
155.60 ha
Total Precipitation
16.50 mm (25,674,000.00 L)
Duration of Storm
2.33 hr
Time of Concentration (Tc) 1
40 min
Peak Precipitation Intensity Over Tc 2
20.60 mm/hr
Return Period over Tc 3
< 2 Yr
Measured Flow
I/I Flow
Time of Peak Measured Flow
Jul 20, 2023 19:50
Time of Peak I/I Flow (TD)
Jul 20, 2023 19:50
Estimated Dry Weather Flow at TD
6.55 L/s
Peak Measured Flow
18.89 L/s
Peak I/I Flow 4
12.34 L/s
Peak I/I Rate 5
0.08 L/s/ha
Peak Measured Depth
103.00 mm
Total I/I Flow Volume during event
31,065.40 L
Volumetric Coefficient (Cv%) 6
0.12%
Total Measured Flow Volume during Event
208,856.90 L
Peak I/I Coefficient 7
0.0014
Hourly Wet-Weather Peaking Factor 8
2.55
Instantaneous Wet-Weather Peaking Factor 9
5.51
1
Time of Concentration (Tc): The estimated time for the flow to travel from the furthest point in the upstream area to the point of monitoring, assume flow is travelling at 1.00 m/s Peak Precipitation Intensity Over Tc: The peak rainfall intensity for the duration of the storm with the time interval defined by time of concentration 3 Return Period over Tc: The estimated time to elapse before a storm of equal or greater intensity will likely occur again, based on design storm criteria 4 Peak I/I Flow: The greatest difference captured between measured flow and estimated dry weather flow, Peak I/I Flow = Maximum (Measured Flow – Estimated Dry Weather Flow) 5 Peak I/I Rate: A normalized peak I/I flow based on catchment area size, Peak I/I Rate = Peak I/I Flow / Catchment Area 6 Volumetric Coefficient (Cv%): The ratio of total I/I volume and total rainfall volume, Cv% = Total I/I Flow Volume / Total Precipitation Volume * 100% 7 Peak I/ I Coefficient: The ratio of peak I/I flow and peak rainfall intensity, Peak I/ I Coefficient = Peak I/I Flow / (Peak Rainfall Intensity over Tc * Catchment Area) 8 Hourly Wet‐Weather Peaking Factor: The ratio of peak hourly wet‐weather measured flow and average dry‐weather flow, Wet‐Weather Peaking Factor = Peak Hourly Wet‐Weather Measured Flow / Average Dry-Weather Flow 9 Instantaneous Wet‐Weather Peaking Factor: The ratio of peak wet‐weather measured flow and average dry‐weather flow, Wet‐Weather Peaking Factor = Peak Wet‐Weather Measured Flow / Average Dry-Weather Flow 2
727 Civica Infrastructure Inc. www.civi.ca
Civica Infrastructures Inc. Kawartha Lakes Flow Monitoring Report
Appendix - A June 03, 2024
Activity Log Station: L8 Date Time
Type
Purpose of Visit
Comment
Calibration Measurement
11-Jan-2023 11:45:00 AM
Installation Log
INSTALLATION
MEASUREMENTS TAKEN, PHOTOS TAKEN, LOGGER INSTALLED, ANTENNA DRILLED
Yes
01-Feb-2023 02:11:00 PM
Maintenance Log
CALIBRATION
DATA DOWNLOADED, TELEMETRY SENT, PHOTOS TAKEN, SITE CALIBRATED, MEASUREMENTS TAKEN
Yes
03-Mar-2023 09:30:00 AM
Maintenance Log
CALIBRATION
TC SET,DATA DOWNLOADED,TELEMETRY SENT,,DEBRIS AND SILT REMOVED,SITE CALIBRATED,ANTENNA IN GOOD CONDITION,PHOTOS AND VIDEOS TAKEN
Yes
03-Apr-2023 01:57:00 PM
Maintenance Log
CALIBRATION
TC SET,DATA DOWNLOADED, PHOTOS TAKEN, TELEMETRY SENT,SITE CALIBRATED,DESSICANT GOOD,ANTENNA GOOD,SITE CLEARED
Yes
11-May-2023 07:52:00 AM
Maintenance Log
CALIBRATION
TC SET,SURVEY SENT,DOWNLOADED DATA, SENT TELEMETRY NOT REFLECTED IN FZ , MADE ENTRY, TOOK PHOTOS/VIDEOS,DESSICANT REPLACED, TOOK MEASUREMENTS,DEBRIS AND SILT CLEARED, CALIBRATED SITE
Yes
Yes
Yes
22-Jun-2023 09:21:00 AM
Maintenance Log
CALIBRATION
DATA DOWNLOADED, TELEMETRY SENT NOT REFLECTED IN FZ,SIGNAL TEST FAILED ENTRY MADE PHOTOS/VIDEOS TAKEN, MEASUREMENTS TAKEN, SITE CALIBRATED
21-Jul-2023 12:31:00 PM
Maintenance Log
DATA DOWNLOAD
TC SET,SURVEY SENT,DATA DOWNLOADED,TELEMETRY SENT NOT REFLECTED IN FZ,SITE CLEARED
728 Civica Infrastructure Inc. www.civi.ca
Civica Infrastructures Inc. Kawartha Lakes Flow Monitoring Report
Appendix - A June 03, 2024
Aggregate Data Station: L9
Precipitation Date From
Date To
Days
Min (mm)
Avg (mm)
Max (mm)
Sum (mm)
Count
Time of Min1
Time of Max1
Jan 10, 2023
Oct 04, 2023
268
0.00
0.01
11.25
734.25
77,064
Tue Jan 10, 2023 00:00
Mon Jun 26, 2023 03:05
Level Date From
Date To
Days
Min (m)
Avg (m)
Max (m)
Count
Time of Min1
Time of Max1
Jan 10, 2023
Oct 04, 2023
268
0.02
0.05
0.12
76,890
Mon Sep 18, 2023 00:40
Thu Sep 07, 2023 15:35
Velocity Date From
Date To
Days
Min (m/s)
Avg (m/s)
Max (m/s)
Count
Time of Min1
Time of Max1
Jan 10, 2023
Oct 04, 2023
268
0.00
0.25
0.70
76,892
Wed Jan 11, 2023 18:00
Wed Apr 05, 2023 18:10
Flow
1
Date From
Date To
Days
Min (L/s)
Avg (L/s)
Max (L/s)
Total Volume (1,000,000 L)
Count
Time of Min1
Time of Max1
Jan 10, 2023
Oct 04, 2023
268
0.00
3.41
16.99
78.61
76,890
Wed Jan 11, 2023 18:00
Wed Apr 05, 2023 17:40
Time of Min and Time of Max will be displayed by first occurrence
729 Civica Infrastructure Inc. www.civi.ca
Civica Infrastructures Inc. Kawartha Lakes Flow Monitoring Report
Appendix - A June 03, 2024
Data Chart Station: L9 Jan 10, 2023 – Jan 31, 2023
730 Civica Infrastructure Inc. www.civi.ca
Civica Infrastructures Inc. Kawartha Lakes Flow Monitoring Report
Appendix - A June 03, 2024
Data Chart Station: L9 Feb 01, 2023 – Feb 28, 2023
731 Civica Infrastructure Inc. www.civi.ca
Civica Infrastructures Inc. Kawartha Lakes Flow Monitoring Report
Appendix - A June 03, 2024
Data Chart Station: L9 Mar 01, 2023 – Mar 31, 2023
732 Civica Infrastructure Inc. www.civi.ca
Civica Infrastructures Inc. Kawartha Lakes Flow Monitoring Report
Appendix - A June 03, 2024
Data Chart Station: L9 Apr 01, 2023 – Apr 30, 2023
733 Civica Infrastructure Inc. www.civi.ca
Civica Infrastructures Inc. Kawartha Lakes Flow Monitoring Report
Appendix - A June 03, 2024
Data Chart Station: L9 May 01, 2023 – May 31, 2023
734 Civica Infrastructure Inc. www.civi.ca
Civica Infrastructures Inc. Kawartha Lakes Flow Monitoring Report
Appendix - A June 03, 2024
Data Chart Station: L9 Jun 01, 2023 – Jun 30, 2023
735 Civica Infrastructure Inc. www.civi.ca
Civica Infrastructures Inc. Kawartha Lakes Flow Monitoring Report
Appendix - A June 03, 2024
Data Chart Station: L9 Jul 01, 2023 – Jul 31, 2023
736 Civica Infrastructure Inc. www.civi.ca
Civica Infrastructures Inc. Kawartha Lakes Flow Monitoring Report
Appendix - A June 03, 2024
Data Chart Station: L9 Aug 01, 2023 – Aug 31, 2023
737 Civica Infrastructure Inc. www.civi.ca
Civica Infrastructures Inc. Kawartha Lakes Flow Monitoring Report
Appendix - A June 03, 2024
Data Chart Station: L9 Sep 01, 2023 – Sep 30, 2023
738 Civica Infrastructure Inc. www.civi.ca
Civica Infrastructures Inc. Kawartha Lakes Flow Monitoring Report
Appendix - A June 03, 2024
Data Chart Station: L9 Oct 01, 2023 – Oct 04, 2023
739 Civica Infrastructure Inc. www.civi.ca
Civica Infrastructures Inc. Kawartha Lakes Flow Monitoring Report
Appendix - A June 03, 2024
Sanitary Report Station: L9
1
Average Dry Weather Flow (L/s)
Average Dry Weather Flow (L/c/d)
Average Daily Minimum Dry Weather Flow (L/s)
Average Daily Peak Dry Weather Flow (L/s)
3.133
367.791
0.909
6.868
Peaking Factor
Groundwater Infiltration (L/s)1
Groundwater Infiltration (L/ha/d)
% of GWI in Average DWF
2.192
0.773
936.713
24.673
Groundwater infiltration (GWI) is assumed as 85% of the daily minimum flow averaged over the monitoring period
740 Civica Infrastructure Inc. www.civi.ca
Civica Infrastructures Inc. Kawartha Lakes Flow Monitoring Report
Appendix - A June 03, 2024
I/I Analysis Table
1
Event1
Total Precipitation (mm)
Duration (hours)
Peak Intensity Over Tc at Station (mm/hr)
Feb 09, 2023
35.75
21.58
Mar 16, 2023
20.75
Mar 31, 2023
L9 Measured Peak Flow (L/s)
Peak I/I Flow (L/s)
Peak I/I Rate (L/s/ha)
Volumetric Runoff Coefficient (CV%)
Peaking Factor (PF)
7.80
9.91
6.23
0.09
0.59 %
2.12
20.17
4.20
14.08
10.27
0.14
1.85 %
3.91
29.25
16.00
9.00
11.91
7.78
0.11
0.62 %
2.67
Apr 05, 2023
21.75
16.42
13.20
17.00
11.48
0.16
2.51 %
2.43
Apr 16, 2023
17.25
4.08
10.20
9.62
3.74
0.05
0.37 %
0.86
Apr 28, 2023
40.25
51.42
7.20
14.42
10.68
0.15
1.09 %
2.82
May 19, 2023
47.50
19.33
11.40
13.23
7.85
0.11
0.84 %
2.09
Jun 11, 2023
55.25
25.17
13.20
11.49
7.01
0.10
0.84 %
2.00
Jun 26, 2023
41.50
8.33
58.20
12.61
10.18
0.14
0.61 %
2.56
Jun 27, 2023
27.75
5.92
15.60
11.45
7.52
0.11
1.44 %
2.07
Jul 13, 2023
20.25
4.17
15.60
8.42
5.34
0.08
0.65 %
1.52
Jul 20, 2023
16.50
2.33
28.20
8.98
5.84
0.08
0.27 %
2.54
Aug 03, 2023
28.75
4.67
40.20
8.54
6.47
0.09
0.10 %
4.71
Aug 17, 2023
22.50
21.50
19.80
6.35
3.57
0.05
0.28 %
1.80
Sep 07, 2023
38.25
0.75
60.60
10.90
8.46
0.12
0.08 %
7.90
Sep 12, 2023
18.00
7.83
11.40
6.99
4.34
0.06
0.28 %
1.96
Average
30.08
14.35
20.36
10.99
7.30
0.10
0.78 %
2.75
Maximum
55.25
51.42
60.60
17.00
11.48
0.16
2.51 %
7.90
Flow KPIs
Measured Storms
Station: L9
An event is a storm with a minimum volume of 15mm and a minimum inter-event dry period of 12 hours
741 Civica Infrastructure Inc. www.civi.ca
Civica Infrastructures Inc. Kawartha Lakes Flow Monitoring Report
Appendix - A June 03, 2024
I/I Analysis Graph Station: L9
742 Civica Infrastructure Inc. www.civi.ca
Civica Infrastructures Inc. Kawartha Lakes Flow Monitoring Report
Appendix - A June 03, 2024
Infiltration/Inflow Event Analysis Station: L9 Feb 08, 2023 20:55 – Feb 10, 2023 18:30, Total Precipitation: 35.75 mm (25,489,750.00 L) Station Details
Storm Details
Catchment Area
71.30 ha
Total Precipitation
35.75 mm (25,489,750.00 L)
Duration of Storm
21.58 hr
Time of Concentration (Tc) 1
25 min
Peak Precipitation Intensity Over Tc 2
7.80 mm/hr
Return Period over Tc 3
< 2 Yr
Measured Flow
I/I Flow
Time of Peak Measured Flow
Feb 10, 2023 09:45
Time of Peak I/I Flow (TD)
Feb 09, 2023 23:20
Estimated Dry Weather Flow at TD
2.58 L/s
Peak Measured Flow
9.91 L/s
Peak I/I Flow 4
6.23 L/s
Peak I/I Rate 5
0.09 L/s/ha
Peak Measured Depth
101.00 mm
Total I/I Flow Volume during event
150,536.60 L
Volumetric Coefficient (Cv%) 6
0.59%
Total Measured Flow Volume during Event
506,554.50 L
Peak I/I Coefficient 7
0.0040
Hourly Wet-Weather Peaking Factor 8
2.44
Instantaneous Wet-Weather Peaking Factor 9
3.37
1
Time of Concentration (Tc): The estimated time for the flow to travel from the furthest point in the upstream area to the point of monitoring, assume flow is travelling at 1.00 m/s Peak Precipitation Intensity Over Tc: The peak rainfall intensity for the duration of the storm with the time interval defined by time of concentration 3 Return Period over Tc: The estimated time to elapse before a storm of equal or greater intensity will likely occur again, based on design storm criteria 4 Peak I/I Flow: The greatest difference captured between measured flow and estimated dry weather flow, Peak I/I Flow = Maximum (Measured Flow – Estimated Dry Weather Flow) 5 Peak I/I Rate: A normalized peak I/I flow based on catchment area size, Peak I/I Rate = Peak I/I Flow / Catchment Area 6 Volumetric Coefficient (Cv%): The ratio of total I/I volume and total rainfall volume, Cv% = Total I/I Flow Volume / Total Precipitation Volume * 100% 7 Peak I/ I Coefficient: The ratio of peak I/I flow and peak rainfall intensity, Peak I/ I Coefficient = Peak I/I Flow / (Peak Rainfall Intensity over Tc * Catchment Area) 8 Hourly Wet‐Weather Peaking Factor: The ratio of peak hourly wet‐weather measured flow and average dry‐weather flow, Wet‐Weather Peaking Factor = Peak Hourly Wet‐Weather Measured Flow / Average Dry-Weather Flow 9 Instantaneous Wet‐Weather Peaking Factor: The ratio of peak wet‐weather measured flow and average dry‐weather flow, Wet‐Weather Peaking Factor = Peak Wet‐Weather Measured Flow / Average Dry-Weather Flow 2
743 Civica Infrastructure Inc. www.civi.ca
Civica Infrastructures Inc. Kawartha Lakes Flow Monitoring Report
Appendix - A June 03, 2024
I/I Analysis Graph Station: L9
744 Civica Infrastructure Inc. www.civi.ca
Civica Infrastructures Inc. Kawartha Lakes Flow Monitoring Report
Appendix - A June 03, 2024
Infiltration/Inflow Event Analysis Station: L9 Mar 16, 2023 10:35 – Mar 18, 2023 06:45, Total Precipitation: 20.75 mm (14,794,750.00 L) Station Details
Storm Details
Catchment Area
71.30 ha
Total Precipitation
20.75 mm (14,794,750.00 L)
Duration of Storm
20.17 hr
Time of Concentration (Tc) 1
25 min
Peak Precipitation Intensity Over Tc 2
4.20 mm/hr
Return Period over Tc 3
< 2 Yr
Measured Flow
I/I Flow
Time of Peak Measured Flow
Mar 17, 2023 15:20
Time of Peak I/I Flow (TD)
Mar 17, 2023 15:20
Estimated Dry Weather Flow at TD
3.81 L/s
Peak Measured Flow
14.08 L/s
Peak I/I Flow 4
10.27 L/s
Peak I/I Rate 5
0.14 L/s/ha
Peak Measured Depth
104.00 mm
Total I/I Flow Volume during event
273,512.00 L
Volumetric Coefficient (Cv%) 6
1.85%
Total Measured Flow Volume during Event
578,424.70 L
Peak I/I Coefficient 7
0.0124
Hourly Wet-Weather Peaking Factor 8
4.92
Instantaneous Wet-Weather Peaking Factor 9
5.36
1
Time of Concentration (Tc): The estimated time for the flow to travel from the furthest point in the upstream area to the point of monitoring, assume flow is travelling at 1.00 m/s Peak Precipitation Intensity Over Tc: The peak rainfall intensity for the duration of the storm with the time interval defined by time of concentration 3 Return Period over Tc: The estimated time to elapse before a storm of equal or greater intensity will likely occur again, based on design storm criteria 4 Peak I/I Flow: The greatest difference captured between measured flow and estimated dry weather flow, Peak I/I Flow = Maximum (Measured Flow – Estimated Dry Weather Flow) 5 Peak I/I Rate: A normalized peak I/I flow based on catchment area size, Peak I/I Rate = Peak I/I Flow / Catchment Area 6 Volumetric Coefficient (Cv%): The ratio of total I/I volume and total rainfall volume, Cv% = Total I/I Flow Volume / Total Precipitation Volume * 100% 7 Peak I/ I Coefficient: The ratio of peak I/I flow and peak rainfall intensity, Peak I/ I Coefficient = Peak I/I Flow / (Peak Rainfall Intensity over Tc * Catchment Area) 8 Hourly Wet‐Weather Peaking Factor: The ratio of peak hourly wet‐weather measured flow and average dry‐weather flow, Wet‐Weather Peaking Factor = Peak Hourly Wet‐Weather Measured Flow / Average Dry-Weather Flow 9 Instantaneous Wet‐Weather Peaking Factor: The ratio of peak wet‐weather measured flow and average dry‐weather flow, Wet‐Weather Peaking Factor = Peak Wet‐Weather Measured Flow / Average Dry-Weather Flow 2
745 Civica Infrastructure Inc. www.civi.ca
Civica Infrastructures Inc. Kawartha Lakes Flow Monitoring Report
Appendix - A June 03, 2024
I/I Analysis Graph Station: L9
746 Civica Infrastructure Inc. www.civi.ca
Civica Infrastructures Inc. Kawartha Lakes Flow Monitoring Report
Appendix - A June 03, 2024
Infiltration/Inflow Event Analysis Station: L9 Mar 31, 2023 00:55 – Apr 01, 2023 16:55, Total Precipitation: 29.25 mm (20,855,250.00 L) Station Details
Storm Details
Catchment Area
71.30 ha
Total Precipitation
29.25 mm (20,855,250.00 L)
Duration of Storm
16.00 hr
Time of Concentration (Tc) 1
25 min
Peak Precipitation Intensity Over Tc 2
9.00 mm/hr
Return Period over Tc 3
< 2 Yr
Measured Flow
I/I Flow
Time of Peak Measured Flow
Apr 01, 2023 08:05
Time of Peak I/I Flow (TD)
Apr 01, 2023 05:35
Estimated Dry Weather Flow at TD
4.01 L/s
Peak Measured Flow
11.91 L/s
Peak I/I Flow 4
7.78 L/s
Peak I/I Rate 5
0.11 L/s/ha
Peak Measured Depth
96.00 mm
Total I/I Flow Volume during event
128,331.40 L
Volumetric Coefficient (Cv%) 6
0.62%
Total Measured Flow Volume during Event
422,813.30 L
Peak I/I Coefficient 7
0.0044
Hourly Wet-Weather Peaking Factor 8
3.30
Instantaneous Wet-Weather Peaking Factor 9
4.09
1
Time of Concentration (Tc): The estimated time for the flow to travel from the furthest point in the upstream area to the point of monitoring, assume flow is travelling at 1.00 m/s Peak Precipitation Intensity Over Tc: The peak rainfall intensity for the duration of the storm with the time interval defined by time of concentration 3 Return Period over Tc: The estimated time to elapse before a storm of equal or greater intensity will likely occur again, based on design storm criteria 4 Peak I/I Flow: The greatest difference captured between measured flow and estimated dry weather flow, Peak I/I Flow = Maximum (Measured Flow – Estimated Dry Weather Flow) 5 Peak I/I Rate: A normalized peak I/I flow based on catchment area size, Peak I/I Rate = Peak I/I Flow / Catchment Area 6 Volumetric Coefficient (Cv%): The ratio of total I/I volume and total rainfall volume, Cv% = Total I/I Flow Volume / Total Precipitation Volume * 100% 7 Peak I/ I Coefficient: The ratio of peak I/I flow and peak rainfall intensity, Peak I/ I Coefficient = Peak I/I Flow / (Peak Rainfall Intensity over Tc * Catchment Area) 8 Hourly Wet‐Weather Peaking Factor: The ratio of peak hourly wet‐weather measured flow and average dry‐weather flow, Wet‐Weather Peaking Factor = Peak Hourly Wet‐Weather Measured Flow / Average Dry-Weather Flow 9 Instantaneous Wet‐Weather Peaking Factor: The ratio of peak wet‐weather measured flow and average dry‐weather flow, Wet‐Weather Peaking Factor = Peak Wet‐Weather Measured Flow / Average Dry-Weather Flow 2
747 Civica Infrastructure Inc. www.civi.ca
Civica Infrastructures Inc. Kawartha Lakes Flow Monitoring Report
Appendix - A June 03, 2024
I/I Analysis Graph Station: L9
748 Civica Infrastructure Inc. www.civi.ca
Civica Infrastructures Inc. Kawartha Lakes Flow Monitoring Report
Appendix - A June 03, 2024
Infiltration/Inflow Event Analysis Station: L9 Apr 04, 2023 17:45 – Apr 06, 2023 10:10, Total Precipitation: 21.75 mm (15,507,750.00 L) Station Details
Storm Details
Catchment Area
71.30 ha
Total Precipitation
21.75 mm (15,507,750.00 L)
Duration of Storm
16.42 hr
Time of Concentration (Tc) 1
25 min
Peak Precipitation Intensity Over Tc 2
13.20 mm/hr
Return Period over Tc 3
< 2 Yr
Measured Flow
I/I Flow
Time of Peak Measured Flow
Apr 05, 2023 17:40
Time of Peak I/I Flow (TD)
Apr 05, 2023 17:40
Estimated Dry Weather Flow at TD
5.52 L/s
Peak Measured Flow
17.00 L/s
Peak I/I Flow 4
11.48 L/s
Peak I/I Rate 5
0.16 L/s/ha
Peak Measured Depth
93.00 mm
Total I/I Flow Volume during event
388,655.10 L
Volumetric Coefficient (Cv%) 6
2.51%
Total Measured Flow Volume during Event
873,512.60 L
Peak I/I Coefficient 7
0.0044
Hourly Wet-Weather Peaking Factor 8
3.02
Instantaneous Wet-Weather Peaking Factor 9
3.60
1
Time of Concentration (Tc): The estimated time for the flow to travel from the furthest point in the upstream area to the point of monitoring, assume flow is travelling at 1.00 m/s Peak Precipitation Intensity Over Tc: The peak rainfall intensity for the duration of the storm with the time interval defined by time of concentration 3 Return Period over Tc: The estimated time to elapse before a storm of equal or greater intensity will likely occur again, based on design storm criteria 4 Peak I/I Flow: The greatest difference captured between measured flow and estimated dry weather flow, Peak I/I Flow = Maximum (Measured Flow – Estimated Dry Weather Flow) 5 Peak I/I Rate: A normalized peak I/I flow based on catchment area size, Peak I/I Rate = Peak I/I Flow / Catchment Area 6 Volumetric Coefficient (Cv%): The ratio of total I/I volume and total rainfall volume, Cv% = Total I/I Flow Volume / Total Precipitation Volume * 100% 7 Peak I/ I Coefficient: The ratio of peak I/I flow and peak rainfall intensity, Peak I/ I Coefficient = Peak I/I Flow / (Peak Rainfall Intensity over Tc * Catchment Area) 8 Hourly Wet‐Weather Peaking Factor: The ratio of peak hourly wet‐weather measured flow and average dry‐weather flow, Wet‐Weather Peaking Factor = Peak Hourly Wet‐Weather Measured Flow / Average Dry-Weather Flow 9 Instantaneous Wet‐Weather Peaking Factor: The ratio of peak wet‐weather measured flow and average dry‐weather flow, Wet‐Weather Peaking Factor = Peak Wet‐Weather Measured Flow / Average Dry-Weather Flow 2
749 Civica Infrastructure Inc. www.civi.ca
Civica Infrastructures Inc. Kawartha Lakes Flow Monitoring Report
Appendix - A June 03, 2024
I/I Analysis Graph Station: L9
750 Civica Infrastructure Inc. www.civi.ca
Civica Infrastructures Inc. Kawartha Lakes Flow Monitoring Report
Appendix - A June 03, 2024
Infiltration/Inflow Event Analysis Station: L9 Apr 16, 2023 10:15 – Apr 17, 2023 14:20, Total Precipitation: 17.25 mm (12,299,250.00 L) Station Details
Storm Details
Catchment Area
71.30 ha
Total Precipitation
17.25 mm (12,299,250.00 L)
Duration of Storm
4.08 hr
Time of Concentration (Tc) 1
25 min
Peak Precipitation Intensity Over Tc 2
10.20 mm/hr
Return Period over Tc 3
< 2 Yr
Measured Flow
I/I Flow
Time of Peak Measured Flow
Apr 17, 2023 08:55
Time of Peak I/I Flow (TD)
Apr 17, 2023 08:50
Estimated Dry Weather Flow at TD
5.84 L/s
Peak Measured Flow
9.62 L/s
Peak I/I Flow 4
3.74 L/s
Peak I/I Rate 5
0.05 L/s/ha
Peak Measured Depth
70.00 mm
Total I/I Flow Volume during event
44,941.40 L
Volumetric Coefficient (Cv%) 6
0.37%
Total Measured Flow Volume during Event
298,585.00 L
Peak I/I Coefficient 7
0.0019
Hourly Wet-Weather Peaking Factor 8
2.02
Instantaneous Wet-Weather Peaking Factor 9
2.21
1
Time of Concentration (Tc): The estimated time for the flow to travel from the furthest point in the upstream area to the point of monitoring, assume flow is travelling at 1.00 m/s Peak Precipitation Intensity Over Tc: The peak rainfall intensity for the duration of the storm with the time interval defined by time of concentration 3 Return Period over Tc: The estimated time to elapse before a storm of equal or greater intensity will likely occur again, based on design storm criteria 4 Peak I/I Flow: The greatest difference captured between measured flow and estimated dry weather flow, Peak I/I Flow = Maximum (Measured Flow – Estimated Dry Weather Flow) 5 Peak I/I Rate: A normalized peak I/I flow based on catchment area size, Peak I/I Rate = Peak I/I Flow / Catchment Area 6 Volumetric Coefficient (Cv%): The ratio of total I/I volume and total rainfall volume, Cv% = Total I/I Flow Volume / Total Precipitation Volume * 100% 7 Peak I/ I Coefficient: The ratio of peak I/I flow and peak rainfall intensity, Peak I/ I Coefficient = Peak I/I Flow / (Peak Rainfall Intensity over Tc * Catchment Area) 8 Hourly Wet‐Weather Peaking Factor: The ratio of peak hourly wet‐weather measured flow and average dry‐weather flow, Wet‐Weather Peaking Factor = Peak Hourly Wet‐Weather Measured Flow / Average Dry-Weather Flow 9 Instantaneous Wet‐Weather Peaking Factor: The ratio of peak wet‐weather measured flow and average dry‐weather flow, Wet‐Weather Peaking Factor = Peak Wet‐Weather Measured Flow / Average Dry-Weather Flow 2
751 Civica Infrastructure Inc. www.civi.ca
Civica Infrastructures Inc. Kawartha Lakes Flow Monitoring Report
Appendix - A June 03, 2024
I/I Analysis Graph Station: L9
752 Civica Infrastructure Inc. www.civi.ca
Civica Infrastructures Inc. Kawartha Lakes Flow Monitoring Report
Appendix - A June 03, 2024
Infiltration/Inflow Event Analysis Station: L9 Apr 28, 2023 06:45 – May 01, 2023 10:10, Total Precipitation: 40.25 mm (28,698,250.00 L) Station Details
Storm Details
Catchment Area
71.30 ha
Total Precipitation
40.25 mm (28,698,250.00 L)
Duration of Storm
51.42 hr
Time of Concentration (Tc) 1
25 min
Peak Precipitation Intensity Over Tc 2
7.20 mm/hr
Return Period over Tc 3
< 2 Yr
Measured Flow
I/I Flow
Time of Peak Measured Flow
Apr 30, 2023 20:25
Time of Peak I/I Flow (TD)
Apr 30, 2023 20:25
Estimated Dry Weather Flow at TD
3.74 L/s
Peak Measured Flow
14.42 L/s
Peak I/I Flow 4
10.68 L/s
Peak I/I Rate 5
0.15 L/s/ha
Peak Measured Depth
80.00 mm
Total I/I Flow Volume during event
312,293.40 L
Volumetric Coefficient (Cv%) 6
1.09%
Total Measured Flow Volume during Event
1,177,995.10 L
Peak I/I Coefficient 7
0.0075
Hourly Wet-Weather Peaking Factor 8
3.19
Instantaneous Wet-Weather Peaking Factor 9
3.81
1
Time of Concentration (Tc): The estimated time for the flow to travel from the furthest point in the upstream area to the point of monitoring, assume flow is travelling at 1.00 m/s Peak Precipitation Intensity Over Tc: The peak rainfall intensity for the duration of the storm with the time interval defined by time of concentration 3 Return Period over Tc: The estimated time to elapse before a storm of equal or greater intensity will likely occur again, based on design storm criteria 4 Peak I/I Flow: The greatest difference captured between measured flow and estimated dry weather flow, Peak I/I Flow = Maximum (Measured Flow – Estimated Dry Weather Flow) 5 Peak I/I Rate: A normalized peak I/I flow based on catchment area size, Peak I/I Rate = Peak I/I Flow / Catchment Area 6 Volumetric Coefficient (Cv%): The ratio of total I/I volume and total rainfall volume, Cv% = Total I/I Flow Volume / Total Precipitation Volume * 100% 7 Peak I/ I Coefficient: The ratio of peak I/I flow and peak rainfall intensity, Peak I/ I Coefficient = Peak I/I Flow / (Peak Rainfall Intensity over Tc * Catchment Area) 8 Hourly Wet‐Weather Peaking Factor: The ratio of peak hourly wet‐weather measured flow and average dry‐weather flow, Wet‐Weather Peaking Factor = Peak Hourly Wet‐Weather Measured Flow / Average Dry-Weather Flow 9 Instantaneous Wet‐Weather Peaking Factor: The ratio of peak wet‐weather measured flow and average dry‐weather flow, Wet‐Weather Peaking Factor = Peak Wet‐Weather Measured Flow / Average Dry-Weather Flow 2
753 Civica Infrastructure Inc. www.civi.ca
Civica Infrastructures Inc. Kawartha Lakes Flow Monitoring Report
Appendix - A June 03, 2024
I/I Analysis Graph Station: L9
754 Civica Infrastructure Inc. www.civi.ca
Civica Infrastructures Inc. Kawartha Lakes Flow Monitoring Report
Appendix - A June 03, 2024
Infiltration/Inflow Event Analysis Station: L9 May 19, 2023 08:10 – May 21, 2023 03:30, Total Precipitation: 47.50 mm (33,867,500.00 L) Station Details
Storm Details
Catchment Area
71.30 ha
Total Precipitation
47.50 mm (33,867,500.00 L)
Duration of Storm
19.33 hr
Time of Concentration (Tc) 1
25 min
Peak Precipitation Intensity Over Tc 2
11.40 mm/hr
Return Period over Tc 3
< 2 Yr
Measured Flow
I/I Flow
Time of Peak Measured Flow
May 20, 2023 10:35
Time of Peak I/I Flow (TD)
May 20, 2023 10:35
Estimated Dry Weather Flow at TD
5.38 L/s
Peak Measured Flow
13.23 L/s
Peak I/I Flow 4
7.85 L/s
Peak I/I Rate 5
0.11 L/s/ha
Peak Measured Depth
80.00 mm
Total I/I Flow Volume during event
284,090.10 L
Volumetric Coefficient (Cv%) 6
0.84%
Total Measured Flow Volume during Event
709,632.00 L
Peak I/I Coefficient 7
0.0035
Hourly Wet-Weather Peaking Factor 8
2.95
Instantaneous Wet-Weather Peaking Factor 9
3.52
1
Time of Concentration (Tc): The estimated time for the flow to travel from the furthest point in the upstream area to the point of monitoring, assume flow is travelling at 1.00 m/s Peak Precipitation Intensity Over Tc: The peak rainfall intensity for the duration of the storm with the time interval defined by time of concentration 3 Return Period over Tc: The estimated time to elapse before a storm of equal or greater intensity will likely occur again, based on design storm criteria 4 Peak I/I Flow: The greatest difference captured between measured flow and estimated dry weather flow, Peak I/I Flow = Maximum (Measured Flow – Estimated Dry Weather Flow) 5 Peak I/I Rate: A normalized peak I/I flow based on catchment area size, Peak I/I Rate = Peak I/I Flow / Catchment Area 6 Volumetric Coefficient (Cv%): The ratio of total I/I volume and total rainfall volume, Cv% = Total I/I Flow Volume / Total Precipitation Volume * 100% 7 Peak I/ I Coefficient: The ratio of peak I/I flow and peak rainfall intensity, Peak I/ I Coefficient = Peak I/I Flow / (Peak Rainfall Intensity over Tc * Catchment Area) 8 Hourly Wet‐Weather Peaking Factor: The ratio of peak hourly wet‐weather measured flow and average dry‐weather flow, Wet‐Weather Peaking Factor = Peak Hourly Wet‐Weather Measured Flow / Average Dry-Weather Flow 9 Instantaneous Wet‐Weather Peaking Factor: The ratio of peak wet‐weather measured flow and average dry‐weather flow, Wet‐Weather Peaking Factor = Peak Wet‐Weather Measured Flow / Average Dry-Weather Flow 2
755 Civica Infrastructure Inc. www.civi.ca
Civica Infrastructures Inc. Kawartha Lakes Flow Monitoring Report
Appendix - A June 03, 2024
I/I Analysis Graph Station: L9
756 Civica Infrastructure Inc. www.civi.ca
Civica Infrastructures Inc. Kawartha Lakes Flow Monitoring Report
Appendix - A June 03, 2024
Infiltration/Inflow Event Analysis Station: L9 Jun 11, 2023 07:50 – Jun 13, 2023 09:00, Total Precipitation: 55.25 mm (39,393,250.00 L) Station Details
Storm Details
Catchment Area
71.30 ha
Total Precipitation
55.25 mm (39,393,250.00 L)
Duration of Storm
25.17 hr
Time of Concentration (Tc) 1
25 min
Peak Precipitation Intensity Over Tc 2
13.20 mm/hr
Return Period over Tc 3
< 2 Yr
Measured Flow
I/I Flow
Time of Peak Measured Flow
Jun 12, 2023 14:05
Time of Peak I/I Flow (TD)
Jun 12, 2023 16:30
Estimated Dry Weather Flow at TD
3.85 L/s
Peak Measured Flow
11.49 L/s
Peak I/I Flow 4
7.01 L/s
Peak I/I Rate 5
0.10 L/s/ha
Peak Measured Depth
75.00 mm
Total I/I Flow Volume during event
330,100.00 L
Volumetric Coefficient (Cv%) 6
0.84%
Total Measured Flow Volume during Event
800,074.10 L
Peak I/I Coefficient 7
0.0027
Hourly Wet-Weather Peaking Factor 8
2.78
Instantaneous Wet-Weather Peaking Factor 9
3.28
1
Time of Concentration (Tc): The estimated time for the flow to travel from the furthest point in the upstream area to the point of monitoring, assume flow is travelling at 1.00 m/s Peak Precipitation Intensity Over Tc: The peak rainfall intensity for the duration of the storm with the time interval defined by time of concentration 3 Return Period over Tc: The estimated time to elapse before a storm of equal or greater intensity will likely occur again, based on design storm criteria 4 Peak I/I Flow: The greatest difference captured between measured flow and estimated dry weather flow, Peak I/I Flow = Maximum (Measured Flow – Estimated Dry Weather Flow) 5 Peak I/I Rate: A normalized peak I/I flow based on catchment area size, Peak I/I Rate = Peak I/I Flow / Catchment Area 6 Volumetric Coefficient (Cv%): The ratio of total I/I volume and total rainfall volume, Cv% = Total I/I Flow Volume / Total Precipitation Volume * 100% 7 Peak I/ I Coefficient: The ratio of peak I/I flow and peak rainfall intensity, Peak I/ I Coefficient = Peak I/I Flow / (Peak Rainfall Intensity over Tc * Catchment Area) 8 Hourly Wet‐Weather Peaking Factor: The ratio of peak hourly wet‐weather measured flow and average dry‐weather flow, Wet‐Weather Peaking Factor = Peak Hourly Wet‐Weather Measured Flow / Average Dry-Weather Flow 9 Instantaneous Wet‐Weather Peaking Factor: The ratio of peak wet‐weather measured flow and average dry‐weather flow, Wet‐Weather Peaking Factor = Peak Wet‐Weather Measured Flow / Average Dry-Weather Flow 2
757 Civica Infrastructure Inc. www.civi.ca
Civica Infrastructures Inc. Kawartha Lakes Flow Monitoring Report
Appendix - A June 03, 2024
I/I Analysis Graph Station: L9
758 Civica Infrastructure Inc. www.civi.ca
Civica Infrastructures Inc. Kawartha Lakes Flow Monitoring Report
Appendix - A June 03, 2024
Infiltration/Inflow Event Analysis Station: L9 Jun 25, 2023 15:00 – Jun 26, 2023 23:20, Total Precipitation: 41.50 mm (29,589,500.00 L) Station Details
Storm Details
Catchment Area
71.30 ha
Total Precipitation
41.50 mm (29,589,500.00 L)
Duration of Storm
8.33 hr
Time of Concentration (Tc) 1
25 min
Peak Precipitation Intensity Over Tc 2
58.20 mm/hr
Return Period over Tc 3
2 - 5 Yr
Measured Flow
I/I Flow
Time of Peak Measured Flow
Jun 26, 2023 11:30
Time of Peak I/I Flow (TD)
Jun 26, 2023 03:25
Estimated Dry Weather Flow at TD
1.79 L/s
Peak Measured Flow
12.61 L/s
Peak I/I Flow 4
10.18 L/s
Peak I/I Rate 5
0.14 L/s/ha
Peak Measured Depth
79.00 mm
Total I/I Flow Volume during event
179,747.10 L
Volumetric Coefficient (Cv%) 6
0.61%
Total Measured Flow Volume during Event
471,801.90 L
Peak I/I Coefficient 7
0.0009
Hourly Wet-Weather Peaking Factor 8
2.34
Instantaneous Wet-Weather Peaking Factor 9
3.17
1
Time of Concentration (Tc): The estimated time for the flow to travel from the furthest point in the upstream area to the point of monitoring, assume flow is travelling at 1.00 m/s Peak Precipitation Intensity Over Tc: The peak rainfall intensity for the duration of the storm with the time interval defined by time of concentration 3 Return Period over Tc: The estimated time to elapse before a storm of equal or greater intensity will likely occur again, based on design storm criteria 4 Peak I/I Flow: The greatest difference captured between measured flow and estimated dry weather flow, Peak I/I Flow = Maximum (Measured Flow – Estimated Dry Weather Flow) 5 Peak I/I Rate: A normalized peak I/I flow based on catchment area size, Peak I/I Rate = Peak I/I Flow / Catchment Area 6 Volumetric Coefficient (Cv%): The ratio of total I/I volume and total rainfall volume, Cv% = Total I/I Flow Volume / Total Precipitation Volume * 100% 7 Peak I/ I Coefficient: The ratio of peak I/I flow and peak rainfall intensity, Peak I/ I Coefficient = Peak I/I Flow / (Peak Rainfall Intensity over Tc * Catchment Area) 8 Hourly Wet‐Weather Peaking Factor: The ratio of peak hourly wet‐weather measured flow and average dry‐weather flow, Wet‐Weather Peaking Factor = Peak Hourly Wet‐Weather Measured Flow / Average Dry-Weather Flow 9 Instantaneous Wet‐Weather Peaking Factor: The ratio of peak wet‐weather measured flow and average dry‐weather flow, Wet‐Weather Peaking Factor = Peak Wet‐Weather Measured Flow / Average Dry-Weather Flow 2
759 Civica Infrastructure Inc. www.civi.ca
Civica Infrastructures Inc. Kawartha Lakes Flow Monitoring Report
Appendix - A June 03, 2024
I/I Analysis Graph Station: L9
760 Civica Infrastructure Inc. www.civi.ca
Civica Infrastructures Inc. Kawartha Lakes Flow Monitoring Report
Appendix - A June 03, 2024
Infiltration/Inflow Event Analysis Station: L9 Jun 26, 2023 20:50 – Jun 28, 2023 02:45, Total Precipitation: 27.75 mm (19,785,750.00 L) Station Details
Storm Details
Catchment Area
71.30 ha
Total Precipitation
27.75 mm (19,785,750.00 L)
Duration of Storm
5.92 hr
Time of Concentration (Tc) 1
25 min
Peak Precipitation Intensity Over Tc 2
15.60 mm/hr
Return Period over Tc 3
< 2 Yr
Measured Flow
I/I Flow
Time of Peak Measured Flow
Jun 27, 2023 14:20
Time of Peak I/I Flow (TD)
Jun 27, 2023 16:15
Estimated Dry Weather Flow at TD
3.66 L/s
Peak Measured Flow
11.45 L/s
Peak I/I Flow 4
7.52 L/s
Peak I/I Rate 5
0.11 L/s/ha
Peak Measured Depth
74.00 mm
Total I/I Flow Volume during event
285,058.50 L
Volumetric Coefficient (Cv%) 6
1.44%
Total Measured Flow Volume during Event
520,018.50 L
Peak I/I Coefficient 7
0.0024
Hourly Wet-Weather Peaking Factor 8
2.84
Instantaneous Wet-Weather Peaking Factor 9
3.16
1
Time of Concentration (Tc): The estimated time for the flow to travel from the furthest point in the upstream area to the point of monitoring, assume flow is travelling at 1.00 m/s Peak Precipitation Intensity Over Tc: The peak rainfall intensity for the duration of the storm with the time interval defined by time of concentration 3 Return Period over Tc: The estimated time to elapse before a storm of equal or greater intensity will likely occur again, based on design storm criteria 4 Peak I/I Flow: The greatest difference captured between measured flow and estimated dry weather flow, Peak I/I Flow = Maximum (Measured Flow – Estimated Dry Weather Flow) 5 Peak I/I Rate: A normalized peak I/I flow based on catchment area size, Peak I/I Rate = Peak I/I Flow / Catchment Area 6 Volumetric Coefficient (Cv%): The ratio of total I/I volume and total rainfall volume, Cv% = Total I/I Flow Volume / Total Precipitation Volume * 100% 7 Peak I/ I Coefficient: The ratio of peak I/I flow and peak rainfall intensity, Peak I/ I Coefficient = Peak I/I Flow / (Peak Rainfall Intensity over Tc * Catchment Area) 8 Hourly Wet‐Weather Peaking Factor: The ratio of peak hourly wet‐weather measured flow and average dry‐weather flow, Wet‐Weather Peaking Factor = Peak Hourly Wet‐Weather Measured Flow / Average Dry-Weather Flow 9 Instantaneous Wet‐Weather Peaking Factor: The ratio of peak wet‐weather measured flow and average dry‐weather flow, Wet‐Weather Peaking Factor = Peak Wet‐Weather Measured Flow / Average Dry-Weather Flow 2
761 Civica Infrastructure Inc. www.civi.ca
Civica Infrastructures Inc. Kawartha Lakes Flow Monitoring Report
Appendix - A June 03, 2024
I/I Analysis Graph Station: L9
762 Civica Infrastructure Inc. www.civi.ca
Civica Infrastructures Inc. Kawartha Lakes Flow Monitoring Report
Appendix - A June 03, 2024
Infiltration/Inflow Event Analysis Station: L9 Jul 12, 2023 14:40 – Jul 13, 2023 18:50, Total Precipitation: 20.25 mm (14,438,250.00 L) Station Details
Storm Details
Catchment Area
71.30 ha
Total Precipitation
20.25 mm (14,438,250.00 L)
Duration of Storm
4.17 hr
Time of Concentration (Tc) 1
25 min
Peak Precipitation Intensity Over Tc 2
15.60 mm/hr
Return Period over Tc 3
< 2 Yr
Measured Flow
I/I Flow
Time of Peak Measured Flow
Jul 13, 2023 07:50
Time of Peak I/I Flow (TD)
Jul 13, 2023 04:20
Estimated Dry Weather Flow at TD
1.67 L/s
Peak Measured Flow
8.42 L/s
Peak I/I Flow 4
5.34 L/s
Peak I/I Rate 5
0.08 L/s/ha
Peak Measured Depth
62.00 mm
Total I/I Flow Volume during event
93,238.90 L
Volumetric Coefficient (Cv%) 6
0.65%
Total Measured Flow Volume during Event
298,036.80 L
Peak I/I Coefficient 7
0.0017
Hourly Wet-Weather Peaking Factor 8
2.03
Instantaneous Wet-Weather Peaking Factor 9
2.40
1
Time of Concentration (Tc): The estimated time for the flow to travel from the furthest point in the upstream area to the point of monitoring, assume flow is travelling at 1.00 m/s Peak Precipitation Intensity Over Tc: The peak rainfall intensity for the duration of the storm with the time interval defined by time of concentration 3 Return Period over Tc: The estimated time to elapse before a storm of equal or greater intensity will likely occur again, based on design storm criteria 4 Peak I/I Flow: The greatest difference captured between measured flow and estimated dry weather flow, Peak I/I Flow = Maximum (Measured Flow – Estimated Dry Weather Flow) 5 Peak I/I Rate: A normalized peak I/I flow based on catchment area size, Peak I/I Rate = Peak I/I Flow / Catchment Area 6 Volumetric Coefficient (Cv%): The ratio of total I/I volume and total rainfall volume, Cv% = Total I/I Flow Volume / Total Precipitation Volume * 100% 7 Peak I/ I Coefficient: The ratio of peak I/I flow and peak rainfall intensity, Peak I/ I Coefficient = Peak I/I Flow / (Peak Rainfall Intensity over Tc * Catchment Area) 8 Hourly Wet‐Weather Peaking Factor: The ratio of peak hourly wet‐weather measured flow and average dry‐weather flow, Wet‐Weather Peaking Factor = Peak Hourly Wet‐Weather Measured Flow / Average Dry-Weather Flow 9 Instantaneous Wet‐Weather Peaking Factor: The ratio of peak wet‐weather measured flow and average dry‐weather flow, Wet‐Weather Peaking Factor = Peak Wet‐Weather Measured Flow / Average Dry-Weather Flow 2
763 Civica Infrastructure Inc. www.civi.ca
Civica Infrastructures Inc. Kawartha Lakes Flow Monitoring Report
Appendix - A June 03, 2024
I/I Analysis Graph Station: L9
764 Civica Infrastructure Inc. www.civi.ca
Civica Infrastructures Inc. Kawartha Lakes Flow Monitoring Report
Appendix - A June 03, 2024
Infiltration/Inflow Event Analysis Station: L9 Jul 20, 2023 07:00 – Jul 21, 2023 09:20, Total Precipitation: 16.50 mm (11,764,500.00 L) Station Details
Storm Details
Catchment Area
71.30 ha
Total Precipitation
16.50 mm (11,764,500.00 L)
Duration of Storm
2.33 hr
Time of Concentration (Tc) 1
25 min
Peak Precipitation Intensity Over Tc 2
28.20 mm/hr
Return Period over Tc 3
< 2 Yr
Measured Flow
I/I Flow
Time of Peak Measured Flow
Jul 20, 2023 19:45
Time of Peak I/I Flow (TD)
Jul 20, 2023 19:45
Estimated Dry Weather Flow at TD
3.13 L/s
Peak Measured Flow
8.98 L/s
Peak I/I Flow 4
5.84 L/s
Peak I/I Rate 5
0.08 L/s/ha
Peak Measured Depth
70.00 mm
Total I/I Flow Volume during event
32,103.00 L
Volumetric Coefficient (Cv%) 6
0.27%
Total Measured Flow Volume during Event
151,467.70 L
Peak I/I Coefficient 7
0.0011
Hourly Wet-Weather Peaking Factor 8
2.53
Instantaneous Wet-Weather Peaking Factor 9
3.90
1
Time of Concentration (Tc): The estimated time for the flow to travel from the furthest point in the upstream area to the point of monitoring, assume flow is travelling at 1.00 m/s Peak Precipitation Intensity Over Tc: The peak rainfall intensity for the duration of the storm with the time interval defined by time of concentration 3 Return Period over Tc: The estimated time to elapse before a storm of equal or greater intensity will likely occur again, based on design storm criteria 4 Peak I/I Flow: The greatest difference captured between measured flow and estimated dry weather flow, Peak I/I Flow = Maximum (Measured Flow – Estimated Dry Weather Flow) 5 Peak I/I Rate: A normalized peak I/I flow based on catchment area size, Peak I/I Rate = Peak I/I Flow / Catchment Area 6 Volumetric Coefficient (Cv%): The ratio of total I/I volume and total rainfall volume, Cv% = Total I/I Flow Volume / Total Precipitation Volume * 100% 7 Peak I/ I Coefficient: The ratio of peak I/I flow and peak rainfall intensity, Peak I/ I Coefficient = Peak I/I Flow / (Peak Rainfall Intensity over Tc * Catchment Area) 8 Hourly Wet‐Weather Peaking Factor: The ratio of peak hourly wet‐weather measured flow and average dry‐weather flow, Wet‐Weather Peaking Factor = Peak Hourly Wet‐Weather Measured Flow / Average Dry-Weather Flow 9 Instantaneous Wet‐Weather Peaking Factor: The ratio of peak wet‐weather measured flow and average dry‐weather flow, Wet‐Weather Peaking Factor = Peak Wet‐Weather Measured Flow / Average Dry-Weather Flow 2
765 Civica Infrastructure Inc. www.civi.ca
Civica Infrastructures Inc. Kawartha Lakes Flow Monitoring Report
Appendix - A June 03, 2024
I/I Analysis Graph Station: L9
766 Civica Infrastructure Inc. www.civi.ca
Civica Infrastructures Inc. Kawartha Lakes Flow Monitoring Report
Appendix - A June 03, 2024
Infiltration/Inflow Event Analysis Station: L9 Aug 03, 2023 04:05 – Aug 04, 2023 08:45, Total Precipitation: 28.75 mm (20,498,750.00 L) Station Details
Storm Details
Catchment Area
71.30 ha
Total Precipitation
28.75 mm (20,498,750.00 L)
Duration of Storm
4.67 hr
Time of Concentration (Tc) 1
25 min
Peak Precipitation Intensity Over Tc 2
40.20 mm/hr
Return Period over Tc 3
< 2 Yr
Measured Flow
I/I Flow
Time of Peak Measured Flow
Aug 03, 2023 16:30
Time of Peak I/I Flow (TD)
Aug 03, 2023 16:30
Estimated Dry Weather Flow at TD
2.07 L/s
Peak Measured Flow
8.54 L/s
Peak I/I Flow 4
6.47 L/s
Peak I/I Rate 5
0.09 L/s/ha
Peak Measured Depth
74.00 mm
Total I/I Flow Volume during event
19,678.10 L
Volumetric Coefficient (Cv%) 6
0.10%
Total Measured Flow Volume during Event
102,490.70 L
Peak I/I Coefficient 7
0.0008
Hourly Wet-Weather Peaking Factor 8
3.55
Instantaneous Wet-Weather Peaking Factor 9
6.22
1
Time of Concentration (Tc): The estimated time for the flow to travel from the furthest point in the upstream area to the point of monitoring, assume flow is travelling at 1.00 m/s Peak Precipitation Intensity Over Tc: The peak rainfall intensity for the duration of the storm with the time interval defined by time of concentration 3 Return Period over Tc: The estimated time to elapse before a storm of equal or greater intensity will likely occur again, based on design storm criteria 4 Peak I/I Flow: The greatest difference captured between measured flow and estimated dry weather flow, Peak I/I Flow = Maximum (Measured Flow – Estimated Dry Weather Flow) 5 Peak I/I Rate: A normalized peak I/I flow based on catchment area size, Peak I/I Rate = Peak I/I Flow / Catchment Area 6 Volumetric Coefficient (Cv%): The ratio of total I/I volume and total rainfall volume, Cv% = Total I/I Flow Volume / Total Precipitation Volume * 100% 7 Peak I/ I Coefficient: The ratio of peak I/I flow and peak rainfall intensity, Peak I/ I Coefficient = Peak I/I Flow / (Peak Rainfall Intensity over Tc * Catchment Area) 8 Hourly Wet‐Weather Peaking Factor: The ratio of peak hourly wet‐weather measured flow and average dry‐weather flow, Wet‐Weather Peaking Factor = Peak Hourly Wet‐Weather Measured Flow / Average Dry-Weather Flow 9 Instantaneous Wet‐Weather Peaking Factor: The ratio of peak wet‐weather measured flow and average dry‐weather flow, Wet‐Weather Peaking Factor = Peak Wet‐Weather Measured Flow / Average Dry-Weather Flow 2
767 Civica Infrastructure Inc. www.civi.ca
Civica Infrastructures Inc. Kawartha Lakes Flow Monitoring Report
Appendix - A June 03, 2024
I/I Analysis Graph Station: L9
768 Civica Infrastructure Inc. www.civi.ca
Civica Infrastructures Inc. Kawartha Lakes Flow Monitoring Report
Appendix - A June 03, 2024
Infiltration/Inflow Event Analysis Station: L9 Aug 17, 2023 10:25 – Aug 19, 2023 07:55, Total Precipitation: 22.50 mm (16,042,500.00 L) Station Details
Storm Details
Catchment Area
71.30 ha
Total Precipitation
22.50 mm (16,042,500.00 L)
Duration of Storm
21.50 hr
Time of Concentration (Tc) 1
25 min
Peak Precipitation Intensity Over Tc 2
19.80 mm/hr
Return Period over Tc 3
< 2 Yr
Measured Flow
I/I Flow
Time of Peak Measured Flow
Aug 18, 2023 12:20
Time of Peak I/I Flow (TD)
Aug 18, 2023 12:30
Estimated Dry Weather Flow at TD
2.78 L/s
Peak Measured Flow
6.35 L/s
Peak I/I Flow 4
3.57 L/s
Peak I/I Rate 5
0.05 L/s/ha
Peak Measured Depth
58.00 mm
Total I/I Flow Volume during event
44,830.50 L
Volumetric Coefficient (Cv%) 6
0.28%
Total Measured Flow Volume during Event
284,510.30 L
Peak I/I Coefficient 7
0.0009
Hourly Wet-Weather Peaking Factor 8
2.76
Instantaneous Wet-Weather Peaking Factor 9
3.20
1
Time of Concentration (Tc): The estimated time for the flow to travel from the furthest point in the upstream area to the point of monitoring, assume flow is travelling at 1.00 m/s Peak Precipitation Intensity Over Tc: The peak rainfall intensity for the duration of the storm with the time interval defined by time of concentration 3 Return Period over Tc: The estimated time to elapse before a storm of equal or greater intensity will likely occur again, based on design storm criteria 4 Peak I/I Flow: The greatest difference captured between measured flow and estimated dry weather flow, Peak I/I Flow = Maximum (Measured Flow – Estimated Dry Weather Flow) 5 Peak I/I Rate: A normalized peak I/I flow based on catchment area size, Peak I/I Rate = Peak I/I Flow / Catchment Area 6 Volumetric Coefficient (Cv%): The ratio of total I/I volume and total rainfall volume, Cv% = Total I/I Flow Volume / Total Precipitation Volume * 100% 7 Peak I/ I Coefficient: The ratio of peak I/I flow and peak rainfall intensity, Peak I/ I Coefficient = Peak I/I Flow / (Peak Rainfall Intensity over Tc * Catchment Area) 8 Hourly Wet‐Weather Peaking Factor: The ratio of peak hourly wet‐weather measured flow and average dry‐weather flow, Wet‐Weather Peaking Factor = Peak Hourly Wet‐Weather Measured Flow / Average Dry-Weather Flow 9 Instantaneous Wet‐Weather Peaking Factor: The ratio of peak wet‐weather measured flow and average dry‐weather flow, Wet‐Weather Peaking Factor = Peak Wet‐Weather Measured Flow / Average Dry-Weather Flow 2
769 Civica Infrastructure Inc. www.civi.ca
Civica Infrastructures Inc. Kawartha Lakes Flow Monitoring Report
Appendix - A June 03, 2024
I/I Analysis Graph Station: L9
770 Civica Infrastructure Inc. www.civi.ca
Civica Infrastructures Inc. Kawartha Lakes Flow Monitoring Report
Appendix - A June 03, 2024
Infiltration/Inflow Event Analysis Station: L9 Sep 07, 2023 02:55 – Sep 08, 2023 03:40, Total Precipitation: 38.25 mm (27,272,250.00 L) Station Details
Storm Details
Catchment Area
71.30 ha
Total Precipitation
38.25 mm (27,272,250.00 L)
Duration of Storm
0.75 hr
Time of Concentration (Tc) 1
25 min
Peak Precipitation Intensity Over Tc 2
60.60 mm/hr
Return Period over Tc 3
2 - 5 Yr
Measured Flow
I/I Flow
Time of Peak Measured Flow
Sep 07, 2023 15:45
Time of Peak I/I Flow (TD)
Sep 07, 2023 15:45
Estimated Dry Weather Flow at TD
2.44 L/s
Peak Measured Flow
10.90 L/s
Peak I/I Flow 4
8.46 L/s
Peak I/I Rate 5
0.12 L/s/ha
Peak Measured Depth
124.00 mm
Total I/I Flow Volume during event
20,840.60 L
Volumetric Coefficient (Cv%) 6
0.08%
Total Measured Flow Volume during Event
70,341.20 L
Peak I/I Coefficient 7
0.0007
Hourly Wet-Weather Peaking Factor 8
6.33
Instantaneous Wet-Weather Peaking Factor 9
10.17
1
Time of Concentration (Tc): The estimated time for the flow to travel from the furthest point in the upstream area to the point of monitoring, assume flow is travelling at 1.00 m/s Peak Precipitation Intensity Over Tc: The peak rainfall intensity for the duration of the storm with the time interval defined by time of concentration 3 Return Period over Tc: The estimated time to elapse before a storm of equal or greater intensity will likely occur again, based on design storm criteria 4 Peak I/I Flow: The greatest difference captured between measured flow and estimated dry weather flow, Peak I/I Flow = Maximum (Measured Flow – Estimated Dry Weather Flow) 5 Peak I/I Rate: A normalized peak I/I flow based on catchment area size, Peak I/I Rate = Peak I/I Flow / Catchment Area 6 Volumetric Coefficient (Cv%): The ratio of total I/I volume and total rainfall volume, Cv% = Total I/I Flow Volume / Total Precipitation Volume * 100% 7 Peak I/ I Coefficient: The ratio of peak I/I flow and peak rainfall intensity, Peak I/ I Coefficient = Peak I/I Flow / (Peak Rainfall Intensity over Tc * Catchment Area) 8 Hourly Wet‐Weather Peaking Factor: The ratio of peak hourly wet‐weather measured flow and average dry‐weather flow, Wet‐Weather Peaking Factor = Peak Hourly Wet‐Weather Measured Flow / Average Dry-Weather Flow 9 Instantaneous Wet‐Weather Peaking Factor: The ratio of peak wet‐weather measured flow and average dry‐weather flow, Wet‐Weather Peaking Factor = Peak Wet‐Weather Measured Flow / Average Dry-Weather Flow 2
771 Civica Infrastructure Inc. www.civi.ca
Civica Infrastructures Inc. Kawartha Lakes Flow Monitoring Report
Appendix - A June 03, 2024
I/I Analysis Graph Station: L9
772 Civica Infrastructure Inc. www.civi.ca
Civica Infrastructures Inc. Kawartha Lakes Flow Monitoring Report
Appendix - A June 03, 2024
Infiltration/Inflow Event Analysis Station: L9 Sep 11, 2023 18:50 – Sep 13, 2023 02:40, Total Precipitation: 18.00 mm (12,834,000.00 L) Station Details
Storm Details
Catchment Area
71.30 ha
Total Precipitation
18.00 mm (12,834,000.00 L)
Duration of Storm
7.83 hr
Time of Concentration (Tc) 1
25 min
Peak Precipitation Intensity Over Tc 2
11.40 mm/hr
Return Period over Tc 3
< 2 Yr
Measured Flow
I/I Flow
Time of Peak Measured Flow
Sep 12, 2023 10:10
Time of Peak I/I Flow (TD)
Sep 12, 2023 10:10
Estimated Dry Weather Flow at TD
2.65 L/s
Peak Measured Flow
6.99 L/s
Peak I/I Flow 4
4.34 L/s
Peak I/I Rate 5
0.06 L/s/ha
Peak Measured Depth
57.00 mm
Total I/I Flow Volume during event
35,397.60 L
Volumetric Coefficient (Cv%) 6
0.28%
Total Measured Flow Volume during Event
193,988.30 L
Peak I/I Coefficient 7
0.0019
Hourly Wet-Weather Peaking Factor 8
2.22
Instantaneous Wet-Weather Peaking Factor 9
3.16
1
Time of Concentration (Tc): The estimated time for the flow to travel from the furthest point in the upstream area to the point of monitoring, assume flow is travelling at 1.00 m/s Peak Precipitation Intensity Over Tc: The peak rainfall intensity for the duration of the storm with the time interval defined by time of concentration 3 Return Period over Tc: The estimated time to elapse before a storm of equal or greater intensity will likely occur again, based on design storm criteria 4 Peak I/I Flow: The greatest difference captured between measured flow and estimated dry weather flow, Peak I/I Flow = Maximum (Measured Flow – Estimated Dry Weather Flow) 5 Peak I/I Rate: A normalized peak I/I flow based on catchment area size, Peak I/I Rate = Peak I/I Flow / Catchment Area 6 Volumetric Coefficient (Cv%): The ratio of total I/I volume and total rainfall volume, Cv% = Total I/I Flow Volume / Total Precipitation Volume * 100% 7 Peak I/ I Coefficient: The ratio of peak I/I flow and peak rainfall intensity, Peak I/ I Coefficient = Peak I/I Flow / (Peak Rainfall Intensity over Tc * Catchment Area) 8 Hourly Wet‐Weather Peaking Factor: The ratio of peak hourly wet‐weather measured flow and average dry‐weather flow, Wet‐Weather Peaking Factor = Peak Hourly Wet‐Weather Measured Flow / Average Dry-Weather Flow 9 Instantaneous Wet‐Weather Peaking Factor: The ratio of peak wet‐weather measured flow and average dry‐weather flow, Wet‐Weather Peaking Factor = Peak Wet‐Weather Measured Flow / Average Dry-Weather Flow 2
773 Civica Infrastructure Inc. www.civi.ca
Civica Infrastructures Inc. Kawartha Lakes Flow Monitoring Report
Appendix - A June 03, 2024
Activity Log Station: L9 Date Time
Type
Purpose of Visit
Comment
Calibration Measurement
10-Jan-2023 08:56:00 AM
Installation Log
INSTALLATION
MEASUREMENTS TAKEN, LOGGER INSTALLED, PHOTOS TAKEN,, ANTENNA DRILLED
Yes
Yes
18-Jan-2023 02:33:00 PM
Maintenance Log
CALIBRATION
DATA DOWNLOADED, TELEMETRY SENT ENTRY MADE PHOTOS/VIDEOS TAKEN, MEASUREMENTS TAKEN, SITE CALIBRATED ANTENNA SWAPPED
03-Mar-2023 10:05:00 AM
Maintenance Log
CALIBRATION
TC SET,DATA DOWNLOADED,TELEMETRY SENT,,DEBRIS AND SILT REMOVED,SITE CALIBRATED,ANTENNA REPLACED,PHOTOS AND VIDEOS TAKEN
Yes
03-Apr-2023 02:25:00 PM
Maintenance Log
CALIBRATION
TC SET,DATA DOWNLOADED, PHOTOS TAKEN, TELEMETRY SENT,DESSICANT CHECKED,BATTERY CHECKED,ANTENNA IN GOOD CONDITION,SITE CALIBRATED,SITE CLEARED
Yes
11-May-2023 08:20:00 AM
Maintenance Log
CALIBRATION
TC SET,SURVEY SENT,DOWNLOADED DATA, SENT TELEMETRY , MADE ENTRY, TOOK PHOTOS/VIDEOS, TOOK MEASUREMENTS,DEBRIS AND SILT CLEARED,DESSICANT GOOD,ANTENNA GOOD, CALIBRATED SITE
Yes
Yes
21-Jun-2023 10:00:00 AM
Maintenance Log
CALIBRATION
DATA DOWNLOADED, TELEMETRY SENT ENTRY MADE PHOTOS/VIDEOS TAKEN, MEASUREMENTS TAKEN, VELOCITY FLATLINED.SWAP LOGGER SITE CALIBRATED
22-Aug-2023 11:40:00 AM
Maintenance Log
DATA DOWNLOAD
TC SET,DATA DOWNLOADED,TELEMETRY SENT,DESSICANT CHECKED,ANTENNA CHECKED,SITE CLEARED
Yes
04-Oct-2023 10:35:00 AM
Removal Log
REMOVAL
TRAFFIC CONTROL SENT, DATA DOWNLOADED, TELEMETRY SENT, CALIBRATION DONE, EQUIPMENT REMOVED, LOGGER TAG, PHOTOS AND VIDEOS BEFORE AND AFTER TAKEN.
Yes
774 Civica Infrastructure Inc. www.civi.ca
Civica Infrastructures Inc. Kawartha Lakes Flow Monitoring Report
Appendix - A June 03, 2024
Aggregate Data Station: L10
Precipitation Date From
Date To
Days
Min (mm)
Avg (mm)
Max (mm)
Sum (mm)
Count
Time of Min1
Time of Max1
Jan 09, 2023
Oct 04, 2023
261
0.00
0.01
12.00
504.55
74,606
Mon Jan 09, 2023 00:00
Thu Aug 03, 2023 16:10
Level Date From
Date To
Days
Min (m)
Avg (m)
Max (m)
Count
Time of Min1
Time of Max1
Jan 09, 2023
Oct 04, 2023
246
0.07
0.11
0.24
70,250
Wed Mar 15, 2023 02:05
Thu Feb 09, 2023 18:05
Velocity Date From
Date To
Days
Min (m/s)
Avg (m/s)
Max (m/s)
Count
Time of Min1
Time of Max1
Jan 09, 2023
Oct 04, 2023
246
0.19
0.44
0.87
70,250
Thu Jul 20, 2023 03:40
Sat May 20, 2023 09:40
Flow
1
Date From
Date To
Days
Min (L/s)
Avg (L/s)
Max (L/s)
Total Volume (1,000,000 L)
Count
Time of Min1
Time of Max1
Jan 09, 2023
Oct 04, 2023
246
2.61
12.03
64.34
253.56
70,250
Wed Mar 15, 2023 02:05
Thu Feb 09, 2023 18:20
Time of Min and Time of Max will be displayed by first occurrence
775 Civica Infrastructure Inc. www.civi.ca
Civica Infrastructures Inc. Kawartha Lakes Flow Monitoring Report
Appendix - A June 03, 2024
Data Chart Station: L10 Jan 09, 2023 – Jan 31, 2023
776 Civica Infrastructure Inc. www.civi.ca
Civica Infrastructures Inc. Kawartha Lakes Flow Monitoring Report
Appendix - A June 03, 2024
Data Chart Station: L10 Feb 01, 2023 – Feb 28, 2023
777 Civica Infrastructure Inc. www.civi.ca
Civica Infrastructures Inc. Kawartha Lakes Flow Monitoring Report
Appendix - A June 03, 2024
Data Chart Station: L10 Mar 01, 2023 – Mar 31, 2023
778 Civica Infrastructure Inc. www.civi.ca
Civica Infrastructures Inc. Kawartha Lakes Flow Monitoring Report
Appendix - A June 03, 2024
Data Chart Station: L10 Apr 01, 2023 – Apr 30, 2023
779 Civica Infrastructure Inc. www.civi.ca
Civica Infrastructures Inc. Kawartha Lakes Flow Monitoring Report
Appendix - A June 03, 2024
Data Chart Station: L10 May 01, 2023 – May 31, 2023
780 Civica Infrastructure Inc. www.civi.ca
Civica Infrastructures Inc. Kawartha Lakes Flow Monitoring Report
Appendix - A June 03, 2024
Data Chart Station: L10 Jun 01, 2023 – Jun 30, 2023
781 Civica Infrastructure Inc. www.civi.ca
Civica Infrastructures Inc. Kawartha Lakes Flow Monitoring Report
Appendix - A June 03, 2024
Data Chart Station: L10 Jul 01, 2023 – Jul 31, 2023
782 Civica Infrastructure Inc. www.civi.ca
Civica Infrastructures Inc. Kawartha Lakes Flow Monitoring Report
Appendix - A June 03, 2024
Data Chart Station: L10 Aug 01, 2023 – Aug 31, 2023
783 Civica Infrastructure Inc. www.civi.ca
Civica Infrastructures Inc. Kawartha Lakes Flow Monitoring Report
Appendix - A June 03, 2024
Data Chart Station: L10 Sep 01, 2023 – Sep 30, 2023
784 Civica Infrastructure Inc. www.civi.ca
Civica Infrastructures Inc. Kawartha Lakes Flow Monitoring Report
Appendix - A June 03, 2024
Data Chart Station: L10 Oct 01, 2023 – Oct 04, 2023
785 Civica Infrastructure Inc. www.civi.ca
Civica Infrastructures Inc. Kawartha Lakes Flow Monitoring Report
Appendix - A June 03, 2024
Sanitary Report Station: L10
1
Average Dry Weather Flow (L/s)
Average Dry Weather Flow (L/c/d)
Average Daily Minimum Dry Weather Flow (L/s)
Average Daily Peak Dry Weather Flow (L/s)
9.884
322.262
6.342
14.067
Peaking Factor
Groundwater Infiltration (L/s)1
Groundwater Infiltration (L/ha/d)
% of GWI in Average DWF
1.423
5.390
3,923.665
54.537
Groundwater infiltration (GWI) is assumed as 85% of the daily minimum flow averaged over the monitoring period
786 Civica Infrastructure Inc. www.civi.ca
Civica Infrastructures Inc. Kawartha Lakes Flow Monitoring Report
Appendix - A June 03, 2024
I/I Analysis Table
1 2
Event1
Total Precipitation (mm)
Duration (hours)
Peak Intensity Over Tc at Station (mm/hr)
Feb 09, 2023
39.75
14.42
Mar 31, 2023
19.00
23.33
L10 Measured Peak Flow (L/s)
Peak I/I Flow (L/s)
Peak I/I Rate (L/s/ha)
Volumetric Runoff Coefficient (CV%)
Peaking Factor (PF)
6.20
64.34
50.55
0.43
6.45 %
4.40
4.80
63.43
38.73
0.33
10.11 %
1.73
Apr 05, 2023
18.00
12.50
5.54
Apr 30, 2023
16.40
9.50
4.10
May 19, 2023
32.00
18.92
6.60
Jun 11, 2023
35.40
25.75
5.40
Jun 26, 2023
18.40
8.42
Jun 27, 2023
24.20
Aug 03, 2023
N/A
2
53.10
37.42
0.32
8.68 %
2.57
63.63
48.32
0.41
3.96 %
3.94
40.14
31.73
0.27
2.93 %
3.77
8.30
37.01
27.73
0.23
2.10 %
3.03
5.42
6.80
57.11
48.49
0.41
4.55 %
5.43
41.40
4.83
29.40
60.68
50.77
0.43
2.41 %
5.64
Sep 07, 2023
21.80
0.83
20.10
45.71
37.71
0.32
0.98 %
5.27
Average
26.64
12.39
9.72
53.91
41.27
0.35
4.69 %
3.98
Maximum
41.40
25.75
29.40
64.34
50.77
0.43
10.11 %
5.64
Flow KPIs
Measured Storms
Station: L10
An event is a storm with a minimum volume of 15mm and a minimum inter-event dry period of 12 hours I/I event analysis unable to be completed due to missing flow monitoring data during event
787 Civica Infrastructure Inc. www.civi.ca
Civica Infrastructures Inc. Kawartha Lakes Flow Monitoring Report
Appendix - A June 03, 2024
I/I Analysis Graph Station: L10
788 Civica Infrastructure Inc. www.civi.ca
Civica Infrastructures Inc. Kawartha Lakes Flow Monitoring Report
Appendix - A June 03, 2024
Infiltration/Inflow Event Analysis Station: L10 Feb 08, 2023 21:00 – Feb 10, 2023 11:25, Total Precipitation: 39.75 mm (47,183,250.00 L) Station Details
Storm Details
Catchment Area
118.70 ha
Total Precipitation
39.75 mm (47,183,250.00 L)
Duration of Storm
14.42 hr
Time of Concentration (Tc) 1
65 min
Peak Precipitation Intensity Over Tc 2
6.20 mm/hr
Return Period over Tc 3
< 2 Yr
Measured Flow
I/I Flow
Time of Peak Measured Flow
Feb 09, 2023 18:20
Time of Peak I/I Flow (TD)
Feb 09, 2023 18:20
Estimated Dry Weather Flow at TD
13.79 L/s
Peak Measured Flow
64.34 L/s
Peak I/I Flow 4
50.55 L/s
Peak I/I Rate 5
0.43 L/s/ha
Peak Measured Depth
243.00 mm
Total I/I Flow Volume during event
3,041,575.10 L
Volumetric Coefficient (Cv%) 6
6.45%
Total Measured Flow Volume during Event
4,137,387.70 L
Peak I/I Coefficient 7
0.0246
Hourly Wet-Weather Peaking Factor 8
5.37
Instantaneous Wet-Weather Peaking Factor 9
5.60
1
Time of Concentration (Tc): The estimated time for the flow to travel from the furthest point in the upstream area to the point of monitoring, assume flow is travelling at 1.00 m/s Peak Precipitation Intensity Over Tc: The peak rainfall intensity for the duration of the storm with the time interval defined by time of concentration 3 Return Period over Tc: The estimated time to elapse before a storm of equal or greater intensity will likely occur again, based on design storm criteria 4 Peak I/I Flow: The greatest difference captured between measured flow and estimated dry weather flow, Peak I/I Flow = Maximum (Measured Flow – Estimated Dry Weather Flow) 5 Peak I/I Rate: A normalized peak I/I flow based on catchment area size, Peak I/I Rate = Peak I/I Flow / Catchment Area 6 Volumetric Coefficient (Cv%): The ratio of total I/I volume and total rainfall volume, Cv% = Total I/I Flow Volume / Total Precipitation Volume * 100% 7 Peak I/ I Coefficient: The ratio of peak I/I flow and peak rainfall intensity, Peak I/ I Coefficient = Peak I/I Flow / (Peak Rainfall Intensity over Tc * Catchment Area) 8 Hourly Wet‐Weather Peaking Factor: The ratio of peak hourly wet‐weather measured flow and average dry‐weather flow, Wet‐Weather Peaking Factor = Peak Hourly Wet‐Weather Measured Flow / Average Dry-Weather Flow 9 Instantaneous Wet‐Weather Peaking Factor: The ratio of peak wet‐weather measured flow and average dry‐weather flow, Wet‐Weather Peaking Factor = Peak Wet‐Weather Measured Flow / Average Dry-Weather Flow 2
789 Civica Infrastructure Inc. www.civi.ca
Civica Infrastructures Inc. Kawartha Lakes Flow Monitoring Report
Appendix - A June 03, 2024
I/I Analysis Graph Station: L10
790 Civica Infrastructure Inc. www.civi.ca
Civica Infrastructures Inc. Kawartha Lakes Flow Monitoring Report
Appendix - A June 03, 2024
Infiltration/Inflow Event Analysis Station: L10 Mar 30, 2023 21:40 – Apr 01, 2023 21:00, Total Precipitation: 19.00 mm (22,552,992.90 L) Station Details
Storm Details
Catchment Area
118.70 ha
Total Precipitation
19.00 mm (22,552,992.90 L)
Duration of Storm
23.33 hr
Time of Concentration (Tc) 1
65 min
Peak Precipitation Intensity Over Tc 2
4.80 mm/hr
Return Period over Tc 3
< 2 Yr
Measured Flow
I/I Flow
Time of Peak Measured Flow
Apr 01, 2023 05:15
Time of Peak I/I Flow (TD)
Apr 01, 2023 06:00
Estimated Dry Weather Flow at TD
23.93 L/s
Peak Measured Flow
63.43 L/s
Peak I/I Flow 4
38.73 L/s
Peak I/I Rate 5
0.33 L/s/ha
Peak Measured Depth
235.00 mm
Total I/I Flow Volume during event
2,280,600.70 L
Volumetric Coefficient (Cv%) 6
10.11%
Total Measured Flow Volume during Event
5,140,079.30 L
Peak I/I Coefficient 7
0.0245
Hourly Wet-Weather Peaking Factor 8
2.66
Instantaneous Wet-Weather Peaking Factor 9
2.83
1
Time of Concentration (Tc): The estimated time for the flow to travel from the furthest point in the upstream area to the point of monitoring, assume flow is travelling at 1.00 m/s Peak Precipitation Intensity Over Tc: The peak rainfall intensity for the duration of the storm with the time interval defined by time of concentration 3 Return Period over Tc: The estimated time to elapse before a storm of equal or greater intensity will likely occur again, based on design storm criteria 4 Peak I/I Flow: The greatest difference captured between measured flow and estimated dry weather flow, Peak I/I Flow = Maximum (Measured Flow – Estimated Dry Weather Flow) 5 Peak I/I Rate: A normalized peak I/I flow based on catchment area size, Peak I/I Rate = Peak I/I Flow / Catchment Area 6 Volumetric Coefficient (Cv%): The ratio of total I/I volume and total rainfall volume, Cv% = Total I/I Flow Volume / Total Precipitation Volume * 100% 7 Peak I/ I Coefficient: The ratio of peak I/I flow and peak rainfall intensity, Peak I/ I Coefficient = Peak I/I Flow / (Peak Rainfall Intensity over Tc * Catchment Area) 8 Hourly Wet‐Weather Peaking Factor: The ratio of peak hourly wet‐weather measured flow and average dry‐weather flow, Wet‐Weather Peaking Factor = Peak Hourly Wet‐Weather Measured Flow / Average Dry-Weather Flow 9 Instantaneous Wet‐Weather Peaking Factor: The ratio of peak wet‐weather measured flow and average dry‐weather flow, Wet‐Weather Peaking Factor = Peak Wet‐Weather Measured Flow / Average Dry-Weather Flow 2
791 Civica Infrastructure Inc. www.civi.ca
Civica Infrastructures Inc. Kawartha Lakes Flow Monitoring Report
Appendix - A June 03, 2024
I/I Analysis Graph Station: L10
792 Civica Infrastructure Inc. www.civi.ca
Civica Infrastructures Inc. Kawartha Lakes Flow Monitoring Report
Appendix - A June 03, 2024
Infiltration/Inflow Event Analysis Station: L10 Apr 30, 2023 00:30 – May 01, 2023 10:00, Total Precipitation: 16.40 mm (19,466,796.40 L) Station Details
Storm Details
Catchment Area
118.70 ha
Total Precipitation
16.40 mm (19,466,796.40 L)
Duration of Storm
9.50 hr
Time of Concentration (Tc) 1
65 min
Peak Precipitation Intensity Over Tc 2
4.10 mm/hr
Return Period over Tc 3
< 2 Yr
Measured Flow
I/I Flow
Time of Peak Measured Flow
Apr 30, 2023 20:50
Time of Peak I/I Flow (TD)
Apr 30, 2023 20:50
Estimated Dry Weather Flow at TD
15.68 L/s
Peak Measured Flow
53.10 L/s
Peak I/I Flow 4
37.42 L/s
Peak I/I Rate 5
0.32 L/s/ha
Peak Measured Depth
216.00 mm
Total I/I Flow Volume during event
1,689,912.10 L
Volumetric Coefficient (Cv%) 6
8.68%
Total Measured Flow Volume during Event
2,821,607.00 L
Peak I/I Coefficient 7
0.0279
Hourly Wet-Weather Peaking Factor 8
3.47
Instantaneous Wet-Weather Peaking Factor 9
3.65
1
Time of Concentration (Tc): The estimated time for the flow to travel from the furthest point in the upstream area to the point of monitoring, assume flow is travelling at 1.00 m/s Peak Precipitation Intensity Over Tc: The peak rainfall intensity for the duration of the storm with the time interval defined by time of concentration 3 Return Period over Tc: The estimated time to elapse before a storm of equal or greater intensity will likely occur again, based on design storm criteria 4 Peak I/I Flow: The greatest difference captured between measured flow and estimated dry weather flow, Peak I/I Flow = Maximum (Measured Flow – Estimated Dry Weather Flow) 5 Peak I/I Rate: A normalized peak I/I flow based on catchment area size, Peak I/I Rate = Peak I/I Flow / Catchment Area 6 Volumetric Coefficient (Cv%): The ratio of total I/I volume and total rainfall volume, Cv% = Total I/I Flow Volume / Total Precipitation Volume * 100% 7 Peak I/ I Coefficient: The ratio of peak I/I flow and peak rainfall intensity, Peak I/ I Coefficient = Peak I/I Flow / (Peak Rainfall Intensity over Tc * Catchment Area) 8 Hourly Wet‐Weather Peaking Factor: The ratio of peak hourly wet‐weather measured flow and average dry‐weather flow, Wet‐Weather Peaking Factor = Peak Hourly Wet‐Weather Measured Flow / Average Dry-Weather Flow 9 Instantaneous Wet‐Weather Peaking Factor: The ratio of peak wet‐weather measured flow and average dry‐weather flow, Wet‐Weather Peaking Factor = Peak Wet‐Weather Measured Flow / Average Dry-Weather Flow 2
793 Civica Infrastructure Inc. www.civi.ca
Civica Infrastructures Inc. Kawartha Lakes Flow Monitoring Report
Appendix - A June 03, 2024
I/I Analysis Graph Station: L10
794 Civica Infrastructure Inc. www.civi.ca
Civica Infrastructures Inc. Kawartha Lakes Flow Monitoring Report
Appendix - A June 03, 2024
Infiltration/Inflow Event Analysis Station: L10 May 19, 2023 08:15 – May 21, 2023 03:10, Total Precipitation: 32.00 mm (37,983,988.10 L) Station Details
Storm Details
Catchment Area
118.70 ha
Total Precipitation
32.00 mm (37,983,988.10 L)
Duration of Storm
18.92 hr
Time of Concentration (Tc) 1
65 min
Peak Precipitation Intensity Over Tc 2
6.60 mm/hr
Return Period over Tc 3
< 2 Yr
Measured Flow
I/I Flow
Time of Peak Measured Flow
May 20, 2023 07:45
Time of Peak I/I Flow (TD)
May 20, 2023 07:45
Estimated Dry Weather Flow at TD
15.30 L/s
Peak Measured Flow
63.63 L/s
Peak I/I Flow 4
48.32 L/s
Peak I/I Rate 5
0.41 L/s/ha
Peak Measured Depth
233.00 mm
Total I/I Flow Volume during event
1,503,980.50 L
Volumetric Coefficient (Cv%) 6
3.96%
Total Measured Flow Volume during Event
2,873,691.80 L
Peak I/I Coefficient 7
0.0221
Hourly Wet-Weather Peaking Factor 8
4.51
Instantaneous Wet-Weather Peaking Factor 9
5.18
1
Time of Concentration (Tc): The estimated time for the flow to travel from the furthest point in the upstream area to the point of monitoring, assume flow is travelling at 1.00 m/s Peak Precipitation Intensity Over Tc: The peak rainfall intensity for the duration of the storm with the time interval defined by time of concentration 3 Return Period over Tc: The estimated time to elapse before a storm of equal or greater intensity will likely occur again, based on design storm criteria 4 Peak I/I Flow: The greatest difference captured between measured flow and estimated dry weather flow, Peak I/I Flow = Maximum (Measured Flow – Estimated Dry Weather Flow) 5 Peak I/I Rate: A normalized peak I/I flow based on catchment area size, Peak I/I Rate = Peak I/I Flow / Catchment Area 6 Volumetric Coefficient (Cv%): The ratio of total I/I volume and total rainfall volume, Cv% = Total I/I Flow Volume / Total Precipitation Volume * 100% 7 Peak I/ I Coefficient: The ratio of peak I/I flow and peak rainfall intensity, Peak I/ I Coefficient = Peak I/I Flow / (Peak Rainfall Intensity over Tc * Catchment Area) 8 Hourly Wet‐Weather Peaking Factor: The ratio of peak hourly wet‐weather measured flow and average dry‐weather flow, Wet‐Weather Peaking Factor = Peak Hourly Wet‐Weather Measured Flow / Average Dry-Weather Flow 9 Instantaneous Wet‐Weather Peaking Factor: The ratio of peak wet‐weather measured flow and average dry‐weather flow, Wet‐Weather Peaking Factor = Peak Wet‐Weather Measured Flow / Average Dry-Weather Flow 2
795 Civica Infrastructure Inc. www.civi.ca
Civica Infrastructures Inc. Kawartha Lakes Flow Monitoring Report
Appendix - A June 03, 2024
I/I Analysis Graph Station: L10
796 Civica Infrastructure Inc. www.civi.ca
Civica Infrastructures Inc. Kawartha Lakes Flow Monitoring Report
Appendix - A June 03, 2024
Infiltration/Inflow Event Analysis Station: L10 Jun 11, 2023 07:25 – Jun 13, 2023 09:10, Total Precipitation: 35.40 mm (42,019,791.70 L) Station Details
Storm Details
Catchment Area
118.70 ha
Total Precipitation
35.40 mm (42,019,791.70 L)
Duration of Storm
25.75 hr
Time of Concentration (Tc) 1
65 min
Peak Precipitation Intensity Over Tc 2
5.40 mm/hr
Return Period over Tc 3
< 2 Yr
Measured Flow
I/I Flow
Time of Peak Measured Flow
Jun 12, 2023 11:35
Time of Peak I/I Flow (TD)
Jun 12, 2023 11:40
Estimated Dry Weather Flow at TD
8.34 L/s
Peak Measured Flow
40.14 L/s
Peak I/I Flow 4
31.73 L/s
Peak I/I Rate 5
0.27 L/s/ha
Peak Measured Depth
185.00 mm
Total I/I Flow Volume during event
1,232,248.90 L
Volumetric Coefficient (Cv%) 6
2.93%
Total Measured Flow Volume during Event
2,379,526.70 L
Peak I/I Coefficient 7
0.0180
Hourly Wet-Weather Peaking Factor 8
4.26
Instantaneous Wet-Weather Peaking Factor 9
4.77
1
Time of Concentration (Tc): The estimated time for the flow to travel from the furthest point in the upstream area to the point of monitoring, assume flow is travelling at 1.00 m/s Peak Precipitation Intensity Over Tc: The peak rainfall intensity for the duration of the storm with the time interval defined by time of concentration 3 Return Period over Tc: The estimated time to elapse before a storm of equal or greater intensity will likely occur again, based on design storm criteria 4 Peak I/I Flow: The greatest difference captured between measured flow and estimated dry weather flow, Peak I/I Flow = Maximum (Measured Flow – Estimated Dry Weather Flow) 5 Peak I/I Rate: A normalized peak I/I flow based on catchment area size, Peak I/I Rate = Peak I/I Flow / Catchment Area 6 Volumetric Coefficient (Cv%): The ratio of total I/I volume and total rainfall volume, Cv% = Total I/I Flow Volume / Total Precipitation Volume * 100% 7 Peak I/ I Coefficient: The ratio of peak I/I flow and peak rainfall intensity, Peak I/ I Coefficient = Peak I/I Flow / (Peak Rainfall Intensity over Tc * Catchment Area) 8 Hourly Wet‐Weather Peaking Factor: The ratio of peak hourly wet‐weather measured flow and average dry‐weather flow, Wet‐Weather Peaking Factor = Peak Hourly Wet‐Weather Measured Flow / Average Dry-Weather Flow 9 Instantaneous Wet‐Weather Peaking Factor: The ratio of peak wet‐weather measured flow and average dry‐weather flow, Wet‐Weather Peaking Factor = Peak Wet‐Weather Measured Flow / Average Dry-Weather Flow 2
797 Civica Infrastructure Inc. www.civi.ca
Civica Infrastructures Inc. Kawartha Lakes Flow Monitoring Report
Appendix - A June 03, 2024
I/I Analysis Graph Station: L10
798 Civica Infrastructure Inc. www.civi.ca
Civica Infrastructures Inc. Kawartha Lakes Flow Monitoring Report
Appendix - A June 03, 2024
Infiltration/Inflow Event Analysis Station: L10 Jun 25, 2023 15:05 – Jun 26, 2023 23:30, Total Precipitation: 18.40 mm (21,840,794.10 L) Station Details
Storm Details
Catchment Area
118.70 ha
Total Precipitation
18.40 mm (21,840,794.10 L)
Duration of Storm
8.42 hr
Time of Concentration (Tc) 1
65 min
Peak Precipitation Intensity Over Tc 2
8.30 mm/hr
Return Period over Tc 3
< 2 Yr
Measured Flow
I/I Flow
Time of Peak Measured Flow
Jun 26, 2023 12:05
Time of Peak I/I Flow (TD)
Jun 26, 2023 12:05
Estimated Dry Weather Flow at TD
9.28 L/s
Peak Measured Flow
37.01 L/s
Peak I/I Flow 4
27.73 L/s
Peak I/I Rate 5
0.23 L/s/ha
Peak Measured Depth
178.00 mm
Total I/I Flow Volume during event
458,847.90 L
Volumetric Coefficient (Cv%) 6
2.10%
Total Measured Flow Volume during Event
1,134,597.50 L
Peak I/I Coefficient 7
0.0101
Hourly Wet-Weather Peaking Factor 8
3.39
Instantaneous Wet-Weather Peaking Factor 9
4.04
1
Time of Concentration (Tc): The estimated time for the flow to travel from the furthest point in the upstream area to the point of monitoring, assume flow is travelling at 1.00 m/s Peak Precipitation Intensity Over Tc: The peak rainfall intensity for the duration of the storm with the time interval defined by time of concentration 3 Return Period over Tc: The estimated time to elapse before a storm of equal or greater intensity will likely occur again, based on design storm criteria 4 Peak I/I Flow: The greatest difference captured between measured flow and estimated dry weather flow, Peak I/I Flow = Maximum (Measured Flow – Estimated Dry Weather Flow) 5 Peak I/I Rate: A normalized peak I/I flow based on catchment area size, Peak I/I Rate = Peak I/I Flow / Catchment Area 6 Volumetric Coefficient (Cv%): The ratio of total I/I volume and total rainfall volume, Cv% = Total I/I Flow Volume / Total Precipitation Volume * 100% 7 Peak I/ I Coefficient: The ratio of peak I/I flow and peak rainfall intensity, Peak I/ I Coefficient = Peak I/I Flow / (Peak Rainfall Intensity over Tc * Catchment Area) 8 Hourly Wet‐Weather Peaking Factor: The ratio of peak hourly wet‐weather measured flow and average dry‐weather flow, Wet‐Weather Peaking Factor = Peak Hourly Wet‐Weather Measured Flow / Average Dry-Weather Flow 9 Instantaneous Wet‐Weather Peaking Factor: The ratio of peak wet‐weather measured flow and average dry‐weather flow, Wet‐Weather Peaking Factor = Peak Wet‐Weather Measured Flow / Average Dry-Weather Flow 2
799 Civica Infrastructure Inc. www.civi.ca
Civica Infrastructures Inc. Kawartha Lakes Flow Monitoring Report
Appendix - A June 03, 2024
I/I Analysis Graph Station: L10
800 Civica Infrastructure Inc. www.civi.ca
Civica Infrastructures Inc. Kawartha Lakes Flow Monitoring Report
Appendix - A June 03, 2024
Infiltration/Inflow Event Analysis Station: L10 Jun 26, 2023 21:00 – Jun 28, 2023 02:25, Total Precipitation: 24.20 mm (28,725,385.80 L) Station Details
Storm Details
Catchment Area
118.70 ha
Total Precipitation
24.20 mm (28,725,385.80 L)
Duration of Storm
5.42 hr
Time of Concentration (Tc) 1
65 min
Peak Precipitation Intensity Over Tc 2
6.80 mm/hr
Return Period over Tc 3
< 2 Yr
Measured Flow
I/I Flow
Time of Peak Measured Flow
Jun 27, 2023 14:10
Time of Peak I/I Flow (TD)
Jun 27, 2023 14:10
Estimated Dry Weather Flow at TD
8.62 L/s
Peak Measured Flow
57.11 L/s
Peak I/I Flow 4
48.49 L/s
Peak I/I Rate 5
0.41 L/s/ha
Peak Measured Depth
228.00 mm
Total I/I Flow Volume during event
1,307,923.10 L
Volumetric Coefficient (Cv%) 6
4.55%
Total Measured Flow Volume during Event
1,870,559.60 L
Peak I/I Coefficient 7
0.0215
Hourly Wet-Weather Peaking Factor 8
6.09
Instantaneous Wet-Weather Peaking Factor 9
6.39
1
Time of Concentration (Tc): The estimated time for the flow to travel from the furthest point in the upstream area to the point of monitoring, assume flow is travelling at 1.00 m/s Peak Precipitation Intensity Over Tc: The peak rainfall intensity for the duration of the storm with the time interval defined by time of concentration 3 Return Period over Tc: The estimated time to elapse before a storm of equal or greater intensity will likely occur again, based on design storm criteria 4 Peak I/I Flow: The greatest difference captured between measured flow and estimated dry weather flow, Peak I/I Flow = Maximum (Measured Flow – Estimated Dry Weather Flow) 5 Peak I/I Rate: A normalized peak I/I flow based on catchment area size, Peak I/I Rate = Peak I/I Flow / Catchment Area 6 Volumetric Coefficient (Cv%): The ratio of total I/I volume and total rainfall volume, Cv% = Total I/I Flow Volume / Total Precipitation Volume * 100% 7 Peak I/ I Coefficient: The ratio of peak I/I flow and peak rainfall intensity, Peak I/ I Coefficient = Peak I/I Flow / (Peak Rainfall Intensity over Tc * Catchment Area) 8 Hourly Wet‐Weather Peaking Factor: The ratio of peak hourly wet‐weather measured flow and average dry‐weather flow, Wet‐Weather Peaking Factor = Peak Hourly Wet‐Weather Measured Flow / Average Dry-Weather Flow 9 Instantaneous Wet‐Weather Peaking Factor: The ratio of peak wet‐weather measured flow and average dry‐weather flow, Wet‐Weather Peaking Factor = Peak Wet‐Weather Measured Flow / Average Dry-Weather Flow 2
801 Civica Infrastructure Inc. www.civi.ca
Civica Infrastructures Inc. Kawartha Lakes Flow Monitoring Report
Appendix - A June 03, 2024
I/I Analysis Graph Station: L10
802 Civica Infrastructure Inc. www.civi.ca
Civica Infrastructures Inc. Kawartha Lakes Flow Monitoring Report
Appendix - A June 03, 2024
Infiltration/Inflow Event Analysis Station: L10 Aug 03, 2023 03:55 – Aug 04, 2023 08:45, Total Precipitation: 41.40 mm (49,141,795.30 L) Station Details
Storm Details
Catchment Area
118.70 ha
Total Precipitation
41.40 mm (49,141,795.30 L)
Duration of Storm
4.83 hr
Time of Concentration (Tc) 1
65 min
Peak Precipitation Intensity Over Tc 2
29.40 mm/hr
Return Period over Tc 3
2 - 5 Yr
Measured Flow
I/I Flow
Time of Peak Measured Flow
Aug 03, 2023 16:55
Time of Peak I/I Flow (TD)
Aug 03, 2023 16:55
Estimated Dry Weather Flow at TD
9.91 L/s
Peak Measured Flow
60.68 L/s
Peak I/I Flow 4
50.77 L/s
Peak I/I Rate 5
0.43 L/s/ha
Peak Measured Depth
229.00 mm
Total I/I Flow Volume during event
1,185,915.50 L
Volumetric Coefficient (Cv%) 6
2.41%
Total Measured Flow Volume during Event
1,734,310.60 L
Peak I/I Coefficient 7
0.0053
Hourly Wet-Weather Peaking Factor 8
5.42
Instantaneous Wet-Weather Peaking Factor 9
6.74
1
Time of Concentration (Tc): The estimated time for the flow to travel from the furthest point in the upstream area to the point of monitoring, assume flow is travelling at 1.00 m/s Peak Precipitation Intensity Over Tc: The peak rainfall intensity for the duration of the storm with the time interval defined by time of concentration 3 Return Period over Tc: The estimated time to elapse before a storm of equal or greater intensity will likely occur again, based on design storm criteria 4 Peak I/I Flow: The greatest difference captured between measured flow and estimated dry weather flow, Peak I/I Flow = Maximum (Measured Flow – Estimated Dry Weather Flow) 5 Peak I/I Rate: A normalized peak I/I flow based on catchment area size, Peak I/I Rate = Peak I/I Flow / Catchment Area 6 Volumetric Coefficient (Cv%): The ratio of total I/I volume and total rainfall volume, Cv% = Total I/I Flow Volume / Total Precipitation Volume * 100% 7 Peak I/ I Coefficient: The ratio of peak I/I flow and peak rainfall intensity, Peak I/ I Coefficient = Peak I/I Flow / (Peak Rainfall Intensity over Tc * Catchment Area) 8 Hourly Wet‐Weather Peaking Factor: The ratio of peak hourly wet‐weather measured flow and average dry‐weather flow, Wet‐Weather Peaking Factor = Peak Hourly Wet‐Weather Measured Flow / Average Dry-Weather Flow 9 Instantaneous Wet‐Weather Peaking Factor: The ratio of peak wet‐weather measured flow and average dry‐weather flow, Wet‐Weather Peaking Factor = Peak Wet‐Weather Measured Flow / Average Dry-Weather Flow 2
803 Civica Infrastructure Inc. www.civi.ca
Civica Infrastructures Inc. Kawartha Lakes Flow Monitoring Report
Appendix - A June 03, 2024
I/I Analysis Graph Station: L10
804 Civica Infrastructure Inc. www.civi.ca
Civica Infrastructures Inc. Kawartha Lakes Flow Monitoring Report
Appendix - A June 03, 2024
Infiltration/Inflow Event Analysis Station: L10 Sep 07, 2023 03:00 – Sep 08, 2023 03:50, Total Precipitation: 21.80 mm (25,876,592.90 L) Station Details
Storm Details
Catchment Area
118.70 ha
Total Precipitation
21.80 mm (25,876,592.90 L)
Duration of Storm
0.83 hr
Time of Concentration (Tc) 1
65 min
Peak Precipitation Intensity Over Tc 2
20.10 mm/hr
Return Period over Tc 3
< 2 Yr
Measured Flow
I/I Flow
Time of Peak Measured Flow
Sep 07, 2023 16:15
Time of Peak I/I Flow (TD)
Sep 07, 2023 16:15
Estimated Dry Weather Flow at TD
8.01 L/s
Peak Measured Flow
45.71 L/s
Peak I/I Flow 4
37.71 L/s
Peak I/I Rate 5
0.32 L/s/ha
Peak Measured Depth
207.00 mm
Total I/I Flow Volume during event
254,094.10 L
Volumetric Coefficient (Cv%) 6
0.98%
Total Measured Flow Volume during Event
586,581.70 L
Peak I/I Coefficient 7
0.0057
Hourly Wet-Weather Peaking Factor 8
5.01
Instantaneous Wet-Weather Peaking Factor 9
6.39
1
Time of Concentration (Tc): The estimated time for the flow to travel from the furthest point in the upstream area to the point of monitoring, assume flow is travelling at 1.00 m/s Peak Precipitation Intensity Over Tc: The peak rainfall intensity for the duration of the storm with the time interval defined by time of concentration 3 Return Period over Tc: The estimated time to elapse before a storm of equal or greater intensity will likely occur again, based on design storm criteria 4 Peak I/I Flow: The greatest difference captured between measured flow and estimated dry weather flow, Peak I/I Flow = Maximum (Measured Flow – Estimated Dry Weather Flow) 5 Peak I/I Rate: A normalized peak I/I flow based on catchment area size, Peak I/I Rate = Peak I/I Flow / Catchment Area 6 Volumetric Coefficient (Cv%): The ratio of total I/I volume and total rainfall volume, Cv% = Total I/I Flow Volume / Total Precipitation Volume * 100% 7 Peak I/ I Coefficient: The ratio of peak I/I flow and peak rainfall intensity, Peak I/ I Coefficient = Peak I/I Flow / (Peak Rainfall Intensity over Tc * Catchment Area) 8 Hourly Wet‐Weather Peaking Factor: The ratio of peak hourly wet‐weather measured flow and average dry‐weather flow, Wet‐Weather Peaking Factor = Peak Hourly Wet‐Weather Measured Flow / Average Dry-Weather Flow 9 Instantaneous Wet‐Weather Peaking Factor: The ratio of peak wet‐weather measured flow and average dry‐weather flow, Wet‐Weather Peaking Factor = Peak Wet‐Weather Measured Flow / Average Dry-Weather Flow 2
805 Civica Infrastructure Inc. www.civi.ca
Civica Infrastructures Inc. Kawartha Lakes Flow Monitoring Report
Appendix - A June 03, 2024
Activity Log Station: L10 Date Time
Type
Purpose of Visit
Comment
Calibration Measurement
17-Jan-2023 02:22:00 PM
Installation Log
INSTALLATION
MEASUREMENTS TAKEN, PHOTOS TAKEN, LOGGER INSTALLED
Yes
02-Feb-2023 10:52:00 AM
Maintenance Log
CALIBRATION
DATA DOWNLOADED, TELEMETRY SENT, MEASUREMENTS TAKEN, DEBRIS CLEARED, SITE CALIBRATED
Yes
03-Mar-2023 11:04:00 AM
Maintenance Log
CALIBRATION
TC SET,DATA DOWNLOADED,TELEMETRY SENT,,DEBRIS AND SILT REMOVED,SITE CALIBRATED,ANTENNA REPLACED,PHOTOS AND VIDEOS TAKEN
Yes
03-Apr-2023 01:25:00 PM
Maintenance Log
CALIBRATION
TC SET,DATA DOWNLOADED, PHOTOS TAKEN, TELEMETRY SENT,SITE CALIBRATED,DESSICANT CHECKED,ANTENNA CHECKED,SITE CLEARED
Yes
Yes
19-Apr-2023 10:53:00 AM
Maintenance Log
CALIBRATION
TC SET,SURVEY SENT,DATA DOWNLOADED, TELEMETRY SENT AND CHECKED, DEBRIS CLEARED, PHOTOS AND VIDEOS TAKEN, SITE CALIBRATED,ANTENNA CHECKED,DESSICANT CHECKED,BATTERY CHECKED,SITE CLEARED. LOGGER SWAPPED (NEW LOGGER PMAC:8083) LOGGER DID NOT READ VELOCITY, COVER WITH DEBRIS PMAC LOGGER INSTALLED:8083 PMAC LOGGER REMOVED:8075
11-May-2023 08:55:00 AM
Maintenance Log
CALIBRATION
TC SET,SURVEY SENT,DOWNLOADED DATA, SENT TELEMETRY , MADE ENTRY, TOOK PHOTOS/VIDEOS, DESSICANT SWAPPED,ANTENNA CHECKED,TOOK MEASUREMENTS,DEBRIS AND SILT CLEARED, CALIBRATED SITE
Yes
Yes
Yes
22-Jun-2023 11:21:00 AM
Maintenance Log
CALIBRATION
DATA DOWNLOADED, TELEMETRY SENT ENTRY MADE PHOTOS/VIDEOS TAKEN, MEASUREMENTS TAKEN, SITE CALIBRATED
04-Oct-2023 11:15:00 AM
Removal Log
REMOVAL
TRAFFIC CONTROL SENT, DATA DOWNLOADED, TELEMETRY SENT, CALIBRATION DONE, EQUIPMENT REMOVED, LOGGER TAG, PHOTOS AND VIDEOS BEFORE AND AFTER TAKEN.
806 Civica Infrastructure Inc. www.civi.ca
Civica Infrastructures Inc. Kawartha Lakes Flow Monitoring Report
Appendix - A June 03, 2024
Aggregate Data Station: L11
Precipitation Date From
Date To
Days
Min (mm)
Avg (mm)
Max (mm)
Sum (mm)
Count
Time of Min1
Time of Max1
Jan 17, 2023
Oct 04, 2023
253
0.00
0.01
12.00
501.30
72,302
Tue Jan 17, 2023 00:00
Thu Aug 03, 2023 16:10
Level Date From
Date To
Days
Min (m)
Avg (m)
Max (m)
Count
Time of Min1
Time of Max1
Jan 17, 2023
Oct 04, 2023
260
0.03
0.05
0.12
74,658
Sun Jan 29, 2023 05:05
Thu Aug 03, 2023 16:40
Velocity Date From
Date To
Days
Min (m/s)
Avg (m/s)
Max (m/s)
Count
Time of Min1
Time of Max1
Jan 17, 2023
Oct 04, 2023
261
0.19
1.09
2.35
74,835
Sat Jun 17, 2023 03:00
Sat May 20, 2023 10:50
Flow
1
Date From
Date To
Days
Min (L/s)
Avg (L/s)
Max (L/s)
Total Volume (1,000,000 L)
Count
Time of Min1
Time of Max1
Jan 17, 2023
Oct 04, 2023
260
0.58
8.28
49.25
185.34
74,658
Thu Sep 28, 2023 03:55
Thu Aug 03, 2023 16:40
Time of Min and Time of Max will be displayed by first occurrence
807 Civica Infrastructure Inc. www.civi.ca
Civica Infrastructures Inc. Kawartha Lakes Flow Monitoring Report
Appendix - A June 03, 2024
Data Chart Station: L11 Jan 17, 2023 – Jan 31, 2023
808 Civica Infrastructure Inc. www.civi.ca
Civica Infrastructures Inc. Kawartha Lakes Flow Monitoring Report
Appendix - A June 03, 2024
Data Chart Station: L11 Feb 01, 2023 – Feb 28, 2023
809 Civica Infrastructure Inc. www.civi.ca
Civica Infrastructures Inc. Kawartha Lakes Flow Monitoring Report
Appendix - A June 03, 2024
Data Chart Station: L11 Mar 01, 2023 – Mar 31, 2023
810 Civica Infrastructure Inc. www.civi.ca
Civica Infrastructures Inc. Kawartha Lakes Flow Monitoring Report
Appendix - A June 03, 2024
Data Chart Station: L11 Apr 01, 2023 – Apr 30, 2023
811 Civica Infrastructure Inc. www.civi.ca
Civica Infrastructures Inc. Kawartha Lakes Flow Monitoring Report
Appendix - A June 03, 2024
Data Chart Station: L11 May 01, 2023 – May 31, 2023
812 Civica Infrastructure Inc. www.civi.ca
Civica Infrastructures Inc. Kawartha Lakes Flow Monitoring Report
Appendix - A June 03, 2024
Data Chart Station: L11 Jun 01, 2023 – Jun 30, 2023
813 Civica Infrastructure Inc. www.civi.ca
Civica Infrastructures Inc. Kawartha Lakes Flow Monitoring Report
Appendix - A June 03, 2024
Data Chart Station: L11 Jul 01, 2023 – Jul 31, 2023
814 Civica Infrastructure Inc. www.civi.ca
Civica Infrastructures Inc. Kawartha Lakes Flow Monitoring Report
Appendix - A June 03, 2024
Data Chart Station: L11 Aug 01, 2023 – Aug 31, 2023
815 Civica Infrastructure Inc. www.civi.ca
Civica Infrastructures Inc. Kawartha Lakes Flow Monitoring Report
Appendix - A June 03, 2024
Data Chart Station: L11 Sep 01, 2023 – Sep 30, 2023
816 Civica Infrastructure Inc. www.civi.ca
Civica Infrastructures Inc. Kawartha Lakes Flow Monitoring Report
Appendix - A June 03, 2024
Data Chart Station: L11 Oct 01, 2023 – Oct 04, 2023
817 Civica Infrastructure Inc. www.civi.ca
Civica Infrastructures Inc. Kawartha Lakes Flow Monitoring Report
Appendix - A June 03, 2024
Sanitary Report Station: L11
1
Average Dry Weather Flow (L/s)
Average Dry Weather Flow (L/c/d)
Average Daily Minimum Dry Weather Flow (L/s)
Average Daily Peak Dry Weather Flow (L/s)
7.162
469.510
1.828
13.199
Peaking Factor
Groundwater Infiltration (L/s)1
Groundwater Infiltration (L/ha/d)
% of GWI in Average DWF
1.843
1.554
1,923.519
21.697
Groundwater infiltration (GWI) is assumed as 85% of the daily minimum flow averaged over the monitoring period
818 Civica Infrastructure Inc. www.civi.ca
Civica Infrastructures Inc. Kawartha Lakes Flow Monitoring Report
Appendix - A June 03, 2024
I/I Analysis Table
1
Event1
Total Precipitation (mm)
Duration (hours)
Peak Intensity Over Tc at Station (mm/hr)
Feb 09, 2023
39.75
14.42
Mar 31, 2023
19.00
Apr 05, 2023
L11 Measured Peak Flow (L/s)
Peak I/I Flow (L/s)
Peak I/I Rate (L/s/ha)
Volumetric Runoff Coefficient (CV%)
Peaking Factor (PF)
6.70
34.81
24.27
0.35
4.58 %
3.01
23.33
5.30
40.13
23.42
0.34
9.39 %
1.48
18.00
12.50
7.70
37.28
23.68
0.34
7.02 %
1.72
Apr 30, 2023
16.40
9.50
4.50
22.29
13.91
0.20
5.30 %
1.72
May 19, 2023
32.00
18.92
8.00
27.07
16.93
0.24
2.69 %
2.68
Jun 11, 2023
35.40
25.75
6.40
24.63
16.36
0.23
1.73 %
2.90
Jun 26, 2023
18.40
8.42
12.00
28.80
19.39
0.28
1.28 %
2.65
Jun 27, 2023
24.20
5.42
9.90
31.59
23.75
0.34
3.12 %
3.31
Aug 03, 2023
41.40
4.83
42.40
49.25
41.28
0.59
1.54 %
7.44
Sep 07, 2023
21.80
0.83
27.70
37.83
31.22
0.45
1.11 %
6.31
Average
26.64
12.39
13.06
33.37
23.42
0.34
3.78 %
3.32
Maximum
41.40
25.75
42.40
49.25
41.28
0.59
9.39 %
7.44
Flow KPIs
Measured Storms
Station: L11
An event is a storm with a minimum volume of 15mm and a minimum inter-event dry period of 12 hours
819 Civica Infrastructure Inc. www.civi.ca
Civica Infrastructures Inc. Kawartha Lakes Flow Monitoring Report
Appendix - A June 03, 2024
I/I Analysis Graph Station: L11
820 Civica Infrastructure Inc. www.civi.ca
Civica Infrastructures Inc. Kawartha Lakes Flow Monitoring Report
Appendix - A June 03, 2024
Infiltration/Inflow Event Analysis Station: L11 Feb 08, 2023 21:00 – Feb 10, 2023 11:25, Total Precipitation: 39.75 mm (27,745,500.00 L) Station Details
Storm Details
Catchment Area
69.80 ha
Total Precipitation
39.75 mm (27,745,500.00 L)
Duration of Storm
14.42 hr
Time of Concentration (Tc) 1
45 min
Peak Precipitation Intensity Over Tc 2
6.70 mm/hr
Return Period over Tc 3
< 2 Yr
Measured Flow
I/I Flow
Time of Peak Measured Flow
Feb 09, 2023 18:10
Time of Peak I/I Flow (TD)
Feb 09, 2023 18:10
Estimated Dry Weather Flow at TD
10.54 L/s
Peak Measured Flow
34.81 L/s
Peak I/I Flow 4
24.27 L/s
Peak I/I Rate 5
0.35 L/s/ha
Peak Measured Depth
94.00 mm
Total I/I Flow Volume during event
1,271,734.90 L
Volumetric Coefficient (Cv%) 6
4.58%
Total Measured Flow Volume during Event
2,040,561.20 L
Peak I/I Coefficient 7
0.0188
Hourly Wet-Weather Peaking Factor 8
4.01
Instantaneous Wet-Weather Peaking Factor 9
4.32
1
Time of Concentration (Tc): The estimated time for the flow to travel from the furthest point in the upstream area to the point of monitoring, assume flow is travelling at 1.00 m/s Peak Precipitation Intensity Over Tc: The peak rainfall intensity for the duration of the storm with the time interval defined by time of concentration 3 Return Period over Tc: The estimated time to elapse before a storm of equal or greater intensity will likely occur again, based on design storm criteria 4 Peak I/I Flow: The greatest difference captured between measured flow and estimated dry weather flow, Peak I/I Flow = Maximum (Measured Flow – Estimated Dry Weather Flow) 5 Peak I/I Rate: A normalized peak I/I flow based on catchment area size, Peak I/I Rate = Peak I/I Flow / Catchment Area 6 Volumetric Coefficient (Cv%): The ratio of total I/I volume and total rainfall volume, Cv% = Total I/I Flow Volume / Total Precipitation Volume * 100% 7 Peak I/ I Coefficient: The ratio of peak I/I flow and peak rainfall intensity, Peak I/ I Coefficient = Peak I/I Flow / (Peak Rainfall Intensity over Tc * Catchment Area) 8 Hourly Wet‐Weather Peaking Factor: The ratio of peak hourly wet‐weather measured flow and average dry‐weather flow, Wet‐Weather Peaking Factor = Peak Hourly Wet‐Weather Measured Flow / Average Dry-Weather Flow 9 Instantaneous Wet‐Weather Peaking Factor: The ratio of peak wet‐weather measured flow and average dry‐weather flow, Wet‐Weather Peaking Factor = Peak Wet‐Weather Measured Flow / Average Dry-Weather Flow 2
821 Civica Infrastructure Inc. www.civi.ca
Civica Infrastructures Inc. Kawartha Lakes Flow Monitoring Report
Appendix - A June 03, 2024
I/I Analysis Graph Station: L11
822 Civica Infrastructure Inc. www.civi.ca
Civica Infrastructures Inc. Kawartha Lakes Flow Monitoring Report
Appendix - A June 03, 2024
Infiltration/Inflow Event Analysis Station: L11 Mar 30, 2023 21:40 – Apr 01, 2023 21:00, Total Precipitation: 19.00 mm (13,261,995.80 L) Station Details
Storm Details
Catchment Area
69.80 ha
Total Precipitation
19.00 mm (13,261,995.80 L)
Duration of Storm
23.33 hr
Time of Concentration (Tc) 1
45 min
Peak Precipitation Intensity Over Tc 2
5.30 mm/hr
Return Period over Tc 3
< 2 Yr
Measured Flow
I/I Flow
Time of Peak Measured Flow
Apr 01, 2023 13:40
Time of Peak I/I Flow (TD)
Apr 01, 2023 04:55
Estimated Dry Weather Flow at TD
11.57 L/s
Peak Measured Flow
40.13 L/s
Peak I/I Flow 4
23.42 L/s
Peak I/I Rate 5
0.34 L/s/ha
Peak Measured Depth
105.00 mm
Total I/I Flow Volume during event
1,244,964.60 L
Volumetric Coefficient (Cv%) 6
9.39%
Total Measured Flow Volume during Event
3,265,447.60 L
Peak I/I Coefficient 7
0.0227
Hourly Wet-Weather Peaking Factor 8
2.26
Instantaneous Wet-Weather Peaking Factor 9
2.53
1
Time of Concentration (Tc): The estimated time for the flow to travel from the furthest point in the upstream area to the point of monitoring, assume flow is travelling at 1.00 m/s Peak Precipitation Intensity Over Tc: The peak rainfall intensity for the duration of the storm with the time interval defined by time of concentration 3 Return Period over Tc: The estimated time to elapse before a storm of equal or greater intensity will likely occur again, based on design storm criteria 4 Peak I/I Flow: The greatest difference captured between measured flow and estimated dry weather flow, Peak I/I Flow = Maximum (Measured Flow – Estimated Dry Weather Flow) 5 Peak I/I Rate: A normalized peak I/I flow based on catchment area size, Peak I/I Rate = Peak I/I Flow / Catchment Area 6 Volumetric Coefficient (Cv%): The ratio of total I/I volume and total rainfall volume, Cv% = Total I/I Flow Volume / Total Precipitation Volume * 100% 7 Peak I/ I Coefficient: The ratio of peak I/I flow and peak rainfall intensity, Peak I/ I Coefficient = Peak I/I Flow / (Peak Rainfall Intensity over Tc * Catchment Area) 8 Hourly Wet‐Weather Peaking Factor: The ratio of peak hourly wet‐weather measured flow and average dry‐weather flow, Wet‐Weather Peaking Factor = Peak Hourly Wet‐Weather Measured Flow / Average Dry-Weather Flow 9 Instantaneous Wet‐Weather Peaking Factor: The ratio of peak wet‐weather measured flow and average dry‐weather flow, Wet‐Weather Peaking Factor = Peak Wet‐Weather Measured Flow / Average Dry-Weather Flow 2
823 Civica Infrastructure Inc. www.civi.ca
Civica Infrastructures Inc. Kawartha Lakes Flow Monitoring Report
Appendix - A June 03, 2024
I/I Analysis Graph Station: L11
824 Civica Infrastructure Inc. www.civi.ca
Civica Infrastructures Inc. Kawartha Lakes Flow Monitoring Report
Appendix - A June 03, 2024
Infiltration/Inflow Event Analysis Station: L11 Apr 04, 2023 17:45 – Apr 06, 2023 06:15, Total Precipitation: 18.00 mm (12,563,995.10 L) Station Details
Storm Details
Catchment Area
69.80 ha
Total Precipitation
18.00 mm (12,563,995.10 L)
Duration of Storm
12.50 hr
Time of Concentration (Tc) 1
45 min
Peak Precipitation Intensity Over Tc 2
7.70 mm/hr
Return Period over Tc 3
< 2 Yr
Measured Flow
I/I Flow
Time of Peak Measured Flow
Apr 05, 2023 16:20
Time of Peak I/I Flow (TD)
Apr 05, 2023 16:20
Estimated Dry Weather Flow at TD
13.60 L/s
Peak Measured Flow
37.28 L/s
Peak I/I Flow 4
23.68 L/s
Peak I/I Rate 5
0.34 L/s/ha
Peak Measured Depth
102.00 mm
Total I/I Flow Volume during event
881,875.60 L
Volumetric Coefficient (Cv%) 6
7.02%
Total Measured Flow Volume during Event
2,097,754.40 L
Peak I/I Coefficient 7
0.0158
Hourly Wet-Weather Peaking Factor 8
2.52
Instantaneous Wet-Weather Peaking Factor 9
2.71
1
Time of Concentration (Tc): The estimated time for the flow to travel from the furthest point in the upstream area to the point of monitoring, assume flow is travelling at 1.00 m/s Peak Precipitation Intensity Over Tc: The peak rainfall intensity for the duration of the storm with the time interval defined by time of concentration 3 Return Period over Tc: The estimated time to elapse before a storm of equal or greater intensity will likely occur again, based on design storm criteria 4 Peak I/I Flow: The greatest difference captured between measured flow and estimated dry weather flow, Peak I/I Flow = Maximum (Measured Flow – Estimated Dry Weather Flow) 5 Peak I/I Rate: A normalized peak I/I flow based on catchment area size, Peak I/I Rate = Peak I/I Flow / Catchment Area 6 Volumetric Coefficient (Cv%): The ratio of total I/I volume and total rainfall volume, Cv% = Total I/I Flow Volume / Total Precipitation Volume * 100% 7 Peak I/ I Coefficient: The ratio of peak I/I flow and peak rainfall intensity, Peak I/ I Coefficient = Peak I/I Flow / (Peak Rainfall Intensity over Tc * Catchment Area) 8 Hourly Wet‐Weather Peaking Factor: The ratio of peak hourly wet‐weather measured flow and average dry‐weather flow, Wet‐Weather Peaking Factor = Peak Hourly Wet‐Weather Measured Flow / Average Dry-Weather Flow 9 Instantaneous Wet‐Weather Peaking Factor: The ratio of peak wet‐weather measured flow and average dry‐weather flow, Wet‐Weather Peaking Factor = Peak Wet‐Weather Measured Flow / Average Dry-Weather Flow 2
825 Civica Infrastructure Inc. www.civi.ca
Civica Infrastructures Inc. Kawartha Lakes Flow Monitoring Report
Appendix - A June 03, 2024
I/I Analysis Graph Station: L11
826 Civica Infrastructure Inc. www.civi.ca
Civica Infrastructures Inc. Kawartha Lakes Flow Monitoring Report
Appendix - A June 03, 2024
Infiltration/Inflow Event Analysis Station: L11 Apr 30, 2023 00:30 – May 01, 2023 10:00, Total Precipitation: 16.40 mm (11,447,197.90 L) Station Details
Storm Details
Catchment Area
69.80 ha
Total Precipitation
16.40 mm (11,447,197.90 L)
Duration of Storm
9.50 hr
Time of Concentration (Tc) 1
45 min
Peak Precipitation Intensity Over Tc 2
4.50 mm/hr
Return Period over Tc 3
< 2 Yr
Measured Flow
I/I Flow
Time of Peak Measured Flow
Apr 30, 2023 22:00
Time of Peak I/I Flow (TD)
Apr 30, 2023 22:00
Estimated Dry Weather Flow at TD
8.38 L/s
Peak Measured Flow
22.29 L/s
Peak I/I Flow 4
13.91 L/s
Peak I/I Rate 5
0.20 L/s/ha
Peak Measured Depth
81.00 mm
Total I/I Flow Volume during event
607,130.10 L
Volumetric Coefficient (Cv%) 6
5.30%
Total Measured Flow Volume during Event
1,234,416.10 L
Peak I/I Coefficient 7
0.0158
Hourly Wet-Weather Peaking Factor 8
2.62
Instantaneous Wet-Weather Peaking Factor 9
2.76
1
Time of Concentration (Tc): The estimated time for the flow to travel from the furthest point in the upstream area to the point of monitoring, assume flow is travelling at 1.00 m/s Peak Precipitation Intensity Over Tc: The peak rainfall intensity for the duration of the storm with the time interval defined by time of concentration 3 Return Period over Tc: The estimated time to elapse before a storm of equal or greater intensity will likely occur again, based on design storm criteria 4 Peak I/I Flow: The greatest difference captured between measured flow and estimated dry weather flow, Peak I/I Flow = Maximum (Measured Flow – Estimated Dry Weather Flow) 5 Peak I/I Rate: A normalized peak I/I flow based on catchment area size, Peak I/I Rate = Peak I/I Flow / Catchment Area 6 Volumetric Coefficient (Cv%): The ratio of total I/I volume and total rainfall volume, Cv% = Total I/I Flow Volume / Total Precipitation Volume * 100% 7 Peak I/ I Coefficient: The ratio of peak I/I flow and peak rainfall intensity, Peak I/ I Coefficient = Peak I/I Flow / (Peak Rainfall Intensity over Tc * Catchment Area) 8 Hourly Wet‐Weather Peaking Factor: The ratio of peak hourly wet‐weather measured flow and average dry‐weather flow, Wet‐Weather Peaking Factor = Peak Hourly Wet‐Weather Measured Flow / Average Dry-Weather Flow 9 Instantaneous Wet‐Weather Peaking Factor: The ratio of peak wet‐weather measured flow and average dry‐weather flow, Wet‐Weather Peaking Factor = Peak Wet‐Weather Measured Flow / Average Dry-Weather Flow 2
827 Civica Infrastructure Inc. www.civi.ca
Civica Infrastructures Inc. Kawartha Lakes Flow Monitoring Report
Appendix - A June 03, 2024
I/I Analysis Graph Station: L11
828 Civica Infrastructure Inc. www.civi.ca
Civica Infrastructures Inc. Kawartha Lakes Flow Monitoring Report
Appendix - A June 03, 2024
Infiltration/Inflow Event Analysis Station: L11 May 19, 2023 08:15 – May 21, 2023 03:10, Total Precipitation: 32.00 mm (22,335,993.00 L) Station Details
Storm Details
Catchment Area
69.80 ha
Total Precipitation
32.00 mm (22,335,993.00 L)
Duration of Storm
18.92 hr
Time of Concentration (Tc) 1
45 min
Peak Precipitation Intensity Over Tc 2
8.00 mm/hr
Return Period over Tc 3
< 2 Yr
Measured Flow
I/I Flow
Time of Peak Measured Flow
May 20, 2023 07:20
Time of Peak I/I Flow (TD)
May 20, 2023 06:55
Estimated Dry Weather Flow at TD
8.37 L/s
Peak Measured Flow
27.07 L/s
Peak I/I Flow 4
16.93 L/s
Peak I/I Rate 5
0.24 L/s/ha
Peak Measured Depth
86.00 mm
Total I/I Flow Volume during event
600,228.10 L
Volumetric Coefficient (Cv%) 6
2.69%
Total Measured Flow Volume during Event
1,304,607.80 L
Peak I/I Coefficient 7
0.0109
Hourly Wet-Weather Peaking Factor 8
4.03
Instantaneous Wet-Weather Peaking Factor 9
4.29
1
Time of Concentration (Tc): The estimated time for the flow to travel from the furthest point in the upstream area to the point of monitoring, assume flow is travelling at 1.00 m/s Peak Precipitation Intensity Over Tc: The peak rainfall intensity for the duration of the storm with the time interval defined by time of concentration 3 Return Period over Tc: The estimated time to elapse before a storm of equal or greater intensity will likely occur again, based on design storm criteria 4 Peak I/I Flow: The greatest difference captured between measured flow and estimated dry weather flow, Peak I/I Flow = Maximum (Measured Flow – Estimated Dry Weather Flow) 5 Peak I/I Rate: A normalized peak I/I flow based on catchment area size, Peak I/I Rate = Peak I/I Flow / Catchment Area 6 Volumetric Coefficient (Cv%): The ratio of total I/I volume and total rainfall volume, Cv% = Total I/I Flow Volume / Total Precipitation Volume * 100% 7 Peak I/ I Coefficient: The ratio of peak I/I flow and peak rainfall intensity, Peak I/ I Coefficient = Peak I/I Flow / (Peak Rainfall Intensity over Tc * Catchment Area) 8 Hourly Wet‐Weather Peaking Factor: The ratio of peak hourly wet‐weather measured flow and average dry‐weather flow, Wet‐Weather Peaking Factor = Peak Hourly Wet‐Weather Measured Flow / Average Dry-Weather Flow 9 Instantaneous Wet‐Weather Peaking Factor: The ratio of peak wet‐weather measured flow and average dry‐weather flow, Wet‐Weather Peaking Factor = Peak Wet‐Weather Measured Flow / Average Dry-Weather Flow 2
829 Civica Infrastructure Inc. www.civi.ca
Civica Infrastructures Inc. Kawartha Lakes Flow Monitoring Report
Appendix - A June 03, 2024
I/I Analysis Graph Station: L11
830 Civica Infrastructure Inc. www.civi.ca
Civica Infrastructures Inc. Kawartha Lakes Flow Monitoring Report
Appendix - A June 03, 2024
Infiltration/Inflow Event Analysis Station: L11 Jun 11, 2023 07:25 – Jun 13, 2023 09:10, Total Precipitation: 35.40 mm (24,709,195.10 L) Station Details
Storm Details
Catchment Area
69.80 ha
Total Precipitation
35.40 mm (24,709,195.10 L)
Duration of Storm
25.75 hr
Time of Concentration (Tc) 1
45 min
Peak Precipitation Intensity Over Tc 2
6.40 mm/hr
Return Period over Tc 3
< 2 Yr
Measured Flow
I/I Flow
Time of Peak Measured Flow
Jun 12, 2023 11:25
Time of Peak I/I Flow (TD)
Jun 12, 2023 11:25
Estimated Dry Weather Flow at TD
8.27 L/s
Peak Measured Flow
24.63 L/s
Peak I/I Flow 4
16.36 L/s
Peak I/I Rate 5
0.23 L/s/ha
Peak Measured Depth
86.00 mm
Total I/I Flow Volume during event
426,396.40 L
Volumetric Coefficient (Cv%) 6
1.73%
Total Measured Flow Volume during Event
1,194,477.80 L
Peak I/I Coefficient 7
0.0132
Hourly Wet-Weather Peaking Factor 8
3.52
Instantaneous Wet-Weather Peaking Factor 9
4.37
1
Time of Concentration (Tc): The estimated time for the flow to travel from the furthest point in the upstream area to the point of monitoring, assume flow is travelling at 1.00 m/s Peak Precipitation Intensity Over Tc: The peak rainfall intensity for the duration of the storm with the time interval defined by time of concentration 3 Return Period over Tc: The estimated time to elapse before a storm of equal or greater intensity will likely occur again, based on design storm criteria 4 Peak I/I Flow: The greatest difference captured between measured flow and estimated dry weather flow, Peak I/I Flow = Maximum (Measured Flow – Estimated Dry Weather Flow) 5 Peak I/I Rate: A normalized peak I/I flow based on catchment area size, Peak I/I Rate = Peak I/I Flow / Catchment Area 6 Volumetric Coefficient (Cv%): The ratio of total I/I volume and total rainfall volume, Cv% = Total I/I Flow Volume / Total Precipitation Volume * 100% 7 Peak I/ I Coefficient: The ratio of peak I/I flow and peak rainfall intensity, Peak I/ I Coefficient = Peak I/I Flow / (Peak Rainfall Intensity over Tc * Catchment Area) 8 Hourly Wet‐Weather Peaking Factor: The ratio of peak hourly wet‐weather measured flow and average dry‐weather flow, Wet‐Weather Peaking Factor = Peak Hourly Wet‐Weather Measured Flow / Average Dry-Weather Flow 9 Instantaneous Wet‐Weather Peaking Factor: The ratio of peak wet‐weather measured flow and average dry‐weather flow, Wet‐Weather Peaking Factor = Peak Wet‐Weather Measured Flow / Average Dry-Weather Flow 2
831 Civica Infrastructure Inc. www.civi.ca
Civica Infrastructures Inc. Kawartha Lakes Flow Monitoring Report
Appendix - A June 03, 2024
I/I Analysis Graph Station: L11
832 Civica Infrastructure Inc. www.civi.ca
Civica Infrastructures Inc. Kawartha Lakes Flow Monitoring Report
Appendix - A June 03, 2024
Infiltration/Inflow Event Analysis Station: L11 Jun 25, 2023 15:05 – Jun 26, 2023 23:30, Total Precipitation: 18.40 mm (12,843,196.50 L) Station Details
Storm Details
Catchment Area
69.80 ha
Total Precipitation
18.40 mm (12,843,196.50 L)
Duration of Storm
8.42 hr
Time of Concentration (Tc) 1
45 min
Peak Precipitation Intensity Over Tc 2
12.00 mm/hr
Return Period over Tc 3
< 2 Yr
Measured Flow
I/I Flow
Time of Peak Measured Flow
Jun 26, 2023 11:35
Time of Peak I/I Flow (TD)
Jun 26, 2023 11:35
Estimated Dry Weather Flow at TD
9.41 L/s
Peak Measured Flow
28.80 L/s
Peak I/I Flow 4
19.39 L/s
Peak I/I Rate 5
0.28 L/s/ha
Peak Measured Depth
83.00 mm
Total I/I Flow Volume during event
164,670.50 L
Volumetric Coefficient (Cv%) 6
1.28%
Total Measured Flow Volume during Event
705,090.50 L
Peak I/I Coefficient 7
0.0083
Hourly Wet-Weather Peaking Factor 8
2.82
Instantaneous Wet-Weather Peaking Factor 9
3.93
1
Time of Concentration (Tc): The estimated time for the flow to travel from the furthest point in the upstream area to the point of monitoring, assume flow is travelling at 1.00 m/s Peak Precipitation Intensity Over Tc: The peak rainfall intensity for the duration of the storm with the time interval defined by time of concentration 3 Return Period over Tc: The estimated time to elapse before a storm of equal or greater intensity will likely occur again, based on design storm criteria 4 Peak I/I Flow: The greatest difference captured between measured flow and estimated dry weather flow, Peak I/I Flow = Maximum (Measured Flow – Estimated Dry Weather Flow) 5 Peak I/I Rate: A normalized peak I/I flow based on catchment area size, Peak I/I Rate = Peak I/I Flow / Catchment Area 6 Volumetric Coefficient (Cv%): The ratio of total I/I volume and total rainfall volume, Cv% = Total I/I Flow Volume / Total Precipitation Volume * 100% 7 Peak I/ I Coefficient: The ratio of peak I/I flow and peak rainfall intensity, Peak I/ I Coefficient = Peak I/I Flow / (Peak Rainfall Intensity over Tc * Catchment Area) 8 Hourly Wet‐Weather Peaking Factor: The ratio of peak hourly wet‐weather measured flow and average dry‐weather flow, Wet‐Weather Peaking Factor = Peak Hourly Wet‐Weather Measured Flow / Average Dry-Weather Flow 9 Instantaneous Wet‐Weather Peaking Factor: The ratio of peak wet‐weather measured flow and average dry‐weather flow, Wet‐Weather Peaking Factor = Peak Wet‐Weather Measured Flow / Average Dry-Weather Flow 2
833 Civica Infrastructure Inc. www.civi.ca
Civica Infrastructures Inc. Kawartha Lakes Flow Monitoring Report
Appendix - A June 03, 2024
I/I Analysis Graph Station: L11
834 Civica Infrastructure Inc. www.civi.ca
Civica Infrastructures Inc. Kawartha Lakes Flow Monitoring Report
Appendix - A June 03, 2024
Infiltration/Inflow Event Analysis Station: L11 Jun 26, 2023 21:00 – Jun 28, 2023 02:25, Total Precipitation: 24.20 mm (16,891,591.60 L) Station Details
Storm Details
Catchment Area
69.80 ha
Total Precipitation
24.20 mm (16,891,591.60 L)
Duration of Storm
5.42 hr
Time of Concentration (Tc) 1
45 min
Peak Precipitation Intensity Over Tc 2
9.90 mm/hr
Return Period over Tc 3
< 2 Yr
Measured Flow
I/I Flow
Time of Peak Measured Flow
Jun 27, 2023 14:10
Time of Peak I/I Flow (TD)
Jun 27, 2023 14:10
Estimated Dry Weather Flow at TD
7.84 L/s
Peak Measured Flow
31.59 L/s
Peak I/I Flow 4
23.75 L/s
Peak I/I Rate 5
0.34 L/s/ha
Peak Measured Depth
97.00 mm
Total I/I Flow Volume during event
526,660.50 L
Volumetric Coefficient (Cv%) 6
3.12%
Total Measured Flow Volume during Event
978,614.30 L
Peak I/I Coefficient 7
0.0124
Hourly Wet-Weather Peaking Factor 8
4.07
Instantaneous Wet-Weather Peaking Factor 9
4.40
1
Time of Concentration (Tc): The estimated time for the flow to travel from the furthest point in the upstream area to the point of monitoring, assume flow is travelling at 1.00 m/s Peak Precipitation Intensity Over Tc: The peak rainfall intensity for the duration of the storm with the time interval defined by time of concentration 3 Return Period over Tc: The estimated time to elapse before a storm of equal or greater intensity will likely occur again, based on design storm criteria 4 Peak I/I Flow: The greatest difference captured between measured flow and estimated dry weather flow, Peak I/I Flow = Maximum (Measured Flow – Estimated Dry Weather Flow) 5 Peak I/I Rate: A normalized peak I/I flow based on catchment area size, Peak I/I Rate = Peak I/I Flow / Catchment Area 6 Volumetric Coefficient (Cv%): The ratio of total I/I volume and total rainfall volume, Cv% = Total I/I Flow Volume / Total Precipitation Volume * 100% 7 Peak I/ I Coefficient: The ratio of peak I/I flow and peak rainfall intensity, Peak I/ I Coefficient = Peak I/I Flow / (Peak Rainfall Intensity over Tc * Catchment Area) 8 Hourly Wet‐Weather Peaking Factor: The ratio of peak hourly wet‐weather measured flow and average dry‐weather flow, Wet‐Weather Peaking Factor = Peak Hourly Wet‐Weather Measured Flow / Average Dry-Weather Flow 9 Instantaneous Wet‐Weather Peaking Factor: The ratio of peak wet‐weather measured flow and average dry‐weather flow, Wet‐Weather Peaking Factor = Peak Wet‐Weather Measured Flow / Average Dry-Weather Flow 2
835 Civica Infrastructure Inc. www.civi.ca
Civica Infrastructures Inc. Kawartha Lakes Flow Monitoring Report
Appendix - A June 03, 2024
I/I Analysis Graph Station: L11
836 Civica Infrastructure Inc. www.civi.ca
Civica Infrastructures Inc. Kawartha Lakes Flow Monitoring Report
Appendix - A June 03, 2024
Infiltration/Inflow Event Analysis Station: L11 Aug 03, 2023 03:55 – Aug 04, 2023 08:45, Total Precipitation: 41.40 mm (28,897,197.20 L) Station Details
Storm Details
Catchment Area
69.80 ha
Total Precipitation
41.40 mm (28,897,197.20 L)
Duration of Storm
4.83 hr
Time of Concentration (Tc) 1
45 min
Peak Precipitation Intensity Over Tc 2
42.40 mm/hr
Return Period over Tc 3
2 - 5 Yr
Measured Flow
I/I Flow
Time of Peak Measured Flow
Aug 03, 2023 16:40
Time of Peak I/I Flow (TD)
Aug 03, 2023 16:40
Estimated Dry Weather Flow at TD
7.97 L/s
Peak Measured Flow
49.25 L/s
Peak I/I Flow 4
41.28 L/s
Peak I/I Rate 5
0.59 L/s/ha
Peak Measured Depth
116.00 mm
Total I/I Flow Volume during event
443,466.50 L
Volumetric Coefficient (Cv%) 6
1.54%
Total Measured Flow Volume during Event
781,529.50 L
Peak I/I Coefficient 7
0.0050
Hourly Wet-Weather Peaking Factor 8
6.51
Instantaneous Wet-Weather Peaking Factor 9
8.87
1
Time of Concentration (Tc): The estimated time for the flow to travel from the furthest point in the upstream area to the point of monitoring, assume flow is travelling at 1.00 m/s Peak Precipitation Intensity Over Tc: The peak rainfall intensity for the duration of the storm with the time interval defined by time of concentration 3 Return Period over Tc: The estimated time to elapse before a storm of equal or greater intensity will likely occur again, based on design storm criteria 4 Peak I/I Flow: The greatest difference captured between measured flow and estimated dry weather flow, Peak I/I Flow = Maximum (Measured Flow – Estimated Dry Weather Flow) 5 Peak I/I Rate: A normalized peak I/I flow based on catchment area size, Peak I/I Rate = Peak I/I Flow / Catchment Area 6 Volumetric Coefficient (Cv%): The ratio of total I/I volume and total rainfall volume, Cv% = Total I/I Flow Volume / Total Precipitation Volume * 100% 7 Peak I/ I Coefficient: The ratio of peak I/I flow and peak rainfall intensity, Peak I/ I Coefficient = Peak I/I Flow / (Peak Rainfall Intensity over Tc * Catchment Area) 8 Hourly Wet‐Weather Peaking Factor: The ratio of peak hourly wet‐weather measured flow and average dry‐weather flow, Wet‐Weather Peaking Factor = Peak Hourly Wet‐Weather Measured Flow / Average Dry-Weather Flow 9 Instantaneous Wet‐Weather Peaking Factor: The ratio of peak wet‐weather measured flow and average dry‐weather flow, Wet‐Weather Peaking Factor = Peak Wet‐Weather Measured Flow / Average Dry-Weather Flow 2
837 Civica Infrastructure Inc. www.civi.ca
Civica Infrastructures Inc. Kawartha Lakes Flow Monitoring Report
Appendix - A June 03, 2024
I/I Analysis Graph Station: L11
838 Civica Infrastructure Inc. www.civi.ca
Civica Infrastructures Inc. Kawartha Lakes Flow Monitoring Report
Appendix - A June 03, 2024
Infiltration/Inflow Event Analysis Station: L11 Sep 07, 2023 03:00 – Sep 08, 2023 03:50, Total Precipitation: 21.80 mm (15,216,395.80 L) Station Details
Storm Details
Catchment Area
69.80 ha
Total Precipitation
21.80 mm (15,216,395.80 L)
Duration of Storm
0.83 hr
Time of Concentration (Tc) 1
45 min
Peak Precipitation Intensity Over Tc 2
27.70 mm/hr
Return Period over Tc 3
< 2 Yr
Measured Flow
I/I Flow
Time of Peak Measured Flow
Sep 07, 2023 16:25
Time of Peak I/I Flow (TD)
Sep 07, 2023 16:25
Estimated Dry Weather Flow at TD
6.61 L/s
Peak Measured Flow
37.83 L/s
Peak I/I Flow 4
31.22 L/s
Peak I/I Rate 5
0.45 L/s/ha
Peak Measured Depth
102.00 mm
Total I/I Flow Volume during event
168,936.90 L
Volumetric Coefficient (Cv%) 6
1.11%
Total Measured Flow Volume during Event
398,931.90 L
Peak I/I Coefficient 7
0.0058
Hourly Wet-Weather Peaking Factor 8
5.94
Instantaneous Wet-Weather Peaking Factor 9
7.65
1
Time of Concentration (Tc): The estimated time for the flow to travel from the furthest point in the upstream area to the point of monitoring, assume flow is travelling at 1.00 m/s Peak Precipitation Intensity Over Tc: The peak rainfall intensity for the duration of the storm with the time interval defined by time of concentration 3 Return Period over Tc: The estimated time to elapse before a storm of equal or greater intensity will likely occur again, based on design storm criteria 4 Peak I/I Flow: The greatest difference captured between measured flow and estimated dry weather flow, Peak I/I Flow = Maximum (Measured Flow – Estimated Dry Weather Flow) 5 Peak I/I Rate: A normalized peak I/I flow based on catchment area size, Peak I/I Rate = Peak I/I Flow / Catchment Area 6 Volumetric Coefficient (Cv%): The ratio of total I/I volume and total rainfall volume, Cv% = Total I/I Flow Volume / Total Precipitation Volume * 100% 7 Peak I/ I Coefficient: The ratio of peak I/I flow and peak rainfall intensity, Peak I/ I Coefficient = Peak I/I Flow / (Peak Rainfall Intensity over Tc * Catchment Area) 8 Hourly Wet‐Weather Peaking Factor: The ratio of peak hourly wet‐weather measured flow and average dry‐weather flow, Wet‐Weather Peaking Factor = Peak Hourly Wet‐Weather Measured Flow / Average Dry-Weather Flow 9 Instantaneous Wet‐Weather Peaking Factor: The ratio of peak wet‐weather measured flow and average dry‐weather flow, Wet‐Weather Peaking Factor = Peak Wet‐Weather Measured Flow / Average Dry-Weather Flow 2
839 Civica Infrastructure Inc. www.civi.ca
Civica Infrastructures Inc. Kawartha Lakes Flow Monitoring Report
Appendix - A June 03, 2024
Activity Log Station: L11 Date Time
Type
Purpose of Visit
Comment
Calibration Measurement
17-Jan-2023 04:15:00 PM
Installation Log
INSTALLATION
MEASUREMENTS TAKEN, PHOTOS TAKEN, LOGGER INSTALLED
Yes
02-Feb-2023 10:10:00 AM
Maintenance Log
CALIBRATION
DATA DOWNLOADED, TELEMETRY SENT, MEASUREMENTS TAKEN, DEBRIS CLEARED, SITE CALIBRATED
Yes
Yes
15-Mar-2023 01:50:00 PM
Maintenance Log
CALIBRATION
DATA DOWNLOADED, TELEMETRY SENT AND CHECKED, ENTRY MADE, SITE CALIBRATED, PHOTO AND VIDEO TAKEN
03-Apr-2023 12:47:00 PM
Maintenance Log
DATA DOWNLOAD
DATA DOWNLOADED, PHOTOS TAKEN, TELEMETRY SENT,DESSICANT CHECKED,ANTENNA CHECKED,SITE CLEARED
Yes
11-May-2023 09:25:00 AM
Maintenance Log
CALIBRATION
TC SET,SURVEY SENT,DOWNLOADED DATA, SENT TELEMETRY NOT REFLECTED IN FZ , MADE ENTRY, TOOK PHOTOS/VIDEOS, TOOK MEASUREMENTS,DEBRIS AND SILT CLEARED, CALIBRATED SITE
Yes
Yes
22-Jun-2023 11:55:00 AM
Maintenance Log
CALIBRATION
DATA DOWNLOADED, TELEMETRY SENT ENTRY MADE PHOTOS/VIDEOS TAKEN, MEASUREMENTS TAKEN, SITE CALIBRATED
21-Jul-2023 12:47:00 PM
Maintenance Log
DATA DOWNLOAD
TC SET,SURVEY SENT,DATA DOWNLOADED,TELEMETRY SENT REFLECTED IN FZ,SITE CLEARED
Yes
22-Aug-2023 12:00:00 PM
Maintenance Log
DATA DOWNLOAD
TC SET,DATA DOWNLOADED,TELEMETRY SENT,DESSICANT CHECKED,ANTENNA CHECKED,SITE CLEARED
Yes
04-Oct-2023 12:00:00 PM
Removal Log
REMOVAL
TRAFFIC CONTROL SENT, DATA DOWNLOADED, TELEMETRY NOTSENT, CALIBRATION DONE, EQUIPMENT REMOVED, LOGGER TAG, PHOTOS AND VIDEOS BEFORE AND AFTER TAKEN.
Yes
840 Civica Infrastructure Inc. www.civi.ca
Civica Infrastructures Inc. Kawartha Lakes Flow Monitoring Report
Appendix - A June 03, 2024
Aggregate Data Station: L12
Precipitation Date From
Date To
Days
Min (mm)
Avg (mm)
Max (mm)
Sum (mm)
Count
Time of Min1
Time of Max1
Jan 09, 2023
Oct 04, 2023
261
0.00
0.01
12.00
504.55
74,606
Mon Jan 09, 2023 00:00
Thu Aug 03, 2023 16:10
Level Date From
Date To
Days
Min (m)
Avg (m)
Max (m)
Count
Time of Min1
Time of Max1
Jan 09, 2023
Oct 04, 2023
251
0.00
0.05
0.22
71,868
Mon Aug 28, 2023 00:25
Thu Feb 09, 2023 18:00
Velocity Date From
Date To
Days
Min (m/s)
Avg (m/s)
Max (m/s)
Count
Time of Min1
Time of Max1
Jan 09, 2023
Oct 04, 2023
251
0.00
0.45
0.94
71,928
Wed Oct 04, 2023 12:50
Thu Feb 09, 2023 18:20
Flow
1
Date From
Date To
Days
Min (L/s)
Avg (L/s)
Max (L/s)
Total Volume (1,000,000 L)
Count
Time of Min1
Time of Max1
Jan 09, 2023
Oct 04, 2023
251
0.00
7.69
58.16
165.81
71,866
Wed Oct 04, 2023 12:50
Thu Feb 09, 2023 18:00
Time of Min and Time of Max will be displayed by first occurrence
841 Civica Infrastructure Inc. www.civi.ca
Civica Infrastructures Inc. Kawartha Lakes Flow Monitoring Report
Appendix - A June 03, 2024
Data Chart Station: L12 Jan 09, 2023 – Jan 31, 2023
842 Civica Infrastructure Inc. www.civi.ca
Civica Infrastructures Inc. Kawartha Lakes Flow Monitoring Report
Appendix - A June 03, 2024
Data Chart Station: L12 Feb 01, 2023 – Feb 28, 2023
843 Civica Infrastructure Inc. www.civi.ca
Civica Infrastructures Inc. Kawartha Lakes Flow Monitoring Report
Appendix - A June 03, 2024
Data Chart Station: L12 Mar 01, 2023 – Mar 31, 2023
844 Civica Infrastructure Inc. www.civi.ca
Civica Infrastructures Inc. Kawartha Lakes Flow Monitoring Report
Appendix - A June 03, 2024
Data Chart Station: L12 Apr 01, 2023 – Apr 30, 2023
845 Civica Infrastructure Inc. www.civi.ca
Civica Infrastructures Inc. Kawartha Lakes Flow Monitoring Report
Appendix - A June 03, 2024
Data Chart Station: L12 May 01, 2023 – May 31, 2023
846 Civica Infrastructure Inc. www.civi.ca
Civica Infrastructures Inc. Kawartha Lakes Flow Monitoring Report
Appendix - A June 03, 2024
Data Chart Station: L12 Jun 01, 2023 – Jun 30, 2023
847 Civica Infrastructure Inc. www.civi.ca
Civica Infrastructures Inc. Kawartha Lakes Flow Monitoring Report
Appendix - A June 03, 2024
Data Chart Station: L12 Jul 01, 2023 – Jul 31, 2023
848 Civica Infrastructure Inc. www.civi.ca
Civica Infrastructures Inc. Kawartha Lakes Flow Monitoring Report
Appendix - A June 03, 2024
Data Chart Station: L12 Aug 01, 2023 – Aug 31, 2023
849 Civica Infrastructure Inc. www.civi.ca
Civica Infrastructures Inc. Kawartha Lakes Flow Monitoring Report
Appendix - A June 03, 2024
Data Chart Station: L12 Sep 01, 2023 – Sep 30, 2023
850 Civica Infrastructure Inc. www.civi.ca
Civica Infrastructures Inc. Kawartha Lakes Flow Monitoring Report
Appendix - A June 03, 2024
Data Chart Station: L12 Oct 01, 2023 – Oct 04, 2023
851 Civica Infrastructure Inc. www.civi.ca
Civica Infrastructures Inc. Kawartha Lakes Flow Monitoring Report
Appendix - A June 03, 2024
Sanitary Report Station: L12
1
Average Dry Weather Flow (L/s)
Average Dry Weather Flow (L/c/d)
Average Daily Minimum Dry Weather Flow (L/s)
Average Daily Peak Dry Weather Flow (L/s)
6.049
311.626
3.480
8.757
Peaking Factor
Groundwater Infiltration (L/s)1
Groundwater Infiltration (L/ha/d)
% of GWI in Average DWF
1.448
2.958
3,574.802
48.909
Groundwater infiltration (GWI) is assumed as 85% of the daily minimum flow averaged over the monitoring period
852 Civica Infrastructure Inc. www.civi.ca
Civica Infrastructures Inc. Kawartha Lakes Flow Monitoring Report
Appendix - A June 03, 2024
I/I Analysis Table
1
Event1
Total Precipitation (mm)
Duration (hours)
Peak Intensity Over Tc at Station (mm/hr)
Feb 09, 2023
39.75
14.42
Mar 31, 2023
19.00
Apr 05, 2023
L12 Measured Peak Flow (L/s)
Peak I/I Flow (L/s)
Peak I/I Rate (L/s/ha)
Volumetric Runoff Coefficient (CV%)
Peaking Factor (PF)
6.30
58.16
50.49
0.71
8.60 %
8.07
23.33
5.00
52.46
36.89
0.52
14.41 %
2.39
18.00
12.50
7.20
50.77
37.88
0.53
11.55 %
2.99
Apr 30, 2023
16.40
9.50
4.30
32.75
23.44
0.33
8.87 %
2.86
May 19, 2023
32.00
18.92
7.40
47.98
38.37
0.54
4.28 %
5.72
Jun 11, 2023
35.40
25.75
6.20
23.10
17.75
0.25
3.10 %
3.64
Jun 26, 2023
18.40
8.42
10.80
20.39
14.48
0.20
2.34 %
2.50
Jun 27, 2023
24.20
5.42
8.90
38.70
33.18
0.46
5.13 %
6.05
Aug 03, 2023
41.40
4.83
38.20
19.35
13.64
0.19
1.16 %
2.70
Sep 07, 2023
21.80
0.83
25.90
19.14
14.21
0.20
0.88 %
3.73
Average
26.64
12.39
12.02
36.28
28.03
0.39
6.03 %
4.07
Maximum
41.40
25.75
38.20
58.16
50.49
0.71
14.41 %
8.07
Flow KPIs
Measured Storms
Station: L12
An event is a storm with a minimum volume of 15mm and a minimum inter-event dry period of 12 hours
853 Civica Infrastructure Inc. www.civi.ca
Civica Infrastructures Inc. Kawartha Lakes Flow Monitoring Report
Appendix - A June 03, 2024
I/I Analysis Graph Station: L12
854 Civica Infrastructure Inc. www.civi.ca
Civica Infrastructures Inc. Kawartha Lakes Flow Monitoring Report
Appendix - A June 03, 2024
Infiltration/Inflow Event Analysis Station: L12 Feb 08, 2023 21:00 – Feb 10, 2023 11:25, Total Precipitation: 39.75 mm (28,421,250.00 L) Station Details
Storm Details
Catchment Area
71.50 ha
Total Precipitation
39.75 mm (28,421,250.00 L)
Duration of Storm
14.42 hr
Time of Concentration (Tc) 1
50 min
Peak Precipitation Intensity Over Tc 2
6.30 mm/hr
Return Period over Tc 3
< 2 Yr
Measured Flow
I/I Flow
Time of Peak Measured Flow
Feb 09, 2023 18:00
Time of Peak I/I Flow (TD)
Feb 09, 2023 18:00
Estimated Dry Weather Flow at TD
7.67 L/s
Peak Measured Flow
58.16 L/s
Peak I/I Flow 4
50.49 L/s
Peak I/I Rate 5
0.71 L/s/ha
Peak Measured Depth
216.00 mm
Total I/I Flow Volume during event
2,445,219.00 L
Volumetric Coefficient (Cv%) 6
8.60%
Total Measured Flow Volume during Event
3,029,988.40 L
Peak I/I Coefficient 7
0.0404
Hourly Wet-Weather Peaking Factor 8
8.79
Instantaneous Wet-Weather Peaking Factor 9
9.29
1
Time of Concentration (Tc): The estimated time for the flow to travel from the furthest point in the upstream area to the point of monitoring, assume flow is travelling at 1.00 m/s Peak Precipitation Intensity Over Tc: The peak rainfall intensity for the duration of the storm with the time interval defined by time of concentration 3 Return Period over Tc: The estimated time to elapse before a storm of equal or greater intensity will likely occur again, based on design storm criteria 4 Peak I/I Flow: The greatest difference captured between measured flow and estimated dry weather flow, Peak I/I Flow = Maximum (Measured Flow – Estimated Dry Weather Flow) 5 Peak I/I Rate: A normalized peak I/I flow based on catchment area size, Peak I/I Rate = Peak I/I Flow / Catchment Area 6 Volumetric Coefficient (Cv%): The ratio of total I/I volume and total rainfall volume, Cv% = Total I/I Flow Volume / Total Precipitation Volume * 100% 7 Peak I/ I Coefficient: The ratio of peak I/I flow and peak rainfall intensity, Peak I/ I Coefficient = Peak I/I Flow / (Peak Rainfall Intensity over Tc * Catchment Area) 8 Hourly Wet‐Weather Peaking Factor: The ratio of peak hourly wet‐weather measured flow and average dry‐weather flow, Wet‐Weather Peaking Factor = Peak Hourly Wet‐Weather Measured Flow / Average Dry-Weather Flow 9 Instantaneous Wet‐Weather Peaking Factor: The ratio of peak wet‐weather measured flow and average dry‐weather flow, Wet‐Weather Peaking Factor = Peak Wet‐Weather Measured Flow / Average Dry-Weather Flow 2
855 Civica Infrastructure Inc. www.civi.ca
Civica Infrastructures Inc. Kawartha Lakes Flow Monitoring Report
Appendix - A June 03, 2024
I/I Analysis Graph Station: L12
856 Civica Infrastructure Inc. www.civi.ca
Civica Infrastructures Inc. Kawartha Lakes Flow Monitoring Report
Appendix - A June 03, 2024
Infiltration/Inflow Event Analysis Station: L12 Mar 30, 2023 21:40 – Apr 01, 2023 21:00, Total Precipitation: 19.00 mm (13,584,995.70 L) Station Details
Storm Details
Catchment Area
71.50 ha
Total Precipitation
19.00 mm (13,584,995.70 L)
Duration of Storm
23.33 hr
Time of Concentration (Tc) 1
50 min
Peak Precipitation Intensity Over Tc 2
5.00 mm/hr
Return Period over Tc 3
< 2 Yr
Measured Flow
I/I Flow
Time of Peak Measured Flow
Apr 01, 2023 05:40
Time of Peak I/I Flow (TD)
Apr 01, 2023 05:40
Estimated Dry Weather Flow at TD
15.57 L/s
Peak Measured Flow
52.46 L/s
Peak I/I Flow 4
36.89 L/s
Peak I/I Rate 5
0.52 L/s/ha
Peak Measured Depth
199.00 mm
Total I/I Flow Volume during event
1,957,142.30 L
Volumetric Coefficient (Cv%) 6
14.41%
Total Measured Flow Volume during Event
3,925,746.10 L
Peak I/I Coefficient 7
0.0369
Hourly Wet-Weather Peaking Factor 8
3.28
Instantaneous Wet-Weather Peaking Factor 9
3.40
1
Time of Concentration (Tc): The estimated time for the flow to travel from the furthest point in the upstream area to the point of monitoring, assume flow is travelling at 1.00 m/s Peak Precipitation Intensity Over Tc: The peak rainfall intensity for the duration of the storm with the time interval defined by time of concentration 3 Return Period over Tc: The estimated time to elapse before a storm of equal or greater intensity will likely occur again, based on design storm criteria 4 Peak I/I Flow: The greatest difference captured between measured flow and estimated dry weather flow, Peak I/I Flow = Maximum (Measured Flow – Estimated Dry Weather Flow) 5 Peak I/I Rate: A normalized peak I/I flow based on catchment area size, Peak I/I Rate = Peak I/I Flow / Catchment Area 6 Volumetric Coefficient (Cv%): The ratio of total I/I volume and total rainfall volume, Cv% = Total I/I Flow Volume / Total Precipitation Volume * 100% 7 Peak I/ I Coefficient: The ratio of peak I/I flow and peak rainfall intensity, Peak I/ I Coefficient = Peak I/I Flow / (Peak Rainfall Intensity over Tc * Catchment Area) 8 Hourly Wet‐Weather Peaking Factor: The ratio of peak hourly wet‐weather measured flow and average dry‐weather flow, Wet‐Weather Peaking Factor = Peak Hourly Wet‐Weather Measured Flow / Average Dry-Weather Flow 9 Instantaneous Wet‐Weather Peaking Factor: The ratio of peak wet‐weather measured flow and average dry‐weather flow, Wet‐Weather Peaking Factor = Peak Wet‐Weather Measured Flow / Average Dry-Weather Flow 2
857 Civica Infrastructure Inc. www.civi.ca
Civica Infrastructures Inc. Kawartha Lakes Flow Monitoring Report
Appendix - A June 03, 2024
I/I Analysis Graph Station: L12
858 Civica Infrastructure Inc. www.civi.ca
Civica Infrastructures Inc. Kawartha Lakes Flow Monitoring Report
Appendix - A June 03, 2024
Infiltration/Inflow Event Analysis Station: L12 Apr 04, 2023 17:45 – Apr 06, 2023 06:15, Total Precipitation: 18.00 mm (12,869,995.00 L) Station Details
Storm Details
Catchment Area
71.50 ha
Total Precipitation
18.00 mm (12,869,995.00 L)
Duration of Storm
12.50 hr
Time of Concentration (Tc) 1
50 min
Peak Precipitation Intensity Over Tc 2
7.20 mm/hr
Return Period over Tc 3
< 2 Yr
Measured Flow
I/I Flow
Time of Peak Measured Flow
Apr 05, 2023 16:25
Time of Peak I/I Flow (TD)
Apr 05, 2023 16:25
Estimated Dry Weather Flow at TD
12.89 L/s
Peak Measured Flow
50.77 L/s
Peak I/I Flow 4
37.88 L/s
Peak I/I Rate 5
0.53 L/s/ha
Peak Measured Depth
199.00 mm
Total I/I Flow Volume during event
1,486,571.00 L
Volumetric Coefficient (Cv%) 6
11.55%
Total Measured Flow Volume during Event
2,608,269.70 L
Peak I/I Coefficient 7
0.0265
Hourly Wet-Weather Peaking Factor 8
3.85
Instantaneous Wet-Weather Peaking Factor 9
4.01
1
Time of Concentration (Tc): The estimated time for the flow to travel from the furthest point in the upstream area to the point of monitoring, assume flow is travelling at 1.00 m/s Peak Precipitation Intensity Over Tc: The peak rainfall intensity for the duration of the storm with the time interval defined by time of concentration 3 Return Period over Tc: The estimated time to elapse before a storm of equal or greater intensity will likely occur again, based on design storm criteria 4 Peak I/I Flow: The greatest difference captured between measured flow and estimated dry weather flow, Peak I/I Flow = Maximum (Measured Flow – Estimated Dry Weather Flow) 5 Peak I/I Rate: A normalized peak I/I flow based on catchment area size, Peak I/I Rate = Peak I/I Flow / Catchment Area 6 Volumetric Coefficient (Cv%): The ratio of total I/I volume and total rainfall volume, Cv% = Total I/I Flow Volume / Total Precipitation Volume * 100% 7 Peak I/ I Coefficient: The ratio of peak I/I flow and peak rainfall intensity, Peak I/ I Coefficient = Peak I/I Flow / (Peak Rainfall Intensity over Tc * Catchment Area) 8 Hourly Wet‐Weather Peaking Factor: The ratio of peak hourly wet‐weather measured flow and average dry‐weather flow, Wet‐Weather Peaking Factor = Peak Hourly Wet‐Weather Measured Flow / Average Dry-Weather Flow 9 Instantaneous Wet‐Weather Peaking Factor: The ratio of peak wet‐weather measured flow and average dry‐weather flow, Wet‐Weather Peaking Factor = Peak Wet‐Weather Measured Flow / Average Dry-Weather Flow 2
859 Civica Infrastructure Inc. www.civi.ca
Civica Infrastructures Inc. Kawartha Lakes Flow Monitoring Report
Appendix - A June 03, 2024
I/I Analysis Graph Station: L12
860 Civica Infrastructure Inc. www.civi.ca
Civica Infrastructures Inc. Kawartha Lakes Flow Monitoring Report
Appendix - A June 03, 2024
Infiltration/Inflow Event Analysis Station: L12 Apr 30, 2023 00:30 – May 01, 2023 10:00, Total Precipitation: 16.40 mm (11,725,997.90 L) Station Details
Storm Details
Catchment Area
71.50 ha
Total Precipitation
16.40 mm (11,725,997.90 L)
Duration of Storm
9.50 hr
Time of Concentration (Tc) 1
50 min
Peak Precipitation Intensity Over Tc 2
4.30 mm/hr
Return Period over Tc 3
< 2 Yr
Measured Flow
I/I Flow
Time of Peak Measured Flow
Apr 30, 2023 19:55
Time of Peak I/I Flow (TD)
Apr 30, 2023 19:55
Estimated Dry Weather Flow at TD
9.31 L/s
Peak Measured Flow
32.75 L/s
Peak I/I Flow 4
23.44 L/s
Peak I/I Rate 5
0.33 L/s/ha
Peak Measured Depth
147.00 mm
Total I/I Flow Volume during event
1,040,559.50 L
Volumetric Coefficient (Cv%) 6
8.87%
Total Measured Flow Volume during Event
1,676,361.40 L
Peak I/I Coefficient 7
0.0273
Hourly Wet-Weather Peaking Factor 8
3.78
Instantaneous Wet-Weather Peaking Factor 9
4.00
1
Time of Concentration (Tc): The estimated time for the flow to travel from the furthest point in the upstream area to the point of monitoring, assume flow is travelling at 1.00 m/s Peak Precipitation Intensity Over Tc: The peak rainfall intensity for the duration of the storm with the time interval defined by time of concentration 3 Return Period over Tc: The estimated time to elapse before a storm of equal or greater intensity will likely occur again, based on design storm criteria 4 Peak I/I Flow: The greatest difference captured between measured flow and estimated dry weather flow, Peak I/I Flow = Maximum (Measured Flow – Estimated Dry Weather Flow) 5 Peak I/I Rate: A normalized peak I/I flow based on catchment area size, Peak I/I Rate = Peak I/I Flow / Catchment Area 6 Volumetric Coefficient (Cv%): The ratio of total I/I volume and total rainfall volume, Cv% = Total I/I Flow Volume / Total Precipitation Volume * 100% 7 Peak I/ I Coefficient: The ratio of peak I/I flow and peak rainfall intensity, Peak I/ I Coefficient = Peak I/I Flow / (Peak Rainfall Intensity over Tc * Catchment Area) 8 Hourly Wet‐Weather Peaking Factor: The ratio of peak hourly wet‐weather measured flow and average dry‐weather flow, Wet‐Weather Peaking Factor = Peak Hourly Wet‐Weather Measured Flow / Average Dry-Weather Flow 9 Instantaneous Wet‐Weather Peaking Factor: The ratio of peak wet‐weather measured flow and average dry‐weather flow, Wet‐Weather Peaking Factor = Peak Wet‐Weather Measured Flow / Average Dry-Weather Flow 2
861 Civica Infrastructure Inc. www.civi.ca
Civica Infrastructures Inc. Kawartha Lakes Flow Monitoring Report
Appendix - A June 03, 2024
I/I Analysis Graph Station: L12
862 Civica Infrastructure Inc. www.civi.ca
Civica Infrastructures Inc. Kawartha Lakes Flow Monitoring Report
Appendix - A June 03, 2024
Infiltration/Inflow Event Analysis Station: L12 May 19, 2023 08:15 – May 21, 2023 03:10, Total Precipitation: 32.00 mm (22,879,992.80 L) Station Details
Storm Details
Catchment Area
71.50 ha
Total Precipitation
32.00 mm (22,879,992.80 L)
Duration of Storm
18.92 hr
Time of Concentration (Tc) 1
50 min
Peak Precipitation Intensity Over Tc 2
7.40 mm/hr
Return Period over Tc 3
< 2 Yr
Measured Flow
I/I Flow
Time of Peak Measured Flow
May 20, 2023 09:25
Time of Peak I/I Flow (TD)
May 20, 2023 09:25
Estimated Dry Weather Flow at TD
9.61 L/s
Peak Measured Flow
47.98 L/s
Peak I/I Flow 4
38.37 L/s
Peak I/I Rate 5
0.54 L/s/ha
Peak Measured Depth
199.00 mm
Total I/I Flow Volume during event
978,717.50 L
Volumetric Coefficient (Cv%) 6
4.28%
Total Measured Flow Volume during Event
1,726,815.80 L
Peak I/I Coefficient 7
0.0260
Hourly Wet-Weather Peaking Factor 8
5.19
Instantaneous Wet-Weather Peaking Factor 9
7.16
1
Time of Concentration (Tc): The estimated time for the flow to travel from the furthest point in the upstream area to the point of monitoring, assume flow is travelling at 1.00 m/s Peak Precipitation Intensity Over Tc: The peak rainfall intensity for the duration of the storm with the time interval defined by time of concentration 3 Return Period over Tc: The estimated time to elapse before a storm of equal or greater intensity will likely occur again, based on design storm criteria 4 Peak I/I Flow: The greatest difference captured between measured flow and estimated dry weather flow, Peak I/I Flow = Maximum (Measured Flow – Estimated Dry Weather Flow) 5 Peak I/I Rate: A normalized peak I/I flow based on catchment area size, Peak I/I Rate = Peak I/I Flow / Catchment Area 6 Volumetric Coefficient (Cv%): The ratio of total I/I volume and total rainfall volume, Cv% = Total I/I Flow Volume / Total Precipitation Volume * 100% 7 Peak I/ I Coefficient: The ratio of peak I/I flow and peak rainfall intensity, Peak I/ I Coefficient = Peak I/I Flow / (Peak Rainfall Intensity over Tc * Catchment Area) 8 Hourly Wet‐Weather Peaking Factor: The ratio of peak hourly wet‐weather measured flow and average dry‐weather flow, Wet‐Weather Peaking Factor = Peak Hourly Wet‐Weather Measured Flow / Average Dry-Weather Flow 9 Instantaneous Wet‐Weather Peaking Factor: The ratio of peak wet‐weather measured flow and average dry‐weather flow, Wet‐Weather Peaking Factor = Peak Wet‐Weather Measured Flow / Average Dry-Weather Flow 2
863 Civica Infrastructure Inc. www.civi.ca
Civica Infrastructures Inc. Kawartha Lakes Flow Monitoring Report
Appendix - A June 03, 2024
I/I Analysis Graph Station: L12
864 Civica Infrastructure Inc. www.civi.ca
Civica Infrastructures Inc. Kawartha Lakes Flow Monitoring Report
Appendix - A June 03, 2024
Infiltration/Inflow Event Analysis Station: L12 Jun 11, 2023 07:25 – Jun 13, 2023 09:10, Total Precipitation: 35.40 mm (25,310,995.00 L) Station Details
Storm Details
Catchment Area
71.50 ha
Total Precipitation
35.40 mm (25,310,995.00 L)
Duration of Storm
25.75 hr
Time of Concentration (Tc) 1
50 min
Peak Precipitation Intensity Over Tc 2
6.20 mm/hr
Return Period over Tc 3
< 2 Yr
Measured Flow
I/I Flow
Time of Peak Measured Flow
Jun 12, 2023 12:45
Time of Peak I/I Flow (TD)
Jun 12, 2023 12:45
Estimated Dry Weather Flow at TD
5.36 L/s
Peak Measured Flow
23.10 L/s
Peak I/I Flow 4
17.75 L/s
Peak I/I Rate 5
0.25 L/s/ha
Peak Measured Depth
117.00 mm
Total I/I Flow Volume during event
783,932.90 L
Volumetric Coefficient (Cv%) 6
3.10%
Total Measured Flow Volume during Event
1,448,104.90 L
Peak I/I Coefficient 7
0.0143
Hourly Wet-Weather Peaking Factor 8
4.42
Instantaneous Wet-Weather Peaking Factor 9
4.74
1
Time of Concentration (Tc): The estimated time for the flow to travel from the furthest point in the upstream area to the point of monitoring, assume flow is travelling at 1.00 m/s Peak Precipitation Intensity Over Tc: The peak rainfall intensity for the duration of the storm with the time interval defined by time of concentration 3 Return Period over Tc: The estimated time to elapse before a storm of equal or greater intensity will likely occur again, based on design storm criteria 4 Peak I/I Flow: The greatest difference captured between measured flow and estimated dry weather flow, Peak I/I Flow = Maximum (Measured Flow – Estimated Dry Weather Flow) 5 Peak I/I Rate: A normalized peak I/I flow based on catchment area size, Peak I/I Rate = Peak I/I Flow / Catchment Area 6 Volumetric Coefficient (Cv%): The ratio of total I/I volume and total rainfall volume, Cv% = Total I/I Flow Volume / Total Precipitation Volume * 100% 7 Peak I/ I Coefficient: The ratio of peak I/I flow and peak rainfall intensity, Peak I/ I Coefficient = Peak I/I Flow / (Peak Rainfall Intensity over Tc * Catchment Area) 8 Hourly Wet‐Weather Peaking Factor: The ratio of peak hourly wet‐weather measured flow and average dry‐weather flow, Wet‐Weather Peaking Factor = Peak Hourly Wet‐Weather Measured Flow / Average Dry-Weather Flow 9 Instantaneous Wet‐Weather Peaking Factor: The ratio of peak wet‐weather measured flow and average dry‐weather flow, Wet‐Weather Peaking Factor = Peak Wet‐Weather Measured Flow / Average Dry-Weather Flow 2
865 Civica Infrastructure Inc. www.civi.ca
Civica Infrastructures Inc. Kawartha Lakes Flow Monitoring Report
Appendix - A June 03, 2024
I/I Analysis Graph Station: L12
866 Civica Infrastructure Inc. www.civi.ca
Civica Infrastructures Inc. Kawartha Lakes Flow Monitoring Report
Appendix - A June 03, 2024
Infiltration/Inflow Event Analysis Station: L12 Jun 25, 2023 15:05 – Jun 26, 2023 23:30, Total Precipitation: 18.40 mm (13,155,996.40 L) Station Details
Storm Details
Catchment Area
71.50 ha
Total Precipitation
18.40 mm (13,155,996.40 L)
Duration of Storm
8.42 hr
Time of Concentration (Tc) 1
50 min
Peak Precipitation Intensity Over Tc 2
10.80 mm/hr
Return Period over Tc 3
< 2 Yr
Measured Flow
I/I Flow
Time of Peak Measured Flow
Jun 26, 2023 11:45
Time of Peak I/I Flow (TD)
Jun 26, 2023 11:45
Estimated Dry Weather Flow at TD
5.91 L/s
Peak Measured Flow
20.39 L/s
Peak I/I Flow 4
14.48 L/s
Peak I/I Rate 5
0.20 L/s/ha
Peak Measured Depth
124.00 mm
Total I/I Flow Volume during event
307,324.90 L
Volumetric Coefficient (Cv%) 6
2.34%
Total Measured Flow Volume during Event
734,913.40 L
Peak I/I Coefficient 7
0.0068
Hourly Wet-Weather Peaking Factor 8
3.14
Instantaneous Wet-Weather Peaking Factor 9
3.52
1
Time of Concentration (Tc): The estimated time for the flow to travel from the furthest point in the upstream area to the point of monitoring, assume flow is travelling at 1.00 m/s Peak Precipitation Intensity Over Tc: The peak rainfall intensity for the duration of the storm with the time interval defined by time of concentration 3 Return Period over Tc: The estimated time to elapse before a storm of equal or greater intensity will likely occur again, based on design storm criteria 4 Peak I/I Flow: The greatest difference captured between measured flow and estimated dry weather flow, Peak I/I Flow = Maximum (Measured Flow – Estimated Dry Weather Flow) 5 Peak I/I Rate: A normalized peak I/I flow based on catchment area size, Peak I/I Rate = Peak I/I Flow / Catchment Area 6 Volumetric Coefficient (Cv%): The ratio of total I/I volume and total rainfall volume, Cv% = Total I/I Flow Volume / Total Precipitation Volume * 100% 7 Peak I/ I Coefficient: The ratio of peak I/I flow and peak rainfall intensity, Peak I/ I Coefficient = Peak I/I Flow / (Peak Rainfall Intensity over Tc * Catchment Area) 8 Hourly Wet‐Weather Peaking Factor: The ratio of peak hourly wet‐weather measured flow and average dry‐weather flow, Wet‐Weather Peaking Factor = Peak Hourly Wet‐Weather Measured Flow / Average Dry-Weather Flow 9 Instantaneous Wet‐Weather Peaking Factor: The ratio of peak wet‐weather measured flow and average dry‐weather flow, Wet‐Weather Peaking Factor = Peak Wet‐Weather Measured Flow / Average Dry-Weather Flow 2
867 Civica Infrastructure Inc. www.civi.ca
Civica Infrastructures Inc. Kawartha Lakes Flow Monitoring Report
Appendix - A June 03, 2024
I/I Analysis Graph Station: L12
868 Civica Infrastructure Inc. www.civi.ca
Civica Infrastructures Inc. Kawartha Lakes Flow Monitoring Report
Appendix - A June 03, 2024
Infiltration/Inflow Event Analysis Station: L12 Jun 26, 2023 21:00 – Jun 28, 2023 02:25, Total Precipitation: 24.20 mm (17,302,991.40 L) Station Details
Storm Details
Catchment Area
71.50 ha
Total Precipitation
24.20 mm (17,302,991.40 L)
Duration of Storm
5.42 hr
Time of Concentration (Tc) 1
50 min
Peak Precipitation Intensity Over Tc 2
8.90 mm/hr
Return Period over Tc 3
< 2 Yr
Measured Flow
I/I Flow
Time of Peak Measured Flow
Jun 27, 2023 14:10
Time of Peak I/I Flow (TD)
Jun 27, 2023 13:50
Estimated Dry Weather Flow at TD
5.30 L/s
Peak Measured Flow
38.70 L/s
Peak I/I Flow 4
33.18 L/s
Peak I/I Rate 5
0.46 L/s/ha
Peak Measured Depth
166.00 mm
Total I/I Flow Volume during event
886,792.30 L
Volumetric Coefficient (Cv%) 6
5.13%
Total Measured Flow Volume during Event
1,232,245.40 L
Peak I/I Coefficient 7
0.0188
Hourly Wet-Weather Peaking Factor 8
6.83
Instantaneous Wet-Weather Peaking Factor 9
7.06
1
Time of Concentration (Tc): The estimated time for the flow to travel from the furthest point in the upstream area to the point of monitoring, assume flow is travelling at 1.00 m/s Peak Precipitation Intensity Over Tc: The peak rainfall intensity for the duration of the storm with the time interval defined by time of concentration 3 Return Period over Tc: The estimated time to elapse before a storm of equal or greater intensity will likely occur again, based on design storm criteria 4 Peak I/I Flow: The greatest difference captured between measured flow and estimated dry weather flow, Peak I/I Flow = Maximum (Measured Flow – Estimated Dry Weather Flow) 5 Peak I/I Rate: A normalized peak I/I flow based on catchment area size, Peak I/I Rate = Peak I/I Flow / Catchment Area 6 Volumetric Coefficient (Cv%): The ratio of total I/I volume and total rainfall volume, Cv% = Total I/I Flow Volume / Total Precipitation Volume * 100% 7 Peak I/ I Coefficient: The ratio of peak I/I flow and peak rainfall intensity, Peak I/ I Coefficient = Peak I/I Flow / (Peak Rainfall Intensity over Tc * Catchment Area) 8 Hourly Wet‐Weather Peaking Factor: The ratio of peak hourly wet‐weather measured flow and average dry‐weather flow, Wet‐Weather Peaking Factor = Peak Hourly Wet‐Weather Measured Flow / Average Dry-Weather Flow 9 Instantaneous Wet‐Weather Peaking Factor: The ratio of peak wet‐weather measured flow and average dry‐weather flow, Wet‐Weather Peaking Factor = Peak Wet‐Weather Measured Flow / Average Dry-Weather Flow 2
869 Civica Infrastructure Inc. www.civi.ca
Civica Infrastructures Inc. Kawartha Lakes Flow Monitoring Report
Appendix - A June 03, 2024
I/I Analysis Graph Station: L12
870 Civica Infrastructure Inc. www.civi.ca
Civica Infrastructures Inc. Kawartha Lakes Flow Monitoring Report
Appendix - A June 03, 2024
Infiltration/Inflow Event Analysis Station: L12 Aug 03, 2023 03:55 – Aug 04, 2023 08:45, Total Precipitation: 41.40 mm (29,600,997.10 L) Station Details
Storm Details
Catchment Area
71.50 ha
Total Precipitation
41.40 mm (29,600,997.10 L)
Duration of Storm
4.83 hr
Time of Concentration (Tc) 1
50 min
Peak Precipitation Intensity Over Tc 2
38.20 mm/hr
Return Period over Tc 3
2 - 5 Yr
Measured Flow
I/I Flow
Time of Peak Measured Flow
Aug 03, 2023 16:35
Time of Peak I/I Flow (TD)
Aug 03, 2023 16:35
Estimated Dry Weather Flow at TD
5.72 L/s
Peak Measured Flow
19.35 L/s
Peak I/I Flow 4
13.64 L/s
Peak I/I Rate 5
0.19 L/s/ha
Peak Measured Depth
90.16 mm
Total I/I Flow Volume during event
342,892.30 L
Volumetric Coefficient (Cv%) 6
1.16%
Total Measured Flow Volume during Event
650,953.40 L
Peak I/I Coefficient 7
0.0018
Hourly Wet-Weather Peaking Factor 8
3.21
Instantaneous Wet-Weather Peaking Factor 9
3.83
1
Time of Concentration (Tc): The estimated time for the flow to travel from the furthest point in the upstream area to the point of monitoring, assume flow is travelling at 1.00 m/s Peak Precipitation Intensity Over Tc: The peak rainfall intensity for the duration of the storm with the time interval defined by time of concentration 3 Return Period over Tc: The estimated time to elapse before a storm of equal or greater intensity will likely occur again, based on design storm criteria 4 Peak I/I Flow: The greatest difference captured between measured flow and estimated dry weather flow, Peak I/I Flow = Maximum (Measured Flow – Estimated Dry Weather Flow) 5 Peak I/I Rate: A normalized peak I/I flow based on catchment area size, Peak I/I Rate = Peak I/I Flow / Catchment Area 6 Volumetric Coefficient (Cv%): The ratio of total I/I volume and total rainfall volume, Cv% = Total I/I Flow Volume / Total Precipitation Volume * 100% 7 Peak I/ I Coefficient: The ratio of peak I/I flow and peak rainfall intensity, Peak I/ I Coefficient = Peak I/I Flow / (Peak Rainfall Intensity over Tc * Catchment Area) 8 Hourly Wet‐Weather Peaking Factor: The ratio of peak hourly wet‐weather measured flow and average dry‐weather flow, Wet‐Weather Peaking Factor = Peak Hourly Wet‐Weather Measured Flow / Average Dry-Weather Flow 9 Instantaneous Wet‐Weather Peaking Factor: The ratio of peak wet‐weather measured flow and average dry‐weather flow, Wet‐Weather Peaking Factor = Peak Wet‐Weather Measured Flow / Average Dry-Weather Flow 2
871 Civica Infrastructure Inc. www.civi.ca
Civica Infrastructures Inc. Kawartha Lakes Flow Monitoring Report
Appendix - A June 03, 2024
I/I Analysis Graph Station: L12
872 Civica Infrastructure Inc. www.civi.ca
Civica Infrastructures Inc. Kawartha Lakes Flow Monitoring Report
Appendix - A June 03, 2024
Infiltration/Inflow Event Analysis Station: L12 Sep 07, 2023 03:00 – Sep 08, 2023 03:50, Total Precipitation: 21.80 mm (15,586,995.70 L) Station Details
Storm Details
Catchment Area
71.50 ha
Total Precipitation
21.80 mm (15,586,995.70 L)
Duration of Storm
0.83 hr
Time of Concentration (Tc) 1
50 min
Peak Precipitation Intensity Over Tc 2
25.90 mm/hr
Return Period over Tc 3
< 2 Yr
Measured Flow
I/I Flow
Time of Peak Measured Flow
Sep 07, 2023 16:00
Time of Peak I/I Flow (TD)
Sep 07, 2023 16:00
Estimated Dry Weather Flow at TD
4.93 L/s
Peak Measured Flow
19.14 L/s
Peak I/I Flow 4
14.21 L/s
Peak I/I Rate 5
0.20 L/s/ha
Peak Measured Depth
98.00 mm
Total I/I Flow Volume during event
137,486.90 L
Volumetric Coefficient (Cv%) 6
0.88%
Total Measured Flow Volume during Event
314,896.70 L
Peak I/I Coefficient 7
0.0028
Hourly Wet-Weather Peaking Factor 8
4.42
Instantaneous Wet-Weather Peaking Factor 9
5.02
1
Time of Concentration (Tc): The estimated time for the flow to travel from the furthest point in the upstream area to the point of monitoring, assume flow is travelling at 1.00 m/s Peak Precipitation Intensity Over Tc: The peak rainfall intensity for the duration of the storm with the time interval defined by time of concentration 3 Return Period over Tc: The estimated time to elapse before a storm of equal or greater intensity will likely occur again, based on design storm criteria 4 Peak I/I Flow: The greatest difference captured between measured flow and estimated dry weather flow, Peak I/I Flow = Maximum (Measured Flow – Estimated Dry Weather Flow) 5 Peak I/I Rate: A normalized peak I/I flow based on catchment area size, Peak I/I Rate = Peak I/I Flow / Catchment Area 6 Volumetric Coefficient (Cv%): The ratio of total I/I volume and total rainfall volume, Cv% = Total I/I Flow Volume / Total Precipitation Volume * 100% 7 Peak I/ I Coefficient: The ratio of peak I/I flow and peak rainfall intensity, Peak I/ I Coefficient = Peak I/I Flow / (Peak Rainfall Intensity over Tc * Catchment Area) 8 Hourly Wet‐Weather Peaking Factor: The ratio of peak hourly wet‐weather measured flow and average dry‐weather flow, Wet‐Weather Peaking Factor = Peak Hourly Wet‐Weather Measured Flow / Average Dry-Weather Flow 9 Instantaneous Wet‐Weather Peaking Factor: The ratio of peak wet‐weather measured flow and average dry‐weather flow, Wet‐Weather Peaking Factor = Peak Wet‐Weather Measured Flow / Average Dry-Weather Flow 2
873 Civica Infrastructure Inc. www.civi.ca
Civica Infrastructures Inc. Kawartha Lakes Flow Monitoring Report
Appendix - A June 03, 2024
Activity Log Station: L12 Date Time
Type
Purpose of Visit
Comment
Calibration Measurement
18-Jan-2023 10:37:00 AM
Installation Log
installation
MEASUREMENTS TAKEN, PHOTOS TAKEN, VIDEOS TAKEN, LOGGER INSTALLED AND SITE CALIBRATED
Yes
01-Feb-2023 03:45:00 PM
Maintenance Log
CALIBRATION
DATA DOWNLOADED, TELEMETRY SENT, MEASUREMENTS TAKEN, DEBRIS CLEARED, SITE CALIBRATED
Yes
02-Mar-2023 02:20:00 PM
Maintenance Log
CALIBRATION
TC SET,DATA DOWNLOADED,TELEMETRY SENT,DEBRIS AND SILT REMOVED,SITE CALIBRATED,ANTENNA IN GOOD CONDITION,PHOTOS AND VIDEOS TAKEN
Yes
03-Apr-2023 12:30:00 PM
Maintenance Log
DATA DOWNLOAD
DATA DOWNLOADED, PHOTOS TAKEN, TELEMETRY NOT SENDING,LIVE READING GOOD,DESSICANT GOOD,ANTENNA IN GOOD CONDITION
Yes
11-May-2023 10:20:00 AM
Maintenance Log
CALIBRATION
TC SET,SURVEY SENT,DOWNLOADED DATA, SENT TELEMETRY NOT REFLECTED IN FZ , MADE ENTRY, TOOK PHOTOS/VIDEOS, TOOK MEASUREMENTS,DEBRIS AND SILT CLEARED, CALIBRATED SITE
Yes
Yes
22-Jun-2023 12:30:00 PM
Maintenance Log
CALIBRATION
DATA DOWNLOADED, TELEMETRY SENT ENTRY MADE PHOTOS/VIDEOS TAKEN, MEASUREMENTS TAKEN, SITE CALIBRATED
21-Jul-2023 01:01:00 PM
Maintenance Log
DATA DOWNLOAD
TC SET,SURVEY SENT,DATA DOWNLOADED,TELEMETRY SENT REFLECTED IN FZ,SITE CLEARED
Yes
22-Aug-2023 12:15:00 PM
Maintenance Log
DATA DOWNLOAD
TC SET,DATA DOWNLOADED,TELEMETRY SENT NOT REFLECTED IN FZ,DESSICANT CHECKED,ANTENNA CHECKED,SITE CLEARED
Yes
04-Oct-2023 12:40:00 PM
Removal Log
REMOVAL
TRAFFIC CONTROL SENT, DATA DOWNLOADED, LIDOTT NOT LEVELED, TELEMETRY NOT SENT, CALIBRATION DONE, EQUIPMENT REMOVED, LOGGER TAG, PHOTOS AND VIDEOS BEFORE AND AFTER TAKEN.
Yes
874 Civica Infrastructure Inc. www.civi.ca
Civica Infrastructures Inc. Kawartha Lakes Flow Monitoring Report
Appendix - A June 03, 2024
Aggregate Data Station: 1-1
Level Date From
Date To
Days
Min (m)
Avg (m)
Max (m)
Count
Time of Min1
Time of Max1
Dec 05, 2021
Jun 22, 2022
153
0.03
0.04
0.10
43,432
Mon Feb 14, 2022 23:25
Sun Jun 12, 2022 09:35
Velocity Date From
Date To
Days
Min (m/s)
Avg (m/s)
Max (m/s)
Count
Time of Min1
Time of Max1
Dec 05, 2021
Jun 22, 2022
200
0.35
0.63
1.30
56,138
Tue Apr 19, 2022 22:55
Tue Mar 22, 2022 23:55
Flow Date From
Date To
Days
Min (L/s)
Avg (L/s)
Max (L/s)
Total Volume (1,000,000 L)
Count
Time of Min1
Time of Max1
Dec 05, 2021
Jun 22, 2022
152
1.88
6.06
40.75
78.30
43,103
Sun Feb 13, 2022 08:05
Sun Jun 12, 2022 09:40
Precipitation
1
Date From
Date To
Days
Min (mm)
Avg (mm)
Max (mm)
Sum (mm)
Count
Time of Min1
Time of Max1
Dec 05, 2021
Jun 22, 2022
190
0.00
0.01
5.75
320.95
54,054
Sun Dec 05, 2021 09:15
Sun Jun 12, 2022 08:25
Time of Min and Time of Max will be displayed by first occurrence
875 Civica Infrastructure Inc. www.civi.ca
Civica Infrastructures Inc. Kawartha Lakes Flow Monitoring Report
Appendix - A June 03, 2024
Sanitary Report Station: 1-1
1
Average Dry Weather Flow (L/s)
Average Dry Weather Flow (L/c/d)
Average Daily Minimum Dry Weather Flow (L/s)
Average Daily Peak Dry Weather Flow (L/s)
5.438
837.437
4.221
6.777
Peaking Factor
Groundwater Infiltration (L/s)1
Groundwater Infiltration (L/ha/d)
% of GWI in Average DWF
1.246
3.588
6,918.844
65.978
Groundwater infiltration (GWI) is assumed as 85% of the daily minimum flow averaged over the monitoring period
876 Civica Infrastructure Inc. www.civi.ca
Civica Infrastructures Inc. Kawartha Lakes Flow Monitoring Report
Appendix - A June 03, 2024
Data Chart Station: 1-1 Dec 05, 2021 – Dec 31, 2021
877 Civica Infrastructure Inc. www.civi.ca
Civica Infrastructures Inc. Kawartha Lakes Flow Monitoring Report
Appendix - A June 03, 2024
Data Chart Station: 1-1 Jan 01, 2022 – Jan 31, 2022
878 Civica Infrastructure Inc. www.civi.ca
Civica Infrastructures Inc. Kawartha Lakes Flow Monitoring Report
Appendix - A June 03, 2024
Data Chart Station: 1-1 Feb 01, 2022 – Feb 28, 2022
879 Civica Infrastructure Inc. www.civi.ca
Civica Infrastructures Inc. Kawartha Lakes Flow Monitoring Report
Appendix - A June 03, 2024
Data Chart Station: 1-1 Mar 01, 2022 – Mar 31, 2022
880 Civica Infrastructure Inc. www.civi.ca
Civica Infrastructures Inc. Kawartha Lakes Flow Monitoring Report
Appendix - A June 03, 2024
Data Chart Station: 1-1 Apr 01, 2022 – Apr 30, 2022
881 Civica Infrastructure Inc. www.civi.ca
Civica Infrastructures Inc. Kawartha Lakes Flow Monitoring Report
Appendix - A June 03, 2024
Data Chart Station: 1-1 May 01, 2022 – May 31, 2022
882 Civica Infrastructure Inc. www.civi.ca
Civica Infrastructures Inc. Kawartha Lakes Flow Monitoring Report
Appendix - A June 03, 2024
Data Chart Station: 1-1 Jun 01, 2022 – Jun 22, 2022
883 Civica Infrastructure Inc. www.civi.ca
Civica Infrastructures Inc. Kawartha Lakes Flow Monitoring Report
Appendix - A June 03, 2024
I/I Analysis Table
1 2
Event1
Total Precipitation (mm)
Duration (hours)
Peak Intensity Over Tc at Station (mm/hr)
Feb 16, 2022
18.00
12.67
3.80
Apr 13, 2022
17.25
28.67
10.50
May 26, 2022
20.25
27.50
17.20
Jun 06, 2022
30.00
32.42
11.20
Jun 11, 2022
41.50
25.08
Average
25.40
Maximum
41.50
1-1
Flow KPIs
Measured Storms
Station: 1-1 Measured Peak Flow (L/s)
Peak I/I Flow (L/s)
Peak I/I Rate (L/s/ha)
Volumetric Runoff Coefficient (CV%)
Peaking Factor (PF)
30.75
25.47
0.57
11.35 %
5.04
N/A 2 10.09
4.78
0.11
1.27 %
1.06
14.75
9.10
0.20
1.97 %
1.82
32.20
40.75
34.53
0.77
6.32 %
6.79
25.27
14.98
24.09
18.47
0.41
5.23 %
3.68
32.42
32.20
40.75
34.53
0.77
11.35 %
6.79
An event is a storm with a minimum volume of 15mm and a minimum inter-event dry period of 12 hours I/I event analysis unable to be completed due to missing flow monitoring data during event
884 Civica Infrastructure Inc. www.civi.ca
Civica Infrastructures Inc. Kawartha Lakes Flow Monitoring Report
Appendix - A June 03, 2024
I/I Analysis Graph Station: 1-1
885 Civica Infrastructure Inc. www.civi.ca
Civica Infrastructures Inc. Kawartha Lakes Flow Monitoring Report
Appendix - A June 03, 2024
Infiltration/Inflow Event Analysis Station: 1-1 Feb 16, 2022 11:00 – Feb 17, 2022 23:40, Total Precipitation: 18.00 mm (8,064,000.00 L) Station Details
Storm Details
Catchment Area
44.80 ha
Total Precipitation
18.00 mm (8,064,000.00 L)
Duration of Storm
12.67 hr
Time of Concentration (Tc) 1
20 min
Peak Precipitation Intensity Over Tc 2
3.80 mm/hr
Return Period over Tc 3
< 2 Yr
Measured Flow
I/I Flow
Time of Peak Measured Flow
Feb 17, 2022 06:40
Time of Peak I/I Flow (TD)
Feb 17, 2022 06:40
Estimated Dry Weather Flow at TD
5.28 L/s
Peak Measured Flow
30.75 L/s
Peak I/I Flow 4
25.47 L/s
Peak I/I Rate 5
0.57 L/s/ha
Peak Measured Depth
85.86 mm
Total I/I Flow Volume during event
915,205.50 L
Volumetric Coefficient (Cv%) 6
11.35%
Total Measured Flow Volume during Event
1,365,340.10 L
Peak I/I Coefficient 7
0.0546
Hourly Wet-Weather Peaking Factor 8
5.94
Instantaneous Wet-Weather Peaking Factor 9
6.09
1
Time of Concentration (Tc): The estimated time for the flow to travel from the furthest point in the upstream area to the point of monitoring, assume flow is travelling at 1.00 m/s Peak Precipitation Intensity Over Tc: The peak rainfall intensity for the duration of the storm with the time interval defined by time of concentration 3 Return Period over Tc: The estimated time to elapse before a storm of equal or greater intensity will likely occur again, based on design storm criteria 4 Peak I/I Flow: The greatest difference captured between measured flow and estimated dry weather flow, Peak I/I Flow = Maximum (Measured Flow – Estimated Dry Weather Flow) 5 Peak I/I Rate: A normalized peak I/I flow based on catchment area size, Peak I/I Rate = Peak I/I Flow / Catchment Area 6 Volumetric Coefficient (Cv%): The ratio of total I/I volume and total rainfall volume, Cv% = Total I/I Flow Volume / Total Precipitation Volume * 100% 7 Peak I/ I Coefficient: The ratio of peak I/I flow and peak rainfall intensity, Peak I/ I Coefficient = Peak I/I Flow / (Peak Rainfall Intensity over Tc * Catchment Area) 8 Hourly Wet‐Weather Peaking Factor: The ratio of peak hourly wet‐weather measured flow and average dry‐weather flow, Wet‐Weather Peaking Factor = Peak Hourly Wet‐Weather Measured Flow / Average Dry-Weather Flow 9 Instantaneous Wet‐Weather Peaking Factor: The ratio of peak wet‐weather measured flow and average dry‐weather flow, Wet‐Weather Peaking Factor = Peak Wet‐Weather Measured Flow / Average Dry-Weather Flow 2
886 Civica Infrastructure Inc. www.civi.ca
Civica Infrastructures Inc. Kawartha Lakes Flow Monitoring Report
Appendix - A June 03, 2024
I/I Analysis Graph Station: 1-1
887 Civica Infrastructure Inc. www.civi.ca
Civica Infrastructures Inc. Kawartha Lakes Flow Monitoring Report
Appendix - A June 03, 2024
Infiltration/Inflow Event Analysis Station: 1-1 May 26, 2022 07:30 – May 28, 2022 11:00, Total Precipitation: 20.25 mm (9,072,000.00 L) Station Details
Storm Details
Catchment Area
44.80 ha
Total Precipitation
20.25 mm (9,072,000.00 L)
Duration of Storm
27.50 hr
Time of Concentration (Tc) 1
20 min
Peak Precipitation Intensity Over Tc 2
17.20 mm/hr
Return Period over Tc 3
< 2 Yr
Measured Flow
I/I Flow
Time of Peak Measured Flow
May 27, 2022 19:20
Time of Peak I/I Flow (TD)
May 27, 2022 19:20
Estimated Dry Weather Flow at TD
5.30 L/s
Peak Measured Flow
10.09 L/s
Peak I/I Flow 4
4.78 L/s
Peak I/I Rate 5
0.11 L/s/ha
Peak Measured Depth
49.55 mm
Total I/I Flow Volume during event
115,557.30 L
Volumetric Coefficient (Cv%) 6
1.27%
Total Measured Flow Volume during Event
758,744.50 L
Peak I/I Coefficient 7
0.0022
Hourly Wet-Weather Peaking Factor 8
2.16
Instantaneous Wet-Weather Peaking Factor 9
2.23
1
Time of Concentration (Tc): The estimated time for the flow to travel from the furthest point in the upstream area to the point of monitoring, assume flow is travelling at 1.00 m/s Peak Precipitation Intensity Over Tc: The peak rainfall intensity for the duration of the storm with the time interval defined by time of concentration 3 Return Period over Tc: The estimated time to elapse before a storm of equal or greater intensity will likely occur again, based on design storm criteria 4 Peak I/I Flow: The greatest difference captured between measured flow and estimated dry weather flow, Peak I/I Flow = Maximum (Measured Flow – Estimated Dry Weather Flow) 5 Peak I/I Rate: A normalized peak I/I flow based on catchment area size, Peak I/I Rate = Peak I/I Flow / Catchment Area 6 Volumetric Coefficient (Cv%): The ratio of total I/I volume and total rainfall volume, Cv% = Total I/I Flow Volume / Total Precipitation Volume * 100% 7 Peak I/ I Coefficient: The ratio of peak I/I flow and peak rainfall intensity, Peak I/ I Coefficient = Peak I/I Flow / (Peak Rainfall Intensity over Tc * Catchment Area) 8 Hourly Wet‐Weather Peaking Factor: The ratio of peak hourly wet‐weather measured flow and average dry‐weather flow, Wet‐Weather Peaking Factor = Peak Hourly Wet‐Weather Measured Flow / Average Dry-Weather Flow 9 Instantaneous Wet‐Weather Peaking Factor: The ratio of peak wet‐weather measured flow and average dry‐weather flow, Wet‐Weather Peaking Factor = Peak Wet‐Weather Measured Flow / Average Dry-Weather Flow 2
888 Civica Infrastructure Inc. www.civi.ca
Civica Infrastructures Inc. Kawartha Lakes Flow Monitoring Report
Appendix - A June 03, 2024
I/I Analysis Graph Station: 1-1
889 Civica Infrastructure Inc. www.civi.ca
Civica Infrastructures Inc. Kawartha Lakes Flow Monitoring Report
Appendix - A June 03, 2024
Infiltration/Inflow Event Analysis Station: 1-1 Jun 05, 2022 18:20 – Jun 08, 2022 02:45, Total Precipitation: 30.00 mm (13,440,000.00 L) Station Details
Storm Details
Catchment Area
44.80 ha
Total Precipitation
30.00 mm (13,440,000.00 L)
Duration of Storm
32.42 hr
Time of Concentration (Tc) 1
20 min
Peak Precipitation Intensity Over Tc 2
11.20 mm/hr
Return Period over Tc 3
< 2 Yr
Measured Flow
I/I Flow
Time of Peak Measured Flow
Jun 07, 2022 09:55
Time of Peak I/I Flow (TD)
Jun 07, 2022 09:55
Estimated Dry Weather Flow at TD
5.64 L/s
Peak Measured Flow
14.75 L/s
Peak I/I Flow 4
9.10 L/s
Peak I/I Rate 5
0.20 L/s/ha
Peak Measured Depth
59.33 mm
Total I/I Flow Volume during event
264,578.30 L
Volumetric Coefficient (Cv%) 6
1.97%
Total Measured Flow Volume during Event
1,067,196.40 L
Peak I/I Coefficient 7
0.0065
Hourly Wet-Weather Peaking Factor 8
2.83
Instantaneous Wet-Weather Peaking Factor 9
2.94
1
Time of Concentration (Tc): The estimated time for the flow to travel from the furthest point in the upstream area to the point of monitoring, assume flow is travelling at 1.00 m/s Peak Precipitation Intensity Over Tc: The peak rainfall intensity for the duration of the storm with the time interval defined by time of concentration 3 Return Period over Tc: The estimated time to elapse before a storm of equal or greater intensity will likely occur again, based on design storm criteria 4 Peak I/I Flow: The greatest difference captured between measured flow and estimated dry weather flow, Peak I/I Flow = Maximum (Measured Flow – Estimated Dry Weather Flow) 5 Peak I/I Rate: A normalized peak I/I flow based on catchment area size, Peak I/I Rate = Peak I/I Flow / Catchment Area 6 Volumetric Coefficient (Cv%): The ratio of total I/I volume and total rainfall volume, Cv% = Total I/I Flow Volume / Total Precipitation Volume * 100% 7 Peak I/ I Coefficient: The ratio of peak I/I flow and peak rainfall intensity, Peak I/ I Coefficient = Peak I/I Flow / (Peak Rainfall Intensity over Tc * Catchment Area) 8 Hourly Wet‐Weather Peaking Factor: The ratio of peak hourly wet‐weather measured flow and average dry‐weather flow, Wet‐Weather Peaking Factor = Peak Hourly Wet‐Weather Measured Flow / Average Dry-Weather Flow 9 Instantaneous Wet‐Weather Peaking Factor: The ratio of peak wet‐weather measured flow and average dry‐weather flow, Wet‐Weather Peaking Factor = Peak Wet‐Weather Measured Flow / Average Dry-Weather Flow 2
890 Civica Infrastructure Inc. www.civi.ca
Civica Infrastructures Inc. Kawartha Lakes Flow Monitoring Report
Appendix - A June 03, 2024
I/I Analysis Graph Station: 1-1
891 Civica Infrastructure Inc. www.civi.ca
Civica Infrastructures Inc. Kawartha Lakes Flow Monitoring Report
Appendix - A June 03, 2024
Infiltration/Inflow Event Analysis Station: 1-1 Jun 11, 2022 01:55 – Jun 13, 2022 03:00, Total Precipitation: 41.50 mm (18,592,000.00 L) Station Details
Storm Details
Catchment Area
44.80 ha
Total Precipitation
41.50 mm (18,592,000.00 L)
Duration of Storm
25.08 hr
Time of Concentration (Tc) 1
20 min
Peak Precipitation Intensity Over Tc 2
32.20 mm/hr
Return Period over Tc 3
< 2 Yr
Measured Flow
I/I Flow
Time of Peak Measured Flow
Jun 12, 2022 09:40
Time of Peak I/I Flow (TD)
Jun 12, 2022 09:40
Estimated Dry Weather Flow at TD
6.22 L/s
Peak Measured Flow
40.75 L/s
Peak I/I Flow 4
34.53 L/s
Peak I/I Rate 5
0.77 L/s/ha
Peak Measured Depth
99.80 mm
Total I/I Flow Volume during event
1,175,413.60 L
Volumetric Coefficient (Cv%) 6
6.32%
Total Measured Flow Volume during Event
1,856,235.60 L
Peak I/I Coefficient 7
0.0086
Hourly Wet-Weather Peaking Factor 8
7.53
Instantaneous Wet-Weather Peaking Factor 9
8.01
1
Time of Concentration (Tc): The estimated time for the flow to travel from the furthest point in the upstream area to the point of monitoring, assume flow is travelling at 1.00 m/s Peak Precipitation Intensity Over Tc: The peak rainfall intensity for the duration of the storm with the time interval defined by time of concentration 3 Return Period over Tc: The estimated time to elapse before a storm of equal or greater intensity will likely occur again, based on design storm criteria 4 Peak I/I Flow: The greatest difference captured between measured flow and estimated dry weather flow, Peak I/I Flow = Maximum (Measured Flow – Estimated Dry Weather Flow) 5 Peak I/I Rate: A normalized peak I/I flow based on catchment area size, Peak I/I Rate = Peak I/I Flow / Catchment Area 6 Volumetric Coefficient (Cv%): The ratio of total I/I volume and total rainfall volume, Cv% = Total I/I Flow Volume / Total Precipitation Volume * 100% 7 Peak I/ I Coefficient: The ratio of peak I/I flow and peak rainfall intensity, Peak I/ I Coefficient = Peak I/I Flow / (Peak Rainfall Intensity over Tc * Catchment Area) 8 Hourly Wet‐Weather Peaking Factor: The ratio of peak hourly wet‐weather measured flow and average dry‐weather flow, Wet‐Weather Peaking Factor = Peak Hourly Wet‐Weather Measured Flow / Average Dry-Weather Flow 9 Instantaneous Wet‐Weather Peaking Factor: The ratio of peak wet‐weather measured flow and average dry‐weather flow, Wet‐Weather Peaking Factor = Peak Wet‐Weather Measured Flow / Average Dry-Weather Flow 2
892 Civica Infrastructure Inc. www.civi.ca
Civica Infrastructures Inc. Kawartha Lakes Flow Monitoring Report
Appendix - A June 03, 2024
Activity Log Station: 1-1 Date Time
Type
Purpose of Visit
Comment
Calibration Measurement
NOTE: SWAPPED AV SENSOR, PRESSURE DEPTH STILL READING 0. READING QUALITY WAS ALSO 0 SO IT MAY BE A LOGGER ISSUE. SURFACE COMBO GAVE READING. 14-Dec-2021 11:12:00 AM
Maintenance Log
CALIBRATION
20-Jan-2022 11:30:00 AM
Maintenance Log
CALIBRATION
08-Feb-2022 03:45:00 PM
03-Mar-2022 09:36:00 AM
17-Mar-2022 09:36:00 AM
Maintenance Log
Maintenance Log
Maintenance Log
Yes
CALIBRATION
Yes
calibration
Data downloaded Site calibrated Debris cleared Telemetry sent
Yes
Calibration
Data downloaded site calibrated logger not sending telemetry, will swap at next visit
Yes
Data downloaded Site calibrated Debris cleared Telemetry sent
Yes
Maintenance Log
Calibration
04-May-2022 08:19:00 AM
Maintenance Log
Calibration
Maintenance Log
Yes
Data downloaded Debris cleared Telemetry sent Ensured manual and sensor readings are satisfactory before leaving site Swapped Smart Depth sensor Swapped Logger New S/N 62692
27-Apr-2022 11:07:00 AM
24-May-2022 09:36:00 AM
DATA DOWNLOADED SITE CALIBRATED DEBRIS CLEARED SENT TELEMETRY Data downloaded Debris cleared Telemetry sent Ensured manual and sensor readings are satisfactory before leaving site
Yes DATA DOWNLOADED BATTERY SWAPPED BATTERY SWAPED SITE CALIBRATED TELEMETRY SENT OLD LOGGER SN= 62692 NEW LOGGER SN=65331
Calibration
893 Civica Infrastructure Inc. www.civi.ca
Yes
Civica Infrastructures Inc. Kawartha Lakes Flow Monitoring Report
Appendix - A June 03, 2024
Aggregate Data Station: 1-2
Level Date From
Date To
Days
Min (m)
Avg (m)
Max (m)
Count
Time of Min1
Time of Max1
Nov 19, 2021
Nov 04, 2022
351
0.02
0.06
0.16
99,619
Sun Aug 21, 2022 01:10
Tue Mar 22, 2022 23:55
Velocity Date From
Date To
Days
Min (m/s)
Avg (m/s)
Max (m/s)
Count
Time of Min1
Time of Max1
Nov 19, 2021
Nov 04, 2022
351
0.15
0.60
1.30
99,619
Fri Sep 16, 2022 14:45
Tue Mar 22, 2022 23:55
Flow Date From
Date To
Days
Min (L/s)
Avg (L/s)
Max (L/s)
Total Volume (1,000,000 L)
Count
Time of Min1
Time of Max1
Nov 19, 2021
Nov 04, 2022
351
1.11
5.65
24.30
168.87
99,616
Sun Aug 21, 2022 01:00
Sun Jun 12, 2022 09:40
Precipitation
1
Date From
Date To
Days
Min (mm)
Avg (mm)
Max (mm)
Sum (mm)
Count
Time of Min1
Time of Max1
Nov 19, 2021
Nov 04, 2022
341
0.00
0.01
9.75
667.95
97,596
Fri Nov 19, 2021 04:30
Mon Jul 25, 2022 00:00
Time of Min and Time of Max will be displayed by first occurrence
894 Civica Infrastructure Inc. www.civi.ca
Civica Infrastructures Inc. Kawartha Lakes Flow Monitoring Report
Appendix - A June 03, 2024
Sanitary Report Station: 1-2
1
Average Dry Weather Flow (L/s)
Average Dry Weather Flow (L/c/d)
Average Daily Minimum Dry Weather Flow (L/s)
Average Daily Peak Dry Weather Flow (L/s)
5.218
384.313
3.497
7.588
Peaking Factor
Groundwater Infiltration (L/s)1
Groundwater Infiltration (L/ha/d)
% of GWI in Average DWF
1.454
2.973
3,442.681
56.971
Groundwater infiltration (GWI) is assumed as 85% of the daily minimum flow averaged over the monitoring period
895 Civica Infrastructure Inc. www.civi.ca
Civica Infrastructures Inc. Kawartha Lakes Flow Monitoring Report
Appendix - A June 03, 2024
Data Chart Station: 1-2 Nov 19, 2021 – Nov 30, 2021
896 Civica Infrastructure Inc. www.civi.ca
Civica Infrastructures Inc. Kawartha Lakes Flow Monitoring Report
Appendix - A June 03, 2024
Data Chart Station: 1-2 Dec 01, 2021 – Dec 31, 2021
897 Civica Infrastructure Inc. www.civi.ca
Civica Infrastructures Inc. Kawartha Lakes Flow Monitoring Report
Appendix - A June 03, 2024
Data Chart Station: 1-2 Jan 01, 2022 – Jan 31, 2022
898 Civica Infrastructure Inc. www.civi.ca
Civica Infrastructures Inc. Kawartha Lakes Flow Monitoring Report
Appendix - A June 03, 2024
Data Chart Station: 1-2 Feb 01, 2022 – Feb 28, 2022
899 Civica Infrastructure Inc. www.civi.ca
Civica Infrastructures Inc. Kawartha Lakes Flow Monitoring Report
Appendix - A June 03, 2024
Data Chart Station: 1-2 Mar 01, 2022 – Mar 31, 2022
900 Civica Infrastructure Inc. www.civi.ca
Civica Infrastructures Inc. Kawartha Lakes Flow Monitoring Report
Appendix - A June 03, 2024
Data Chart Station: 1-2 Apr 01, 2022 – Apr 30, 2022
901 Civica Infrastructure Inc. www.civi.ca
Civica Infrastructures Inc. Kawartha Lakes Flow Monitoring Report
Appendix - A June 03, 2024
Data Chart Station: 1-2 May 01, 2022 – May 31, 2022
902 Civica Infrastructure Inc. www.civi.ca
Civica Infrastructures Inc. Kawartha Lakes Flow Monitoring Report
Appendix - A June 03, 2024
Data Chart Station: 1-2 Jun 01, 2022 – Jun 30, 2022
903 Civica Infrastructure Inc. www.civi.ca
Civica Infrastructures Inc. Kawartha Lakes Flow Monitoring Report
Appendix - A June 03, 2024
Data Chart Station: 1-2 Jul 01, 2022 – Jul 31, 2022
904 Civica Infrastructure Inc. www.civi.ca
Civica Infrastructures Inc. Kawartha Lakes Flow Monitoring Report
Appendix - A June 03, 2024
Data Chart Station: 1-2 Aug 01, 2022 – Aug 31, 2022
905 Civica Infrastructure Inc. www.civi.ca
Civica Infrastructures Inc. Kawartha Lakes Flow Monitoring Report
Appendix - A June 03, 2024
Data Chart Station: 1-2 Sep 01, 2022 – Sep 30, 2022
906 Civica Infrastructure Inc. www.civi.ca
Civica Infrastructures Inc. Kawartha Lakes Flow Monitoring Report
Appendix - A June 03, 2024
Data Chart Station: 1-2 Oct 01, 2022 – Oct 31, 2022
907 Civica Infrastructure Inc. www.civi.ca
Civica Infrastructures Inc. Kawartha Lakes Flow Monitoring Report
Appendix - A June 03, 2024
Data Chart Station: 1-2 Nov 01, 2022 – Nov 04, 2022
908 Civica Infrastructure Inc. www.civi.ca
Civica Infrastructures Inc. Kawartha Lakes Flow Monitoring Report
Appendix - A June 03, 2024
I/I Analysis Table
1
Event1
Total Precipitation (mm)
Duration (hours)
Peak Intensity Over Tc at Station (mm/hr)
Feb 16, 2022
18.00
12.67
Apr 13, 2022
17.25
May 26, 2022
1-2 Measured Peak Flow (L/s)
Peak I/I Flow (L/s)
Peak I/I Rate (L/s/ha)
Volumetric Runoff Coefficient (CV%)
Peaking Factor (PF)
3.60
18.02
13.49
0.18
4.20 %
2.94
28.67
10.20
9.20
1.82
0.02
0.10 %
0.29
20.25
27.50
14.40
7.70
1.99
0.03
0.10 %
0.56
Jun 06, 2022
30.00
32.42
10.20
8.44
4.16
0.06
0.26 %
1.14
Jun 11, 2022
41.50
25.08
27.00
24.30
17.90
0.24
1.85 %
3.36
Jul 12, 2022
15.50
7.75
25.80
6.31
0.23
0.00
0.00 %
0.05
Jul 18, 2022
21.50
43.25
1.20
12.59
8.03
0.11
1.48 %
1.82
Aug 17, 2022
17.50
1.83
35.40
7.27
3.41
0.05
0.06 %
1.18
Aug 21, 2022
17.50
30.50
12.00
6.37
2.71
0.04
0.44 %
0.79
Aug 25, 2022
16.25
8.58
25.80
11.46
6.29
0.08
0.74 %
1.70
Aug 29, 2022
29.00
2.50
41.40
16.81
12.94
0.17
0.86 %
3.51
Sep 12, 2022
21.75
25.08
9.60
7.68
1.79
0.02
0.18 %
0.41
Sep 18, 2022
24.50
5.58
18.00
12.91
6.10
0.08
0.81 %
1.15
Oct 12, 2022
20.75
15.25
8.40
7.84
2.42
0.03
0.37 %
0.58
Average
22.23
19.05
17.36
11.21
5.95
0.08
0.82 %
1.39
Maximum
41.50
43.25
41.40
24.30
17.90
0.24
4.20 %
3.51
Flow KPIs
Measured Storms
Station: 1-2
An event is a storm with a minimum volume of 15mm and a minimum inter-event dry period of 12 hours
909 Civica Infrastructure Inc. www.civi.ca
Civica Infrastructures Inc. Kawartha Lakes Flow Monitoring Report
Appendix - A June 03, 2024
I/I Analysis Graph Station: 1-2
910 Civica Infrastructure Inc. www.civi.ca
Civica Infrastructures Inc. Kawartha Lakes Flow Monitoring Report
Appendix - A June 03, 2024
Infiltration/Inflow Event Analysis Station: 1-2 Feb 16, 2022 11:00 – Feb 17, 2022 23:40, Total Precipitation: 18.00 mm (13,428,000.00 L) Station Details
Storm Details
Catchment Area
74.60 ha
Total Precipitation
18.00 mm (13,428,000.00 L)
Duration of Storm
12.67 hr
Time of Concentration (Tc) 1
25 min
Peak Precipitation Intensity Over Tc 2
3.60 mm/hr
Return Period over Tc 3
< 2 Yr
Measured Flow
I/I Flow
Time of Peak Measured Flow
Feb 17, 2022 07:30
Time of Peak I/I Flow (TD)
Feb 17, 2022 07:10
Estimated Dry Weather Flow at TD
4.40 L/s
Peak Measured Flow
18.02 L/s
Peak I/I Flow 4
13.49 L/s
Peak I/I Rate 5
0.18 L/s/ha
Peak Measured Depth
108.09 mm
Total I/I Flow Volume during event
564,523.90 L
Volumetric Coefficient (Cv%) 6
4.20%
Total Measured Flow Volume during Event
972,686.60 L
Peak I/I Coefficient 7
0.0181
Hourly Wet-Weather Peaking Factor 8
3.89
Instantaneous Wet-Weather Peaking Factor 9
3.93
1
Time of Concentration (Tc): The estimated time for the flow to travel from the furthest point in the upstream area to the point of monitoring, assume flow is travelling at 1.00 m/s Peak Precipitation Intensity Over Tc: The peak rainfall intensity for the duration of the storm with the time interval defined by time of concentration 3 Return Period over Tc: The estimated time to elapse before a storm of equal or greater intensity will likely occur again, based on design storm criteria 4 Peak I/I Flow: The greatest difference captured between measured flow and estimated dry weather flow, Peak I/I Flow = Maximum (Measured Flow – Estimated Dry Weather Flow) 5 Peak I/I Rate: A normalized peak I/I flow based on catchment area size, Peak I/I Rate = Peak I/I Flow / Catchment Area 6 Volumetric Coefficient (Cv%): The ratio of total I/I volume and total rainfall volume, Cv% = Total I/I Flow Volume / Total Precipitation Volume * 100% 7 Peak I/ I Coefficient: The ratio of peak I/I flow and peak rainfall intensity, Peak I/ I Coefficient = Peak I/I Flow / (Peak Rainfall Intensity over Tc * Catchment Area) 8 Hourly Wet‐Weather Peaking Factor: The ratio of peak hourly wet‐weather measured flow and average dry‐weather flow, Wet‐Weather Peaking Factor = Peak Hourly Wet‐Weather Measured Flow / Average Dry-Weather Flow 9 Instantaneous Wet‐Weather Peaking Factor: The ratio of peak wet‐weather measured flow and average dry‐weather flow, Wet‐Weather Peaking Factor = Peak Wet‐Weather Measured Flow / Average Dry-Weather Flow 2
911 Civica Infrastructure Inc. www.civi.ca
Civica Infrastructures Inc. Kawartha Lakes Flow Monitoring Report
Appendix - A June 03, 2024
I/I Analysis Graph Station: 1-2
912 Civica Infrastructure Inc. www.civi.ca
Civica Infrastructures Inc. Kawartha Lakes Flow Monitoring Report
Appendix - A June 03, 2024
Infiltration/Inflow Event Analysis Station: 1-2 Apr 12, 2022 17:25 – Apr 14, 2022 22:05, Total Precipitation: 17.25 mm (12,868,500.00 L) Station Details
Storm Details
Catchment Area
74.60 ha
Total Precipitation
17.25 mm (12,868,500.00 L)
Duration of Storm
28.67 hr
Time of Concentration (Tc) 1
25 min
Peak Precipitation Intensity Over Tc 2
10.20 mm/hr
Return Period over Tc 3
< 2 Yr
Measured Flow
I/I Flow
Time of Peak Measured Flow
Apr 13, 2022 06:25
Time of Peak I/I Flow (TD)
Apr 13, 2022 06:25
Estimated Dry Weather Flow at TD
7.38 L/s
Peak Measured Flow
9.20 L/s
Peak I/I Flow 4
1.82 L/s
Peak I/I Rate 5
0.02 L/s/ha
Peak Measured Depth
97.38 mm
Total I/I Flow Volume during event
12,372.30 L
Volumetric Coefficient (Cv%) 6
0.10%
Total Measured Flow Volume during Event
921,760.10 L
Peak I/I Coefficient 7
0.0009
Hourly Wet-Weather Peaking Factor 8
1.31
Instantaneous Wet-Weather Peaking Factor 9
1.48
1
Time of Concentration (Tc): The estimated time for the flow to travel from the furthest point in the upstream area to the point of monitoring, assume flow is travelling at 1.00 m/s Peak Precipitation Intensity Over Tc: The peak rainfall intensity for the duration of the storm with the time interval defined by time of concentration 3 Return Period over Tc: The estimated time to elapse before a storm of equal or greater intensity will likely occur again, based on design storm criteria 4 Peak I/I Flow: The greatest difference captured between measured flow and estimated dry weather flow, Peak I/I Flow = Maximum (Measured Flow – Estimated Dry Weather Flow) 5 Peak I/I Rate: A normalized peak I/I flow based on catchment area size, Peak I/I Rate = Peak I/I Flow / Catchment Area 6 Volumetric Coefficient (Cv%): The ratio of total I/I volume and total rainfall volume, Cv% = Total I/I Flow Volume / Total Precipitation Volume * 100% 7 Peak I/ I Coefficient: The ratio of peak I/I flow and peak rainfall intensity, Peak I/ I Coefficient = Peak I/I Flow / (Peak Rainfall Intensity over Tc * Catchment Area) 8 Hourly Wet‐Weather Peaking Factor: The ratio of peak hourly wet‐weather measured flow and average dry‐weather flow, Wet‐Weather Peaking Factor = Peak Hourly Wet‐Weather Measured Flow / Average Dry-Weather Flow 9 Instantaneous Wet‐Weather Peaking Factor: The ratio of peak wet‐weather measured flow and average dry‐weather flow, Wet‐Weather Peaking Factor = Peak Wet‐Weather Measured Flow / Average Dry-Weather Flow 2
913 Civica Infrastructure Inc. www.civi.ca
Civica Infrastructures Inc. Kawartha Lakes Flow Monitoring Report
Appendix - A June 03, 2024
I/I Analysis Graph Station: 1-2
914 Civica Infrastructure Inc. www.civi.ca
Civica Infrastructures Inc. Kawartha Lakes Flow Monitoring Report
Appendix - A June 03, 2024
Infiltration/Inflow Event Analysis Station: 1-2 May 26, 2022 07:30 – May 28, 2022 11:00, Total Precipitation: 20.25 mm (15,106,500.00 L) Station Details
Storm Details
Catchment Area
74.60 ha
Total Precipitation
20.25 mm (15,106,500.00 L)
Duration of Storm
27.50 hr
Time of Concentration (Tc) 1
25 min
Peak Precipitation Intensity Over Tc 2
14.40 mm/hr
Return Period over Tc 3
< 2 Yr
Measured Flow
I/I Flow
Time of Peak Measured Flow
May 28, 2022 07:55
Time of Peak I/I Flow (TD)
May 28, 2022 07:55
Estimated Dry Weather Flow at TD
5.72 L/s
Peak Measured Flow
7.70 L/s
Peak I/I Flow 4
1.99 L/s
Peak I/I Rate 5
0.03 L/s/ha
Peak Measured Depth
105.50 mm
Total I/I Flow Volume during event
14,701.70 L
Volumetric Coefficient (Cv%) 6
0.10%
Total Measured Flow Volume during Event
518,686.60 L
Peak I/I Coefficient 7
0.0007
Hourly Wet-Weather Peaking Factor 8
1.85
Instantaneous Wet-Weather Peaking Factor 9
2.18
1
Time of Concentration (Tc): The estimated time for the flow to travel from the furthest point in the upstream area to the point of monitoring, assume flow is travelling at 1.00 m/s Peak Precipitation Intensity Over Tc: The peak rainfall intensity for the duration of the storm with the time interval defined by time of concentration 3 Return Period over Tc: The estimated time to elapse before a storm of equal or greater intensity will likely occur again, based on design storm criteria 4 Peak I/I Flow: The greatest difference captured between measured flow and estimated dry weather flow, Peak I/I Flow = Maximum (Measured Flow – Estimated Dry Weather Flow) 5 Peak I/I Rate: A normalized peak I/I flow based on catchment area size, Peak I/I Rate = Peak I/I Flow / Catchment Area 6 Volumetric Coefficient (Cv%): The ratio of total I/I volume and total rainfall volume, Cv% = Total I/I Flow Volume / Total Precipitation Volume * 100% 7 Peak I/ I Coefficient: The ratio of peak I/I flow and peak rainfall intensity, Peak I/ I Coefficient = Peak I/I Flow / (Peak Rainfall Intensity over Tc * Catchment Area) 8 Hourly Wet‐Weather Peaking Factor: The ratio of peak hourly wet‐weather measured flow and average dry‐weather flow, Wet‐Weather Peaking Factor = Peak Hourly Wet‐Weather Measured Flow / Average Dry-Weather Flow 9 Instantaneous Wet‐Weather Peaking Factor: The ratio of peak wet‐weather measured flow and average dry‐weather flow, Wet‐Weather Peaking Factor = Peak Wet‐Weather Measured Flow / Average Dry-Weather Flow 2
915 Civica Infrastructure Inc. www.civi.ca
Civica Infrastructures Inc. Kawartha Lakes Flow Monitoring Report
Appendix - A June 03, 2024
I/I Analysis Graph Station: 1-2
916 Civica Infrastructure Inc. www.civi.ca
Civica Infrastructures Inc. Kawartha Lakes Flow Monitoring Report
Appendix - A June 03, 2024
Infiltration/Inflow Event Analysis Station: 1-2 Jun 05, 2022 18:20 – Jun 08, 2022 02:45, Total Precipitation: 30.00 mm (22,380,000.00 L) Station Details
Storm Details
Catchment Area
74.60 ha
Total Precipitation
30.00 mm (22,380,000.00 L)
Duration of Storm
32.42 hr
Time of Concentration (Tc) 1
25 min
Peak Precipitation Intensity Over Tc 2
10.20 mm/hr
Return Period over Tc 3
< 2 Yr
Measured Flow
I/I Flow
Time of Peak Measured Flow
Jun 07, 2022 10:10
Time of Peak I/I Flow (TD)
Jun 07, 2022 11:05
Estimated Dry Weather Flow at TD
4.27 L/s
Peak Measured Flow
8.44 L/s
Peak I/I Flow 4
4.16 L/s
Peak I/I Rate 5
0.06 L/s/ha
Peak Measured Depth
98.88 mm
Total I/I Flow Volume during event
57,590.10 L
Volumetric Coefficient (Cv%) 6
0.26%
Total Measured Flow Volume during Event
641,661.20 L
Peak I/I Coefficient 7
0.0020
Hourly Wet-Weather Peaking Factor 8
2.23
Instantaneous Wet-Weather Peaking Factor 9
2.31
1
Time of Concentration (Tc): The estimated time for the flow to travel from the furthest point in the upstream area to the point of monitoring, assume flow is travelling at 1.00 m/s Peak Precipitation Intensity Over Tc: The peak rainfall intensity for the duration of the storm with the time interval defined by time of concentration 3 Return Period over Tc: The estimated time to elapse before a storm of equal or greater intensity will likely occur again, based on design storm criteria 4 Peak I/I Flow: The greatest difference captured between measured flow and estimated dry weather flow, Peak I/I Flow = Maximum (Measured Flow – Estimated Dry Weather Flow) 5 Peak I/I Rate: A normalized peak I/I flow based on catchment area size, Peak I/I Rate = Peak I/I Flow / Catchment Area 6 Volumetric Coefficient (Cv%): The ratio of total I/I volume and total rainfall volume, Cv% = Total I/I Flow Volume / Total Precipitation Volume * 100% 7 Peak I/ I Coefficient: The ratio of peak I/I flow and peak rainfall intensity, Peak I/ I Coefficient = Peak I/I Flow / (Peak Rainfall Intensity over Tc * Catchment Area) 8 Hourly Wet‐Weather Peaking Factor: The ratio of peak hourly wet‐weather measured flow and average dry‐weather flow, Wet‐Weather Peaking Factor = Peak Hourly Wet‐Weather Measured Flow / Average Dry-Weather Flow 9 Instantaneous Wet‐Weather Peaking Factor: The ratio of peak wet‐weather measured flow and average dry‐weather flow, Wet‐Weather Peaking Factor = Peak Wet‐Weather Measured Flow / Average Dry-Weather Flow 2
917 Civica Infrastructure Inc. www.civi.ca
Civica Infrastructures Inc. Kawartha Lakes Flow Monitoring Report
Appendix - A June 03, 2024
I/I Analysis Graph Station: 1-2
918 Civica Infrastructure Inc. www.civi.ca
Civica Infrastructures Inc. Kawartha Lakes Flow Monitoring Report
Appendix - A June 03, 2024
Infiltration/Inflow Event Analysis Station: 1-2 Jun 11, 2022 01:55 – Jun 13, 2022 03:00, Total Precipitation: 41.50 mm (30,959,000.00 L) Station Details
Storm Details
Catchment Area
74.60 ha
Total Precipitation
41.50 mm (30,959,000.00 L)
Duration of Storm
25.08 hr
Time of Concentration (Tc) 1
25 min
Peak Precipitation Intensity Over Tc 2
27.00 mm/hr
Return Period over Tc 3
< 2 Yr
Measured Flow
I/I Flow
Time of Peak Measured Flow
Jun 12, 2022 09:40
Time of Peak I/I Flow (TD)
Jun 12, 2022 09:45
Estimated Dry Weather Flow at TD
6.40 L/s
Peak Measured Flow
24.30 L/s
Peak I/I Flow 4
17.90 L/s
Peak I/I Rate 5
0.24 L/s/ha
Peak Measured Depth
122.51 mm
Total I/I Flow Volume during event
573,262.70 L
Volumetric Coefficient (Cv%) 6
1.85%
Total Measured Flow Volume during Event
1,286,598.00 L
Peak I/I Coefficient 7
0.0032
Hourly Wet-Weather Peaking Factor 8
3.97
Instantaneous Wet-Weather Peaking Factor 9
4.56
1
Time of Concentration (Tc): The estimated time for the flow to travel from the furthest point in the upstream area to the point of monitoring, assume flow is travelling at 1.00 m/s Peak Precipitation Intensity Over Tc: The peak rainfall intensity for the duration of the storm with the time interval defined by time of concentration 3 Return Period over Tc: The estimated time to elapse before a storm of equal or greater intensity will likely occur again, based on design storm criteria 4 Peak I/I Flow: The greatest difference captured between measured flow and estimated dry weather flow, Peak I/I Flow = Maximum (Measured Flow – Estimated Dry Weather Flow) 5 Peak I/I Rate: A normalized peak I/I flow based on catchment area size, Peak I/I Rate = Peak I/I Flow / Catchment Area 6 Volumetric Coefficient (Cv%): The ratio of total I/I volume and total rainfall volume, Cv% = Total I/I Flow Volume / Total Precipitation Volume * 100% 7 Peak I/ I Coefficient: The ratio of peak I/I flow and peak rainfall intensity, Peak I/ I Coefficient = Peak I/I Flow / (Peak Rainfall Intensity over Tc * Catchment Area) 8 Hourly Wet‐Weather Peaking Factor: The ratio of peak hourly wet‐weather measured flow and average dry‐weather flow, Wet‐Weather Peaking Factor = Peak Hourly Wet‐Weather Measured Flow / Average Dry-Weather Flow 9 Instantaneous Wet‐Weather Peaking Factor: The ratio of peak wet‐weather measured flow and average dry‐weather flow, Wet‐Weather Peaking Factor = Peak Wet‐Weather Measured Flow / Average Dry-Weather Flow 2
919 Civica Infrastructure Inc. www.civi.ca
Civica Infrastructures Inc. Kawartha Lakes Flow Monitoring Report
Appendix - A June 03, 2024
I/I Analysis Graph Station: 1-2
920 Civica Infrastructure Inc. www.civi.ca
Civica Infrastructures Inc. Kawartha Lakes Flow Monitoring Report
Appendix - A June 03, 2024
Infiltration/Inflow Event Analysis Station: 1-2 Jul 11, 2022 14:25 – Jul 12, 2022 22:10, Total Precipitation: 15.50 mm (11,563,000.00 L) Station Details
Storm Details
Catchment Area
74.60 ha
Total Precipitation
15.50 mm (11,563,000.00 L)
Duration of Storm
7.75 hr
Time of Concentration (Tc) 1
25 min
Peak Precipitation Intensity Over Tc 2
25.80 mm/hr
Return Period over Tc 3
< 2 Yr
Measured Flow
I/I Flow
Time of Peak Measured Flow
Jul 12, 2022 06:55
Time of Peak I/I Flow (TD)
Jul 12, 2022 11:35
Estimated Dry Weather Flow at TD
5.60 L/s
Peak Measured Flow
6.31 L/s
Peak I/I Flow 4
0.23 L/s
Peak I/I Rate 5
0.00 L/s/ha
Peak Measured Depth
99.38 mm
Total I/I Flow Volume during event
165.00 L
Volumetric Coefficient (Cv%) 6
0.00%
Total Measured Flow Volume during Event
327,911.70 L
Peak I/I Coefficient 7
0.0000
Hourly Wet-Weather Peaking Factor 8
1.31
Instantaneous Wet-Weather Peaking Factor 9
1.38
1
Time of Concentration (Tc): The estimated time for the flow to travel from the furthest point in the upstream area to the point of monitoring, assume flow is travelling at 1.00 m/s Peak Precipitation Intensity Over Tc: The peak rainfall intensity for the duration of the storm with the time interval defined by time of concentration 3 Return Period over Tc: The estimated time to elapse before a storm of equal or greater intensity will likely occur again, based on design storm criteria 4 Peak I/I Flow: The greatest difference captured between measured flow and estimated dry weather flow, Peak I/I Flow = Maximum (Measured Flow – Estimated Dry Weather Flow) 5 Peak I/I Rate: A normalized peak I/I flow based on catchment area size, Peak I/I Rate = Peak I/I Flow / Catchment Area 6 Volumetric Coefficient (Cv%): The ratio of total I/I volume and total rainfall volume, Cv% = Total I/I Flow Volume / Total Precipitation Volume * 100% 7 Peak I/ I Coefficient: The ratio of peak I/I flow and peak rainfall intensity, Peak I/ I Coefficient = Peak I/I Flow / (Peak Rainfall Intensity over Tc * Catchment Area) 8 Hourly Wet‐Weather Peaking Factor: The ratio of peak hourly wet‐weather measured flow and average dry‐weather flow, Wet‐Weather Peaking Factor = Peak Hourly Wet‐Weather Measured Flow / Average Dry-Weather Flow 9 Instantaneous Wet‐Weather Peaking Factor: The ratio of peak wet‐weather measured flow and average dry‐weather flow, Wet‐Weather Peaking Factor = Peak Wet‐Weather Measured Flow / Average Dry-Weather Flow 2
921 Civica Infrastructure Inc. www.civi.ca
Civica Infrastructures Inc. Kawartha Lakes Flow Monitoring Report
Appendix - A June 03, 2024
I/I Analysis Graph Station: 1-2
922 Civica Infrastructure Inc. www.civi.ca
Civica Infrastructures Inc. Kawartha Lakes Flow Monitoring Report
Appendix - A June 03, 2024
Infiltration/Inflow Event Analysis Station: 1-2 Jul 17, 2022 16:10 – Jul 20, 2022 11:25, Total Precipitation: 21.50 mm (16,039,000.00 L) Station Details
Storm Details
Catchment Area
74.60 ha
Total Precipitation
21.50 mm (16,039,000.00 L)
Duration of Storm
43.25 hr
Time of Concentration (Tc) 1
25 min
Peak Precipitation Intensity Over Tc 2
1.20 mm/hr
Return Period over Tc 3
< 2 Yr
Measured Flow
I/I Flow
Time of Peak Measured Flow
Jul 18, 2022 11:50
Time of Peak I/I Flow (TD)
Jul 18, 2022 12:00
Estimated Dry Weather Flow at TD
4.57 L/s
Peak Measured Flow
12.59 L/s
Peak I/I Flow 4
8.03 L/s
Peak I/I Rate 5
0.11 L/s/ha
Peak Measured Depth
107.77 mm
Total I/I Flow Volume during event
237,328.50 L
Volumetric Coefficient (Cv%) 6
1.48%
Total Measured Flow Volume during Event
1,115,355.50 L
Peak I/I Coefficient 7
0.0323
Hourly Wet-Weather Peaking Factor 8
2.68
Instantaneous Wet-Weather Peaking Factor 9
2.86
1
Time of Concentration (Tc): The estimated time for the flow to travel from the furthest point in the upstream area to the point of monitoring, assume flow is travelling at 1.00 m/s Peak Precipitation Intensity Over Tc: The peak rainfall intensity for the duration of the storm with the time interval defined by time of concentration 3 Return Period over Tc: The estimated time to elapse before a storm of equal or greater intensity will likely occur again, based on design storm criteria 4 Peak I/I Flow: The greatest difference captured between measured flow and estimated dry weather flow, Peak I/I Flow = Maximum (Measured Flow – Estimated Dry Weather Flow) 5 Peak I/I Rate: A normalized peak I/I flow based on catchment area size, Peak I/I Rate = Peak I/I Flow / Catchment Area 6 Volumetric Coefficient (Cv%): The ratio of total I/I volume and total rainfall volume, Cv% = Total I/I Flow Volume / Total Precipitation Volume * 100% 7 Peak I/ I Coefficient: The ratio of peak I/I flow and peak rainfall intensity, Peak I/ I Coefficient = Peak I/I Flow / (Peak Rainfall Intensity over Tc * Catchment Area) 8 Hourly Wet‐Weather Peaking Factor: The ratio of peak hourly wet‐weather measured flow and average dry‐weather flow, Wet‐Weather Peaking Factor = Peak Hourly Wet‐Weather Measured Flow / Average Dry-Weather Flow 9 Instantaneous Wet‐Weather Peaking Factor: The ratio of peak wet‐weather measured flow and average dry‐weather flow, Wet‐Weather Peaking Factor = Peak Wet‐Weather Measured Flow / Average Dry-Weather Flow 2
923 Civica Infrastructure Inc. www.civi.ca
Civica Infrastructures Inc. Kawartha Lakes Flow Monitoring Report
Appendix - A June 03, 2024
I/I Analysis Graph Station: 1-2
924 Civica Infrastructure Inc. www.civi.ca
Civica Infrastructures Inc. Kawartha Lakes Flow Monitoring Report
Appendix - A June 03, 2024
Infiltration/Inflow Event Analysis Station: 1-2 Aug 17, 2022 03:20 – Aug 18, 2022 05:10, Total Precipitation: 17.50 mm (13,055,000.00 L) Station Details
Storm Details
Catchment Area
74.60 ha
Total Precipitation
17.50 mm (13,055,000.00 L)
Duration of Storm
1.83 hr
Time of Concentration (Tc) 1
25 min
Peak Precipitation Intensity Over Tc 2
35.40 mm/hr
Return Period over Tc 3
< 2 Yr
Measured Flow
I/I Flow
Time of Peak Measured Flow
Aug 17, 2022 15:35
Time of Peak I/I Flow (TD)
Aug 17, 2022 15:35
Estimated Dry Weather Flow at TD
3.86 L/s
Peak Measured Flow
7.27 L/s
Peak I/I Flow 4
3.41 L/s
Peak I/I Rate 5
0.05 L/s/ha
Peak Measured Depth
93.71 mm
Total I/I Flow Volume during event
7,592.20 L
Volumetric Coefficient (Cv%) 6
0.06%
Total Measured Flow Volume during Event
152,307.20 L
Peak I/I Coefficient 7
0.0005
Hourly Wet-Weather Peaking Factor 8
1.93
Instantaneous Wet-Weather Peaking Factor 9
2.52
1
Time of Concentration (Tc): The estimated time for the flow to travel from the furthest point in the upstream area to the point of monitoring, assume flow is travelling at 1.00 m/s Peak Precipitation Intensity Over Tc: The peak rainfall intensity for the duration of the storm with the time interval defined by time of concentration 3 Return Period over Tc: The estimated time to elapse before a storm of equal or greater intensity will likely occur again, based on design storm criteria 4 Peak I/I Flow: The greatest difference captured between measured flow and estimated dry weather flow, Peak I/I Flow = Maximum (Measured Flow – Estimated Dry Weather Flow) 5 Peak I/I Rate: A normalized peak I/I flow based on catchment area size, Peak I/I Rate = Peak I/I Flow / Catchment Area 6 Volumetric Coefficient (Cv%): The ratio of total I/I volume and total rainfall volume, Cv% = Total I/I Flow Volume / Total Precipitation Volume * 100% 7 Peak I/ I Coefficient: The ratio of peak I/I flow and peak rainfall intensity, Peak I/ I Coefficient = Peak I/I Flow / (Peak Rainfall Intensity over Tc * Catchment Area) 8 Hourly Wet‐Weather Peaking Factor: The ratio of peak hourly wet‐weather measured flow and average dry‐weather flow, Wet‐Weather Peaking Factor = Peak Hourly Wet‐Weather Measured Flow / Average Dry-Weather Flow 9 Instantaneous Wet‐Weather Peaking Factor: The ratio of peak wet‐weather measured flow and average dry‐weather flow, Wet‐Weather Peaking Factor = Peak Wet‐Weather Measured Flow / Average Dry-Weather Flow 2
925 Civica Infrastructure Inc. www.civi.ca
Civica Infrastructures Inc. Kawartha Lakes Flow Monitoring Report
Appendix - A June 03, 2024
I/I Analysis Graph Station: 1-2
926 Civica Infrastructure Inc. www.civi.ca
Civica Infrastructures Inc. Kawartha Lakes Flow Monitoring Report
Appendix - A June 03, 2024
Infiltration/Inflow Event Analysis Station: 1-2 Aug 21, 2022 09:50 – Aug 23, 2022 16:20, Total Precipitation: 17.50 mm (13,055,000.00 L) Station Details
Storm Details
Catchment Area
74.60 ha
Total Precipitation
17.50 mm (13,055,000.00 L)
Duration of Storm
30.50 hr
Time of Concentration (Tc) 1
25 min
Peak Precipitation Intensity Over Tc 2
12.00 mm/hr
Return Period over Tc 3
< 2 Yr
Measured Flow
I/I Flow
Time of Peak Measured Flow
Aug 22, 2022 13:25
Time of Peak I/I Flow (TD)
Aug 22, 2022 13:25
Estimated Dry Weather Flow at TD
3.66 L/s
Peak Measured Flow
6.37 L/s
Peak I/I Flow 4
2.71 L/s
Peak I/I Rate 5
0.04 L/s/ha
Peak Measured Depth
104.91 mm
Total I/I Flow Volume during event
57,166.30 L
Volumetric Coefficient (Cv%) 6
0.44%
Total Measured Flow Volume during Event
583,651.40 L
Peak I/I Coefficient 7
0.0011
Hourly Wet-Weather Peaking Factor 8
1.74
Instantaneous Wet-Weather Peaking Factor 9
1.85
1
Time of Concentration (Tc): The estimated time for the flow to travel from the furthest point in the upstream area to the point of monitoring, assume flow is travelling at 1.00 m/s Peak Precipitation Intensity Over Tc: The peak rainfall intensity for the duration of the storm with the time interval defined by time of concentration 3 Return Period over Tc: The estimated time to elapse before a storm of equal or greater intensity will likely occur again, based on design storm criteria 4 Peak I/I Flow: The greatest difference captured between measured flow and estimated dry weather flow, Peak I/I Flow = Maximum (Measured Flow – Estimated Dry Weather Flow) 5 Peak I/I Rate: A normalized peak I/I flow based on catchment area size, Peak I/I Rate = Peak I/I Flow / Catchment Area 6 Volumetric Coefficient (Cv%): The ratio of total I/I volume and total rainfall volume, Cv% = Total I/I Flow Volume / Total Precipitation Volume * 100% 7 Peak I/ I Coefficient: The ratio of peak I/I flow and peak rainfall intensity, Peak I/ I Coefficient = Peak I/I Flow / (Peak Rainfall Intensity over Tc * Catchment Area) 8 Hourly Wet‐Weather Peaking Factor: The ratio of peak hourly wet‐weather measured flow and average dry‐weather flow, Wet‐Weather Peaking Factor = Peak Hourly Wet‐Weather Measured Flow / Average Dry-Weather Flow 9 Instantaneous Wet‐Weather Peaking Factor: The ratio of peak wet‐weather measured flow and average dry‐weather flow, Wet‐Weather Peaking Factor = Peak Wet‐Weather Measured Flow / Average Dry-Weather Flow 2
927 Civica Infrastructure Inc. www.civi.ca
Civica Infrastructures Inc. Kawartha Lakes Flow Monitoring Report
Appendix - A June 03, 2024
I/I Analysis Graph Station: 1-2
928 Civica Infrastructure Inc. www.civi.ca
Civica Infrastructures Inc. Kawartha Lakes Flow Monitoring Report
Appendix - A June 03, 2024
Infiltration/Inflow Event Analysis Station: 1-2 Aug 25, 2022 01:30 – Aug 26, 2022 10:05, Total Precipitation: 16.25 mm (12,122,500.00 L) Station Details
Storm Details
Catchment Area
74.60 ha
Total Precipitation
16.25 mm (12,122,500.00 L)
Duration of Storm
8.58 hr
Time of Concentration (Tc) 1
25 min
Peak Precipitation Intensity Over Tc 2
25.80 mm/hr
Return Period over Tc 3
< 2 Yr
Measured Flow
I/I Flow
Time of Peak Measured Flow
Aug 25, 2022 18:55
Time of Peak I/I Flow (TD)
Aug 25, 2022 19:00
Estimated Dry Weather Flow at TD
5.15 L/s
Peak Measured Flow
11.46 L/s
Peak I/I Flow 4
6.29 L/s
Peak I/I Rate 5
0.08 L/s/ha
Peak Measured Depth
103.69 mm
Total I/I Flow Volume during event
89,444.50 L
Volumetric Coefficient (Cv%) 6
0.74%
Total Measured Flow Volume during Event
364,728.10 L
Peak I/I Coefficient 7
0.0012
Hourly Wet-Weather Peaking Factor 8
2.67
Instantaneous Wet-Weather Peaking Factor 9
3.10
1
Time of Concentration (Tc): The estimated time for the flow to travel from the furthest point in the upstream area to the point of monitoring, assume flow is travelling at 1.00 m/s Peak Precipitation Intensity Over Tc: The peak rainfall intensity for the duration of the storm with the time interval defined by time of concentration 3 Return Period over Tc: The estimated time to elapse before a storm of equal or greater intensity will likely occur again, based on design storm criteria 4 Peak I/I Flow: The greatest difference captured between measured flow and estimated dry weather flow, Peak I/I Flow = Maximum (Measured Flow – Estimated Dry Weather Flow) 5 Peak I/I Rate: A normalized peak I/I flow based on catchment area size, Peak I/I Rate = Peak I/I Flow / Catchment Area 6 Volumetric Coefficient (Cv%): The ratio of total I/I volume and total rainfall volume, Cv% = Total I/I Flow Volume / Total Precipitation Volume * 100% 7 Peak I/ I Coefficient: The ratio of peak I/I flow and peak rainfall intensity, Peak I/ I Coefficient = Peak I/I Flow / (Peak Rainfall Intensity over Tc * Catchment Area) 8 Hourly Wet‐Weather Peaking Factor: The ratio of peak hourly wet‐weather measured flow and average dry‐weather flow, Wet‐Weather Peaking Factor = Peak Hourly Wet‐Weather Measured Flow / Average Dry-Weather Flow 9 Instantaneous Wet‐Weather Peaking Factor: The ratio of peak wet‐weather measured flow and average dry‐weather flow, Wet‐Weather Peaking Factor = Peak Wet‐Weather Measured Flow / Average Dry-Weather Flow 2
929 Civica Infrastructure Inc. www.civi.ca
Civica Infrastructures Inc. Kawartha Lakes Flow Monitoring Report
Appendix - A June 03, 2024
I/I Analysis Graph Station: 1-2
930 Civica Infrastructure Inc. www.civi.ca
Civica Infrastructures Inc. Kawartha Lakes Flow Monitoring Report
Appendix - A June 03, 2024
Infiltration/Inflow Event Analysis Station: 1-2 Aug 29, 2022 01:40 – Aug 30, 2022 04:10, Total Precipitation: 29.00 mm (21,634,000.00 L) Station Details
Storm Details
Catchment Area
74.60 ha
Total Precipitation
29.00 mm (21,634,000.00 L)
Duration of Storm
2.50 hr
Time of Concentration (Tc) 1
25 min
Peak Precipitation Intensity Over Tc 2
41.40 mm/hr
Return Period over Tc 3
< 2 Yr
Measured Flow
I/I Flow
Time of Peak Measured Flow
Aug 29, 2022 15:20
Time of Peak I/I Flow (TD)
Aug 29, 2022 15:15
Estimated Dry Weather Flow at TD
3.79 L/s
Peak Measured Flow
16.81 L/s
Peak I/I Flow 4
12.94 L/s
Peak I/I Rate 5
0.17 L/s/ha
Peak Measured Depth
113.26 mm
Total I/I Flow Volume during event
184,866.00 L
Volumetric Coefficient (Cv%) 6
0.86%
Total Measured Flow Volume during Event
378,315.60 L
Peak I/I Coefficient 7
0.0015
Hourly Wet-Weather Peaking Factor 8
3.77
Instantaneous Wet-Weather Peaking Factor 9
4.56
1
Time of Concentration (Tc): The estimated time for the flow to travel from the furthest point in the upstream area to the point of monitoring, assume flow is travelling at 1.00 m/s Peak Precipitation Intensity Over Tc: The peak rainfall intensity for the duration of the storm with the time interval defined by time of concentration 3 Return Period over Tc: The estimated time to elapse before a storm of equal or greater intensity will likely occur again, based on design storm criteria 4 Peak I/I Flow: The greatest difference captured between measured flow and estimated dry weather flow, Peak I/I Flow = Maximum (Measured Flow – Estimated Dry Weather Flow) 5 Peak I/I Rate: A normalized peak I/I flow based on catchment area size, Peak I/I Rate = Peak I/I Flow / Catchment Area 6 Volumetric Coefficient (Cv%): The ratio of total I/I volume and total rainfall volume, Cv% = Total I/I Flow Volume / Total Precipitation Volume * 100% 7 Peak I/ I Coefficient: The ratio of peak I/I flow and peak rainfall intensity, Peak I/ I Coefficient = Peak I/I Flow / (Peak Rainfall Intensity over Tc * Catchment Area) 8 Hourly Wet‐Weather Peaking Factor: The ratio of peak hourly wet‐weather measured flow and average dry‐weather flow, Wet‐Weather Peaking Factor = Peak Hourly Wet‐Weather Measured Flow / Average Dry-Weather Flow 9 Instantaneous Wet‐Weather Peaking Factor: The ratio of peak wet‐weather measured flow and average dry‐weather flow, Wet‐Weather Peaking Factor = Peak Wet‐Weather Measured Flow / Average Dry-Weather Flow 2
931 Civica Infrastructure Inc. www.civi.ca
Civica Infrastructures Inc. Kawartha Lakes Flow Monitoring Report
Appendix - A June 03, 2024
I/I Analysis Graph Station: 1-2
932 Civica Infrastructure Inc. www.civi.ca
Civica Infrastructures Inc. Kawartha Lakes Flow Monitoring Report
Appendix - A June 03, 2024
Infiltration/Inflow Event Analysis Station: 1-2 Sep 11, 2022 15:50 – Sep 13, 2022 16:55, Total Precipitation: 21.75 mm (16,225,500.00 L) Station Details
Storm Details
Catchment Area
74.60 ha
Total Precipitation
21.75 mm (16,225,500.00 L)
Duration of Storm
25.08 hr
Time of Concentration (Tc) 1
25 min
Peak Precipitation Intensity Over Tc 2
9.60 mm/hr
Return Period over Tc 3
< 2 Yr
Measured Flow
I/I Flow
Time of Peak Measured Flow
Sep 12, 2022 07:25
Time of Peak I/I Flow (TD)
Sep 12, 2022 07:25
Estimated Dry Weather Flow at TD
5.89 L/s
Peak Measured Flow
7.68 L/s
Peak I/I Flow 4
1.79 L/s
Peak I/I Rate 5
0.02 L/s/ha
Peak Measured Depth
109.98 mm
Total I/I Flow Volume during event
28,758.00 L
Volumetric Coefficient (Cv%) 6
0.18%
Total Measured Flow Volume during Event
611,922.60 L
Peak I/I Coefficient 7
0.0009
Hourly Wet-Weather Peaking Factor 8
1.70
Instantaneous Wet-Weather Peaking Factor 9
1.76
1
Time of Concentration (Tc): The estimated time for the flow to travel from the furthest point in the upstream area to the point of monitoring, assume flow is travelling at 1.00 m/s Peak Precipitation Intensity Over Tc: The peak rainfall intensity for the duration of the storm with the time interval defined by time of concentration 3 Return Period over Tc: The estimated time to elapse before a storm of equal or greater intensity will likely occur again, based on design storm criteria 4 Peak I/I Flow: The greatest difference captured between measured flow and estimated dry weather flow, Peak I/I Flow = Maximum (Measured Flow – Estimated Dry Weather Flow) 5 Peak I/I Rate: A normalized peak I/I flow based on catchment area size, Peak I/I Rate = Peak I/I Flow / Catchment Area 6 Volumetric Coefficient (Cv%): The ratio of total I/I volume and total rainfall volume, Cv% = Total I/I Flow Volume / Total Precipitation Volume * 100% 7 Peak I/ I Coefficient: The ratio of peak I/I flow and peak rainfall intensity, Peak I/ I Coefficient = Peak I/I Flow / (Peak Rainfall Intensity over Tc * Catchment Area) 8 Hourly Wet‐Weather Peaking Factor: The ratio of peak hourly wet‐weather measured flow and average dry‐weather flow, Wet‐Weather Peaking Factor = Peak Hourly Wet‐Weather Measured Flow / Average Dry-Weather Flow 9 Instantaneous Wet‐Weather Peaking Factor: The ratio of peak wet‐weather measured flow and average dry‐weather flow, Wet‐Weather Peaking Factor = Peak Wet‐Weather Measured Flow / Average Dry-Weather Flow 2
933 Civica Infrastructure Inc. www.civi.ca
Civica Infrastructures Inc. Kawartha Lakes Flow Monitoring Report
Appendix - A June 03, 2024
I/I Analysis Graph Station: 1-2
934 Civica Infrastructure Inc. www.civi.ca
Civica Infrastructures Inc. Kawartha Lakes Flow Monitoring Report
Appendix - A June 03, 2024
Infiltration/Inflow Event Analysis Station: 1-2 Sep 17, 2022 19:35 – Sep 19, 2022 01:10, Total Precipitation: 24.50 mm (18,277,000.00 L) Station Details
Storm Details
Catchment Area
74.60 ha
Total Precipitation
24.50 mm (18,277,000.00 L)
Duration of Storm
5.58 hr
Time of Concentration (Tc) 1
25 min
Peak Precipitation Intensity Over Tc 2
18.00 mm/hr
Return Period over Tc 3
< 2 Yr
Measured Flow
I/I Flow
Time of Peak Measured Flow
Sep 18, 2022 10:40
Time of Peak I/I Flow (TD)
Sep 18, 2022 10:45
Estimated Dry Weather Flow at TD
6.80 L/s
Peak Measured Flow
12.91 L/s
Peak I/I Flow 4
6.10 L/s
Peak I/I Rate 5
0.08 L/s/ha
Peak Measured Depth
119.20 mm
Total I/I Flow Volume during event
148,780.50 L
Volumetric Coefficient (Cv%) 6
0.81%
Total Measured Flow Volume during Event
486,148.20 L
Peak I/I Coefficient 7
0.0016
Hourly Wet-Weather Peaking Factor 8
2.18
Instantaneous Wet-Weather Peaking Factor 9
2.43
1
Time of Concentration (Tc): The estimated time for the flow to travel from the furthest point in the upstream area to the point of monitoring, assume flow is travelling at 1.00 m/s Peak Precipitation Intensity Over Tc: The peak rainfall intensity for the duration of the storm with the time interval defined by time of concentration 3 Return Period over Tc: The estimated time to elapse before a storm of equal or greater intensity will likely occur again, based on design storm criteria 4 Peak I/I Flow: The greatest difference captured between measured flow and estimated dry weather flow, Peak I/I Flow = Maximum (Measured Flow – Estimated Dry Weather Flow) 5 Peak I/I Rate: A normalized peak I/I flow based on catchment area size, Peak I/I Rate = Peak I/I Flow / Catchment Area 6 Volumetric Coefficient (Cv%): The ratio of total I/I volume and total rainfall volume, Cv% = Total I/I Flow Volume / Total Precipitation Volume * 100% 7 Peak I/ I Coefficient: The ratio of peak I/I flow and peak rainfall intensity, Peak I/ I Coefficient = Peak I/I Flow / (Peak Rainfall Intensity over Tc * Catchment Area) 8 Hourly Wet‐Weather Peaking Factor: The ratio of peak hourly wet‐weather measured flow and average dry‐weather flow, Wet‐Weather Peaking Factor = Peak Hourly Wet‐Weather Measured Flow / Average Dry-Weather Flow 9 Instantaneous Wet‐Weather Peaking Factor: The ratio of peak wet‐weather measured flow and average dry‐weather flow, Wet‐Weather Peaking Factor = Peak Wet‐Weather Measured Flow / Average Dry-Weather Flow 2
935 Civica Infrastructure Inc. www.civi.ca
Civica Infrastructures Inc. Kawartha Lakes Flow Monitoring Report
Appendix - A June 03, 2024
I/I Analysis Graph Station: 1-2
936 Civica Infrastructure Inc. www.civi.ca
Civica Infrastructures Inc. Kawartha Lakes Flow Monitoring Report
Appendix - A June 03, 2024
Infiltration/Inflow Event Analysis Station: 1-2 Oct 12, 2022 08:40 – Oct 13, 2022 23:55, Total Precipitation: 20.75 mm (15,479,500.00 L) Station Details
Storm Details
Catchment Area
74.60 ha
Total Precipitation
20.75 mm (15,479,500.00 L)
Duration of Storm
15.25 hr
Time of Concentration (Tc) 1
25 min
Peak Precipitation Intensity Over Tc 2
8.40 mm/hr
Return Period over Tc 3
< 2 Yr
Measured Flow
I/I Flow
Time of Peak Measured Flow
Oct 13, 2022 08:15
Time of Peak I/I Flow (TD)
Oct 13, 2022 09:10
Estimated Dry Weather Flow at TD
5.02 L/s
Peak Measured Flow
7.84 L/s
Peak I/I Flow 4
2.42 L/s
Peak I/I Rate 5
0.03 L/s/ha
Peak Measured Depth
103.22 mm
Total I/I Flow Volume during event
57,311.50 L
Volumetric Coefficient (Cv%) 6
0.37%
Total Measured Flow Volume during Event
469,091.10 L
Peak I/I Coefficient 7
0.0014
Hourly Wet-Weather Peaking Factor 8
1.83
Instantaneous Wet-Weather Peaking Factor 9
1.87
1
Time of Concentration (Tc): The estimated time for the flow to travel from the furthest point in the upstream area to the point of monitoring, assume flow is travelling at 1.00 m/s Peak Precipitation Intensity Over Tc: The peak rainfall intensity for the duration of the storm with the time interval defined by time of concentration 3 Return Period over Tc: The estimated time to elapse before a storm of equal or greater intensity will likely occur again, based on design storm criteria 4 Peak I/I Flow: The greatest difference captured between measured flow and estimated dry weather flow, Peak I/I Flow = Maximum (Measured Flow – Estimated Dry Weather Flow) 5 Peak I/I Rate: A normalized peak I/I flow based on catchment area size, Peak I/I Rate = Peak I/I Flow / Catchment Area 6 Volumetric Coefficient (Cv%): The ratio of total I/I volume and total rainfall volume, Cv% = Total I/I Flow Volume / Total Precipitation Volume * 100% 7 Peak I/ I Coefficient: The ratio of peak I/I flow and peak rainfall intensity, Peak I/ I Coefficient = Peak I/I Flow / (Peak Rainfall Intensity over Tc * Catchment Area) 8 Hourly Wet‐Weather Peaking Factor: The ratio of peak hourly wet‐weather measured flow and average dry‐weather flow, Wet‐Weather Peaking Factor = Peak Hourly Wet‐Weather Measured Flow / Average Dry-Weather Flow 9 Instantaneous Wet‐Weather Peaking Factor: The ratio of peak wet‐weather measured flow and average dry‐weather flow, Wet‐Weather Peaking Factor = Peak Wet‐Weather Measured Flow / Average Dry-Weather Flow 2
937 Civica Infrastructure Inc. www.civi.ca
Civica Infrastructures Inc. Kawartha Lakes Flow Monitoring Report
Appendix - A June 03, 2024
Activity Log Station: 1-2 Date Time
Type
Purpose of Visit
Comment
Calibration Measurement
19-Nov-2021 09:30:00 AM
Installation Log
FM INSTALL
FM INSTALLED
Yes
Calibration
Data downloaded Debris cleared Telemetry sent Ensured manual and sensor readings are satisfactory before leaving site
Yes
02-Dec-2021 03:00:00 PM
Maintenance Log
NOTE: - NO PICK HOLE ANTENNA, MOST LIKELYDAMAGED. REPLACED WITH ANTENNA ZIP TIED TO TO LADDER RUNG. - SWAPPED BATTERY 14-Dec-2021 11:42:00 AM
20-Jan-2022 10:50:00 AM
Maintenance Log
Maintenance Log
CALIBRATION
DATA DOWNLOADED SITE CALIBRATED DEBRIS CLEARED TELEMETRY SENT
Yes
CALIBRATION
Data downloaded Debris cleared Telemetry sent Ensured manual and sensor readings are satisfactory before leaving site
Yes
Yes
09-Feb-2022 04:10:00 PM
Maintenance Log
CALIBRATION
Data downloaded Debris cleared Telemetry sent Ensured manual and sensor readings are satisfactory before leaving site Antenna drilled Site can only be accessed past 4:00 PM due to ongoing construction
17-Mar-2022 10:35:00 AM
Maintenance Log
calibration
Data downloaded site calibrated telemetry sent
Yes
10-May-2022 02:40:00 PM
Maintenance Log
CALIBRATION
DATA DOWNLOADED , TELEMETRY SENT, SITE CALIBRATED , PHOTOS TAKEN
Yes
25-May-2022 11:19:00 AM
Maintenance Log
Calibration
Yes
17-Jun-2022 11:24:00 AM
Maintenance Log
CALIBRATION
Yes
02-Aug-2022 03:46:00 PM
Maintenance Log
CALIBRATION
DATA DOWNLOADED, SITE CALIBRATED, DEBRIS CLEARED, TELEMETRY SENT
24-Aug-2022 09:57:00 AM
Maintenance Log
CALIBRATION
DATA DOWNLOADED, SITE CALIBRATED TELEMETRY SENT
Yes
21-Sep-2022 10:02:00 AM
Maintenance Log
CALIBRATION
DATA DOWNLOADED, SITE CALIBRATED,
Yes
938 Civica Infrastructure Inc. www.civi.ca
Yes
Civica Infrastructures Inc. Kawartha Lakes Flow Monitoring Report Date Time
Appendix - A June 03, 2024 Type
Purpose of Visit
Comment
Calibration Measurement
DEBRIS CLEARED, TELEMETRY SENT
03-Oct-2022 11:02:00 AM
03-Nov-2022 10:38:00 AM
Maintenance Log
Maintenance Log
CALIBRATION
DATA DOWNLOADED, SITE CALIBRATED, DEBRIS CLEARED TELEMETRY SENT AND CHECKED, PHOTO AND VIDEO TAKEN
Yes
CALIBRATION
DATA DOWNLOADED TELEMETRY SENT PHOTOS TAKEN SITE CALIBRATED ANTENNA REPLACED
Yes
939 Civica Infrastructure Inc. www.civi.ca
Civica Infrastructures Inc. Kawartha Lakes Flow Monitoring Report
Appendix - A June 03, 2024
Aggregate Data Station: 2-1
Level Date From
Date To
Days
Min (m)
Avg (m)
Max (m)
Count
Time of Min1
Time of Max1
Apr 28, 2022
Oct 22, 2022
178
0.01
0.05
0.15
51,063
Mon May 02, 2022 15:20
Sun Jun 12, 2022 09:20
Velocity Date From
Date To
Days
Min (m/s)
Avg (m/s)
Max (m/s)
Count
Time of Min1
Time of Max1
Apr 28, 2022
Oct 22, 2022
178
0.00
0.36
1.52
51,039
Mon Jul 11, 2022 03:30
Mon Aug 29, 2022 15:00
Flow Date From
Date To
Days
Min (L/s)
Avg (L/s)
Max (L/s)
Total Volume (1,000,000 L)
Count
Time of Min1
Time of Max1
Apr 28, 2022
Oct 22, 2022
178
0.00
4.01
55.35
61.44
51,039
Mon Jul 11, 2022 03:30
Sun Jun 12, 2022 09:20
Precipitation
1
Date From
Date To
Days
Min (mm)
Avg (mm)
Max (mm)
Sum (mm)
Count
Time of Min1
Time of Max1
Apr 28, 2022
Oct 22, 2022
178
0.00
0.01
9.75
465.00
51,129
Thu Apr 28, 2022 11:00
Mon Jul 25, 2022 00:00
Time of Min and Time of Max will be displayed by first occurrence
940 Civica Infrastructure Inc. www.civi.ca
Civica Infrastructures Inc. Kawartha Lakes Flow Monitoring Report
Appendix - A June 03, 2024
Sanitary Report Station: 2-1
1
Average Dry Weather Flow (L/s)
Average Dry Weather Flow (L/c/d)
Average Daily Minimum Dry Weather Flow (L/s)
Average Daily Peak Dry Weather Flow (L/s)
3.630
816.667
1.433
7.439
Peaking Factor
Groundwater Infiltration (L/s)1
Groundwater Infiltration (L/ha/d)
% of GWI in Average DWF
2.050
1.218
2,076.322
33.568
Groundwater infiltration (GWI) is assumed as 85% of the daily minimum flow averaged over the monitoring period
941 Civica Infrastructure Inc. www.civi.ca
Civica Infrastructures Inc. Kawartha Lakes Flow Monitoring Report
Appendix - A June 03, 2024
Data Chart Station: 2-1 Apr 28, 2022 – Apr 30, 2022
942 Civica Infrastructure Inc. www.civi.ca
Civica Infrastructures Inc. Kawartha Lakes Flow Monitoring Report
Appendix - A June 03, 2024
Data Chart Station: 2-1 May 01, 2022 – May 31, 2022
943 Civica Infrastructure Inc. www.civi.ca
Civica Infrastructures Inc. Kawartha Lakes Flow Monitoring Report
Appendix - A June 03, 2024
Data Chart Station: 2-1 Jun 01, 2022 – Jun 30, 2022
944 Civica Infrastructure Inc. www.civi.ca
Civica Infrastructures Inc. Kawartha Lakes Flow Monitoring Report
Appendix - A June 03, 2024
Data Chart Station: 2-1 Jul 01, 2022 – Jul 31, 2022
945 Civica Infrastructure Inc. www.civi.ca
Civica Infrastructures Inc. Kawartha Lakes Flow Monitoring Report
Appendix - A June 03, 2024
Data Chart Station: 2-1 Aug 01, 2022 – Aug 31, 2022
946 Civica Infrastructure Inc. www.civi.ca
Civica Infrastructures Inc. Kawartha Lakes Flow Monitoring Report
Appendix - A June 03, 2024
Data Chart Station: 2-1 Sep 01, 2022 – Sep 30, 2022
947 Civica Infrastructure Inc. www.civi.ca
Civica Infrastructures Inc. Kawartha Lakes Flow Monitoring Report
Appendix - A June 03, 2024
Data Chart Station: 2-1 Oct 01, 2022 – Oct 22, 2022
948 Civica Infrastructure Inc. www.civi.ca
Civica Infrastructures Inc. Kawartha Lakes Flow Monitoring Report
Appendix - A June 03, 2024
I/I Analysis Table
1
Event1
Total Precipitation (mm)
Duration (hours)
Peak Intensity Over Tc at Station (mm/hr)
May 26, 2022
20.25
27.50
Jun 06, 2022
30.00
Jun 11, 2022
2-1 Measured Peak Flow (L/s)
Peak I/I Flow (L/s)
Peak I/I Rate (L/s/ha)
Volumetric Runoff Coefficient (CV%)
Peaking Factor (PF)
12.00
24.33
20.74
0.41
2.30 %
5.82
32.42
9.00
24.64
19.24
0.38
2.74 %
5.02
41.50
25.08
24.00
55.35
50.19
0.99
5.10 %
14.37
Jul 12, 2022
15.50
7.75
22.50
41.27
38.11
0.75
1.34 %
11.45
Jul 18, 2022
21.50
43.25
1.00
21.77
18.29
0.36
4.21 %
5.66
Aug 17, 2022
17.50
1.83
29.50
35.88
32.05
0.63
0.98 %
12.50
Aug 21, 2022
17.50
30.50
10.50
20.00
18.51
0.37
1.80 %
6.08
Aug 25, 2022
16.25
8.58
24.00
34.94
30.75
0.61
1.16 %
10.78
Aug 29, 2022
29.00
2.50
39.50
48.03
43.90
0.87
1.67 %
13.10
Sep 12, 2022
21.75
25.08
8.00
30.60
25.45
0.50
2.44 %
6.30
Sep 18, 2022
24.50
5.58
17.00
27.41
21.90
0.43
2.09 %
5.81
Oct 12, 2022
20.75
15.25
7.50
26.16
22.55
0.45
2.21 %
6.01
Average
23.00
18.78
17.04
32.53
28.47
0.56
2.34 %
8.58
Maximum
41.50
43.25
39.50
55.35
50.19
0.99
5.10 %
14.37
Flow KPIs
Measured Storms
Station: 2-1
An event is a storm with a minimum volume of 15mm and a minimum inter-event dry period of 12 hours
949 Civica Infrastructure Inc. www.civi.ca
Civica Infrastructures Inc. Kawartha Lakes Flow Monitoring Report
Appendix - A June 03, 2024
I/I Analysis Graph Station: 2-1
950 Civica Infrastructure Inc. www.civi.ca
Civica Infrastructures Inc. Kawartha Lakes Flow Monitoring Report
Appendix - A June 03, 2024
Infiltration/Inflow Event Analysis Station: 2-1 May 26, 2022 07:30 – May 28, 2022 11:00, Total Precipitation: 20.25 mm (10,266,750.00 L) Station Details
Storm Details
Catchment Area
50.70 ha
Total Precipitation
20.25 mm (10,266,750.00 L)
Duration of Storm
27.50 hr
Time of Concentration (Tc) 1
30 min
Peak Precipitation Intensity Over Tc 2
12.00 mm/hr
Return Period over Tc 3
< 2 Yr
Measured Flow
I/I Flow
Time of Peak Measured Flow
May 27, 2022 16:45
Time of Peak I/I Flow (TD)
May 27, 2022 16:45
Estimated Dry Weather Flow at TD
3.59 L/s
Peak Measured Flow
24.33 L/s
Peak I/I Flow 4
20.74 L/s
Peak I/I Rate 5
0.41 L/s/ha
Peak Measured Depth
93.00 mm
Total I/I Flow Volume during event
235,684.40 L
Volumetric Coefficient (Cv%) 6
2.30%
Total Measured Flow Volume during Event
743,794.90 L
Peak I/I Coefficient 7
0.0123
Hourly Wet-Weather Peaking Factor 8
4.27
Instantaneous Wet-Weather Peaking Factor 9
6.82
1
Time of Concentration (Tc): The estimated time for the flow to travel from the furthest point in the upstream area to the point of monitoring, assume flow is travelling at 1.00 m/s Peak Precipitation Intensity Over Tc: The peak rainfall intensity for the duration of the storm with the time interval defined by time of concentration 3 Return Period over Tc: The estimated time to elapse before a storm of equal or greater intensity will likely occur again, based on design storm criteria 4 Peak I/I Flow: The greatest difference captured between measured flow and estimated dry weather flow, Peak I/I Flow = Maximum (Measured Flow – Estimated Dry Weather Flow) 5 Peak I/I Rate: A normalized peak I/I flow based on catchment area size, Peak I/I Rate = Peak I/I Flow / Catchment Area 6 Volumetric Coefficient (Cv%): The ratio of total I/I volume and total rainfall volume, Cv% = Total I/I Flow Volume / Total Precipitation Volume * 100% 7 Peak I/ I Coefficient: The ratio of peak I/I flow and peak rainfall intensity, Peak I/ I Coefficient = Peak I/I Flow / (Peak Rainfall Intensity over Tc * Catchment Area) 8 Hourly Wet‐Weather Peaking Factor: The ratio of peak hourly wet‐weather measured flow and average dry‐weather flow, Wet‐Weather Peaking Factor = Peak Hourly Wet‐Weather Measured Flow / Average Dry-Weather Flow 9 Instantaneous Wet‐Weather Peaking Factor: The ratio of peak wet‐weather measured flow and average dry‐weather flow, Wet‐Weather Peaking Factor = Peak Wet‐Weather Measured Flow / Average Dry-Weather Flow 2
951 Civica Infrastructure Inc. www.civi.ca
Civica Infrastructures Inc. Kawartha Lakes Flow Monitoring Report
Appendix - A June 03, 2024
I/I Analysis Graph Station: 2-1
952 Civica Infrastructure Inc. www.civi.ca
Civica Infrastructures Inc. Kawartha Lakes Flow Monitoring Report
Appendix - A June 03, 2024
Infiltration/Inflow Event Analysis Station: 2-1 Jun 05, 2022 18:20 – Jun 08, 2022 02:45, Total Precipitation: 30.00 mm (15,210,000.00 L) Station Details
Storm Details
Catchment Area
50.70 ha
Total Precipitation
30.00 mm (15,210,000.00 L)
Duration of Storm
32.42 hr
Time of Concentration (Tc) 1
30 min
Peak Precipitation Intensity Over Tc 2
9.00 mm/hr
Return Period over Tc 3
< 2 Yr
Measured Flow
I/I Flow
Time of Peak Measured Flow
Jun 07, 2022 09:25
Time of Peak I/I Flow (TD)
Jun 07, 2022 09:20
Estimated Dry Weather Flow at TD
5.29 L/s
Peak Measured Flow
24.64 L/s
Peak I/I Flow 4
19.24 L/s
Peak I/I Rate 5
0.38 L/s/ha
Peak Measured Depth
98.00 mm
Total I/I Flow Volume during event
416,809.00 L
Volumetric Coefficient (Cv%) 6
2.74%
Total Measured Flow Volume during Event
1,030,924.80 L
Peak I/I Coefficient 7
0.0152
Hourly Wet-Weather Peaking Factor 8
5.50
Instantaneous Wet-Weather Peaking Factor 9
6.43
1
Time of Concentration (Tc): The estimated time for the flow to travel from the furthest point in the upstream area to the point of monitoring, assume flow is travelling at 1.00 m/s Peak Precipitation Intensity Over Tc: The peak rainfall intensity for the duration of the storm with the time interval defined by time of concentration 3 Return Period over Tc: The estimated time to elapse before a storm of equal or greater intensity will likely occur again, based on design storm criteria 4 Peak I/I Flow: The greatest difference captured between measured flow and estimated dry weather flow, Peak I/I Flow = Maximum (Measured Flow – Estimated Dry Weather Flow) 5 Peak I/I Rate: A normalized peak I/I flow based on catchment area size, Peak I/I Rate = Peak I/I Flow / Catchment Area 6 Volumetric Coefficient (Cv%): The ratio of total I/I volume and total rainfall volume, Cv% = Total I/I Flow Volume / Total Precipitation Volume * 100% 7 Peak I/ I Coefficient: The ratio of peak I/I flow and peak rainfall intensity, Peak I/ I Coefficient = Peak I/I Flow / (Peak Rainfall Intensity over Tc * Catchment Area) 8 Hourly Wet‐Weather Peaking Factor: The ratio of peak hourly wet‐weather measured flow and average dry‐weather flow, Wet‐Weather Peaking Factor = Peak Hourly Wet‐Weather Measured Flow / Average Dry-Weather Flow 9 Instantaneous Wet‐Weather Peaking Factor: The ratio of peak wet‐weather measured flow and average dry‐weather flow, Wet‐Weather Peaking Factor = Peak Wet‐Weather Measured Flow / Average Dry-Weather Flow 2
953 Civica Infrastructure Inc. www.civi.ca
Civica Infrastructures Inc. Kawartha Lakes Flow Monitoring Report
Appendix - A June 03, 2024
I/I Analysis Graph Station: 2-1
954 Civica Infrastructure Inc. www.civi.ca
Civica Infrastructures Inc. Kawartha Lakes Flow Monitoring Report
Appendix - A June 03, 2024
Infiltration/Inflow Event Analysis Station: 2-1 Jun 11, 2022 01:55 – Jun 13, 2022 03:00, Total Precipitation: 41.50 mm (21,040,500.00 L) Station Details
Storm Details
Catchment Area
50.70 ha
Total Precipitation
41.50 mm (21,040,500.00 L)
Duration of Storm
25.08 hr
Time of Concentration (Tc) 1
30 min
Peak Precipitation Intensity Over Tc 2
24.00 mm/hr
Return Period over Tc 3
< 2 Yr
Measured Flow
I/I Flow
Time of Peak Measured Flow
Jun 12, 2022 09:20
Time of Peak I/I Flow (TD)
Jun 12, 2022 09:20
Estimated Dry Weather Flow at TD
5.16 L/s
Peak Measured Flow
55.35 L/s
Peak I/I Flow 4
50.19 L/s
Peak I/I Rate 5
0.99 L/s/ha
Peak Measured Depth
153.00 mm
Total I/I Flow Volume during event
1,072,700.80 L
Volumetric Coefficient (Cv%) 6
5.10%
Total Measured Flow Volume during Event
1,540,142.10 L
Peak I/I Coefficient 7
0.0149
Hourly Wet-Weather Peaking Factor 8
12.88
Instantaneous Wet-Weather Peaking Factor 9
15.84
1
Time of Concentration (Tc): The estimated time for the flow to travel from the furthest point in the upstream area to the point of monitoring, assume flow is travelling at 1.00 m/s Peak Precipitation Intensity Over Tc: The peak rainfall intensity for the duration of the storm with the time interval defined by time of concentration 3 Return Period over Tc: The estimated time to elapse before a storm of equal or greater intensity will likely occur again, based on design storm criteria 4 Peak I/I Flow: The greatest difference captured between measured flow and estimated dry weather flow, Peak I/I Flow = Maximum (Measured Flow – Estimated Dry Weather Flow) 5 Peak I/I Rate: A normalized peak I/I flow based on catchment area size, Peak I/I Rate = Peak I/I Flow / Catchment Area 6 Volumetric Coefficient (Cv%): The ratio of total I/I volume and total rainfall volume, Cv% = Total I/I Flow Volume / Total Precipitation Volume * 100% 7 Peak I/ I Coefficient: The ratio of peak I/I flow and peak rainfall intensity, Peak I/ I Coefficient = Peak I/I Flow / (Peak Rainfall Intensity over Tc * Catchment Area) 8 Hourly Wet‐Weather Peaking Factor: The ratio of peak hourly wet‐weather measured flow and average dry‐weather flow, Wet‐Weather Peaking Factor = Peak Hourly Wet‐Weather Measured Flow / Average Dry-Weather Flow 9 Instantaneous Wet‐Weather Peaking Factor: The ratio of peak wet‐weather measured flow and average dry‐weather flow, Wet‐Weather Peaking Factor = Peak Wet‐Weather Measured Flow / Average Dry-Weather Flow 2
955 Civica Infrastructure Inc. www.civi.ca
Civica Infrastructures Inc. Kawartha Lakes Flow Monitoring Report
Appendix - A June 03, 2024
I/I Analysis Graph Station: 2-1
956 Civica Infrastructure Inc. www.civi.ca
Civica Infrastructures Inc. Kawartha Lakes Flow Monitoring Report
Appendix - A June 03, 2024
Infiltration/Inflow Event Analysis Station: 2-1 Jul 11, 2022 14:25 – Jul 12, 2022 22:10, Total Precipitation: 15.50 mm (7,858,500.00 L) Station Details
Storm Details
Catchment Area
50.70 ha
Total Precipitation
15.50 mm (7,858,500.00 L)
Duration of Storm
7.75 hr
Time of Concentration (Tc) 1
30 min
Peak Precipitation Intensity Over Tc 2
22.50 mm/hr
Return Period over Tc 3
< 2 Yr
Measured Flow
I/I Flow
Time of Peak Measured Flow
Jul 12, 2022 03:05
Time of Peak I/I Flow (TD)
Jul 12, 2022 03:05
Estimated Dry Weather Flow at TD
3.16 L/s
Peak Measured Flow
41.27 L/s
Peak I/I Flow 4
38.11 L/s
Peak I/I Rate 5
0.75 L/s/ha
Peak Measured Depth
111.00 mm
Total I/I Flow Volume during event
105,080.40 L
Volumetric Coefficient (Cv%) 6
1.34%
Total Measured Flow Volume during Event
342,763.50 L
Peak I/I Coefficient 7
0.0120
Hourly Wet-Weather Peaking Factor 8
5.81
Instantaneous Wet-Weather Peaking Factor 9
12.40
1
Time of Concentration (Tc): The estimated time for the flow to travel from the furthest point in the upstream area to the point of monitoring, assume flow is travelling at 1.00 m/s Peak Precipitation Intensity Over Tc: The peak rainfall intensity for the duration of the storm with the time interval defined by time of concentration 3 Return Period over Tc: The estimated time to elapse before a storm of equal or greater intensity will likely occur again, based on design storm criteria 4 Peak I/I Flow: The greatest difference captured between measured flow and estimated dry weather flow, Peak I/I Flow = Maximum (Measured Flow – Estimated Dry Weather Flow) 5 Peak I/I Rate: A normalized peak I/I flow based on catchment area size, Peak I/I Rate = Peak I/I Flow / Catchment Area 6 Volumetric Coefficient (Cv%): The ratio of total I/I volume and total rainfall volume, Cv% = Total I/I Flow Volume / Total Precipitation Volume * 100% 7 Peak I/ I Coefficient: The ratio of peak I/I flow and peak rainfall intensity, Peak I/ I Coefficient = Peak I/I Flow / (Peak Rainfall Intensity over Tc * Catchment Area) 8 Hourly Wet‐Weather Peaking Factor: The ratio of peak hourly wet‐weather measured flow and average dry‐weather flow, Wet‐Weather Peaking Factor = Peak Hourly Wet‐Weather Measured Flow / Average Dry-Weather Flow 9 Instantaneous Wet‐Weather Peaking Factor: The ratio of peak wet‐weather measured flow and average dry‐weather flow, Wet‐Weather Peaking Factor = Peak Wet‐Weather Measured Flow / Average Dry-Weather Flow 2
957 Civica Infrastructure Inc. www.civi.ca
Civica Infrastructures Inc. Kawartha Lakes Flow Monitoring Report
Appendix - A June 03, 2024
I/I Analysis Graph Station: 2-1
958 Civica Infrastructure Inc. www.civi.ca
Civica Infrastructures Inc. Kawartha Lakes Flow Monitoring Report
Appendix - A June 03, 2024
Infiltration/Inflow Event Analysis Station: 2-1 Jul 17, 2022 16:10 – Jul 20, 2022 11:25, Total Precipitation: 21.50 mm (10,900,500.00 L) Station Details
Storm Details
Catchment Area
50.70 ha
Total Precipitation
21.50 mm (10,900,500.00 L)
Duration of Storm
43.25 hr
Time of Concentration (Tc) 1
30 min
Peak Precipitation Intensity Over Tc 2
1.00 mm/hr
Return Period over Tc 3
< 2 Yr
Measured Flow
I/I Flow
Time of Peak Measured Flow
Jul 18, 2022 11:35
Time of Peak I/I Flow (TD)
Jul 18, 2022 11:35
Estimated Dry Weather Flow at TD
3.48 L/s
Peak Measured Flow
21.77 L/s
Peak I/I Flow 4
18.29 L/s
Peak I/I Rate 5
0.36 L/s/ha
Peak Measured Depth
89.00 mm
Total I/I Flow Volume during event
458,493.40 L
Volumetric Coefficient (Cv%) 6
4.21%
Total Measured Flow Volume during Event
1,102,040.80 L
Peak I/I Coefficient 7
0.1299
Hourly Wet-Weather Peaking Factor 8
5.53
Instantaneous Wet-Weather Peaking Factor 9
6.74
1
Time of Concentration (Tc): The estimated time for the flow to travel from the furthest point in the upstream area to the point of monitoring, assume flow is travelling at 1.00 m/s Peak Precipitation Intensity Over Tc: The peak rainfall intensity for the duration of the storm with the time interval defined by time of concentration 3 Return Period over Tc: The estimated time to elapse before a storm of equal or greater intensity will likely occur again, based on design storm criteria 4 Peak I/I Flow: The greatest difference captured between measured flow and estimated dry weather flow, Peak I/I Flow = Maximum (Measured Flow – Estimated Dry Weather Flow) 5 Peak I/I Rate: A normalized peak I/I flow based on catchment area size, Peak I/I Rate = Peak I/I Flow / Catchment Area 6 Volumetric Coefficient (Cv%): The ratio of total I/I volume and total rainfall volume, Cv% = Total I/I Flow Volume / Total Precipitation Volume * 100% 7 Peak I/ I Coefficient: The ratio of peak I/I flow and peak rainfall intensity, Peak I/ I Coefficient = Peak I/I Flow / (Peak Rainfall Intensity over Tc * Catchment Area) 8 Hourly Wet‐Weather Peaking Factor: The ratio of peak hourly wet‐weather measured flow and average dry‐weather flow, Wet‐Weather Peaking Factor = Peak Hourly Wet‐Weather Measured Flow / Average Dry-Weather Flow 9 Instantaneous Wet‐Weather Peaking Factor: The ratio of peak wet‐weather measured flow and average dry‐weather flow, Wet‐Weather Peaking Factor = Peak Wet‐Weather Measured Flow / Average Dry-Weather Flow 2
959 Civica Infrastructure Inc. www.civi.ca
Civica Infrastructures Inc. Kawartha Lakes Flow Monitoring Report
Appendix - A June 03, 2024
I/I Analysis Graph Station: 2-1
960 Civica Infrastructure Inc. www.civi.ca
Civica Infrastructures Inc. Kawartha Lakes Flow Monitoring Report
Appendix - A June 03, 2024
Infiltration/Inflow Event Analysis Station: 2-1 Aug 17, 2022 03:20 – Aug 18, 2022 05:10, Total Precipitation: 17.50 mm (8,872,500.00 L) Station Details
Storm Details
Catchment Area
50.70 ha
Total Precipitation
17.50 mm (8,872,500.00 L)
Duration of Storm
1.83 hr
Time of Concentration (Tc) 1
30 min
Peak Precipitation Intensity Over Tc 2
29.50 mm/hr
Return Period over Tc 3
< 2 Yr
Measured Flow
I/I Flow
Time of Peak Measured Flow
Aug 17, 2022 15:35
Time of Peak I/I Flow (TD)
Aug 17, 2022 15:35
Estimated Dry Weather Flow at TD
3.84 L/s
Peak Measured Flow
35.88 L/s
Peak I/I Flow 4
32.05 L/s
Peak I/I Rate 5
0.63 L/s/ha
Peak Measured Depth
130.00 mm
Total I/I Flow Volume during event
87,310.80 L
Volumetric Coefficient (Cv%) 6
0.98%
Total Measured Flow Volume during Event
215,744.40 L
Peak I/I Coefficient 7
0.0077
Hourly Wet-Weather Peaking Factor 8
6.22
Instantaneous Wet-Weather Peaking Factor 9
14.00
1
Time of Concentration (Tc): The estimated time for the flow to travel from the furthest point in the upstream area to the point of monitoring, assume flow is travelling at 1.00 m/s Peak Precipitation Intensity Over Tc: The peak rainfall intensity for the duration of the storm with the time interval defined by time of concentration 3 Return Period over Tc: The estimated time to elapse before a storm of equal or greater intensity will likely occur again, based on design storm criteria 4 Peak I/I Flow: The greatest difference captured between measured flow and estimated dry weather flow, Peak I/I Flow = Maximum (Measured Flow – Estimated Dry Weather Flow) 5 Peak I/I Rate: A normalized peak I/I flow based on catchment area size, Peak I/I Rate = Peak I/I Flow / Catchment Area 6 Volumetric Coefficient (Cv%): The ratio of total I/I volume and total rainfall volume, Cv% = Total I/I Flow Volume / Total Precipitation Volume * 100% 7 Peak I/ I Coefficient: The ratio of peak I/I flow and peak rainfall intensity, Peak I/ I Coefficient = Peak I/I Flow / (Peak Rainfall Intensity over Tc * Catchment Area) 8 Hourly Wet‐Weather Peaking Factor: The ratio of peak hourly wet‐weather measured flow and average dry‐weather flow, Wet‐Weather Peaking Factor = Peak Hourly Wet‐Weather Measured Flow / Average Dry-Weather Flow 9 Instantaneous Wet‐Weather Peaking Factor: The ratio of peak wet‐weather measured flow and average dry‐weather flow, Wet‐Weather Peaking Factor = Peak Wet‐Weather Measured Flow / Average Dry-Weather Flow 2
961 Civica Infrastructure Inc. www.civi.ca
Civica Infrastructures Inc. Kawartha Lakes Flow Monitoring Report
Appendix - A June 03, 2024
I/I Analysis Graph Station: 2-1
962 Civica Infrastructure Inc. www.civi.ca
Civica Infrastructures Inc. Kawartha Lakes Flow Monitoring Report
Appendix - A June 03, 2024
Infiltration/Inflow Event Analysis Station: 2-1 Aug 21, 2022 09:50 – Aug 23, 2022 16:20, Total Precipitation: 17.50 mm (8,872,500.00 L) Station Details
Storm Details
Catchment Area
50.70 ha
Total Precipitation
17.50 mm (8,872,500.00 L)
Duration of Storm
30.50 hr
Time of Concentration (Tc) 1
30 min
Peak Precipitation Intensity Over Tc 2
10.50 mm/hr
Return Period over Tc 3
< 2 Yr
Measured Flow
I/I Flow
Time of Peak Measured Flow
Aug 22, 2022 13:20
Time of Peak I/I Flow (TD)
Aug 21, 2022 23:35
Estimated Dry Weather Flow at TD
1.47 L/s
Peak Measured Flow
20.00 L/s
Peak I/I Flow 4
18.51 L/s
Peak I/I Rate 5
0.37 L/s/ha
Peak Measured Depth
87.00 mm
Total I/I Flow Volume during event
160,053.60 L
Volumetric Coefficient (Cv%) 6
1.80%
Total Measured Flow Volume during Event
626,936.90 L
Peak I/I Coefficient 7
0.0125
Hourly Wet-Weather Peaking Factor 8
4.03
Instantaneous Wet-Weather Peaking Factor 9
6.57
1
Time of Concentration (Tc): The estimated time for the flow to travel from the furthest point in the upstream area to the point of monitoring, assume flow is travelling at 1.00 m/s Peak Precipitation Intensity Over Tc: The peak rainfall intensity for the duration of the storm with the time interval defined by time of concentration 3 Return Period over Tc: The estimated time to elapse before a storm of equal or greater intensity will likely occur again, based on design storm criteria 4 Peak I/I Flow: The greatest difference captured between measured flow and estimated dry weather flow, Peak I/I Flow = Maximum (Measured Flow – Estimated Dry Weather Flow) 5 Peak I/I Rate: A normalized peak I/I flow based on catchment area size, Peak I/I Rate = Peak I/I Flow / Catchment Area 6 Volumetric Coefficient (Cv%): The ratio of total I/I volume and total rainfall volume, Cv% = Total I/I Flow Volume / Total Precipitation Volume * 100% 7 Peak I/ I Coefficient: The ratio of peak I/I flow and peak rainfall intensity, Peak I/ I Coefficient = Peak I/I Flow / (Peak Rainfall Intensity over Tc * Catchment Area) 8 Hourly Wet‐Weather Peaking Factor: The ratio of peak hourly wet‐weather measured flow and average dry‐weather flow, Wet‐Weather Peaking Factor = Peak Hourly Wet‐Weather Measured Flow / Average Dry-Weather Flow 9 Instantaneous Wet‐Weather Peaking Factor: The ratio of peak wet‐weather measured flow and average dry‐weather flow, Wet‐Weather Peaking Factor = Peak Wet‐Weather Measured Flow / Average Dry-Weather Flow 2
963 Civica Infrastructure Inc. www.civi.ca
Civica Infrastructures Inc. Kawartha Lakes Flow Monitoring Report
Appendix - A June 03, 2024
I/I Analysis Graph Station: 2-1
964 Civica Infrastructure Inc. www.civi.ca
Civica Infrastructures Inc. Kawartha Lakes Flow Monitoring Report
Appendix - A June 03, 2024
Infiltration/Inflow Event Analysis Station: 2-1 Aug 25, 2022 01:30 – Aug 26, 2022 10:05, Total Precipitation: 16.25 mm (8,238,750.00 L) Station Details
Storm Details
Catchment Area
50.70 ha
Total Precipitation
16.25 mm (8,238,750.00 L)
Duration of Storm
8.58 hr
Time of Concentration (Tc) 1
30 min
Peak Precipitation Intensity Over Tc 2
24.00 mm/hr
Return Period over Tc 3
< 2 Yr
Measured Flow
I/I Flow
Time of Peak Measured Flow
Aug 25, 2022 19:00
Time of Peak I/I Flow (TD)
Aug 25, 2022 19:00
Estimated Dry Weather Flow at TD
4.19 L/s
Peak Measured Flow
34.94 L/s
Peak I/I Flow 4
30.75 L/s
Peak I/I Rate 5
0.61 L/s/ha
Peak Measured Depth
117.00 mm
Total I/I Flow Volume during event
95,692.80 L
Volumetric Coefficient (Cv%) 6
1.16%
Total Measured Flow Volume during Event
307,877.60 L
Peak I/I Coefficient 7
0.0091
Hourly Wet-Weather Peaking Factor 8
8.55
Instantaneous Wet-Weather Peaking Factor 9
12.25
1
Time of Concentration (Tc): The estimated time for the flow to travel from the furthest point in the upstream area to the point of monitoring, assume flow is travelling at 1.00 m/s Peak Precipitation Intensity Over Tc: The peak rainfall intensity for the duration of the storm with the time interval defined by time of concentration 3 Return Period over Tc: The estimated time to elapse before a storm of equal or greater intensity will likely occur again, based on design storm criteria 4 Peak I/I Flow: The greatest difference captured between measured flow and estimated dry weather flow, Peak I/I Flow = Maximum (Measured Flow – Estimated Dry Weather Flow) 5 Peak I/I Rate: A normalized peak I/I flow based on catchment area size, Peak I/I Rate = Peak I/I Flow / Catchment Area 6 Volumetric Coefficient (Cv%): The ratio of total I/I volume and total rainfall volume, Cv% = Total I/I Flow Volume / Total Precipitation Volume * 100% 7 Peak I/ I Coefficient: The ratio of peak I/I flow and peak rainfall intensity, Peak I/ I Coefficient = Peak I/I Flow / (Peak Rainfall Intensity over Tc * Catchment Area) 8 Hourly Wet‐Weather Peaking Factor: The ratio of peak hourly wet‐weather measured flow and average dry‐weather flow, Wet‐Weather Peaking Factor = Peak Hourly Wet‐Weather Measured Flow / Average Dry-Weather Flow 9 Instantaneous Wet‐Weather Peaking Factor: The ratio of peak wet‐weather measured flow and average dry‐weather flow, Wet‐Weather Peaking Factor = Peak Wet‐Weather Measured Flow / Average Dry-Weather Flow 2
965 Civica Infrastructure Inc. www.civi.ca
Civica Infrastructures Inc. Kawartha Lakes Flow Monitoring Report
Appendix - A June 03, 2024
I/I Analysis Graph Station: 2-1
966 Civica Infrastructure Inc. www.civi.ca
Civica Infrastructures Inc. Kawartha Lakes Flow Monitoring Report
Appendix - A June 03, 2024
Infiltration/Inflow Event Analysis Station: 2-1 Aug 29, 2022 01:40 – Aug 30, 2022 04:10, Total Precipitation: 29.00 mm (14,703,000.00 L) Station Details
Storm Details
Catchment Area
50.70 ha
Total Precipitation
29.00 mm (14,703,000.00 L)
Duration of Storm
2.50 hr
Time of Concentration (Tc) 1
30 min
Peak Precipitation Intensity Over Tc 2
39.50 mm/hr
Return Period over Tc 3
< 2 Yr
Measured Flow
I/I Flow
Time of Peak Measured Flow
Aug 29, 2022 15:00
Time of Peak I/I Flow (TD)
Aug 29, 2022 15:00
Estimated Dry Weather Flow at TD
4.13 L/s
Peak Measured Flow
48.03 L/s
Peak I/I Flow 4
43.90 L/s
Peak I/I Rate 5
0.87 L/s/ha
Peak Measured Depth
127.00 mm
Total I/I Flow Volume during event
245,375.50 L
Volumetric Coefficient (Cv%) 6
1.67%
Total Measured Flow Volume during Event
421,282.40 L
Peak I/I Coefficient 7
0.0079
Hourly Wet-Weather Peaking Factor 8
9.32
Instantaneous Wet-Weather Peaking Factor 9
14.33
1
Time of Concentration (Tc): The estimated time for the flow to travel from the furthest point in the upstream area to the point of monitoring, assume flow is travelling at 1.00 m/s Peak Precipitation Intensity Over Tc: The peak rainfall intensity for the duration of the storm with the time interval defined by time of concentration 3 Return Period over Tc: The estimated time to elapse before a storm of equal or greater intensity will likely occur again, based on design storm criteria 4 Peak I/I Flow: The greatest difference captured between measured flow and estimated dry weather flow, Peak I/I Flow = Maximum (Measured Flow – Estimated Dry Weather Flow) 5 Peak I/I Rate: A normalized peak I/I flow based on catchment area size, Peak I/I Rate = Peak I/I Flow / Catchment Area 6 Volumetric Coefficient (Cv%): The ratio of total I/I volume and total rainfall volume, Cv% = Total I/I Flow Volume / Total Precipitation Volume * 100% 7 Peak I/ I Coefficient: The ratio of peak I/I flow and peak rainfall intensity, Peak I/ I Coefficient = Peak I/I Flow / (Peak Rainfall Intensity over Tc * Catchment Area) 8 Hourly Wet‐Weather Peaking Factor: The ratio of peak hourly wet‐weather measured flow and average dry‐weather flow, Wet‐Weather Peaking Factor = Peak Hourly Wet‐Weather Measured Flow / Average Dry-Weather Flow 9 Instantaneous Wet‐Weather Peaking Factor: The ratio of peak wet‐weather measured flow and average dry‐weather flow, Wet‐Weather Peaking Factor = Peak Wet‐Weather Measured Flow / Average Dry-Weather Flow 2
967 Civica Infrastructure Inc. www.civi.ca
Civica Infrastructures Inc. Kawartha Lakes Flow Monitoring Report
Appendix - A June 03, 2024
I/I Analysis Graph Station: 2-1
968 Civica Infrastructure Inc. www.civi.ca
Civica Infrastructures Inc. Kawartha Lakes Flow Monitoring Report
Appendix - A June 03, 2024
Infiltration/Inflow Event Analysis Station: 2-1 Sep 11, 2022 15:50 – Sep 13, 2022 16:55, Total Precipitation: 21.75 mm (11,027,250.00 L) Station Details
Storm Details
Catchment Area
50.70 ha
Total Precipitation
21.75 mm (11,027,250.00 L)
Duration of Storm
25.08 hr
Time of Concentration (Tc) 1
30 min
Peak Precipitation Intensity Over Tc 2
8.00 mm/hr
Return Period over Tc 3
< 2 Yr
Measured Flow
I/I Flow
Time of Peak Measured Flow
Sep 12, 2022 08:05
Time of Peak I/I Flow (TD)
Sep 12, 2022 08:05
Estimated Dry Weather Flow at TD
5.15 L/s
Peak Measured Flow
30.60 L/s
Peak I/I Flow 4
25.45 L/s
Peak I/I Rate 5
0.50 L/s/ha
Peak Measured Depth
116.00 mm
Total I/I Flow Volume during event
268,944.70 L
Volumetric Coefficient (Cv%) 6
2.44%
Total Measured Flow Volume during Event
809,718.60 L
Peak I/I Coefficient 7
0.0226
Hourly Wet-Weather Peaking Factor 8
5.13
Instantaneous Wet-Weather Peaking Factor 9
7.57
1
Time of Concentration (Tc): The estimated time for the flow to travel from the furthest point in the upstream area to the point of monitoring, assume flow is travelling at 1.00 m/s Peak Precipitation Intensity Over Tc: The peak rainfall intensity for the duration of the storm with the time interval defined by time of concentration 3 Return Period over Tc: The estimated time to elapse before a storm of equal or greater intensity will likely occur again, based on design storm criteria 4 Peak I/I Flow: The greatest difference captured between measured flow and estimated dry weather flow, Peak I/I Flow = Maximum (Measured Flow – Estimated Dry Weather Flow) 5 Peak I/I Rate: A normalized peak I/I flow based on catchment area size, Peak I/I Rate = Peak I/I Flow / Catchment Area 6 Volumetric Coefficient (Cv%): The ratio of total I/I volume and total rainfall volume, Cv% = Total I/I Flow Volume / Total Precipitation Volume * 100% 7 Peak I/ I Coefficient: The ratio of peak I/I flow and peak rainfall intensity, Peak I/ I Coefficient = Peak I/I Flow / (Peak Rainfall Intensity over Tc * Catchment Area) 8 Hourly Wet‐Weather Peaking Factor: The ratio of peak hourly wet‐weather measured flow and average dry‐weather flow, Wet‐Weather Peaking Factor = Peak Hourly Wet‐Weather Measured Flow / Average Dry-Weather Flow 9 Instantaneous Wet‐Weather Peaking Factor: The ratio of peak wet‐weather measured flow and average dry‐weather flow, Wet‐Weather Peaking Factor = Peak Wet‐Weather Measured Flow / Average Dry-Weather Flow 2
969 Civica Infrastructure Inc. www.civi.ca
Civica Infrastructures Inc. Kawartha Lakes Flow Monitoring Report
Appendix - A June 03, 2024
I/I Analysis Graph Station: 2-1
970 Civica Infrastructure Inc. www.civi.ca
Civica Infrastructures Inc. Kawartha Lakes Flow Monitoring Report
Appendix - A June 03, 2024
Infiltration/Inflow Event Analysis Station: 2-1 Sep 17, 2022 19:35 – Sep 19, 2022 01:10, Total Precipitation: 24.50 mm (12,421,500.00 L) Station Details
Storm Details
Catchment Area
50.70 ha
Total Precipitation
24.50 mm (12,421,500.00 L)
Duration of Storm
5.58 hr
Time of Concentration (Tc) 1
30 min
Peak Precipitation Intensity Over Tc 2
17.00 mm/hr
Return Period over Tc 3
< 2 Yr
Measured Flow
I/I Flow
Time of Peak Measured Flow
Sep 18, 2022 09:35
Time of Peak I/I Flow (TD)
Sep 18, 2022 09:35
Estimated Dry Weather Flow at TD
5.51 L/s
Peak Measured Flow
27.41 L/s
Peak I/I Flow 4
21.90 L/s
Peak I/I Rate 5
0.43 L/s/ha
Peak Measured Depth
111.00 mm
Total I/I Flow Volume during event
260,054.10 L
Volumetric Coefficient (Cv%) 6
2.09%
Total Measured Flow Volume during Event
499,554.00 L
Peak I/I Coefficient 7
0.0092
Hourly Wet-Weather Peaking Factor 8
5.02
Instantaneous Wet-Weather Peaking Factor 9
7.28
1
Time of Concentration (Tc): The estimated time for the flow to travel from the furthest point in the upstream area to the point of monitoring, assume flow is travelling at 1.00 m/s Peak Precipitation Intensity Over Tc: The peak rainfall intensity for the duration of the storm with the time interval defined by time of concentration 3 Return Period over Tc: The estimated time to elapse before a storm of equal or greater intensity will likely occur again, based on design storm criteria 4 Peak I/I Flow: The greatest difference captured between measured flow and estimated dry weather flow, Peak I/I Flow = Maximum (Measured Flow – Estimated Dry Weather Flow) 5 Peak I/I Rate: A normalized peak I/I flow based on catchment area size, Peak I/I Rate = Peak I/I Flow / Catchment Area 6 Volumetric Coefficient (Cv%): The ratio of total I/I volume and total rainfall volume, Cv% = Total I/I Flow Volume / Total Precipitation Volume * 100% 7 Peak I/ I Coefficient: The ratio of peak I/I flow and peak rainfall intensity, Peak I/ I Coefficient = Peak I/I Flow / (Peak Rainfall Intensity over Tc * Catchment Area) 8 Hourly Wet‐Weather Peaking Factor: The ratio of peak hourly wet‐weather measured flow and average dry‐weather flow, Wet‐Weather Peaking Factor = Peak Hourly Wet‐Weather Measured Flow / Average Dry-Weather Flow 9 Instantaneous Wet‐Weather Peaking Factor: The ratio of peak wet‐weather measured flow and average dry‐weather flow, Wet‐Weather Peaking Factor = Peak Wet‐Weather Measured Flow / Average Dry-Weather Flow 2
971 Civica Infrastructure Inc. www.civi.ca
Civica Infrastructures Inc. Kawartha Lakes Flow Monitoring Report
Appendix - A June 03, 2024
I/I Analysis Graph Station: 2-1
972 Civica Infrastructure Inc. www.civi.ca
Civica Infrastructures Inc. Kawartha Lakes Flow Monitoring Report
Appendix - A June 03, 2024
Infiltration/Inflow Event Analysis Station: 2-1 Oct 12, 2022 08:40 – Oct 13, 2022 23:55, Total Precipitation: 20.75 mm (10,520,250.00 L) Station Details
Storm Details
Catchment Area
50.70 ha
Total Precipitation
20.75 mm (10,520,250.00 L)
Duration of Storm
15.25 hr
Time of Concentration (Tc) 1
30 min
Peak Precipitation Intensity Over Tc 2
7.50 mm/hr
Return Period over Tc 3
< 2 Yr
Measured Flow
I/I Flow
Time of Peak Measured Flow
Oct 13, 2022 04:10
Time of Peak I/I Flow (TD)
Oct 13, 2022 04:10
Estimated Dry Weather Flow at TD
3.61 L/s
Peak Measured Flow
26.16 L/s
Peak I/I Flow 4
22.55 L/s
Peak I/I Rate 5
0.45 L/s/ha
Peak Measured Depth
115.00 mm
Total I/I Flow Volume during event
232,580.50 L
Volumetric Coefficient (Cv%) 6
2.21%
Total Measured Flow Volume during Event
601,964.60 L
Peak I/I Coefficient 7
0.0214
Hourly Wet-Weather Peaking Factor 8
4.07
Instantaneous Wet-Weather Peaking Factor 9
6.97
1
Time of Concentration (Tc): The estimated time for the flow to travel from the furthest point in the upstream area to the point of monitoring, assume flow is travelling at 1.00 m/s Peak Precipitation Intensity Over Tc: The peak rainfall intensity for the duration of the storm with the time interval defined by time of concentration 3 Return Period over Tc: The estimated time to elapse before a storm of equal or greater intensity will likely occur again, based on design storm criteria 4 Peak I/I Flow: The greatest difference captured between measured flow and estimated dry weather flow, Peak I/I Flow = Maximum (Measured Flow – Estimated Dry Weather Flow) 5 Peak I/I Rate: A normalized peak I/I flow based on catchment area size, Peak I/I Rate = Peak I/I Flow / Catchment Area 6 Volumetric Coefficient (Cv%): The ratio of total I/I volume and total rainfall volume, Cv% = Total I/I Flow Volume / Total Precipitation Volume * 100% 7 Peak I/ I Coefficient: The ratio of peak I/I flow and peak rainfall intensity, Peak I/ I Coefficient = Peak I/I Flow / (Peak Rainfall Intensity over Tc * Catchment Area) 8 Hourly Wet‐Weather Peaking Factor: The ratio of peak hourly wet‐weather measured flow and average dry‐weather flow, Wet‐Weather Peaking Factor = Peak Hourly Wet‐Weather Measured Flow / Average Dry-Weather Flow 9 Instantaneous Wet‐Weather Peaking Factor: The ratio of peak wet‐weather measured flow and average dry‐weather flow, Wet‐Weather Peaking Factor = Peak Wet‐Weather Measured Flow / Average Dry-Weather Flow 2
973 Civica Infrastructure Inc. www.civi.ca
Civica Infrastructures Inc. Kawartha Lakes Flow Monitoring Report
Appendix - A June 03, 2024
Activity Log Station: 2-1 Date Time
Type
Purpose of Visit
03-May-2022 10:40:00 AM
Maintenance Log
Calibration
Yes
03-May-2022 10:41:00 AM
Maintenance Log
Calibration
Yes
11-May-2022 07:10:00 AM
Maintenance Log
CALIBRATION
24-May-2022 02:56:00 PM
Maintenance Log
CALIBRATION
27-Jun-2022 11:41:00 AM
Maintenance Log
Comment
CSO SN:192924027-72 DATA DOWNLOADED, TELEMETRY SENT, SITE CALIBRATED, PHOTOS TAKEN
Calibration Measurement
Yes Yes
CALIBRATION
DATA DOWNLOADED PHOTOS TAKEN SITE CALIBRATED CLEARED DEBRIS TELEMETRY SENT ANTENNA DRILLED
Yes
Yes
02-Aug-2022 04:39:00 PM
Maintenance Log
CALIBRATION
DATA DOWNLOADED, SITE CALIBRATED, DEBRIS CLEARED, TELEMETRY SENT
24-Aug-2022 10:15:00 AM
Maintenance Log
CALIBRATION
DATA DOWNLOADED, SITE CALIBRATED TELEMETRY SENT
Yes
CALIBRATION
DATA DOWNLOADED, SITE CALIBRATED, TELEMETRY SENT PHOTO AND VIDEO TAKEN
Yes
CALIBRATION
DATA DOWNLOADED, SITE CALIBRATED, DEBRIS CLEARED TELEMETRY SENT AND CHECKED, PHOTO AND VIDEO TAKEN
Yes
CALIBRATION
DATA DOWNLOADED, SITE CALIBRATED, DEBRIS CLEARED TELEMETRY SENT AND CHECKED, PHOTO AND VIDEO TAKEN
Yes
22-Sep-2022 08:34:00 AM
04-Oct-2022 10:32:00 AM
04-Oct-2022 10:32:00 AM
Maintenance Log
Maintenance Log
Maintenance Log
974 Civica Infrastructure Inc. www.civi.ca
Civica Infrastructures Inc. Kawartha Lakes Flow Monitoring Report
Appendix - A June 03, 2024
Aggregate Data Station: 2-2
Level Date From
Date To
Days
Min (m)
Avg (m)
Max (m)
Count
Time of Min1
Time of Max1
Nov 25, 2021
Nov 04, 2022
302
0.07
0.12
0.27
85,972
Mon Feb 14, 2022 04:05
Sun Jun 12, 2022 09:25
Velocity Date From
Date To
Days
Min (m/s)
Avg (m/s)
Max (m/s)
Count
Time of Min1
Time of Max1
Nov 25, 2021
Nov 04, 2022
302
-0.71
0.29
0.89
85,946
Tue May 03, 2022 12:35
Thu Feb 17, 2022 05:40
Flow Date From
Date To
Days
Min (L/s)
Avg (L/s)
Max (L/s)
Total Volume (1,000,000 L)
Count
Time of Min1
Time of Max1
Nov 25, 2021
Nov 04, 2022
302
-24.16
10.37
94.35
267.30
85,946
Tue May 03, 2022 12:35
Sun Jun 12, 2022 09:25
Precipitation
1
Date From
Date To
Days
Min (mm)
Avg (mm)
Max (mm)
Sum (mm)
Count
Time of Min1
Time of Max1
Nov 25, 2021
Nov 04, 2022
335
0.00
0.01
9.75
657.45
95,820
Thu Nov 25, 2021 08:30
Mon Jul 25, 2022 00:00
Time of Min and Time of Max will be displayed by first occurrence
975 Civica Infrastructure Inc. www.civi.ca
Civica Infrastructures Inc. Kawartha Lakes Flow Monitoring Report
Appendix - A June 03, 2024
Sanitary Report Station: 2-2
1
Average Dry Weather Flow (L/s)
Average Dry Weather Flow (L/c/d)
Average Daily Minimum Dry Weather Flow (L/s)
Average Daily Peak Dry Weather Flow (L/s)
8.918
779.099
4.272
15.235
Peaking Factor
Groundwater Infiltration (L/s)1
Groundwater Infiltration (L/ha/d)
% of GWI in Average DWF
1.708
3.631
3,162.671
40.717
Groundwater infiltration (GWI) is assumed as 85% of the daily minimum flow averaged over the monitoring period
976 Civica Infrastructure Inc. www.civi.ca
Civica Infrastructures Inc. Kawartha Lakes Flow Monitoring Report
Appendix - A June 03, 2024
Data Chart Station: 2-2 Nov 25, 2021 – Nov 30, 2021
977 Civica Infrastructure Inc. www.civi.ca
Civica Infrastructures Inc. Kawartha Lakes Flow Monitoring Report
Appendix - A June 03, 2024
Data Chart Station: 2-2 Dec 01, 2021 – Dec 31, 2021
978 Civica Infrastructure Inc. www.civi.ca
Civica Infrastructures Inc. Kawartha Lakes Flow Monitoring Report
Appendix - A June 03, 2024
Data Chart Station: 2-2 Jan 01, 2022 – Jan 31, 2022
979 Civica Infrastructure Inc. www.civi.ca
Civica Infrastructures Inc. Kawartha Lakes Flow Monitoring Report
Appendix - A June 03, 2024
Data Chart Station: 2-2 Feb 01, 2022 – Feb 28, 2022
980 Civica Infrastructure Inc. www.civi.ca
Civica Infrastructures Inc. Kawartha Lakes Flow Monitoring Report
Appendix - A June 03, 2024
Data Chart Station: 2-2 Mar 01, 2022 – Mar 31, 2022
981 Civica Infrastructure Inc. www.civi.ca
Civica Infrastructures Inc. Kawartha Lakes Flow Monitoring Report
Appendix - A June 03, 2024
Data Chart Station: 2-2 Apr 01, 2022 – Apr 30, 2022
982 Civica Infrastructure Inc. www.civi.ca
Civica Infrastructures Inc. Kawartha Lakes Flow Monitoring Report
Appendix - A June 03, 2024
Data Chart Station: 2-2 May 01, 2022 – May 31, 2022
983 Civica Infrastructure Inc. www.civi.ca
Civica Infrastructures Inc. Kawartha Lakes Flow Monitoring Report
Appendix - A June 03, 2024
Data Chart Station: 2-2 Jun 01, 2022 – Jun 30, 2022
984 Civica Infrastructure Inc. www.civi.ca
Civica Infrastructures Inc. Kawartha Lakes Flow Monitoring Report
Appendix - A June 03, 2024
Data Chart Station: 2-2 Jul 01, 2022 – Jul 31, 2022
985 Civica Infrastructure Inc. www.civi.ca
Civica Infrastructures Inc. Kawartha Lakes Flow Monitoring Report
Appendix - A June 03, 2024
Data Chart Station: 2-2 Aug 01, 2022 – Aug 31, 2022
986 Civica Infrastructure Inc. www.civi.ca
Civica Infrastructures Inc. Kawartha Lakes Flow Monitoring Report
Appendix - A June 03, 2024
Data Chart Station: 2-2 Sep 01, 2022 – Sep 30, 2022
987 Civica Infrastructure Inc. www.civi.ca
Civica Infrastructures Inc. Kawartha Lakes Flow Monitoring Report
Appendix - A June 03, 2024
Data Chart Station: 2-2 Oct 01, 2022 – Oct 31, 2022
988 Civica Infrastructure Inc. www.civi.ca
Civica Infrastructures Inc. Kawartha Lakes Flow Monitoring Report
Appendix - A June 03, 2024
Data Chart Station: 2-2 Nov 01, 2022 – Nov 04, 2022
989 Civica Infrastructure Inc. www.civi.ca
Civica Infrastructures Inc. Kawartha Lakes Flow Monitoring Report
Appendix - A June 03, 2024
I/I Analysis Table
1 2
2-2
Event1
Total Precipitation (mm)
Duration (hours)
Peak Intensity Over Tc at Station (mm/hr)
Feb 16, 2022
18.00
12.67
3.00
Apr 13, 2022
17.25
28.67
8.14
May 26, 2022
20.25
27.50
10.70
49.34
40.56
Jun 06, 2022
30.00
32.42
8.60
50.82
Jun 11, 2022
41.50
25.08
23.60
Jul 12, 2022
15.50
7.75
19.70
Jul 18, 2022
21.50
43.25
1.30
Aug 17, 2022
17.50
1.83
25.30
Aug 21, 2022
17.50
30.50
Aug 25, 2022
16.25
Aug 29, 2022
Measured Peak Flow (L/s)
Peak I/I Flow (L/s)
Peak I/I Rate (L/s/ha)
Volumetric Runoff Coefficient (CV%)
Peaking Factor (PF)
52.46
43.19
0.44
11.84 %
4.39
0.41
3.62 %
5.04
42.86
0.43
2.82 %
4.65
94.35
82.24
0.83
5.26 %
9.10
30.59
24.62
0.25
1.05 %
2.91
34.10
25.08
0.25
1.94 %
3.19
29.83
20.74
0.21
0.55 %
3.15
9.40
20.36
13.49
0.14
1.43 %
1.76
8.58
22.30
37.07
26.93
0.27
1.09 %
3.42
29.00
2.50
35.60
52.69
44.56
0.45
1.52 %
5.90
Sep 12, 2022
21.75
25.08
7.30
31.55
20.40
0.21
1.50 %
2.35
Sep 18, 2022
24.50
5.58
15.40
33.15
22.17
0.22
1.94 %
2.42
Oct 12, 2022
20.75
15.25
6.90
27.78
21.88
0.22
1.32 %
3.07
Average
22.23
19.05
14.09
41.85
32.98
0.33
2.76 %
3.95
Maximum
41.50
43.25
35.60
94.35
82.24
0.83
11.84 %
9.10
N/A 2
Flow KPIs
Measured Storms
Station: 2-2
An event is a storm with a minimum volume of 15mm and a minimum inter-event dry period of 12 hours I/I event analysis unable to be completed due to missing flow monitoring data during event
990 Civica Infrastructure Inc. www.civi.ca
Civica Infrastructures Inc. Kawartha Lakes Flow Monitoring Report
Appendix - A June 03, 2024
I/I Analysis Graph Station: 2-2
991 Civica Infrastructure Inc. www.civi.ca
Civica Infrastructures Inc. Kawartha Lakes Flow Monitoring Report
Appendix - A June 03, 2024
Infiltration/Inflow Event Analysis Station: 2-2 Feb 16, 2022 11:00 – Feb 17, 2022 23:40, Total Precipitation: 18.00 mm (17,856,000.00 L) Station Details
Storm Details
Catchment Area
99.20 ha
Total Precipitation
18.00 mm (17,856,000.00 L)
Duration of Storm
12.67 hr
Time of Concentration (Tc) 1
35 min
Peak Precipitation Intensity Over Tc 2
3.00 mm/hr
Return Period over Tc 3
< 2 Yr
Measured Flow
I/I Flow
Time of Peak Measured Flow
Feb 17, 2022 07:40
Time of Peak I/I Flow (TD)
Feb 17, 2022 06:45
Estimated Dry Weather Flow at TD
6.90 L/s
Peak Measured Flow
52.46 L/s
Peak I/I Flow 4
43.19 L/s
Peak I/I Rate 5
0.44 L/s/ha
Peak Measured Depth
176.00 mm
Total I/I Flow Volume during event
2,113,658.60 L
Volumetric Coefficient (Cv%) 6
11.84%
Total Measured Flow Volume during Event
2,990,398.70 L
Peak I/I Coefficient 7
0.0523
Hourly Wet-Weather Peaking Factor 8
4.98
Instantaneous Wet-Weather Peaking Factor 9
5.33
1
Time of Concentration (Tc): The estimated time for the flow to travel from the furthest point in the upstream area to the point of monitoring, assume flow is travelling at 1.00 m/s Peak Precipitation Intensity Over Tc: The peak rainfall intensity for the duration of the storm with the time interval defined by time of concentration 3 Return Period over Tc: The estimated time to elapse before a storm of equal or greater intensity will likely occur again, based on design storm criteria 4 Peak I/I Flow: The greatest difference captured between measured flow and estimated dry weather flow, Peak I/I Flow = Maximum (Measured Flow – Estimated Dry Weather Flow) 5 Peak I/I Rate: A normalized peak I/I flow based on catchment area size, Peak I/I Rate = Peak I/I Flow / Catchment Area 6 Volumetric Coefficient (Cv%): The ratio of total I/I volume and total rainfall volume, Cv% = Total I/I Flow Volume / Total Precipitation Volume * 100% 7 Peak I/ I Coefficient: The ratio of peak I/I flow and peak rainfall intensity, Peak I/ I Coefficient = Peak I/I Flow / (Peak Rainfall Intensity over Tc * Catchment Area) 8 Hourly Wet‐Weather Peaking Factor: The ratio of peak hourly wet‐weather measured flow and average dry‐weather flow, Wet‐Weather Peaking Factor = Peak Hourly Wet‐Weather Measured Flow / Average Dry-Weather Flow 9 Instantaneous Wet‐Weather Peaking Factor: The ratio of peak wet‐weather measured flow and average dry‐weather flow, Wet‐Weather Peaking Factor = Peak Wet‐Weather Measured Flow / Average Dry-Weather Flow 2
992 Civica Infrastructure Inc. www.civi.ca
Civica Infrastructures Inc. Kawartha Lakes Flow Monitoring Report
Appendix - A June 03, 2024
I/I Analysis Graph Station: 2-2
993 Civica Infrastructure Inc. www.civi.ca
Civica Infrastructures Inc. Kawartha Lakes Flow Monitoring Report
Appendix - A June 03, 2024
Infiltration/Inflow Event Analysis Station: 2-2 May 26, 2022 07:30 – May 28, 2022 11:00, Total Precipitation: 20.25 mm (20,088,000.00 L) Station Details
Storm Details
Catchment Area
99.20 ha
Total Precipitation
20.25 mm (20,088,000.00 L)
Duration of Storm
27.50 hr
Time of Concentration (Tc) 1
35 min
Peak Precipitation Intensity Over Tc 2
10.70 mm/hr
Return Period over Tc 3
< 2 Yr
Measured Flow
I/I Flow
Time of Peak Measured Flow
May 27, 2022 17:00
Time of Peak I/I Flow (TD)
May 27, 2022 17:00
Estimated Dry Weather Flow at TD
8.78 L/s
Peak Measured Flow
49.34 L/s
Peak I/I Flow 4
40.56 L/s
Peak I/I Rate 5
0.41 L/s/ha
Peak Measured Depth
201.00 mm
Total I/I Flow Volume during event
726,622.00 L
Volumetric Coefficient (Cv%) 6
3.62%
Total Measured Flow Volume during Event
1,873,799.20 L
Peak I/I Coefficient 7
0.0137
Hourly Wet-Weather Peaking Factor 8
4.86
Instantaneous Wet-Weather Peaking Factor 9
6.13
1
Time of Concentration (Tc): The estimated time for the flow to travel from the furthest point in the upstream area to the point of monitoring, assume flow is travelling at 1.00 m/s Peak Precipitation Intensity Over Tc: The peak rainfall intensity for the duration of the storm with the time interval defined by time of concentration 3 Return Period over Tc: The estimated time to elapse before a storm of equal or greater intensity will likely occur again, based on design storm criteria 4 Peak I/I Flow: The greatest difference captured between measured flow and estimated dry weather flow, Peak I/I Flow = Maximum (Measured Flow – Estimated Dry Weather Flow) 5 Peak I/I Rate: A normalized peak I/I flow based on catchment area size, Peak I/I Rate = Peak I/I Flow / Catchment Area 6 Volumetric Coefficient (Cv%): The ratio of total I/I volume and total rainfall volume, Cv% = Total I/I Flow Volume / Total Precipitation Volume * 100% 7 Peak I/ I Coefficient: The ratio of peak I/I flow and peak rainfall intensity, Peak I/ I Coefficient = Peak I/I Flow / (Peak Rainfall Intensity over Tc * Catchment Area) 8 Hourly Wet‐Weather Peaking Factor: The ratio of peak hourly wet‐weather measured flow and average dry‐weather flow, Wet‐Weather Peaking Factor = Peak Hourly Wet‐Weather Measured Flow / Average Dry-Weather Flow 9 Instantaneous Wet‐Weather Peaking Factor: The ratio of peak wet‐weather measured flow and average dry‐weather flow, Wet‐Weather Peaking Factor = Peak Wet‐Weather Measured Flow / Average Dry-Weather Flow 2
994 Civica Infrastructure Inc. www.civi.ca
Civica Infrastructures Inc. Kawartha Lakes Flow Monitoring Report
Appendix - A June 03, 2024
I/I Analysis Graph Station: 2-2
995 Civica Infrastructure Inc. www.civi.ca
Civica Infrastructures Inc. Kawartha Lakes Flow Monitoring Report
Appendix - A June 03, 2024
Infiltration/Inflow Event Analysis Station: 2-2 Jun 05, 2022 18:20 – Jun 08, 2022 02:45, Total Precipitation: 30.00 mm (29,760,000.00 L) Station Details
Storm Details
Catchment Area
99.20 ha
Total Precipitation
30.00 mm (29,760,000.00 L)
Duration of Storm
32.42 hr
Time of Concentration (Tc) 1
35 min
Peak Precipitation Intensity Over Tc 2
8.60 mm/hr
Return Period over Tc 3
< 2 Yr
Measured Flow
I/I Flow
Time of Peak Measured Flow
Jun 06, 2022 20:20
Time of Peak I/I Flow (TD)
Jun 06, 2022 20:20
Estimated Dry Weather Flow at TD
7.96 L/s
Peak Measured Flow
50.82 L/s
Peak I/I Flow 4
42.86 L/s
Peak I/I Rate 5
0.43 L/s/ha
Peak Measured Depth
219.00 mm
Total I/I Flow Volume during event
840,002.70 L
Volumetric Coefficient (Cv%) 6
2.82%
Total Measured Flow Volume during Event
2,317,831.90 L
Peak I/I Coefficient 7
0.0182
Hourly Wet-Weather Peaking Factor 8
3.18
Instantaneous Wet-Weather Peaking Factor 9
5.51
1
Time of Concentration (Tc): The estimated time for the flow to travel from the furthest point in the upstream area to the point of monitoring, assume flow is travelling at 1.00 m/s Peak Precipitation Intensity Over Tc: The peak rainfall intensity for the duration of the storm with the time interval defined by time of concentration 3 Return Period over Tc: The estimated time to elapse before a storm of equal or greater intensity will likely occur again, based on design storm criteria 4 Peak I/I Flow: The greatest difference captured between measured flow and estimated dry weather flow, Peak I/I Flow = Maximum (Measured Flow – Estimated Dry Weather Flow) 5 Peak I/I Rate: A normalized peak I/I flow based on catchment area size, Peak I/I Rate = Peak I/I Flow / Catchment Area 6 Volumetric Coefficient (Cv%): The ratio of total I/I volume and total rainfall volume, Cv% = Total I/I Flow Volume / Total Precipitation Volume * 100% 7 Peak I/ I Coefficient: The ratio of peak I/I flow and peak rainfall intensity, Peak I/ I Coefficient = Peak I/I Flow / (Peak Rainfall Intensity over Tc * Catchment Area) 8 Hourly Wet‐Weather Peaking Factor: The ratio of peak hourly wet‐weather measured flow and average dry‐weather flow, Wet‐Weather Peaking Factor = Peak Hourly Wet‐Weather Measured Flow / Average Dry-Weather Flow 9 Instantaneous Wet‐Weather Peaking Factor: The ratio of peak wet‐weather measured flow and average dry‐weather flow, Wet‐Weather Peaking Factor = Peak Wet‐Weather Measured Flow / Average Dry-Weather Flow 2
996 Civica Infrastructure Inc. www.civi.ca
Civica Infrastructures Inc. Kawartha Lakes Flow Monitoring Report
Appendix - A June 03, 2024
I/I Analysis Graph Station: 2-2
997 Civica Infrastructure Inc. www.civi.ca
Civica Infrastructures Inc. Kawartha Lakes Flow Monitoring Report
Appendix - A June 03, 2024
Infiltration/Inflow Event Analysis Station: 2-2 Jun 11, 2022 01:55 – Jun 13, 2022 03:00, Total Precipitation: 41.50 mm (41,168,000.00 L) Station Details
Storm Details
Catchment Area
99.20 ha
Total Precipitation
41.50 mm (41,168,000.00 L)
Duration of Storm
25.08 hr
Time of Concentration (Tc) 1
35 min
Peak Precipitation Intensity Over Tc 2
23.60 mm/hr
Return Period over Tc 3
< 2 Yr
Measured Flow
I/I Flow
Time of Peak Measured Flow
Jun 12, 2022 09:25
Time of Peak I/I Flow (TD)
Jun 12, 2022 09:25
Estimated Dry Weather Flow at TD
12.12 L/s
Peak Measured Flow
94.35 L/s
Peak I/I Flow 4
82.24 L/s
Peak I/I Rate 5
0.83 L/s/ha
Peak Measured Depth
268.00 mm
Total I/I Flow Volume during event
2,163,929.20 L
Volumetric Coefficient (Cv%) 6
5.26%
Total Measured Flow Volume during Event
3,373,419.50 L
Peak I/I Coefficient 7
0.0127
Hourly Wet-Weather Peaking Factor 8
7.96
Instantaneous Wet-Weather Peaking Factor 9
10.44
1
Time of Concentration (Tc): The estimated time for the flow to travel from the furthest point in the upstream area to the point of monitoring, assume flow is travelling at 1.00 m/s Peak Precipitation Intensity Over Tc: The peak rainfall intensity for the duration of the storm with the time interval defined by time of concentration 3 Return Period over Tc: The estimated time to elapse before a storm of equal or greater intensity will likely occur again, based on design storm criteria 4 Peak I/I Flow: The greatest difference captured between measured flow and estimated dry weather flow, Peak I/I Flow = Maximum (Measured Flow – Estimated Dry Weather Flow) 5 Peak I/I Rate: A normalized peak I/I flow based on catchment area size, Peak I/I Rate = Peak I/I Flow / Catchment Area 6 Volumetric Coefficient (Cv%): The ratio of total I/I volume and total rainfall volume, Cv% = Total I/I Flow Volume / Total Precipitation Volume * 100% 7 Peak I/ I Coefficient: The ratio of peak I/I flow and peak rainfall intensity, Peak I/ I Coefficient = Peak I/I Flow / (Peak Rainfall Intensity over Tc * Catchment Area) 8 Hourly Wet‐Weather Peaking Factor: The ratio of peak hourly wet‐weather measured flow and average dry‐weather flow, Wet‐Weather Peaking Factor = Peak Hourly Wet‐Weather Measured Flow / Average Dry-Weather Flow 9 Instantaneous Wet‐Weather Peaking Factor: The ratio of peak wet‐weather measured flow and average dry‐weather flow, Wet‐Weather Peaking Factor = Peak Wet‐Weather Measured Flow / Average Dry-Weather Flow 2
998 Civica Infrastructure Inc. www.civi.ca
Civica Infrastructures Inc. Kawartha Lakes Flow Monitoring Report
Appendix - A June 03, 2024
I/I Analysis Graph Station: 2-2
999 Civica Infrastructure Inc. www.civi.ca
Civica Infrastructures Inc. Kawartha Lakes Flow Monitoring Report
Appendix - A June 03, 2024
Infiltration/Inflow Event Analysis Station: 2-2 Jul 11, 2022 14:25 – Jul 12, 2022 22:10, Total Precipitation: 15.50 mm (15,376,000.00 L) Station Details
Storm Details
Catchment Area
99.20 ha
Total Precipitation
15.50 mm (15,376,000.00 L)
Duration of Storm
7.75 hr
Time of Concentration (Tc) 1
35 min
Peak Precipitation Intensity Over Tc 2
19.70 mm/hr
Return Period over Tc 3
< 2 Yr
Measured Flow
I/I Flow
Time of Peak Measured Flow
Jul 12, 2022 03:10
Time of Peak I/I Flow (TD)
Jul 12, 2022 03:10
Estimated Dry Weather Flow at TD
5.97 L/s
Peak Measured Flow
30.59 L/s
Peak I/I Flow 4
24.62 L/s
Peak I/I Rate 5
0.25 L/s/ha
Peak Measured Depth
188.00 mm
Total I/I Flow Volume during event
162,025.80 L
Volumetric Coefficient (Cv%) 6
1.05%
Total Measured Flow Volume during Event
766,063.60 L
Peak I/I Coefficient 7
0.0045
Hourly Wet-Weather Peaking Factor 8
2.47
Instantaneous Wet-Weather Peaking Factor 9
3.62
1
Time of Concentration (Tc): The estimated time for the flow to travel from the furthest point in the upstream area to the point of monitoring, assume flow is travelling at 1.00 m/s Peak Precipitation Intensity Over Tc: The peak rainfall intensity for the duration of the storm with the time interval defined by time of concentration 3 Return Period over Tc: The estimated time to elapse before a storm of equal or greater intensity will likely occur again, based on design storm criteria 4 Peak I/I Flow: The greatest difference captured between measured flow and estimated dry weather flow, Peak I/I Flow = Maximum (Measured Flow – Estimated Dry Weather Flow) 5 Peak I/I Rate: A normalized peak I/I flow based on catchment area size, Peak I/I Rate = Peak I/I Flow / Catchment Area 6 Volumetric Coefficient (Cv%): The ratio of total I/I volume and total rainfall volume, Cv% = Total I/I Flow Volume / Total Precipitation Volume * 100% 7 Peak I/ I Coefficient: The ratio of peak I/I flow and peak rainfall intensity, Peak I/ I Coefficient = Peak I/I Flow / (Peak Rainfall Intensity over Tc * Catchment Area) 8 Hourly Wet‐Weather Peaking Factor: The ratio of peak hourly wet‐weather measured flow and average dry‐weather flow, Wet‐Weather Peaking Factor = Peak Hourly Wet‐Weather Measured Flow / Average Dry-Weather Flow 9 Instantaneous Wet‐Weather Peaking Factor: The ratio of peak wet‐weather measured flow and average dry‐weather flow, Wet‐Weather Peaking Factor = Peak Wet‐Weather Measured Flow / Average Dry-Weather Flow 2
1000 Civica Infrastructure Inc. www.civi.ca
Civica Infrastructures Inc. Kawartha Lakes Flow Monitoring Report
Appendix - A June 03, 2024
I/I Analysis Graph Station: 2-2
1001 Civica Infrastructure Inc. www.civi.ca
Civica Infrastructures Inc. Kawartha Lakes Flow Monitoring Report
Appendix - A June 03, 2024
Infiltration/Inflow Event Analysis Station: 2-2 Jul 17, 2022 16:10 – Jul 20, 2022 11:25, Total Precipitation: 21.50 mm (21,328,000.00 L) Station Details
Storm Details
Catchment Area
99.20 ha
Total Precipitation
21.50 mm (21,328,000.00 L)
Duration of Storm
43.25 hr
Time of Concentration (Tc) 1
35 min
Peak Precipitation Intensity Over Tc 2
1.30 mm/hr
Return Period over Tc 3
< 2 Yr
Measured Flow
I/I Flow
Time of Peak Measured Flow
Jul 18, 2022 11:45
Time of Peak I/I Flow (TD)
Jul 18, 2022 11:45
Estimated Dry Weather Flow at TD
9.02 L/s
Peak Measured Flow
34.10 L/s
Peak I/I Flow 4
25.08 L/s
Peak I/I Rate 5
0.25 L/s/ha
Peak Measured Depth
189.00 mm
Total I/I Flow Volume during event
413,374.50 L
Volumetric Coefficient (Cv%) 6
1.94%
Total Measured Flow Volume during Event
1,981,788.40 L
Peak I/I Coefficient 7
0.0708
Hourly Wet-Weather Peaking Factor 8
3.59
Instantaneous Wet-Weather Peaking Factor 9
4.33
1
Time of Concentration (Tc): The estimated time for the flow to travel from the furthest point in the upstream area to the point of monitoring, assume flow is travelling at 1.00 m/s Peak Precipitation Intensity Over Tc: The peak rainfall intensity for the duration of the storm with the time interval defined by time of concentration 3 Return Period over Tc: The estimated time to elapse before a storm of equal or greater intensity will likely occur again, based on design storm criteria 4 Peak I/I Flow: The greatest difference captured between measured flow and estimated dry weather flow, Peak I/I Flow = Maximum (Measured Flow – Estimated Dry Weather Flow) 5 Peak I/I Rate: A normalized peak I/I flow based on catchment area size, Peak I/I Rate = Peak I/I Flow / Catchment Area 6 Volumetric Coefficient (Cv%): The ratio of total I/I volume and total rainfall volume, Cv% = Total I/I Flow Volume / Total Precipitation Volume * 100% 7 Peak I/ I Coefficient: The ratio of peak I/I flow and peak rainfall intensity, Peak I/ I Coefficient = Peak I/I Flow / (Peak Rainfall Intensity over Tc * Catchment Area) 8 Hourly Wet‐Weather Peaking Factor: The ratio of peak hourly wet‐weather measured flow and average dry‐weather flow, Wet‐Weather Peaking Factor = Peak Hourly Wet‐Weather Measured Flow / Average Dry-Weather Flow 9 Instantaneous Wet‐Weather Peaking Factor: The ratio of peak wet‐weather measured flow and average dry‐weather flow, Wet‐Weather Peaking Factor = Peak Wet‐Weather Measured Flow / Average Dry-Weather Flow 2
1002 Civica Infrastructure Inc. www.civi.ca
Civica Infrastructures Inc. Kawartha Lakes Flow Monitoring Report
Appendix - A June 03, 2024
I/I Analysis Graph Station: 2-2
1003 Civica Infrastructure Inc. www.civi.ca
Civica Infrastructures Inc. Kawartha Lakes Flow Monitoring Report
Appendix - A June 03, 2024
Infiltration/Inflow Event Analysis Station: 2-2 Aug 17, 2022 03:20 – Aug 18, 2022 05:10, Total Precipitation: 17.50 mm (17,360,000.00 L) Station Details
Storm Details
Catchment Area
99.20 ha
Total Precipitation
17.50 mm (17,360,000.00 L)
Duration of Storm
1.83 hr
Time of Concentration (Tc) 1
35 min
Peak Precipitation Intensity Over Tc 2
25.30 mm/hr
Return Period over Tc 3
< 2 Yr
Measured Flow
I/I Flow
Time of Peak Measured Flow
Aug 17, 2022 15:50
Time of Peak I/I Flow (TD)
Aug 17, 2022 15:50
Estimated Dry Weather Flow at TD
9.09 L/s
Peak Measured Flow
29.83 L/s
Peak I/I Flow 4
20.74 L/s
Peak I/I Rate 5
0.21 L/s/ha
Peak Measured Depth
177.00 mm
Total I/I Flow Volume during event
96,064.10 L
Volumetric Coefficient (Cv%) 6
0.55%
Total Measured Flow Volume during Event
425,889.10 L
Peak I/I Coefficient 7
0.0030
Hourly Wet-Weather Peaking Factor 8
3.43
Instantaneous Wet-Weather Peaking Factor 9
4.53
1
Time of Concentration (Tc): The estimated time for the flow to travel from the furthest point in the upstream area to the point of monitoring, assume flow is travelling at 1.00 m/s Peak Precipitation Intensity Over Tc: The peak rainfall intensity for the duration of the storm with the time interval defined by time of concentration 3 Return Period over Tc: The estimated time to elapse before a storm of equal or greater intensity will likely occur again, based on design storm criteria 4 Peak I/I Flow: The greatest difference captured between measured flow and estimated dry weather flow, Peak I/I Flow = Maximum (Measured Flow – Estimated Dry Weather Flow) 5 Peak I/I Rate: A normalized peak I/I flow based on catchment area size, Peak I/I Rate = Peak I/I Flow / Catchment Area 6 Volumetric Coefficient (Cv%): The ratio of total I/I volume and total rainfall volume, Cv% = Total I/I Flow Volume / Total Precipitation Volume * 100% 7 Peak I/ I Coefficient: The ratio of peak I/I flow and peak rainfall intensity, Peak I/ I Coefficient = Peak I/I Flow / (Peak Rainfall Intensity over Tc * Catchment Area) 8 Hourly Wet‐Weather Peaking Factor: The ratio of peak hourly wet‐weather measured flow and average dry‐weather flow, Wet‐Weather Peaking Factor = Peak Hourly Wet‐Weather Measured Flow / Average Dry-Weather Flow 9 Instantaneous Wet‐Weather Peaking Factor: The ratio of peak wet‐weather measured flow and average dry‐weather flow, Wet‐Weather Peaking Factor = Peak Wet‐Weather Measured Flow / Average Dry-Weather Flow 2
1004 Civica Infrastructure Inc. www.civi.ca
Civica Infrastructures Inc. Kawartha Lakes Flow Monitoring Report
Appendix - A June 03, 2024
I/I Analysis Graph Station: 2-2
1005 Civica Infrastructure Inc. www.civi.ca
Civica Infrastructures Inc. Kawartha Lakes Flow Monitoring Report
Appendix - A June 03, 2024
Infiltration/Inflow Event Analysis Station: 2-2 Aug 21, 2022 09:50 – Aug 23, 2022 16:20, Total Precipitation: 17.50 mm (17,360,000.00 L) Station Details
Storm Details
Catchment Area
99.20 ha
Total Precipitation
17.50 mm (17,360,000.00 L)
Duration of Storm
30.50 hr
Time of Concentration (Tc) 1
35 min
Peak Precipitation Intensity Over Tc 2
9.40 mm/hr
Return Period over Tc 3
< 2 Yr
Measured Flow
I/I Flow
Time of Peak Measured Flow
Aug 22, 2022 13:50
Time of Peak I/I Flow (TD)
Aug 22, 2022 00:25
Estimated Dry Weather Flow at TD
4.67 L/s
Peak Measured Flow
20.36 L/s
Peak I/I Flow 4
13.49 L/s
Peak I/I Rate 5
0.14 L/s/ha
Peak Measured Depth
163.00 mm
Total I/I Flow Volume during event
247,561.90 L
Volumetric Coefficient (Cv%) 6
1.43%
Total Measured Flow Volume during Event
1,424,905.10 L
Peak I/I Coefficient 7
0.0052
Hourly Wet-Weather Peaking Factor 8
1.98
Instantaneous Wet-Weather Peaking Factor 9
2.65
1
Time of Concentration (Tc): The estimated time for the flow to travel from the furthest point in the upstream area to the point of monitoring, assume flow is travelling at 1.00 m/s Peak Precipitation Intensity Over Tc: The peak rainfall intensity for the duration of the storm with the time interval defined by time of concentration 3 Return Period over Tc: The estimated time to elapse before a storm of equal or greater intensity will likely occur again, based on design storm criteria 4 Peak I/I Flow: The greatest difference captured between measured flow and estimated dry weather flow, Peak I/I Flow = Maximum (Measured Flow – Estimated Dry Weather Flow) 5 Peak I/I Rate: A normalized peak I/I flow based on catchment area size, Peak I/I Rate = Peak I/I Flow / Catchment Area 6 Volumetric Coefficient (Cv%): The ratio of total I/I volume and total rainfall volume, Cv% = Total I/I Flow Volume / Total Precipitation Volume * 100% 7 Peak I/ I Coefficient: The ratio of peak I/I flow and peak rainfall intensity, Peak I/ I Coefficient = Peak I/I Flow / (Peak Rainfall Intensity over Tc * Catchment Area) 8 Hourly Wet‐Weather Peaking Factor: The ratio of peak hourly wet‐weather measured flow and average dry‐weather flow, Wet‐Weather Peaking Factor = Peak Hourly Wet‐Weather Measured Flow / Average Dry-Weather Flow 9 Instantaneous Wet‐Weather Peaking Factor: The ratio of peak wet‐weather measured flow and average dry‐weather flow, Wet‐Weather Peaking Factor = Peak Wet‐Weather Measured Flow / Average Dry-Weather Flow 2
1006 Civica Infrastructure Inc. www.civi.ca
Civica Infrastructures Inc. Kawartha Lakes Flow Monitoring Report
Appendix - A June 03, 2024
I/I Analysis Graph Station: 2-2
1007 Civica Infrastructure Inc. www.civi.ca
Civica Infrastructures Inc. Kawartha Lakes Flow Monitoring Report
Appendix - A June 03, 2024
Infiltration/Inflow Event Analysis Station: 2-2 Aug 25, 2022 01:30 – Aug 26, 2022 10:05, Total Precipitation: 16.25 mm (16,120,000.00 L) Station Details
Storm Details
Catchment Area
99.20 ha
Total Precipitation
16.25 mm (16,120,000.00 L)
Duration of Storm
8.58 hr
Time of Concentration (Tc) 1
35 min
Peak Precipitation Intensity Over Tc 2
22.30 mm/hr
Return Period over Tc 3
< 2 Yr
Measured Flow
I/I Flow
Time of Peak Measured Flow
Aug 25, 2022 19:10
Time of Peak I/I Flow (TD)
Aug 25, 2022 19:10
Estimated Dry Weather Flow at TD
10.14 L/s
Peak Measured Flow
37.07 L/s
Peak I/I Flow 4
26.93 L/s
Peak I/I Rate 5
0.27 L/s/ha
Peak Measured Depth
194.00 mm
Total I/I Flow Volume during event
174,829.00 L
Volumetric Coefficient (Cv%) 6
1.09%
Total Measured Flow Volume during Event
761,255.60 L
Peak I/I Coefficient 7
0.0044
Hourly Wet-Weather Peaking Factor 8
3.76
Instantaneous Wet-Weather Peaking Factor 9
4.70
1
Time of Concentration (Tc): The estimated time for the flow to travel from the furthest point in the upstream area to the point of monitoring, assume flow is travelling at 1.00 m/s Peak Precipitation Intensity Over Tc: The peak rainfall intensity for the duration of the storm with the time interval defined by time of concentration 3 Return Period over Tc: The estimated time to elapse before a storm of equal or greater intensity will likely occur again, based on design storm criteria 4 Peak I/I Flow: The greatest difference captured between measured flow and estimated dry weather flow, Peak I/I Flow = Maximum (Measured Flow – Estimated Dry Weather Flow) 5 Peak I/I Rate: A normalized peak I/I flow based on catchment area size, Peak I/I Rate = Peak I/I Flow / Catchment Area 6 Volumetric Coefficient (Cv%): The ratio of total I/I volume and total rainfall volume, Cv% = Total I/I Flow Volume / Total Precipitation Volume * 100% 7 Peak I/ I Coefficient: The ratio of peak I/I flow and peak rainfall intensity, Peak I/ I Coefficient = Peak I/I Flow / (Peak Rainfall Intensity over Tc * Catchment Area) 8 Hourly Wet‐Weather Peaking Factor: The ratio of peak hourly wet‐weather measured flow and average dry‐weather flow, Wet‐Weather Peaking Factor = Peak Hourly Wet‐Weather Measured Flow / Average Dry-Weather Flow 9 Instantaneous Wet‐Weather Peaking Factor: The ratio of peak wet‐weather measured flow and average dry‐weather flow, Wet‐Weather Peaking Factor = Peak Wet‐Weather Measured Flow / Average Dry-Weather Flow 2
1008 Civica Infrastructure Inc. www.civi.ca
Civica Infrastructures Inc. Kawartha Lakes Flow Monitoring Report
Appendix - A June 03, 2024
I/I Analysis Graph Station: 2-2
1009 Civica Infrastructure Inc. www.civi.ca
Civica Infrastructures Inc. Kawartha Lakes Flow Monitoring Report
Appendix - A June 03, 2024
Infiltration/Inflow Event Analysis Station: 2-2 Aug 29, 2022 01:40 – Aug 30, 2022 04:10, Total Precipitation: 29.00 mm (28,768,000.00 L) Station Details
Storm Details
Catchment Area
99.20 ha
Total Precipitation
29.00 mm (28,768,000.00 L)
Duration of Storm
2.50 hr
Time of Concentration (Tc) 1
35 min
Peak Precipitation Intensity Over Tc 2
35.60 mm/hr
Return Period over Tc 3
< 2 Yr
Measured Flow
I/I Flow
Time of Peak Measured Flow
Aug 29, 2022 15:05
Time of Peak I/I Flow (TD)
Aug 29, 2022 15:05
Estimated Dry Weather Flow at TD
8.14 L/s
Peak Measured Flow
52.69 L/s
Peak I/I Flow 4
44.56 L/s
Peak I/I Rate 5
0.45 L/s/ha
Peak Measured Depth
242.00 mm
Total I/I Flow Volume during event
437,880.90 L
Volumetric Coefficient (Cv%) 6
1.52%
Total Measured Flow Volume during Event
834,165.60 L
Peak I/I Coefficient 7
0.0046
Hourly Wet-Weather Peaking Factor 8
4.85
Instantaneous Wet-Weather Peaking Factor 9
6.98
1
Time of Concentration (Tc): The estimated time for the flow to travel from the furthest point in the upstream area to the point of monitoring, assume flow is travelling at 1.00 m/s Peak Precipitation Intensity Over Tc: The peak rainfall intensity for the duration of the storm with the time interval defined by time of concentration 3 Return Period over Tc: The estimated time to elapse before a storm of equal or greater intensity will likely occur again, based on design storm criteria 4 Peak I/I Flow: The greatest difference captured between measured flow and estimated dry weather flow, Peak I/I Flow = Maximum (Measured Flow – Estimated Dry Weather Flow) 5 Peak I/I Rate: A normalized peak I/I flow based on catchment area size, Peak I/I Rate = Peak I/I Flow / Catchment Area 6 Volumetric Coefficient (Cv%): The ratio of total I/I volume and total rainfall volume, Cv% = Total I/I Flow Volume / Total Precipitation Volume * 100% 7 Peak I/ I Coefficient: The ratio of peak I/I flow and peak rainfall intensity, Peak I/ I Coefficient = Peak I/I Flow / (Peak Rainfall Intensity over Tc * Catchment Area) 8 Hourly Wet‐Weather Peaking Factor: The ratio of peak hourly wet‐weather measured flow and average dry‐weather flow, Wet‐Weather Peaking Factor = Peak Hourly Wet‐Weather Measured Flow / Average Dry-Weather Flow 9 Instantaneous Wet‐Weather Peaking Factor: The ratio of peak wet‐weather measured flow and average dry‐weather flow, Wet‐Weather Peaking Factor = Peak Wet‐Weather Measured Flow / Average Dry-Weather Flow 2
1010 Civica Infrastructure Inc. www.civi.ca
Civica Infrastructures Inc. Kawartha Lakes Flow Monitoring Report
Appendix - A June 03, 2024
I/I Analysis Graph Station: 2-2
1011 Civica Infrastructure Inc. www.civi.ca
Civica Infrastructures Inc. Kawartha Lakes Flow Monitoring Report
Appendix - A June 03, 2024
Infiltration/Inflow Event Analysis Station: 2-2 Sep 11, 2022 15:50 – Sep 13, 2022 16:55, Total Precipitation: 21.75 mm (21,576,000.00 L) Station Details
Storm Details
Catchment Area
99.20 ha
Total Precipitation
21.75 mm (21,576,000.00 L)
Duration of Storm
25.08 hr
Time of Concentration (Tc) 1
35 min
Peak Precipitation Intensity Over Tc 2
7.30 mm/hr
Return Period over Tc 3
< 2 Yr
Measured Flow
I/I Flow
Time of Peak Measured Flow
Sep 12, 2022 08:10
Time of Peak I/I Flow (TD)
Sep 12, 2022 08:10
Estimated Dry Weather Flow at TD
11.15 L/s
Peak Measured Flow
31.55 L/s
Peak I/I Flow 4
20.40 L/s
Peak I/I Rate 5
0.21 L/s/ha
Peak Measured Depth
166.00 mm
Total I/I Flow Volume during event
323,410.80 L
Volumetric Coefficient (Cv%) 6
1.50%
Total Measured Flow Volume during Event
1,484,199.70 L
Peak I/I Coefficient 7
0.0102
Hourly Wet-Weather Peaking Factor 8
2.86
Instantaneous Wet-Weather Peaking Factor 9
3.64
1
Time of Concentration (Tc): The estimated time for the flow to travel from the furthest point in the upstream area to the point of monitoring, assume flow is travelling at 1.00 m/s Peak Precipitation Intensity Over Tc: The peak rainfall intensity for the duration of the storm with the time interval defined by time of concentration 3 Return Period over Tc: The estimated time to elapse before a storm of equal or greater intensity will likely occur again, based on design storm criteria 4 Peak I/I Flow: The greatest difference captured between measured flow and estimated dry weather flow, Peak I/I Flow = Maximum (Measured Flow – Estimated Dry Weather Flow) 5 Peak I/I Rate: A normalized peak I/I flow based on catchment area size, Peak I/I Rate = Peak I/I Flow / Catchment Area 6 Volumetric Coefficient (Cv%): The ratio of total I/I volume and total rainfall volume, Cv% = Total I/I Flow Volume / Total Precipitation Volume * 100% 7 Peak I/ I Coefficient: The ratio of peak I/I flow and peak rainfall intensity, Peak I/ I Coefficient = Peak I/I Flow / (Peak Rainfall Intensity over Tc * Catchment Area) 8 Hourly Wet‐Weather Peaking Factor: The ratio of peak hourly wet‐weather measured flow and average dry‐weather flow, Wet‐Weather Peaking Factor = Peak Hourly Wet‐Weather Measured Flow / Average Dry-Weather Flow 9 Instantaneous Wet‐Weather Peaking Factor: The ratio of peak wet‐weather measured flow and average dry‐weather flow, Wet‐Weather Peaking Factor = Peak Wet‐Weather Measured Flow / Average Dry-Weather Flow 2
1012 Civica Infrastructure Inc. www.civi.ca
Civica Infrastructures Inc. Kawartha Lakes Flow Monitoring Report
Appendix - A June 03, 2024
I/I Analysis Graph Station: 2-2
1013 Civica Infrastructure Inc. www.civi.ca
Civica Infrastructures Inc. Kawartha Lakes Flow Monitoring Report
Appendix - A June 03, 2024
Infiltration/Inflow Event Analysis Station: 2-2 Sep 17, 2022 19:35 – Sep 19, 2022 01:10, Total Precipitation: 24.50 mm (24,304,000.00 L) Station Details
Storm Details
Catchment Area
99.20 ha
Total Precipitation
24.50 mm (24,304,000.00 L)
Duration of Storm
5.58 hr
Time of Concentration (Tc) 1
35 min
Peak Precipitation Intensity Over Tc 2
15.40 mm/hr
Return Period over Tc 3
< 2 Yr
Measured Flow
I/I Flow
Time of Peak Measured Flow
Sep 18, 2022 11:25
Time of Peak I/I Flow (TD)
Sep 18, 2022 11:25
Estimated Dry Weather Flow at TD
10.98 L/s
Peak Measured Flow
33.15 L/s
Peak I/I Flow 4
22.17 L/s
Peak I/I Rate 5
0.22 L/s/ha
Peak Measured Depth
177.00 mm
Total I/I Flow Volume during event
471,905.00 L
Volumetric Coefficient (Cv%) 6
1.94%
Total Measured Flow Volume during Event
1,055,417.40 L
Peak I/I Coefficient 7
0.0052
Hourly Wet-Weather Peaking Factor 8
3.01
Instantaneous Wet-Weather Peaking Factor 9
3.61
1
Time of Concentration (Tc): The estimated time for the flow to travel from the furthest point in the upstream area to the point of monitoring, assume flow is travelling at 1.00 m/s Peak Precipitation Intensity Over Tc: The peak rainfall intensity for the duration of the storm with the time interval defined by time of concentration 3 Return Period over Tc: The estimated time to elapse before a storm of equal or greater intensity will likely occur again, based on design storm criteria 4 Peak I/I Flow: The greatest difference captured between measured flow and estimated dry weather flow, Peak I/I Flow = Maximum (Measured Flow – Estimated Dry Weather Flow) 5 Peak I/I Rate: A normalized peak I/I flow based on catchment area size, Peak I/I Rate = Peak I/I Flow / Catchment Area 6 Volumetric Coefficient (Cv%): The ratio of total I/I volume and total rainfall volume, Cv% = Total I/I Flow Volume / Total Precipitation Volume * 100% 7 Peak I/ I Coefficient: The ratio of peak I/I flow and peak rainfall intensity, Peak I/ I Coefficient = Peak I/I Flow / (Peak Rainfall Intensity over Tc * Catchment Area) 8 Hourly Wet‐Weather Peaking Factor: The ratio of peak hourly wet‐weather measured flow and average dry‐weather flow, Wet‐Weather Peaking Factor = Peak Hourly Wet‐Weather Measured Flow / Average Dry-Weather Flow 9 Instantaneous Wet‐Weather Peaking Factor: The ratio of peak wet‐weather measured flow and average dry‐weather flow, Wet‐Weather Peaking Factor = Peak Wet‐Weather Measured Flow / Average Dry-Weather Flow 2
1014 Civica Infrastructure Inc. www.civi.ca
Civica Infrastructures Inc. Kawartha Lakes Flow Monitoring Report
Appendix - A June 03, 2024
I/I Analysis Graph Station: 2-2
1015 Civica Infrastructure Inc. www.civi.ca
Civica Infrastructures Inc. Kawartha Lakes Flow Monitoring Report
Appendix - A June 03, 2024
Infiltration/Inflow Event Analysis Station: 2-2 Oct 12, 2022 08:40 – Oct 13, 2022 23:55, Total Precipitation: 20.75 mm (20,584,000.00 L) Station Details
Storm Details
Catchment Area
99.20 ha
Total Precipitation
20.75 mm (20,584,000.00 L)
Duration of Storm
15.25 hr
Time of Concentration (Tc) 1
35 min
Peak Precipitation Intensity Over Tc 2
6.90 mm/hr
Return Period over Tc 3
< 2 Yr
Measured Flow
I/I Flow
Time of Peak Measured Flow
Oct 13, 2022 04:05
Time of Peak I/I Flow (TD)
Oct 13, 2022 04:05
Estimated Dry Weather Flow at TD
5.90 L/s
Peak Measured Flow
27.78 L/s
Peak I/I Flow 4
21.88 L/s
Peak I/I Rate 5
0.22 L/s/ha
Peak Measured Depth
165.00 mm
Total I/I Flow Volume during event
271,563.80 L
Volumetric Coefficient (Cv%) 6
1.32%
Total Measured Flow Volume during Event
971,891.20 L
Peak I/I Coefficient 7
0.0116
Hourly Wet-Weather Peaking Factor 8
2.66
Instantaneous Wet-Weather Peaking Factor 9
3.90
1
Time of Concentration (Tc): The estimated time for the flow to travel from the furthest point in the upstream area to the point of monitoring, assume flow is travelling at 1.00 m/s Peak Precipitation Intensity Over Tc: The peak rainfall intensity for the duration of the storm with the time interval defined by time of concentration 3 Return Period over Tc: The estimated time to elapse before a storm of equal or greater intensity will likely occur again, based on design storm criteria 4 Peak I/I Flow: The greatest difference captured between measured flow and estimated dry weather flow, Peak I/I Flow = Maximum (Measured Flow – Estimated Dry Weather Flow) 5 Peak I/I Rate: A normalized peak I/I flow based on catchment area size, Peak I/I Rate = Peak I/I Flow / Catchment Area 6 Volumetric Coefficient (Cv%): The ratio of total I/I volume and total rainfall volume, Cv% = Total I/I Flow Volume / Total Precipitation Volume * 100% 7 Peak I/ I Coefficient: The ratio of peak I/I flow and peak rainfall intensity, Peak I/ I Coefficient = Peak I/I Flow / (Peak Rainfall Intensity over Tc * Catchment Area) 8 Hourly Wet‐Weather Peaking Factor: The ratio of peak hourly wet‐weather measured flow and average dry‐weather flow, Wet‐Weather Peaking Factor = Peak Hourly Wet‐Weather Measured Flow / Average Dry-Weather Flow 9 Instantaneous Wet‐Weather Peaking Factor: The ratio of peak wet‐weather measured flow and average dry‐weather flow, Wet‐Weather Peaking Factor = Peak Wet‐Weather Measured Flow / Average Dry-Weather Flow 2
1016 Civica Infrastructure Inc. www.civi.ca
Civica Infrastructures Inc. Kawartha Lakes Flow Monitoring Report
Appendix - A June 03, 2024
Activity Log Station: 2-2 Date Time
Type
Purpose of Visit
Comment
Calibration Measurement
25-Nov-2021 09:58:00 AM
Installation Log
INSTALL
OFF ROAD, PARK IN PARKING LOT
Yes
NOTE: - BATTERY SWAPPED 14-Dec-2021 01:15:00 PM
01-Feb-2022 11:15:00 AM
09-Feb-2022 12:40:00 PM
Maintenance Log
Maintenance Log
Maintenance Log
DATA DOWNLOADED SITE CALIBRATED DEBRIS CLEARED SENT TELEMETRY
CALIBRATION
Yes
CALIBRATION
Data downloaded Debris cleared Telemetry sent Ensured manual and sensor readings are satisfactory before leaving site
Yes
CALIBRATION
Data downloaded Debris cleared Telemetry sent Significant debris build up at the ring Ensured manual and sensor readings are satisfactory before leaving site
Yes
Note:
17-Mar-2022 11:25:00 AM
Maintenance Log
calibration
When we initially connected to the data downloader, the logger connected but did not download. We had no success connecting to data downloaded or pmac afterwards. We did not swap because we felt we could connect at next site visit.
Yes
site manually calibrated 03-May-2022 12:25:00 PM
Maintenance Log
Calibration
11-May-2022 09:15:00 AM
Maintenance Log
CALIBRATION
24-May-2022 03:22:00 PM
Maintenance Log
CALIBRATION
08-Jun-2022 08:51:00 AM
27-Jun-2022 11:56:00 AM
05-Jul-2022 11:18:00 AM
Maintenance Log
Maintenance Log
Maintenance Log
Yes DATA DOWNLOADED, TELEMETRY SENT, SITE CALIBRATED, PHOTOS TAKEN
Yes Yes
CALIBRATION
DATA DOWNLOADED, SITE CALIBRATED, DEBRIS CLEARED, TELEMETRY SENT
Yes
CALIBRATION
DATA DOWNLOADED SITE CALIBRATED DEBRIS CALIBRATED TELEMETRY SENT
Yes
calibration
DATA DOWNLOADED, SITE CALIBRATED, DEBRIS CLEARED, TELEMETRY SENT
Yes
1017 Civica Infrastructure Inc. www.civi.ca
Civica Infrastructures Inc. Kawartha Lakes Flow Monitoring Report Date Time
20-Jul-2022 09:57:00 AM
15-Sep-2022 09:33:00 AM
21-Sep-2022 10:29:00 AM
03-Oct-2022 11:24:00 AM
21-Oct-2022 10:40:00 AM
21-Oct-2022 10:40:00 AM
03-Nov-2022 12:20:00 PM
Appendix - A June 03, 2024 Type
Maintenance Log
Maintenance Log
Maintenance Log
Maintenance Log
Maintenance Log
Maintenance Log
Maintenance Log
Purpose of Visit
Comment
Calibration Measurement
CALIBRATION
DATA DOWNLOADED, SITE CALIBRATED, DEBRIS CLEARED, TELEMETRY SENT
Yes
CALIBRATION
DATA DOWNLOADED, SITE CALIBRATED, DEBRIS CLEARED, TELEMETRY SENT, PHOTOS AND VIDEO TAKEN
Yes
CALIBRATION
DATA DOWNLOADED, SITE CALIBRATED, DEBRIS CLEARED, TELEMETRY SENT
Yes
CALIBRATION
DATA DOWNLOADED, SITE CALIBRATED, DEBRIS CLEARED TELEMETRY SENT AND CHECKED, BATTERY SWAPPED PHOTO AND VIDEO TAKEN
Yes
Calibration
DATA DOWNLOADED TELEMETRY SENT SITE CALIBRATED PHOTOS TAKEN
Yes
Calibration
DATA DOWNLOADED TELEMETRY SENT SITE CALIBRATED PHOTOS TAKEN
Yes
CALIBRATION
DATA DOWNLOADED TELEMETRY SENT PHOTOS TAKEN SITE CALIBRATED
Yes
1018 Civica Infrastructure Inc. www.civi.ca
Civica Infrastructures Inc. Kawartha Lakes Flow Monitoring Report
Appendix - A June 03, 2024
Aggregate Data Station: 2-3
Level Date From
Date To
Days
Min (m)
Avg (m)
Max (m)
Count
Time of Min1
Time of Max1
Nov 18, 2021
Nov 04, 2022
352
0.02
0.06
0.17
101,180
Mon Aug 29, 2022 15:15
Tue Jul 12, 2022 03:05
Velocity Date From
Date To
Days
Min (m/s)
Avg (m/s)
Max (m/s)
Count
Time of Min1
Time of Max1
Nov 18, 2021
Nov 04, 2022
352
0.00
0.00
0.13
101,180
Mon Aug 22, 2022 05:05
Thu Feb 17, 2022 23:40
Flow Date From
Date To
Days
Min (L/s)
Avg (L/s)
Max (L/s)
Total Volume (1,000,000 L)
Count
Time of Min1
Time of Max1
Nov 18, 2021
Nov 04, 2022
352
0.37
2.77
19.78
84.23
101,180
Sun Feb 06, 2022 03:25
Sun Jun 12, 2022 14:55
Precipitation
1
Date From
Date To
Days
Min (mm)
Avg (mm)
Max (mm)
Sum (mm)
Count
Time of Min1
Time of Max1
Nov 18, 2021
Nov 04, 2022
342
0.00
0.01
9.75
667.95
97,815
Thu Nov 18, 2021 10:15
Mon Jul 25, 2022 00:00
Time of Min and Time of Max will be displayed by first occurrence
1019 Civica Infrastructure Inc. www.civi.ca
Civica Infrastructures Inc. Kawartha Lakes Flow Monitoring Report
Appendix - A June 03, 2024
Sanitary Report Station: 2-3
1
Average Dry Weather Flow (L/s)
Average Dry Weather Flow (L/c/d)
Average Daily Minimum Dry Weather Flow (L/s)
Average Daily Peak Dry Weather Flow (L/s)
2.284
176.231
1.533
3.679
Peaking Factor
Groundwater Infiltration (L/s)1
Groundwater Infiltration (L/ha/d)
% of GWI in Average DWF
1.610
1.303
4,633.924
57.050
Groundwater infiltration (GWI) is assumed as 85% of the daily minimum flow averaged over the monitoring period
1020 Civica Infrastructure Inc. www.civi.ca
Civica Infrastructures Inc. Kawartha Lakes Flow Monitoring Report
Appendix - A June 03, 2024
Data Chart Station: 2-3 Nov 18, 2021 – Nov 30, 2021
1021 Civica Infrastructure Inc. www.civi.ca
Civica Infrastructures Inc. Kawartha Lakes Flow Monitoring Report
Appendix - A June 03, 2024
Data Chart Station: 2-3 Dec 01, 2021 – Dec 31, 2021
1022 Civica Infrastructure Inc. www.civi.ca
Civica Infrastructures Inc. Kawartha Lakes Flow Monitoring Report
Appendix - A June 03, 2024
Data Chart Station: 2-3 Jan 01, 2022 – Jan 31, 2022
1023 Civica Infrastructure Inc. www.civi.ca
Civica Infrastructures Inc. Kawartha Lakes Flow Monitoring Report
Appendix - A June 03, 2024
Data Chart Station: 2-3 Feb 01, 2022 – Feb 28, 2022
1024 Civica Infrastructure Inc. www.civi.ca
Civica Infrastructures Inc. Kawartha Lakes Flow Monitoring Report
Appendix - A June 03, 2024
Data Chart Station: 2-3 Mar 01, 2022 – Mar 31, 2022
1025 Civica Infrastructure Inc. www.civi.ca
Civica Infrastructures Inc. Kawartha Lakes Flow Monitoring Report
Appendix - A June 03, 2024
Data Chart Station: 2-3 Apr 01, 2022 – Apr 30, 2022
1026 Civica Infrastructure Inc. www.civi.ca
Civica Infrastructures Inc. Kawartha Lakes Flow Monitoring Report
Appendix - A June 03, 2024
Data Chart Station: 2-3 May 01, 2022 – May 31, 2022
1027 Civica Infrastructure Inc. www.civi.ca
Civica Infrastructures Inc. Kawartha Lakes Flow Monitoring Report
Appendix - A June 03, 2024
Data Chart Station: 2-3 Jun 01, 2022 – Jun 30, 2022
1028 Civica Infrastructure Inc. www.civi.ca
Civica Infrastructures Inc. Kawartha Lakes Flow Monitoring Report
Appendix - A June 03, 2024
Data Chart Station: 2-3 Jul 01, 2022 – Jul 31, 2022
1029 Civica Infrastructure Inc. www.civi.ca
Civica Infrastructures Inc. Kawartha Lakes Flow Monitoring Report
Appendix - A June 03, 2024
Data Chart Station: 2-3 Aug 01, 2022 – Aug 31, 2022
1030 Civica Infrastructure Inc. www.civi.ca
Civica Infrastructures Inc. Kawartha Lakes Flow Monitoring Report
Appendix - A June 03, 2024
Data Chart Station: 2-3 Sep 01, 2022 – Sep 30, 2022
1031 Civica Infrastructure Inc. www.civi.ca
Civica Infrastructures Inc. Kawartha Lakes Flow Monitoring Report
Appendix - A June 03, 2024
Data Chart Station: 2-3 Oct 01, 2022 – Oct 31, 2022
1032 Civica Infrastructure Inc. www.civi.ca
Civica Infrastructures Inc. Kawartha Lakes Flow Monitoring Report
Appendix - A June 03, 2024
Data Chart Station: 2-3 Nov 01, 2022 – Nov 04, 2022
1033 Civica Infrastructure Inc. www.civi.ca
Civica Infrastructures Inc. Kawartha Lakes Flow Monitoring Report
Appendix - A June 03, 2024
I/I Analysis Table
1
Event1
Total Precipitation (mm)
Duration (hours)
Peak Intensity Over Tc at Station (mm/hr)
Feb 16, 2022
18.00
12.67
Apr 13, 2022
17.25
May 26, 2022
2-3 Measured Peak Flow (L/s)
Peak I/I Flow (L/s)
Peak I/I Rate (L/s/ha)
Volumetric Runoff Coefficient (CV%)
Peaking Factor (PF)
3.00
17.73
15.33
0.63
17.67 %
8.07
28.67
9.00
5.10
1.75
0.07
0.63 %
0.61
20.25
27.50
12.00
6.16
3.46
0.14
1.32 %
1.73
Jun 06, 2022
30.00
32.42
9.00
9.05
5.75
0.24
3.19 %
2.10
Jun 11, 2022
41.50
25.08
24.00
19.78
16.72
0.69
10.07 %
5.93
Jul 12, 2022
15.50
7.75
22.50
3.56
2.26
0.09
0.46 %
1.25
Jul 18, 2022
21.50
43.25
1.00
9.35
7.29
0.30
5.65 %
4.15
Aug 17, 2022
17.50
1.83
29.50
3.52
1.64
0.07
0.17 %
1.18
Aug 21, 2022
17.50
30.50
10.50
4.42
2.57
0.11
2.40 %
1.58
Aug 25, 2022
16.25
8.58
24.00
7.71
5.52
0.23
2.07 %
3.26
Aug 29, 2022
29.00
2.50
39.50
10.75
8.65
0.36
3.91 %
4.82
Sep 12, 2022
21.75
25.08
8.00
4.89
2.33
0.10
1.11 %
1.04
Sep 18, 2022
24.50
5.58
17.00
9.69
7.34
0.30
2.91 %
3.78
Oct 12, 2022
20.75
15.25
7.50
5.54
3.68
0.15
1.62 %
2.28
Average
22.23
19.05
15.46
8.38
6.02
0.25
3.80 %
2.98
Maximum
41.50
43.25
39.50
19.78
16.72
0.69
17.67 %
8.07
Flow KPIs
Measured Storms
Station: 2-3
An event is a storm with a minimum volume of 15mm and a minimum inter-event dry period of 12 hours
1034 Civica Infrastructure Inc. www.civi.ca
Civica Infrastructures Inc. Kawartha Lakes Flow Monitoring Report
Appendix - A June 03, 2024
I/I Analysis Graph Station: 2-3
1035 Civica Infrastructure Inc. www.civi.ca
Civica Infrastructures Inc. Kawartha Lakes Flow Monitoring Report
Appendix - A June 03, 2024
Infiltration/Inflow Event Analysis Station: 2-3 Feb 16, 2022 11:00 – Feb 17, 2022 23:40, Total Precipitation: 18.00 mm (4,374,000.00 L) Station Details
Storm Details
Catchment Area
24.30 ha
Total Precipitation
18.00 mm (4,374,000.00 L)
Duration of Storm
12.67 hr
Time of Concentration (Tc) 1
30 min
Peak Precipitation Intensity Over Tc 2
3.00 mm/hr
Return Period over Tc 3
< 2 Yr
Measured Flow
I/I Flow
Time of Peak Measured Flow
Feb 17, 2022 11:20
Time of Peak I/I Flow (TD)
Feb 17, 2022 11:25
Estimated Dry Weather Flow at TD
2.39 L/s
Peak Measured Flow
17.73 L/s
Peak I/I Flow 4
15.33 L/s
Peak I/I Rate 5
0.63 L/s/ha
Peak Measured Depth
146.70 mm
Total I/I Flow Volume during event
773,060.60 L
Volumetric Coefficient (Cv%) 6
17.67%
Total Measured Flow Volume during Event
942,439.00 L
Peak I/I Coefficient 7
0.0757
Hourly Wet-Weather Peaking Factor 8
9.08
Instantaneous Wet-Weather Peaking Factor 9
9.32
1
Time of Concentration (Tc): The estimated time for the flow to travel from the furthest point in the upstream area to the point of monitoring, assume flow is travelling at 1.00 m/s Peak Precipitation Intensity Over Tc: The peak rainfall intensity for the duration of the storm with the time interval defined by time of concentration 3 Return Period over Tc: The estimated time to elapse before a storm of equal or greater intensity will likely occur again, based on design storm criteria 4 Peak I/I Flow: The greatest difference captured between measured flow and estimated dry weather flow, Peak I/I Flow = Maximum (Measured Flow – Estimated Dry Weather Flow) 5 Peak I/I Rate: A normalized peak I/I flow based on catchment area size, Peak I/I Rate = Peak I/I Flow / Catchment Area 6 Volumetric Coefficient (Cv%): The ratio of total I/I volume and total rainfall volume, Cv% = Total I/I Flow Volume / Total Precipitation Volume * 100% 7 Peak I/ I Coefficient: The ratio of peak I/I flow and peak rainfall intensity, Peak I/ I Coefficient = Peak I/I Flow / (Peak Rainfall Intensity over Tc * Catchment Area) 8 Hourly Wet‐Weather Peaking Factor: The ratio of peak hourly wet‐weather measured flow and average dry‐weather flow, Wet‐Weather Peaking Factor = Peak Hourly Wet‐Weather Measured Flow / Average Dry-Weather Flow 9 Instantaneous Wet‐Weather Peaking Factor: The ratio of peak wet‐weather measured flow and average dry‐weather flow, Wet‐Weather Peaking Factor = Peak Wet‐Weather Measured Flow / Average Dry-Weather Flow 2
1036 Civica Infrastructure Inc. www.civi.ca
Civica Infrastructures Inc. Kawartha Lakes Flow Monitoring Report
Appendix - A June 03, 2024
I/I Analysis Graph Station: 2-3
1037 Civica Infrastructure Inc. www.civi.ca
Civica Infrastructures Inc. Kawartha Lakes Flow Monitoring Report
Appendix - A June 03, 2024
Infiltration/Inflow Event Analysis Station: 2-3 Apr 12, 2022 17:25 – Apr 14, 2022 22:05, Total Precipitation: 17.25 mm (4,191,750.00 L) Station Details
Storm Details
Catchment Area
24.30 ha
Total Precipitation
17.25 mm (4,191,750.00 L)
Duration of Storm
28.67 hr
Time of Concentration (Tc) 1
30 min
Peak Precipitation Intensity Over Tc 2
9.00 mm/hr
Return Period over Tc 3
< 2 Yr
Measured Flow
I/I Flow
Time of Peak Measured Flow
Apr 14, 2022 10:00
Time of Peak I/I Flow (TD)
Apr 13, 2022 21:05
Estimated Dry Weather Flow at TD
3.14 L/s
Peak Measured Flow
5.10 L/s
Peak I/I Flow 4
1.75 L/s
Peak I/I Rate 5
0.07 L/s/ha
Peak Measured Depth
103.20 mm
Total I/I Flow Volume during event
26,304.30 L
Volumetric Coefficient (Cv%) 6
0.63%
Total Measured Flow Volume during Event
448,114.50 L
Peak I/I Coefficient 7
0.0029
Hourly Wet-Weather Peaking Factor 8
1.59
Instantaneous Wet-Weather Peaking Factor 9
1.78
1
Time of Concentration (Tc): The estimated time for the flow to travel from the furthest point in the upstream area to the point of monitoring, assume flow is travelling at 1.00 m/s Peak Precipitation Intensity Over Tc: The peak rainfall intensity for the duration of the storm with the time interval defined by time of concentration 3 Return Period over Tc: The estimated time to elapse before a storm of equal or greater intensity will likely occur again, based on design storm criteria 4 Peak I/I Flow: The greatest difference captured between measured flow and estimated dry weather flow, Peak I/I Flow = Maximum (Measured Flow – Estimated Dry Weather Flow) 5 Peak I/I Rate: A normalized peak I/I flow based on catchment area size, Peak I/I Rate = Peak I/I Flow / Catchment Area 6 Volumetric Coefficient (Cv%): The ratio of total I/I volume and total rainfall volume, Cv% = Total I/I Flow Volume / Total Precipitation Volume * 100% 7 Peak I/ I Coefficient: The ratio of peak I/I flow and peak rainfall intensity, Peak I/ I Coefficient = Peak I/I Flow / (Peak Rainfall Intensity over Tc * Catchment Area) 8 Hourly Wet‐Weather Peaking Factor: The ratio of peak hourly wet‐weather measured flow and average dry‐weather flow, Wet‐Weather Peaking Factor = Peak Hourly Wet‐Weather Measured Flow / Average Dry-Weather Flow 9 Instantaneous Wet‐Weather Peaking Factor: The ratio of peak wet‐weather measured flow and average dry‐weather flow, Wet‐Weather Peaking Factor = Peak Wet‐Weather Measured Flow / Average Dry-Weather Flow 2
1038 Civica Infrastructure Inc. www.civi.ca
Civica Infrastructures Inc. Kawartha Lakes Flow Monitoring Report
Appendix - A June 03, 2024
I/I Analysis Graph Station: 2-3
1039 Civica Infrastructure Inc. www.civi.ca
Civica Infrastructures Inc. Kawartha Lakes Flow Monitoring Report
Appendix - A June 03, 2024
Infiltration/Inflow Event Analysis Station: 2-3 May 26, 2022 07:30 – May 28, 2022 11:00, Total Precipitation: 20.25 mm (4,920,750.00 L) Station Details
Storm Details
Catchment Area
24.30 ha
Total Precipitation
20.25 mm (4,920,750.00 L)
Duration of Storm
27.50 hr
Time of Concentration (Tc) 1
30 min
Peak Precipitation Intensity Over Tc 2
12.00 mm/hr
Return Period over Tc 3
< 2 Yr
Measured Flow
I/I Flow
Time of Peak Measured Flow
May 27, 2022 18:55
Time of Peak I/I Flow (TD)
May 27, 2022 19:20
Estimated Dry Weather Flow at TD
2.71 L/s
Peak Measured Flow
6.16 L/s
Peak I/I Flow 4
3.46 L/s
Peak I/I Rate 5
0.14 L/s/ha
Peak Measured Depth
116.70 mm
Total I/I Flow Volume during event
64,980.50 L
Volumetric Coefficient (Cv%) 6
1.32%
Total Measured Flow Volume during Event
349,416.60 L
Peak I/I Coefficient 7
0.0043
Hourly Wet-Weather Peaking Factor 8
2.99
Instantaneous Wet-Weather Peaking Factor 9
3.09
1
Time of Concentration (Tc): The estimated time for the flow to travel from the furthest point in the upstream area to the point of monitoring, assume flow is travelling at 1.00 m/s Peak Precipitation Intensity Over Tc: The peak rainfall intensity for the duration of the storm with the time interval defined by time of concentration 3 Return Period over Tc: The estimated time to elapse before a storm of equal or greater intensity will likely occur again, based on design storm criteria 4 Peak I/I Flow: The greatest difference captured between measured flow and estimated dry weather flow, Peak I/I Flow = Maximum (Measured Flow – Estimated Dry Weather Flow) 5 Peak I/I Rate: A normalized peak I/I flow based on catchment area size, Peak I/I Rate = Peak I/I Flow / Catchment Area 6 Volumetric Coefficient (Cv%): The ratio of total I/I volume and total rainfall volume, Cv% = Total I/I Flow Volume / Total Precipitation Volume * 100% 7 Peak I/ I Coefficient: The ratio of peak I/I flow and peak rainfall intensity, Peak I/ I Coefficient = Peak I/I Flow / (Peak Rainfall Intensity over Tc * Catchment Area) 8 Hourly Wet‐Weather Peaking Factor: The ratio of peak hourly wet‐weather measured flow and average dry‐weather flow, Wet‐Weather Peaking Factor = Peak Hourly Wet‐Weather Measured Flow / Average Dry-Weather Flow 9 Instantaneous Wet‐Weather Peaking Factor: The ratio of peak wet‐weather measured flow and average dry‐weather flow, Wet‐Weather Peaking Factor = Peak Wet‐Weather Measured Flow / Average Dry-Weather Flow 2
1040 Civica Infrastructure Inc. www.civi.ca
Civica Infrastructures Inc. Kawartha Lakes Flow Monitoring Report
Appendix - A June 03, 2024
I/I Analysis Graph Station: 2-3
1041 Civica Infrastructure Inc. www.civi.ca
Civica Infrastructures Inc. Kawartha Lakes Flow Monitoring Report
Appendix - A June 03, 2024
Infiltration/Inflow Event Analysis Station: 2-3 Jun 05, 2022 18:20 – Jun 08, 2022 02:45, Total Precipitation: 30.00 mm (7,290,000.00 L) Station Details
Storm Details
Catchment Area
24.30 ha
Total Precipitation
30.00 mm (7,290,000.00 L)
Duration of Storm
32.42 hr
Time of Concentration (Tc) 1
30 min
Peak Precipitation Intensity Over Tc 2
9.00 mm/hr
Return Period over Tc 3
< 2 Yr
Measured Flow
I/I Flow
Time of Peak Measured Flow
Jun 07, 2022 09:35
Time of Peak I/I Flow (TD)
Jun 07, 2022 15:05
Estimated Dry Weather Flow at TD
3.00 L/s
Peak Measured Flow
9.05 L/s
Peak I/I Flow 4
5.75 L/s
Peak I/I Rate 5
0.24 L/s/ha
Peak Measured Depth
124.70 mm
Total I/I Flow Volume during event
232,717.90 L
Volumetric Coefficient (Cv%) 6
3.19%
Total Measured Flow Volume during Event
670,360.60 L
Peak I/I Coefficient 7
0.0095
Hourly Wet-Weather Peaking Factor 8
3.18
Instantaneous Wet-Weather Peaking Factor 9
3.31
1
Time of Concentration (Tc): The estimated time for the flow to travel from the furthest point in the upstream area to the point of monitoring, assume flow is travelling at 1.00 m/s Peak Precipitation Intensity Over Tc: The peak rainfall intensity for the duration of the storm with the time interval defined by time of concentration 3 Return Period over Tc: The estimated time to elapse before a storm of equal or greater intensity will likely occur again, based on design storm criteria 4 Peak I/I Flow: The greatest difference captured between measured flow and estimated dry weather flow, Peak I/I Flow = Maximum (Measured Flow – Estimated Dry Weather Flow) 5 Peak I/I Rate: A normalized peak I/I flow based on catchment area size, Peak I/I Rate = Peak I/I Flow / Catchment Area 6 Volumetric Coefficient (Cv%): The ratio of total I/I volume and total rainfall volume, Cv% = Total I/I Flow Volume / Total Precipitation Volume * 100% 7 Peak I/ I Coefficient: The ratio of peak I/I flow and peak rainfall intensity, Peak I/ I Coefficient = Peak I/I Flow / (Peak Rainfall Intensity over Tc * Catchment Area) 8 Hourly Wet‐Weather Peaking Factor: The ratio of peak hourly wet‐weather measured flow and average dry‐weather flow, Wet‐Weather Peaking Factor = Peak Hourly Wet‐Weather Measured Flow / Average Dry-Weather Flow 9 Instantaneous Wet‐Weather Peaking Factor: The ratio of peak wet‐weather measured flow and average dry‐weather flow, Wet‐Weather Peaking Factor = Peak Wet‐Weather Measured Flow / Average Dry-Weather Flow 2
1042 Civica Infrastructure Inc. www.civi.ca
Civica Infrastructures Inc. Kawartha Lakes Flow Monitoring Report
Appendix - A June 03, 2024
I/I Analysis Graph Station: 2-3
1043 Civica Infrastructure Inc. www.civi.ca
Civica Infrastructures Inc. Kawartha Lakes Flow Monitoring Report
Appendix - A June 03, 2024
Infiltration/Inflow Event Analysis Station: 2-3 Jun 11, 2022 01:55 – Jun 13, 2022 03:00, Total Precipitation: 41.50 mm (10,084,500.00 L) Station Details
Storm Details
Catchment Area
24.30 ha
Total Precipitation
41.50 mm (10,084,500.00 L)
Duration of Storm
25.08 hr
Time of Concentration (Tc) 1
30 min
Peak Precipitation Intensity Over Tc 2
24.00 mm/hr
Return Period over Tc 3
< 2 Yr
Measured Flow
I/I Flow
Time of Peak Measured Flow
Jun 12, 2022 14:55
Time of Peak I/I Flow (TD)
Jun 12, 2022 15:25
Estimated Dry Weather Flow at TD
3.06 L/s
Peak Measured Flow
19.78 L/s
Peak I/I Flow 4
16.72 L/s
Peak I/I Rate 5
0.69 L/s/ha
Peak Measured Depth
154.70 mm
Total I/I Flow Volume during event
1,015,911.70 L
Volumetric Coefficient (Cv%) 6
10.07%
Total Measured Flow Volume during Event
1,393,150.70 L
Peak I/I Coefficient 7
0.0103
Hourly Wet-Weather Peaking Factor 8
6.87
Instantaneous Wet-Weather Peaking Factor 9
7.02
1
Time of Concentration (Tc): The estimated time for the flow to travel from the furthest point in the upstream area to the point of monitoring, assume flow is travelling at 1.00 m/s Peak Precipitation Intensity Over Tc: The peak rainfall intensity for the duration of the storm with the time interval defined by time of concentration 3 Return Period over Tc: The estimated time to elapse before a storm of equal or greater intensity will likely occur again, based on design storm criteria 4 Peak I/I Flow: The greatest difference captured between measured flow and estimated dry weather flow, Peak I/I Flow = Maximum (Measured Flow – Estimated Dry Weather Flow) 5 Peak I/I Rate: A normalized peak I/I flow based on catchment area size, Peak I/I Rate = Peak I/I Flow / Catchment Area 6 Volumetric Coefficient (Cv%): The ratio of total I/I volume and total rainfall volume, Cv% = Total I/I Flow Volume / Total Precipitation Volume * 100% 7 Peak I/ I Coefficient: The ratio of peak I/I flow and peak rainfall intensity, Peak I/ I Coefficient = Peak I/I Flow / (Peak Rainfall Intensity over Tc * Catchment Area) 8 Hourly Wet‐Weather Peaking Factor: The ratio of peak hourly wet‐weather measured flow and average dry‐weather flow, Wet‐Weather Peaking Factor = Peak Hourly Wet‐Weather Measured Flow / Average Dry-Weather Flow 9 Instantaneous Wet‐Weather Peaking Factor: The ratio of peak wet‐weather measured flow and average dry‐weather flow, Wet‐Weather Peaking Factor = Peak Wet‐Weather Measured Flow / Average Dry-Weather Flow 2
1044 Civica Infrastructure Inc. www.civi.ca
Civica Infrastructures Inc. Kawartha Lakes Flow Monitoring Report
Appendix - A June 03, 2024
I/I Analysis Graph Station: 2-3
1045 Civica Infrastructure Inc. www.civi.ca
Civica Infrastructures Inc. Kawartha Lakes Flow Monitoring Report
Appendix - A June 03, 2024
Infiltration/Inflow Event Analysis Station: 2-3 Jul 11, 2022 14:25 – Jul 12, 2022 22:10, Total Precipitation: 15.50 mm (3,766,500.00 L) Station Details
Storm Details
Catchment Area
24.30 ha
Total Precipitation
15.50 mm (3,766,500.00 L)
Duration of Storm
7.75 hr
Time of Concentration (Tc) 1
30 min
Peak Precipitation Intensity Over Tc 2
22.50 mm/hr
Return Period over Tc 3
< 2 Yr
Measured Flow
I/I Flow
Time of Peak Measured Flow
Jul 12, 2022 10:30
Time of Peak I/I Flow (TD)
Jul 12, 2022 03:40
Estimated Dry Weather Flow at TD
1.19 L/s
Peak Measured Flow
3.56 L/s
Peak I/I Flow 4
2.26 L/s
Peak I/I Rate 5
0.09 L/s/ha
Peak Measured Depth
166.70 mm
Total I/I Flow Volume during event
17,425.40 L
Volumetric Coefficient (Cv%) 6
0.46%
Total Measured Flow Volume during Event
145,852.80 L
Peak I/I Coefficient 7
0.0015
Hourly Wet-Weather Peaking Factor 8
1.65
Instantaneous Wet-Weather Peaking Factor 9
1.98
1
Time of Concentration (Tc): The estimated time for the flow to travel from the furthest point in the upstream area to the point of monitoring, assume flow is travelling at 1.00 m/s Peak Precipitation Intensity Over Tc: The peak rainfall intensity for the duration of the storm with the time interval defined by time of concentration 3 Return Period over Tc: The estimated time to elapse before a storm of equal or greater intensity will likely occur again, based on design storm criteria 4 Peak I/I Flow: The greatest difference captured between measured flow and estimated dry weather flow, Peak I/I Flow = Maximum (Measured Flow – Estimated Dry Weather Flow) 5 Peak I/I Rate: A normalized peak I/I flow based on catchment area size, Peak I/I Rate = Peak I/I Flow / Catchment Area 6 Volumetric Coefficient (Cv%): The ratio of total I/I volume and total rainfall volume, Cv% = Total I/I Flow Volume / Total Precipitation Volume * 100% 7 Peak I/ I Coefficient: The ratio of peak I/I flow and peak rainfall intensity, Peak I/ I Coefficient = Peak I/I Flow / (Peak Rainfall Intensity over Tc * Catchment Area) 8 Hourly Wet‐Weather Peaking Factor: The ratio of peak hourly wet‐weather measured flow and average dry‐weather flow, Wet‐Weather Peaking Factor = Peak Hourly Wet‐Weather Measured Flow / Average Dry-Weather Flow 9 Instantaneous Wet‐Weather Peaking Factor: The ratio of peak wet‐weather measured flow and average dry‐weather flow, Wet‐Weather Peaking Factor = Peak Wet‐Weather Measured Flow / Average Dry-Weather Flow 2
1046 Civica Infrastructure Inc. www.civi.ca
Civica Infrastructures Inc. Kawartha Lakes Flow Monitoring Report
Appendix - A June 03, 2024
I/I Analysis Graph Station: 2-3
1047 Civica Infrastructure Inc. www.civi.ca
Civica Infrastructures Inc. Kawartha Lakes Flow Monitoring Report
Appendix - A June 03, 2024
Infiltration/Inflow Event Analysis Station: 2-3 Jul 17, 2022 16:10 – Jul 20, 2022 11:25, Total Precipitation: 21.50 mm (5,224,500.00 L) Station Details
Storm Details
Catchment Area
24.30 ha
Total Precipitation
21.50 mm (5,224,500.00 L)
Duration of Storm
43.25 hr
Time of Concentration (Tc) 1
30 min
Peak Precipitation Intensity Over Tc 2
1.00 mm/hr
Return Period over Tc 3
< 2 Yr
Measured Flow
I/I Flow
Time of Peak Measured Flow
Jul 18, 2022 11:30
Time of Peak I/I Flow (TD)
Jul 18, 2022 11:30
Estimated Dry Weather Flow at TD
2.05 L/s
Peak Measured Flow
9.35 L/s
Peak I/I Flow 4
7.29 L/s
Peak I/I Rate 5
0.30 L/s/ha
Peak Measured Depth
116.70 mm
Total I/I Flow Volume during event
294,996.00 L
Volumetric Coefficient (Cv%) 6
5.65%
Total Measured Flow Volume during Event
645,042.10 L
Peak I/I Coefficient 7
0.1080
Hourly Wet-Weather Peaking Factor 8
4.33
Instantaneous Wet-Weather Peaking Factor 9
5.32
1
Time of Concentration (Tc): The estimated time for the flow to travel from the furthest point in the upstream area to the point of monitoring, assume flow is travelling at 1.00 m/s Peak Precipitation Intensity Over Tc: The peak rainfall intensity for the duration of the storm with the time interval defined by time of concentration 3 Return Period over Tc: The estimated time to elapse before a storm of equal or greater intensity will likely occur again, based on design storm criteria 4 Peak I/I Flow: The greatest difference captured between measured flow and estimated dry weather flow, Peak I/I Flow = Maximum (Measured Flow – Estimated Dry Weather Flow) 5 Peak I/I Rate: A normalized peak I/I flow based on catchment area size, Peak I/I Rate = Peak I/I Flow / Catchment Area 6 Volumetric Coefficient (Cv%): The ratio of total I/I volume and total rainfall volume, Cv% = Total I/I Flow Volume / Total Precipitation Volume * 100% 7 Peak I/ I Coefficient: The ratio of peak I/I flow and peak rainfall intensity, Peak I/ I Coefficient = Peak I/I Flow / (Peak Rainfall Intensity over Tc * Catchment Area) 8 Hourly Wet‐Weather Peaking Factor: The ratio of peak hourly wet‐weather measured flow and average dry‐weather flow, Wet‐Weather Peaking Factor = Peak Hourly Wet‐Weather Measured Flow / Average Dry-Weather Flow 9 Instantaneous Wet‐Weather Peaking Factor: The ratio of peak wet‐weather measured flow and average dry‐weather flow, Wet‐Weather Peaking Factor = Peak Wet‐Weather Measured Flow / Average Dry-Weather Flow 2
1048 Civica Infrastructure Inc. www.civi.ca
Civica Infrastructures Inc. Kawartha Lakes Flow Monitoring Report
Appendix - A June 03, 2024
I/I Analysis Graph Station: 2-3
1049 Civica Infrastructure Inc. www.civi.ca
Civica Infrastructures Inc. Kawartha Lakes Flow Monitoring Report
Appendix - A June 03, 2024
Infiltration/Inflow Event Analysis Station: 2-3 Aug 17, 2022 03:20 – Aug 18, 2022 05:10, Total Precipitation: 17.50 mm (4,252,500.00 L) Station Details
Storm Details
Catchment Area
24.30 ha
Total Precipitation
17.50 mm (4,252,500.00 L)
Duration of Storm
1.83 hr
Time of Concentration (Tc) 1
30 min
Peak Precipitation Intensity Over Tc 2
29.50 mm/hr
Return Period over Tc 3
< 2 Yr
Measured Flow
I/I Flow
Time of Peak Measured Flow
Aug 17, 2022 15:50
Time of Peak I/I Flow (TD)
Aug 17, 2022 15:50
Estimated Dry Weather Flow at TD
1.88 L/s
Peak Measured Flow
3.52 L/s
Peak I/I Flow 4
1.64 L/s
Peak I/I Rate 5
0.07 L/s/ha
Peak Measured Depth
159.70 mm
Total I/I Flow Volume during event
7,217.00 L
Volumetric Coefficient (Cv%) 6
0.17%
Total Measured Flow Volume during Event
76,656.00 L
Peak I/I Coefficient 7
0.0008
Hourly Wet-Weather Peaking Factor 8
1.85
Instantaneous Wet-Weather Peaking Factor 9
2.54
1
Time of Concentration (Tc): The estimated time for the flow to travel from the furthest point in the upstream area to the point of monitoring, assume flow is travelling at 1.00 m/s Peak Precipitation Intensity Over Tc: The peak rainfall intensity for the duration of the storm with the time interval defined by time of concentration 3 Return Period over Tc: The estimated time to elapse before a storm of equal or greater intensity will likely occur again, based on design storm criteria 4 Peak I/I Flow: The greatest difference captured between measured flow and estimated dry weather flow, Peak I/I Flow = Maximum (Measured Flow – Estimated Dry Weather Flow) 5 Peak I/I Rate: A normalized peak I/I flow based on catchment area size, Peak I/I Rate = Peak I/I Flow / Catchment Area 6 Volumetric Coefficient (Cv%): The ratio of total I/I volume and total rainfall volume, Cv% = Total I/I Flow Volume / Total Precipitation Volume * 100% 7 Peak I/ I Coefficient: The ratio of peak I/I flow and peak rainfall intensity, Peak I/ I Coefficient = Peak I/I Flow / (Peak Rainfall Intensity over Tc * Catchment Area) 8 Hourly Wet‐Weather Peaking Factor: The ratio of peak hourly wet‐weather measured flow and average dry‐weather flow, Wet‐Weather Peaking Factor = Peak Hourly Wet‐Weather Measured Flow / Average Dry-Weather Flow 9 Instantaneous Wet‐Weather Peaking Factor: The ratio of peak wet‐weather measured flow and average dry‐weather flow, Wet‐Weather Peaking Factor = Peak Wet‐Weather Measured Flow / Average Dry-Weather Flow 2
1050 Civica Infrastructure Inc. www.civi.ca
Civica Infrastructures Inc. Kawartha Lakes Flow Monitoring Report
Appendix - A June 03, 2024
I/I Analysis Graph Station: 2-3
1051 Civica Infrastructure Inc. www.civi.ca
Civica Infrastructures Inc. Kawartha Lakes Flow Monitoring Report
Appendix - A June 03, 2024
Infiltration/Inflow Event Analysis Station: 2-3 Aug 21, 2022 09:50 – Aug 23, 2022 16:20, Total Precipitation: 17.50 mm (4,252,500.00 L) Station Details
Storm Details
Catchment Area
24.30 ha
Total Precipitation
17.50 mm (4,252,500.00 L)
Duration of Storm
30.50 hr
Time of Concentration (Tc) 1
30 min
Peak Precipitation Intensity Over Tc 2
10.50 mm/hr
Return Period over Tc 3
< 2 Yr
Measured Flow
I/I Flow
Time of Peak Measured Flow
Aug 22, 2022 13:15
Time of Peak I/I Flow (TD)
Aug 22, 2022 13:35
Estimated Dry Weather Flow at TD
1.85 L/s
Peak Measured Flow
4.42 L/s
Peak I/I Flow 4
2.57 L/s
Peak I/I Rate 5
0.11 L/s/ha
Peak Measured Depth
118.70 mm
Total I/I Flow Volume during event
102,238.50 L
Volumetric Coefficient (Cv%) 6
2.40%
Total Measured Flow Volume during Event
352,356.40 L
Peak I/I Coefficient 7
0.0036
Hourly Wet-Weather Peaking Factor 8
2.44
Instantaneous Wet-Weather Peaking Factor 9
2.71
1
Time of Concentration (Tc): The estimated time for the flow to travel from the furthest point in the upstream area to the point of monitoring, assume flow is travelling at 1.00 m/s Peak Precipitation Intensity Over Tc: The peak rainfall intensity for the duration of the storm with the time interval defined by time of concentration 3 Return Period over Tc: The estimated time to elapse before a storm of equal or greater intensity will likely occur again, based on design storm criteria 4 Peak I/I Flow: The greatest difference captured between measured flow and estimated dry weather flow, Peak I/I Flow = Maximum (Measured Flow – Estimated Dry Weather Flow) 5 Peak I/I Rate: A normalized peak I/I flow based on catchment area size, Peak I/I Rate = Peak I/I Flow / Catchment Area 6 Volumetric Coefficient (Cv%): The ratio of total I/I volume and total rainfall volume, Cv% = Total I/I Flow Volume / Total Precipitation Volume * 100% 7 Peak I/ I Coefficient: The ratio of peak I/I flow and peak rainfall intensity, Peak I/ I Coefficient = Peak I/I Flow / (Peak Rainfall Intensity over Tc * Catchment Area) 8 Hourly Wet‐Weather Peaking Factor: The ratio of peak hourly wet‐weather measured flow and average dry‐weather flow, Wet‐Weather Peaking Factor = Peak Hourly Wet‐Weather Measured Flow / Average Dry-Weather Flow 9 Instantaneous Wet‐Weather Peaking Factor: The ratio of peak wet‐weather measured flow and average dry‐weather flow, Wet‐Weather Peaking Factor = Peak Wet‐Weather Measured Flow / Average Dry-Weather Flow 2
1052 Civica Infrastructure Inc. www.civi.ca
Civica Infrastructures Inc. Kawartha Lakes Flow Monitoring Report
Appendix - A June 03, 2024
I/I Analysis Graph Station: 2-3
1053 Civica Infrastructure Inc. www.civi.ca
Civica Infrastructures Inc. Kawartha Lakes Flow Monitoring Report
Appendix - A June 03, 2024
Infiltration/Inflow Event Analysis Station: 2-3 Aug 25, 2022 01:30 – Aug 26, 2022 10:05, Total Precipitation: 16.25 mm (3,948,750.00 L) Station Details
Storm Details
Catchment Area
24.30 ha
Total Precipitation
16.25 mm (3,948,750.00 L)
Duration of Storm
8.58 hr
Time of Concentration (Tc) 1
30 min
Peak Precipitation Intensity Over Tc 2
24.00 mm/hr
Return Period over Tc 3
< 2 Yr
Measured Flow
I/I Flow
Time of Peak Measured Flow
Aug 25, 2022 19:00
Time of Peak I/I Flow (TD)
Aug 25, 2022 19:05
Estimated Dry Weather Flow at TD
2.19 L/s
Peak Measured Flow
7.71 L/s
Peak I/I Flow 4
5.52 L/s
Peak I/I Rate 5
0.23 L/s/ha
Peak Measured Depth
165.70 mm
Total I/I Flow Volume during event
81,544.10 L
Volumetric Coefficient (Cv%) 6
2.07%
Total Measured Flow Volume during Event
207,504.50 L
Peak I/I Coefficient 7
0.0034
Hourly Wet-Weather Peaking Factor 8
3.43
Instantaneous Wet-Weather Peaking Factor 9
4.55
1
Time of Concentration (Tc): The estimated time for the flow to travel from the furthest point in the upstream area to the point of monitoring, assume flow is travelling at 1.00 m/s Peak Precipitation Intensity Over Tc: The peak rainfall intensity for the duration of the storm with the time interval defined by time of concentration 3 Return Period over Tc: The estimated time to elapse before a storm of equal or greater intensity will likely occur again, based on design storm criteria 4 Peak I/I Flow: The greatest difference captured between measured flow and estimated dry weather flow, Peak I/I Flow = Maximum (Measured Flow – Estimated Dry Weather Flow) 5 Peak I/I Rate: A normalized peak I/I flow based on catchment area size, Peak I/I Rate = Peak I/I Flow / Catchment Area 6 Volumetric Coefficient (Cv%): The ratio of total I/I volume and total rainfall volume, Cv% = Total I/I Flow Volume / Total Precipitation Volume * 100% 7 Peak I/ I Coefficient: The ratio of peak I/I flow and peak rainfall intensity, Peak I/ I Coefficient = Peak I/I Flow / (Peak Rainfall Intensity over Tc * Catchment Area) 8 Hourly Wet‐Weather Peaking Factor: The ratio of peak hourly wet‐weather measured flow and average dry‐weather flow, Wet‐Weather Peaking Factor = Peak Hourly Wet‐Weather Measured Flow / Average Dry-Weather Flow 9 Instantaneous Wet‐Weather Peaking Factor: The ratio of peak wet‐weather measured flow and average dry‐weather flow, Wet‐Weather Peaking Factor = Peak Wet‐Weather Measured Flow / Average Dry-Weather Flow 2
1054 Civica Infrastructure Inc. www.civi.ca
Civica Infrastructures Inc. Kawartha Lakes Flow Monitoring Report
Appendix - A June 03, 2024
I/I Analysis Graph Station: 2-3
1055 Civica Infrastructure Inc. www.civi.ca
Civica Infrastructures Inc. Kawartha Lakes Flow Monitoring Report
Appendix - A June 03, 2024
Infiltration/Inflow Event Analysis Station: 2-3 Aug 29, 2022 01:40 – Aug 30, 2022 04:10, Total Precipitation: 29.00 mm (7,047,000.00 L) Station Details
Storm Details
Catchment Area
24.30 ha
Total Precipitation
29.00 mm (7,047,000.00 L)
Duration of Storm
2.50 hr
Time of Concentration (Tc) 1
30 min
Peak Precipitation Intensity Over Tc 2
39.50 mm/hr
Return Period over Tc 3
< 2 Yr
Measured Flow
I/I Flow
Time of Peak Measured Flow
Aug 29, 2022 15:45
Time of Peak I/I Flow (TD)
Aug 29, 2022 15:45
Estimated Dry Weather Flow at TD
2.10 L/s
Peak Measured Flow
10.75 L/s
Peak I/I Flow 4
8.65 L/s
Peak I/I Rate 5
0.36 L/s/ha
Peak Measured Depth
159.70 mm
Total I/I Flow Volume during event
275,636.30 L
Volumetric Coefficient (Cv%) 6
3.91%
Total Measured Flow Volume during Event
369,796.20 L
Peak I/I Coefficient 7
0.0032
Hourly Wet-Weather Peaking Factor 8
5.89
Instantaneous Wet-Weather Peaking Factor 9
5.99
1
Time of Concentration (Tc): The estimated time for the flow to travel from the furthest point in the upstream area to the point of monitoring, assume flow is travelling at 1.00 m/s Peak Precipitation Intensity Over Tc: The peak rainfall intensity for the duration of the storm with the time interval defined by time of concentration 3 Return Period over Tc: The estimated time to elapse before a storm of equal or greater intensity will likely occur again, based on design storm criteria 4 Peak I/I Flow: The greatest difference captured between measured flow and estimated dry weather flow, Peak I/I Flow = Maximum (Measured Flow – Estimated Dry Weather Flow) 5 Peak I/I Rate: A normalized peak I/I flow based on catchment area size, Peak I/I Rate = Peak I/I Flow / Catchment Area 6 Volumetric Coefficient (Cv%): The ratio of total I/I volume and total rainfall volume, Cv% = Total I/I Flow Volume / Total Precipitation Volume * 100% 7 Peak I/ I Coefficient: The ratio of peak I/I flow and peak rainfall intensity, Peak I/ I Coefficient = Peak I/I Flow / (Peak Rainfall Intensity over Tc * Catchment Area) 8 Hourly Wet‐Weather Peaking Factor: The ratio of peak hourly wet‐weather measured flow and average dry‐weather flow, Wet‐Weather Peaking Factor = Peak Hourly Wet‐Weather Measured Flow / Average Dry-Weather Flow 9 Instantaneous Wet‐Weather Peaking Factor: The ratio of peak wet‐weather measured flow and average dry‐weather flow, Wet‐Weather Peaking Factor = Peak Wet‐Weather Measured Flow / Average Dry-Weather Flow 2
1056 Civica Infrastructure Inc. www.civi.ca
Civica Infrastructures Inc. Kawartha Lakes Flow Monitoring Report
Appendix - A June 03, 2024
I/I Analysis Graph Station: 2-3
1057 Civica Infrastructure Inc. www.civi.ca
Civica Infrastructures Inc. Kawartha Lakes Flow Monitoring Report
Appendix - A June 03, 2024
Infiltration/Inflow Event Analysis Station: 2-3 Sep 11, 2022 15:50 – Sep 13, 2022 16:55, Total Precipitation: 21.75 mm (5,285,250.00 L) Station Details
Storm Details
Catchment Area
24.30 ha
Total Precipitation
21.75 mm (5,285,250.00 L)
Duration of Storm
25.08 hr
Time of Concentration (Tc) 1
30 min
Peak Precipitation Intensity Over Tc 2
8.00 mm/hr
Return Period over Tc 3
< 2 Yr
Measured Flow
I/I Flow
Time of Peak Measured Flow
Sep 12, 2022 06:45
Time of Peak I/I Flow (TD)
Sep 12, 2022 06:50
Estimated Dry Weather Flow at TD
2.56 L/s
Peak Measured Flow
4.89 L/s
Peak I/I Flow 4
2.33 L/s
Peak I/I Rate 5
0.10 L/s/ha
Peak Measured Depth
121.70 mm
Total I/I Flow Volume during event
58,541.70 L
Volumetric Coefficient (Cv%) 6
1.11%
Total Measured Flow Volume during Event
358,795.10 L
Peak I/I Coefficient 7
0.0043
Hourly Wet-Weather Peaking Factor 8
2.07
Instantaneous Wet-Weather Peaking Factor 9
2.18
1
Time of Concentration (Tc): The estimated time for the flow to travel from the furthest point in the upstream area to the point of monitoring, assume flow is travelling at 1.00 m/s Peak Precipitation Intensity Over Tc: The peak rainfall intensity for the duration of the storm with the time interval defined by time of concentration 3 Return Period over Tc: The estimated time to elapse before a storm of equal or greater intensity will likely occur again, based on design storm criteria 4 Peak I/I Flow: The greatest difference captured between measured flow and estimated dry weather flow, Peak I/I Flow = Maximum (Measured Flow – Estimated Dry Weather Flow) 5 Peak I/I Rate: A normalized peak I/I flow based on catchment area size, Peak I/I Rate = Peak I/I Flow / Catchment Area 6 Volumetric Coefficient (Cv%): The ratio of total I/I volume and total rainfall volume, Cv% = Total I/I Flow Volume / Total Precipitation Volume * 100% 7 Peak I/ I Coefficient: The ratio of peak I/I flow and peak rainfall intensity, Peak I/ I Coefficient = Peak I/I Flow / (Peak Rainfall Intensity over Tc * Catchment Area) 8 Hourly Wet‐Weather Peaking Factor: The ratio of peak hourly wet‐weather measured flow and average dry‐weather flow, Wet‐Weather Peaking Factor = Peak Hourly Wet‐Weather Measured Flow / Average Dry-Weather Flow 9 Instantaneous Wet‐Weather Peaking Factor: The ratio of peak wet‐weather measured flow and average dry‐weather flow, Wet‐Weather Peaking Factor = Peak Wet‐Weather Measured Flow / Average Dry-Weather Flow 2
1058 Civica Infrastructure Inc. www.civi.ca
Civica Infrastructures Inc. Kawartha Lakes Flow Monitoring Report
Appendix - A June 03, 2024
I/I Analysis Graph Station: 2-3
1059 Civica Infrastructure Inc. www.civi.ca
Civica Infrastructures Inc. Kawartha Lakes Flow Monitoring Report
Appendix - A June 03, 2024
Infiltration/Inflow Event Analysis Station: 2-3 Sep 17, 2022 19:35 – Sep 19, 2022 01:10, Total Precipitation: 24.50 mm (5,953,500.00 L) Station Details
Storm Details
Catchment Area
24.30 ha
Total Precipitation
24.50 mm (5,953,500.00 L)
Duration of Storm
5.58 hr
Time of Concentration (Tc) 1
30 min
Peak Precipitation Intensity Over Tc 2
17.00 mm/hr
Return Period over Tc 3
< 2 Yr
Measured Flow
I/I Flow
Time of Peak Measured Flow
Sep 18, 2022 09:10
Time of Peak I/I Flow (TD)
Sep 18, 2022 09:10
Estimated Dry Weather Flow at TD
2.35 L/s
Peak Measured Flow
9.69 L/s
Peak I/I Flow 4
7.34 L/s
Peak I/I Rate 5
0.30 L/s/ha
Peak Measured Depth
138.70 mm
Total I/I Flow Volume during event
173,339.70 L
Volumetric Coefficient (Cv%) 6
2.91%
Total Measured Flow Volume during Event
296,662.90 L
Peak I/I Coefficient 7
0.0064
Hourly Wet-Weather Peaking Factor 8
3.87
Instantaneous Wet-Weather Peaking Factor 9
5.00
1
Time of Concentration (Tc): The estimated time for the flow to travel from the furthest point in the upstream area to the point of monitoring, assume flow is travelling at 1.00 m/s Peak Precipitation Intensity Over Tc: The peak rainfall intensity for the duration of the storm with the time interval defined by time of concentration 3 Return Period over Tc: The estimated time to elapse before a storm of equal or greater intensity will likely occur again, based on design storm criteria 4 Peak I/I Flow: The greatest difference captured between measured flow and estimated dry weather flow, Peak I/I Flow = Maximum (Measured Flow – Estimated Dry Weather Flow) 5 Peak I/I Rate: A normalized peak I/I flow based on catchment area size, Peak I/I Rate = Peak I/I Flow / Catchment Area 6 Volumetric Coefficient (Cv%): The ratio of total I/I volume and total rainfall volume, Cv% = Total I/I Flow Volume / Total Precipitation Volume * 100% 7 Peak I/ I Coefficient: The ratio of peak I/I flow and peak rainfall intensity, Peak I/ I Coefficient = Peak I/I Flow / (Peak Rainfall Intensity over Tc * Catchment Area) 8 Hourly Wet‐Weather Peaking Factor: The ratio of peak hourly wet‐weather measured flow and average dry‐weather flow, Wet‐Weather Peaking Factor = Peak Hourly Wet‐Weather Measured Flow / Average Dry-Weather Flow 9 Instantaneous Wet‐Weather Peaking Factor: The ratio of peak wet‐weather measured flow and average dry‐weather flow, Wet‐Weather Peaking Factor = Peak Wet‐Weather Measured Flow / Average Dry-Weather Flow 2
1060 Civica Infrastructure Inc. www.civi.ca
Civica Infrastructures Inc. Kawartha Lakes Flow Monitoring Report
Appendix - A June 03, 2024
I/I Analysis Graph Station: 2-3
1061 Civica Infrastructure Inc. www.civi.ca
Civica Infrastructures Inc. Kawartha Lakes Flow Monitoring Report
Appendix - A June 03, 2024
Infiltration/Inflow Event Analysis Station: 2-3 Oct 12, 2022 08:40 – Oct 13, 2022 23:55, Total Precipitation: 20.75 mm (5,042,250.00 L) Station Details
Storm Details
Catchment Area
24.30 ha
Total Precipitation
20.75 mm (5,042,250.00 L)
Duration of Storm
15.25 hr
Time of Concentration (Tc) 1
30 min
Peak Precipitation Intensity Over Tc 2
7.50 mm/hr
Return Period over Tc 3
< 2 Yr
Measured Flow
I/I Flow
Time of Peak Measured Flow
Oct 13, 2022 09:00
Time of Peak I/I Flow (TD)
Oct 13, 2022 09:05
Estimated Dry Weather Flow at TD
1.86 L/s
Peak Measured Flow
5.54 L/s
Peak I/I Flow 4
3.68 L/s
Peak I/I Rate 5
0.15 L/s/ha
Peak Measured Depth
109.70 mm
Total I/I Flow Volume during event
81,839.10 L
Volumetric Coefficient (Cv%) 6
1.62%
Total Measured Flow Volume during Event
240,694.80 L
Peak I/I Coefficient 7
0.0073
Hourly Wet-Weather Peaking Factor 8
3.05
Instantaneous Wet-Weather Peaking Factor 9
3.43
1
Time of Concentration (Tc): The estimated time for the flow to travel from the furthest point in the upstream area to the point of monitoring, assume flow is travelling at 1.00 m/s Peak Precipitation Intensity Over Tc: The peak rainfall intensity for the duration of the storm with the time interval defined by time of concentration 3 Return Period over Tc: The estimated time to elapse before a storm of equal or greater intensity will likely occur again, based on design storm criteria 4 Peak I/I Flow: The greatest difference captured between measured flow and estimated dry weather flow, Peak I/I Flow = Maximum (Measured Flow – Estimated Dry Weather Flow) 5 Peak I/I Rate: A normalized peak I/I flow based on catchment area size, Peak I/I Rate = Peak I/I Flow / Catchment Area 6 Volumetric Coefficient (Cv%): The ratio of total I/I volume and total rainfall volume, Cv% = Total I/I Flow Volume / Total Precipitation Volume * 100% 7 Peak I/ I Coefficient: The ratio of peak I/I flow and peak rainfall intensity, Peak I/ I Coefficient = Peak I/I Flow / (Peak Rainfall Intensity over Tc * Catchment Area) 8 Hourly Wet‐Weather Peaking Factor: The ratio of peak hourly wet‐weather measured flow and average dry‐weather flow, Wet‐Weather Peaking Factor = Peak Hourly Wet‐Weather Measured Flow / Average Dry-Weather Flow 9 Instantaneous Wet‐Weather Peaking Factor: The ratio of peak wet‐weather measured flow and average dry‐weather flow, Wet‐Weather Peaking Factor = Peak Wet‐Weather Measured Flow / Average Dry-Weather Flow 2
1062 Civica Infrastructure Inc. www.civi.ca
Civica Infrastructures Inc. Kawartha Lakes Flow Monitoring Report
Appendix - A June 03, 2024
Activity Log Station: 2-3 Date Time
Type
Purpose of Visit
Comment
Calibration Measurement
18-Nov-2021 10:15:00 AM
Installation Log
Install Detec logger + AV + CSO
PMAC ID: 8212
Yes
CALIBRATION
Data downloaded Debris cleared Telemetry sent Ensured manual and sensor readings are satisfactory before leaving site
Yes
Yes
Yes
01-Feb-2022 01:15:00 PM
Maintenance Log
09-Feb-2022 02:15:00 PM
Maintenance Log
CALIBRATION
Data downloaded Debris cleared Telemetry sent Ensured manual and sensor readings are satisfactory before leaving site
17-Mar-2022 11:58:00 AM
Maintenance Log
calibration
Data downloaded site calibrated telemetry sent
11-May-2022 08:50:00 AM
Maintenance Log
CALIBRATION
Yes
24-May-2022 03:52:00 PM
Maintenance Log
CALIBRATION
Yes
24-May-2022 04:06:00 PM
Maintenance Log
CALIBRATION
Yes
27-Jun-2022 02:21:00 PM
Maintenance Log
CALIBRATION
DATA DOWNLOADED PHOTOS TAKEN SITE CALIBRATED BATTERY REPLACED REPLACED ANTENNA CLEARED DEBRIS TELEMETRY SENT ANTENNA DRILLED
Yes
Yes
02-Aug-2022 05:34:00 PM
Maintenance Log
CALIBRATION
DATA DOWNLOADED, SITE CALIBRATED, DEBRIS CLEARED, TELEMETRY SENT
24-Aug-2022 10:28:00 AM
Maintenance Log
CALIBRATION
DATA DOWNLOADED, SITE CALIBRATED TELEMETRY SENT
Yes
CALIBRATION
DATA DOWNLOADED, SITE CALIBRATED, DEBRIS CLEARED, TELEMETRY SENT
Yes
CALIBRATION
DATA DOWNLOADED, SITE CALIBRATED, DEBRIS CLEARED TELEMETRY SENT AND CHECKED,
Yes
21-Sep-2022 10:46:00 AM
03-Oct-2022 11:47:00 AM
Maintenance Log
Maintenance Log
1063 Civica Infrastructure Inc. www.civi.ca
Civica Infrastructures Inc. Kawartha Lakes Flow Monitoring Report Date Time
Appendix - A June 03, 2024 Type
Purpose of Visit
Comment
Calibration Measurement
BATTERY SWAPPED PHOTO AND VIDEO TAKEN
03-Nov-2022 12:59:00 PM
Maintenance Log
DATA DOWNLOADED TELEMETRY SENT PHOTOS TAKEN SITE CALIBRATED
CALIBRATION
1064 Civica Infrastructure Inc. www.civi.ca
Yes
Civica Infrastructures Inc. Kawartha Lakes Flow Monitoring Report
Appendix - A June 03, 2024
Aggregate Data Station: 4-1
Level Date From
Date To
Days
Min (m)
Avg (m)
Max (m)
Count
Time of Min1
Time of Max1
Dec 16, 2021
Nov 04, 2022
324
0.04
0.07
0.25
93,154
Fri Feb 11, 2022 00:25
Mon Aug 29, 2022 15:00
Velocity Date From
Date To
Days
Min (m/s)
Avg (m/s)
Max (m/s)
Count
Time of Min1
Time of Max1
Dec 16, 2021
Nov 04, 2022
324
0.00
0.38
0.65
93,145
Sun Mar 13, 2022 01:55
Mon Aug 29, 2022 15:15
Flow Date From
Date To
Days
Min (L/s)
Avg (L/s)
Max (L/s)
Total Volume (1,000,000 L)
Count
Time of Min1
Time of Max1
Dec 16, 2021
Nov 04, 2022
324
0.00
6.72
65.17
187.87
93,145
Sun Mar 13, 2022 01:55
Mon Aug 29, 2022 15:15
Precipitation
1
Date From
Date To
Days
Min (mm)
Avg (mm)
Max (mm)
Sum (mm)
Count
Time of Min1
Time of Max1
Dec 16, 2021
Nov 04, 2022
314
0.00
0.01
9.75
613.95
89,730
Thu Dec 16, 2021 12:00
Mon Jul 25, 2022 00:00
Time of Min and Time of Max will be displayed by first occurrence
1065 Civica Infrastructure Inc. www.civi.ca
Civica Infrastructures Inc. Kawartha Lakes Flow Monitoring Report
Appendix - A June 03, 2024
Sanitary Report Station: 4-1
1
Average Dry Weather Flow (L/s)
Average Dry Weather Flow (L/c/d)
Average Daily Minimum Dry Weather Flow (L/s)
Average Daily Peak Dry Weather Flow (L/s)
6.091
332.649
3.016
9.479
Peaking Factor
Groundwater Infiltration (L/s)1
Groundwater Infiltration (L/ha/d)
% of GWI in Average DWF
1.556
2.564
4,064.398
42.092
Groundwater infiltration (GWI) is assumed as 85% of the daily minimum flow averaged over the monitoring period
1066 Civica Infrastructure Inc. www.civi.ca
Civica Infrastructures Inc. Kawartha Lakes Flow Monitoring Report
Appendix - A June 03, 2024
Data Chart Station: 4-1 Dec 16, 2021 – Dec 31, 2021
1067 Civica Infrastructure Inc. www.civi.ca
Civica Infrastructures Inc. Kawartha Lakes Flow Monitoring Report
Appendix - A June 03, 2024
Data Chart Station: 4-1 Jan 01, 2022 – Jan 31, 2022
1068 Civica Infrastructure Inc. www.civi.ca
Civica Infrastructures Inc. Kawartha Lakes Flow Monitoring Report
Appendix - A June 03, 2024
Data Chart Station: 4-1 Feb 01, 2022 – Feb 28, 2022
1069 Civica Infrastructure Inc. www.civi.ca
Civica Infrastructures Inc. Kawartha Lakes Flow Monitoring Report
Appendix - A June 03, 2024
Data Chart Station: 4-1 Mar 01, 2022 – Mar 31, 2022
1070 Civica Infrastructure Inc. www.civi.ca
Civica Infrastructures Inc. Kawartha Lakes Flow Monitoring Report
Appendix - A June 03, 2024
Data Chart Station: 4-1 Apr 01, 2022 – Apr 30, 2022
1071 Civica Infrastructure Inc. www.civi.ca
Civica Infrastructures Inc. Kawartha Lakes Flow Monitoring Report
Appendix - A June 03, 2024
Data Chart Station: 4-1 May 01, 2022 – May 31, 2022
1072 Civica Infrastructure Inc. www.civi.ca
Civica Infrastructures Inc. Kawartha Lakes Flow Monitoring Report
Appendix - A June 03, 2024
Data Chart Station: 4-1 Jun 01, 2022 – Jun 30, 2022
1073 Civica Infrastructure Inc. www.civi.ca
Civica Infrastructures Inc. Kawartha Lakes Flow Monitoring Report
Appendix - A June 03, 2024
Data Chart Station: 4-1 Jul 01, 2022 – Jul 31, 2022
1074 Civica Infrastructure Inc. www.civi.ca
Civica Infrastructures Inc. Kawartha Lakes Flow Monitoring Report
Appendix - A June 03, 2024
Data Chart Station: 4-1 Aug 01, 2022 – Aug 31, 2022
1075 Civica Infrastructure Inc. www.civi.ca
Civica Infrastructures Inc. Kawartha Lakes Flow Monitoring Report
Appendix - A June 03, 2024
Data Chart Station: 4-1 Sep 01, 2022 – Sep 30, 2022
1076 Civica Infrastructure Inc. www.civi.ca
Civica Infrastructures Inc. Kawartha Lakes Flow Monitoring Report
Appendix - A June 03, 2024
Data Chart Station: 4-1 Oct 01, 2022 – Oct 31, 2022
1077 Civica Infrastructure Inc. www.civi.ca
Civica Infrastructures Inc. Kawartha Lakes Flow Monitoring Report
Appendix - A June 03, 2024
Data Chart Station: 4-1 Nov 01, 2022 – Nov 04, 2022
1078 Civica Infrastructure Inc. www.civi.ca
Civica Infrastructures Inc. Kawartha Lakes Flow Monitoring Report
Appendix - A June 03, 2024
I/I Analysis Table
1
Event1
Total Precipitation (mm)
Duration (hours)
Peak Intensity Over Tc at Station (mm/hr)
Feb 16, 2022
18.00
12.67
Apr 13, 2022
17.25
May 26, 2022
4-1 Measured Peak Flow (L/s)
Peak I/I Flow (L/s)
Peak I/I Rate (L/s/ha)
Volumetric Runoff Coefficient (CV%)
Peaking Factor (PF)
3.00
31.63
26.81
0.49
9.93 %
4.60
28.67
7.50
17.99
10.06
0.19
3.76 %
1.33
20.25
27.50
9.80
29.70
22.17
0.41
2.28 %
3.41
Jun 06, 2022
30.00
32.42
7.90
31.25
24.06
0.44
5.14 %
3.57
Jun 11, 2022
41.50
25.08
22.50
62.87
55.16
1.01
6.43 %
8.74
Jul 12, 2022
15.50
7.75
17.60
52.82
49.78
0.91
0.94 %
11.81
Jul 18, 2022
21.50
43.25
1.10
31.59
25.88
0.48
4.47 %
5.54
Aug 17, 2022
17.50
1.83
22.10
54.09
48.12
0.88
2.40 %
9.80
Aug 21, 2022
17.50
30.50
9.00
29.60
25.29
0.46
3.05 %
4.69
Aug 25, 2022
16.25
8.58
20.20
49.49
41.84
0.77
3.00 %
7.81
Aug 29, 2022
29.00
2.50
31.50
65.17
58.51
1.07
2.94 %
10.77
Sep 12, 2022
21.75
25.08
7.90
22.83
16.30
0.30
2.30 %
2.79
Sep 18, 2022
24.50
5.58
16.10
43.52
36.64
0.67
4.16 %
6.53
Oct 12, 2022
20.75
15.25
6.40
23.27
17.72
0.33
3.09 %
3.59
Average
22.23
19.05
13.04
38.99
32.74
0.60
3.85 %
6.07
Maximum
41.50
43.25
31.50
65.17
58.51
1.07
9.93 %
11.81
Flow KPIs
Measured Storms
Station: 4-1
An event is a storm with a minimum volume of 15mm and a minimum inter-event dry period of 12 hours
1079 Civica Infrastructure Inc. www.civi.ca
Civica Infrastructures Inc. Kawartha Lakes Flow Monitoring Report
Appendix - A June 03, 2024
I/I Analysis Graph Station: 4-1
1080 Civica Infrastructure Inc. www.civi.ca
Civica Infrastructures Inc. Kawartha Lakes Flow Monitoring Report
Appendix - A June 03, 2024
Infiltration/Inflow Event Analysis Station: 4-1 Feb 16, 2022 11:00 – Feb 17, 2022 23:40, Total Precipitation: 18.00 mm (9,810,000.00 L) Station Details
Storm Details
Catchment Area
54.50 ha
Total Precipitation
18.00 mm (9,810,000.00 L)
Duration of Storm
12.67 hr
Time of Concentration (Tc) 1
40 min
Peak Precipitation Intensity Over Tc 2
3.00 mm/hr
Return Period over Tc 3
< 2 Yr
Measured Flow
I/I Flow
Time of Peak Measured Flow
Feb 17, 2022 06:35
Time of Peak I/I Flow (TD)
Feb 17, 2022 06:35
Estimated Dry Weather Flow at TD
4.81 L/s
Peak Measured Flow
31.63 L/s
Peak I/I Flow 4
26.81 L/s
Peak I/I Rate 5
0.49 L/s/ha
Peak Measured Depth
155.00 mm
Total I/I Flow Volume during event
973,814.70 L
Volumetric Coefficient (Cv%) 6
9.93%
Total Measured Flow Volume during Event
1,493,094.10 L
Peak I/I Coefficient 7
0.0590
Hourly Wet-Weather Peaking Factor 8
5.04
Instantaneous Wet-Weather Peaking Factor 9
5.43
1
Time of Concentration (Tc): The estimated time for the flow to travel from the furthest point in the upstream area to the point of monitoring, assume flow is travelling at 1.00 m/s Peak Precipitation Intensity Over Tc: The peak rainfall intensity for the duration of the storm with the time interval defined by time of concentration 3 Return Period over Tc: The estimated time to elapse before a storm of equal or greater intensity will likely occur again, based on design storm criteria 4 Peak I/I Flow: The greatest difference captured between measured flow and estimated dry weather flow, Peak I/I Flow = Maximum (Measured Flow – Estimated Dry Weather Flow) 5 Peak I/I Rate: A normalized peak I/I flow based on catchment area size, Peak I/I Rate = Peak I/I Flow / Catchment Area 6 Volumetric Coefficient (Cv%): The ratio of total I/I volume and total rainfall volume, Cv% = Total I/I Flow Volume / Total Precipitation Volume * 100% 7 Peak I/ I Coefficient: The ratio of peak I/I flow and peak rainfall intensity, Peak I/ I Coefficient = Peak I/I Flow / (Peak Rainfall Intensity over Tc * Catchment Area) 8 Hourly Wet‐Weather Peaking Factor: The ratio of peak hourly wet‐weather measured flow and average dry‐weather flow, Wet‐Weather Peaking Factor = Peak Hourly Wet‐Weather Measured Flow / Average Dry-Weather Flow 9 Instantaneous Wet‐Weather Peaking Factor: The ratio of peak wet‐weather measured flow and average dry‐weather flow, Wet‐Weather Peaking Factor = Peak Wet‐Weather Measured Flow / Average Dry-Weather Flow 2
1081 Civica Infrastructure Inc. www.civi.ca
Civica Infrastructures Inc. Kawartha Lakes Flow Monitoring Report
Appendix - A June 03, 2024
I/I Analysis Graph Station: 4-1
1082 Civica Infrastructure Inc. www.civi.ca
Civica Infrastructures Inc. Kawartha Lakes Flow Monitoring Report
Appendix - A June 03, 2024
Infiltration/Inflow Event Analysis Station: 4-1 Apr 12, 2022 17:25 – Apr 14, 2022 22:05, Total Precipitation: 17.25 mm (9,401,250.00 L) Station Details
Storm Details
Catchment Area
54.50 ha
Total Precipitation
17.25 mm (9,401,250.00 L)
Duration of Storm
28.67 hr
Time of Concentration (Tc) 1
40 min
Peak Precipitation Intensity Over Tc 2
7.50 mm/hr
Return Period over Tc 3
< 2 Yr
Measured Flow
I/I Flow
Time of Peak Measured Flow
Apr 13, 2022 08:25
Time of Peak I/I Flow (TD)
Apr 13, 2022 06:15
Estimated Dry Weather Flow at TD
6.65 L/s
Peak Measured Flow
17.99 L/s
Peak I/I Flow 4
10.06 L/s
Peak I/I Rate 5
0.19 L/s/ha
Peak Measured Depth
118.00 mm
Total I/I Flow Volume during event
353,297.40 L
Volumetric Coefficient (Cv%) 6
3.76%
Total Measured Flow Volume during Event
1,460,781.60 L
Peak I/I Coefficient 7
0.0089
Hourly Wet-Weather Peaking Factor 8
1.92
Instantaneous Wet-Weather Peaking Factor 9
2.38
1
Time of Concentration (Tc): The estimated time for the flow to travel from the furthest point in the upstream area to the point of monitoring, assume flow is travelling at 1.00 m/s Peak Precipitation Intensity Over Tc: The peak rainfall intensity for the duration of the storm with the time interval defined by time of concentration 3 Return Period over Tc: The estimated time to elapse before a storm of equal or greater intensity will likely occur again, based on design storm criteria 4 Peak I/I Flow: The greatest difference captured between measured flow and estimated dry weather flow, Peak I/I Flow = Maximum (Measured Flow – Estimated Dry Weather Flow) 5 Peak I/I Rate: A normalized peak I/I flow based on catchment area size, Peak I/I Rate = Peak I/I Flow / Catchment Area 6 Volumetric Coefficient (Cv%): The ratio of total I/I volume and total rainfall volume, Cv% = Total I/I Flow Volume / Total Precipitation Volume * 100% 7 Peak I/ I Coefficient: The ratio of peak I/I flow and peak rainfall intensity, Peak I/ I Coefficient = Peak I/I Flow / (Peak Rainfall Intensity over Tc * Catchment Area) 8 Hourly Wet‐Weather Peaking Factor: The ratio of peak hourly wet‐weather measured flow and average dry‐weather flow, Wet‐Weather Peaking Factor = Peak Hourly Wet‐Weather Measured Flow / Average Dry-Weather Flow 9 Instantaneous Wet‐Weather Peaking Factor: The ratio of peak wet‐weather measured flow and average dry‐weather flow, Wet‐Weather Peaking Factor = Peak Wet‐Weather Measured Flow / Average Dry-Weather Flow 2
1083 Civica Infrastructure Inc. www.civi.ca
Civica Infrastructures Inc. Kawartha Lakes Flow Monitoring Report
Appendix - A June 03, 2024
I/I Analysis Graph Station: 4-1
1084 Civica Infrastructure Inc. www.civi.ca
Civica Infrastructures Inc. Kawartha Lakes Flow Monitoring Report
Appendix - A June 03, 2024
Infiltration/Inflow Event Analysis Station: 4-1 May 26, 2022 07:30 – May 28, 2022 11:00, Total Precipitation: 20.25 mm (11,036,250.00 L) Station Details
Storm Details
Catchment Area
54.50 ha
Total Precipitation
20.25 mm (11,036,250.00 L)
Duration of Storm
27.50 hr
Time of Concentration (Tc) 1
40 min
Peak Precipitation Intensity Over Tc 2
9.80 mm/hr
Return Period over Tc 3
< 2 Yr
Measured Flow
I/I Flow
Time of Peak Measured Flow
May 27, 2022 16:35
Time of Peak I/I Flow (TD)
May 27, 2022 16:35
Estimated Dry Weather Flow at TD
7.52 L/s
Peak Measured Flow
29.70 L/s
Peak I/I Flow 4
22.17 L/s
Peak I/I Rate 5
0.41 L/s/ha
Peak Measured Depth
149.00 mm
Total I/I Flow Volume during event
251,641.00 L
Volumetric Coefficient (Cv%) 6
2.28%
Total Measured Flow Volume during Event
1,179,258.00 L
Peak I/I Coefficient 7
0.0150
Hourly Wet-Weather Peaking Factor 8
3.16
Instantaneous Wet-Weather Peaking Factor 9
4.56
1
Time of Concentration (Tc): The estimated time for the flow to travel from the furthest point in the upstream area to the point of monitoring, assume flow is travelling at 1.00 m/s Peak Precipitation Intensity Over Tc: The peak rainfall intensity for the duration of the storm with the time interval defined by time of concentration 3 Return Period over Tc: The estimated time to elapse before a storm of equal or greater intensity will likely occur again, based on design storm criteria 4 Peak I/I Flow: The greatest difference captured between measured flow and estimated dry weather flow, Peak I/I Flow = Maximum (Measured Flow – Estimated Dry Weather Flow) 5 Peak I/I Rate: A normalized peak I/I flow based on catchment area size, Peak I/I Rate = Peak I/I Flow / Catchment Area 6 Volumetric Coefficient (Cv%): The ratio of total I/I volume and total rainfall volume, Cv% = Total I/I Flow Volume / Total Precipitation Volume * 100% 7 Peak I/ I Coefficient: The ratio of peak I/I flow and peak rainfall intensity, Peak I/ I Coefficient = Peak I/I Flow / (Peak Rainfall Intensity over Tc * Catchment Area) 8 Hourly Wet‐Weather Peaking Factor: The ratio of peak hourly wet‐weather measured flow and average dry‐weather flow, Wet‐Weather Peaking Factor = Peak Hourly Wet‐Weather Measured Flow / Average Dry-Weather Flow 9 Instantaneous Wet‐Weather Peaking Factor: The ratio of peak wet‐weather measured flow and average dry‐weather flow, Wet‐Weather Peaking Factor = Peak Wet‐Weather Measured Flow / Average Dry-Weather Flow 2
1085 Civica Infrastructure Inc. www.civi.ca
Civica Infrastructures Inc. Kawartha Lakes Flow Monitoring Report
Appendix - A June 03, 2024
I/I Analysis Graph Station: 4-1
1086 Civica Infrastructure Inc. www.civi.ca
Civica Infrastructures Inc. Kawartha Lakes Flow Monitoring Report
Appendix - A June 03, 2024
Infiltration/Inflow Event Analysis Station: 4-1 Jun 05, 2022 18:20 – Jun 08, 2022 02:45, Total Precipitation: 30.00 mm (16,350,000.00 L) Station Details
Storm Details
Catchment Area
54.50 ha
Total Precipitation
30.00 mm (16,350,000.00 L)
Duration of Storm
32.42 hr
Time of Concentration (Tc) 1
40 min
Peak Precipitation Intensity Over Tc 2
7.90 mm/hr
Return Period over Tc 3
< 2 Yr
Measured Flow
I/I Flow
Time of Peak Measured Flow
Jun 07, 2022 09:30
Time of Peak I/I Flow (TD)
Jun 07, 2022 09:30
Estimated Dry Weather Flow at TD
7.19 L/s
Peak Measured Flow
31.25 L/s
Peak I/I Flow 4
24.06 L/s
Peak I/I Rate 5
0.44 L/s/ha
Peak Measured Depth
154.00 mm
Total I/I Flow Volume during event
840,662.10 L
Volumetric Coefficient (Cv%) 6
5.14%
Total Measured Flow Volume during Event
1,919,832.20 L
Peak I/I Coefficient 7
0.0202
Hourly Wet-Weather Peaking Factor 8
4.38
Instantaneous Wet-Weather Peaking Factor 9
4.64
1
Time of Concentration (Tc): The estimated time for the flow to travel from the furthest point in the upstream area to the point of monitoring, assume flow is travelling at 1.00 m/s Peak Precipitation Intensity Over Tc: The peak rainfall intensity for the duration of the storm with the time interval defined by time of concentration 3 Return Period over Tc: The estimated time to elapse before a storm of equal or greater intensity will likely occur again, based on design storm criteria 4 Peak I/I Flow: The greatest difference captured between measured flow and estimated dry weather flow, Peak I/I Flow = Maximum (Measured Flow – Estimated Dry Weather Flow) 5 Peak I/I Rate: A normalized peak I/I flow based on catchment area size, Peak I/I Rate = Peak I/I Flow / Catchment Area 6 Volumetric Coefficient (Cv%): The ratio of total I/I volume and total rainfall volume, Cv% = Total I/I Flow Volume / Total Precipitation Volume * 100% 7 Peak I/ I Coefficient: The ratio of peak I/I flow and peak rainfall intensity, Peak I/ I Coefficient = Peak I/I Flow / (Peak Rainfall Intensity over Tc * Catchment Area) 8 Hourly Wet‐Weather Peaking Factor: The ratio of peak hourly wet‐weather measured flow and average dry‐weather flow, Wet‐Weather Peaking Factor = Peak Hourly Wet‐Weather Measured Flow / Average Dry-Weather Flow 9 Instantaneous Wet‐Weather Peaking Factor: The ratio of peak wet‐weather measured flow and average dry‐weather flow, Wet‐Weather Peaking Factor = Peak Wet‐Weather Measured Flow / Average Dry-Weather Flow 2
1087 Civica Infrastructure Inc. www.civi.ca
Civica Infrastructures Inc. Kawartha Lakes Flow Monitoring Report
Appendix - A June 03, 2024
I/I Analysis Graph Station: 4-1
1088 Civica Infrastructure Inc. www.civi.ca
Civica Infrastructures Inc. Kawartha Lakes Flow Monitoring Report
Appendix - A June 03, 2024
Infiltration/Inflow Event Analysis Station: 4-1 Jun 11, 2022 01:55 – Jun 13, 2022 03:00, Total Precipitation: 41.50 mm (22,617,500.00 L) Station Details
Storm Details
Catchment Area
54.50 ha
Total Precipitation
41.50 mm (22,617,500.00 L)
Duration of Storm
25.08 hr
Time of Concentration (Tc) 1
40 min
Peak Precipitation Intensity Over Tc 2
22.50 mm/hr
Return Period over Tc 3
< 2 Yr
Measured Flow
I/I Flow
Time of Peak Measured Flow
Jun 12, 2022 09:20
Time of Peak I/I Flow (TD)
Jun 12, 2022 09:20
Estimated Dry Weather Flow at TD
7.71 L/s
Peak Measured Flow
62.87 L/s
Peak I/I Flow 4
55.16 L/s
Peak I/I Rate 5
1.01 L/s/ha
Peak Measured Depth
227.00 mm
Total I/I Flow Volume during event
1,454,946.30 L
Volumetric Coefficient (Cv%) 6
6.43%
Total Measured Flow Volume during Event
2,299,685.80 L
Peak I/I Coefficient 7
0.0162
Hourly Wet-Weather Peaking Factor 8
8.46
Instantaneous Wet-Weather Peaking Factor 9
9.96
1
Time of Concentration (Tc): The estimated time for the flow to travel from the furthest point in the upstream area to the point of monitoring, assume flow is travelling at 1.00 m/s Peak Precipitation Intensity Over Tc: The peak rainfall intensity for the duration of the storm with the time interval defined by time of concentration 3 Return Period over Tc: The estimated time to elapse before a storm of equal or greater intensity will likely occur again, based on design storm criteria 4 Peak I/I Flow: The greatest difference captured between measured flow and estimated dry weather flow, Peak I/I Flow = Maximum (Measured Flow – Estimated Dry Weather Flow) 5 Peak I/I Rate: A normalized peak I/I flow based on catchment area size, Peak I/I Rate = Peak I/I Flow / Catchment Area 6 Volumetric Coefficient (Cv%): The ratio of total I/I volume and total rainfall volume, Cv% = Total I/I Flow Volume / Total Precipitation Volume * 100% 7 Peak I/ I Coefficient: The ratio of peak I/I flow and peak rainfall intensity, Peak I/ I Coefficient = Peak I/I Flow / (Peak Rainfall Intensity over Tc * Catchment Area) 8 Hourly Wet‐Weather Peaking Factor: The ratio of peak hourly wet‐weather measured flow and average dry‐weather flow, Wet‐Weather Peaking Factor = Peak Hourly Wet‐Weather Measured Flow / Average Dry-Weather Flow 9 Instantaneous Wet‐Weather Peaking Factor: The ratio of peak wet‐weather measured flow and average dry‐weather flow, Wet‐Weather Peaking Factor = Peak Wet‐Weather Measured Flow / Average Dry-Weather Flow 2
1089 Civica Infrastructure Inc. www.civi.ca
Civica Infrastructures Inc. Kawartha Lakes Flow Monitoring Report
Appendix - A June 03, 2024
I/I Analysis Graph Station: 4-1
1090 Civica Infrastructure Inc. www.civi.ca
Civica Infrastructures Inc. Kawartha Lakes Flow Monitoring Report
Appendix - A June 03, 2024
Infiltration/Inflow Event Analysis Station: 4-1 Jul 11, 2022 14:25 – Jul 12, 2022 22:10, Total Precipitation: 15.50 mm (8,447,500.00 L) Station Details
Storm Details
Catchment Area
54.50 ha
Total Precipitation
15.50 mm (8,447,500.00 L)
Duration of Storm
7.75 hr
Time of Concentration (Tc) 1
40 min
Peak Precipitation Intensity Over Tc 2
17.60 mm/hr
Return Period over Tc 3
< 2 Yr
Measured Flow
I/I Flow
Time of Peak Measured Flow
Jul 12, 2022 03:05
Time of Peak I/I Flow (TD)
Jul 12, 2022 03:05
Estimated Dry Weather Flow at TD
3.03 L/s
Peak Measured Flow
52.82 L/s
Peak I/I Flow 4
49.78 L/s
Peak I/I Rate 5
0.91 L/s/ha
Peak Measured Depth
221.00 mm
Total I/I Flow Volume during event
79,125.60 L
Volumetric Coefficient (Cv%) 6
0.94%
Total Measured Flow Volume during Event
380,147.50 L
Peak I/I Coefficient 7
0.0187
Hourly Wet-Weather Peaking Factor 8
4.44
Instantaneous Wet-Weather Peaking Factor 9
12.53
1
Time of Concentration (Tc): The estimated time for the flow to travel from the furthest point in the upstream area to the point of monitoring, assume flow is travelling at 1.00 m/s Peak Precipitation Intensity Over Tc: The peak rainfall intensity for the duration of the storm with the time interval defined by time of concentration 3 Return Period over Tc: The estimated time to elapse before a storm of equal or greater intensity will likely occur again, based on design storm criteria 4 Peak I/I Flow: The greatest difference captured between measured flow and estimated dry weather flow, Peak I/I Flow = Maximum (Measured Flow – Estimated Dry Weather Flow) 5 Peak I/I Rate: A normalized peak I/I flow based on catchment area size, Peak I/I Rate = Peak I/I Flow / Catchment Area 6 Volumetric Coefficient (Cv%): The ratio of total I/I volume and total rainfall volume, Cv% = Total I/I Flow Volume / Total Precipitation Volume * 100% 7 Peak I/ I Coefficient: The ratio of peak I/I flow and peak rainfall intensity, Peak I/ I Coefficient = Peak I/I Flow / (Peak Rainfall Intensity over Tc * Catchment Area) 8 Hourly Wet‐Weather Peaking Factor: The ratio of peak hourly wet‐weather measured flow and average dry‐weather flow, Wet‐Weather Peaking Factor = Peak Hourly Wet‐Weather Measured Flow / Average Dry-Weather Flow 9 Instantaneous Wet‐Weather Peaking Factor: The ratio of peak wet‐weather measured flow and average dry‐weather flow, Wet‐Weather Peaking Factor = Peak Wet‐Weather Measured Flow / Average Dry-Weather Flow 2
1091 Civica Infrastructure Inc. www.civi.ca
Civica Infrastructures Inc. Kawartha Lakes Flow Monitoring Report
Appendix - A June 03, 2024
I/I Analysis Graph Station: 4-1
1092 Civica Infrastructure Inc. www.civi.ca
Civica Infrastructures Inc. Kawartha Lakes Flow Monitoring Report
Appendix - A June 03, 2024
Infiltration/Inflow Event Analysis Station: 4-1 Jul 17, 2022 16:10 – Jul 20, 2022 11:25, Total Precipitation: 21.50 mm (11,717,500.00 L) Station Details
Storm Details
Catchment Area
54.50 ha
Total Precipitation
21.50 mm (11,717,500.00 L)
Duration of Storm
43.25 hr
Time of Concentration (Tc) 1
40 min
Peak Precipitation Intensity Over Tc 2
1.10 mm/hr
Return Period over Tc 3
< 2 Yr
Measured Flow
I/I Flow
Time of Peak Measured Flow
Jul 18, 2022 11:35
Time of Peak I/I Flow (TD)
Jul 18, 2022 11:35
Estimated Dry Weather Flow at TD
5.70 L/s
Peak Measured Flow
31.59 L/s
Peak I/I Flow 4
25.88 L/s
Peak I/I Rate 5
0.48 L/s/ha
Peak Measured Depth
157.00 mm
Total I/I Flow Volume during event
523,460.00 L
Volumetric Coefficient (Cv%) 6
4.47%
Total Measured Flow Volume during Event
1,453,735.10 L
Peak I/I Coefficient 7
0.1520
Hourly Wet-Weather Peaking Factor 8
6.18
Instantaneous Wet-Weather Peaking Factor 9
6.76
1
Time of Concentration (Tc): The estimated time for the flow to travel from the furthest point in the upstream area to the point of monitoring, assume flow is travelling at 1.00 m/s Peak Precipitation Intensity Over Tc: The peak rainfall intensity for the duration of the storm with the time interval defined by time of concentration 3 Return Period over Tc: The estimated time to elapse before a storm of equal or greater intensity will likely occur again, based on design storm criteria 4 Peak I/I Flow: The greatest difference captured between measured flow and estimated dry weather flow, Peak I/I Flow = Maximum (Measured Flow – Estimated Dry Weather Flow) 5 Peak I/I Rate: A normalized peak I/I flow based on catchment area size, Peak I/I Rate = Peak I/I Flow / Catchment Area 6 Volumetric Coefficient (Cv%): The ratio of total I/I volume and total rainfall volume, Cv% = Total I/I Flow Volume / Total Precipitation Volume * 100% 7 Peak I/ I Coefficient: The ratio of peak I/I flow and peak rainfall intensity, Peak I/ I Coefficient = Peak I/I Flow / (Peak Rainfall Intensity over Tc * Catchment Area) 8 Hourly Wet‐Weather Peaking Factor: The ratio of peak hourly wet‐weather measured flow and average dry‐weather flow, Wet‐Weather Peaking Factor = Peak Hourly Wet‐Weather Measured Flow / Average Dry-Weather Flow 9 Instantaneous Wet‐Weather Peaking Factor: The ratio of peak wet‐weather measured flow and average dry‐weather flow, Wet‐Weather Peaking Factor = Peak Wet‐Weather Measured Flow / Average Dry-Weather Flow 2
1093 Civica Infrastructure Inc. www.civi.ca
Civica Infrastructures Inc. Kawartha Lakes Flow Monitoring Report
Appendix - A June 03, 2024
I/I Analysis Graph Station: 4-1
1094 Civica Infrastructure Inc. www.civi.ca
Civica Infrastructures Inc. Kawartha Lakes Flow Monitoring Report
Appendix - A June 03, 2024
Infiltration/Inflow Event Analysis Station: 4-1 Aug 17, 2022 03:20 – Aug 18, 2022 05:10, Total Precipitation: 17.50 mm (9,537,500.00 L) Station Details
Storm Details
Catchment Area
54.50 ha
Total Precipitation
17.50 mm (9,537,500.00 L)
Duration of Storm
1.83 hr
Time of Concentration (Tc) 1
40 min
Peak Precipitation Intensity Over Tc 2
22.10 mm/hr
Return Period over Tc 3
< 2 Yr
Measured Flow
I/I Flow
Time of Peak Measured Flow
Aug 17, 2022 15:40
Time of Peak I/I Flow (TD)
Aug 17, 2022 15:40
Estimated Dry Weather Flow at TD
5.97 L/s
Peak Measured Flow
54.09 L/s
Peak I/I Flow 4
48.12 L/s
Peak I/I Rate 5
0.88 L/s/ha
Peak Measured Depth
217.00 mm
Total I/I Flow Volume during event
228,807.00 L
Volumetric Coefficient (Cv%) 6
2.40%
Total Measured Flow Volume during Event
474,767.30 L
Peak I/I Coefficient 7
0.0144
Hourly Wet-Weather Peaking Factor 8
7.57
Instantaneous Wet-Weather Peaking Factor 9
11.02
1
Time of Concentration (Tc): The estimated time for the flow to travel from the furthest point in the upstream area to the point of monitoring, assume flow is travelling at 1.00 m/s Peak Precipitation Intensity Over Tc: The peak rainfall intensity for the duration of the storm with the time interval defined by time of concentration 3 Return Period over Tc: The estimated time to elapse before a storm of equal or greater intensity will likely occur again, based on design storm criteria 4 Peak I/I Flow: The greatest difference captured between measured flow and estimated dry weather flow, Peak I/I Flow = Maximum (Measured Flow – Estimated Dry Weather Flow) 5 Peak I/I Rate: A normalized peak I/I flow based on catchment area size, Peak I/I Rate = Peak I/I Flow / Catchment Area 6 Volumetric Coefficient (Cv%): The ratio of total I/I volume and total rainfall volume, Cv% = Total I/I Flow Volume / Total Precipitation Volume * 100% 7 Peak I/ I Coefficient: The ratio of peak I/I flow and peak rainfall intensity, Peak I/ I Coefficient = Peak I/I Flow / (Peak Rainfall Intensity over Tc * Catchment Area) 8 Hourly Wet‐Weather Peaking Factor: The ratio of peak hourly wet‐weather measured flow and average dry‐weather flow, Wet‐Weather Peaking Factor = Peak Hourly Wet‐Weather Measured Flow / Average Dry-Weather Flow 9 Instantaneous Wet‐Weather Peaking Factor: The ratio of peak wet‐weather measured flow and average dry‐weather flow, Wet‐Weather Peaking Factor = Peak Wet‐Weather Measured Flow / Average Dry-Weather Flow 2
1095 Civica Infrastructure Inc. www.civi.ca
Civica Infrastructures Inc. Kawartha Lakes Flow Monitoring Report
Appendix - A June 03, 2024
I/I Analysis Graph Station: 4-1
1096 Civica Infrastructure Inc. www.civi.ca
Civica Infrastructures Inc. Kawartha Lakes Flow Monitoring Report
Appendix - A June 03, 2024
Infiltration/Inflow Event Analysis Station: 4-1 Aug 21, 2022 09:50 – Aug 23, 2022 16:20, Total Precipitation: 17.50 mm (9,537,500.00 L) Station Details
Storm Details
Catchment Area
54.50 ha
Total Precipitation
17.50 mm (9,537,500.00 L)
Duration of Storm
30.50 hr
Time of Concentration (Tc) 1
40 min
Peak Precipitation Intensity Over Tc 2
9.00 mm/hr
Return Period over Tc 3
< 2 Yr
Measured Flow
I/I Flow
Time of Peak Measured Flow
Aug 21, 2022 23:25
Time of Peak I/I Flow (TD)
Aug 21, 2022 23:25
Estimated Dry Weather Flow at TD
4.31 L/s
Peak Measured Flow
29.60 L/s
Peak I/I Flow 4
25.29 L/s
Peak I/I Rate 5
0.46 L/s/ha
Peak Measured Depth
144.00 mm
Total I/I Flow Volume during event
291,147.70 L
Volumetric Coefficient (Cv%) 6
3.05%
Total Measured Flow Volume during Event
1,117,519.30 L
Peak I/I Coefficient 7
0.0186
Hourly Wet-Weather Peaking Factor 8
3.60
Instantaneous Wet-Weather Peaking Factor 9
5.49
1
Time of Concentration (Tc): The estimated time for the flow to travel from the furthest point in the upstream area to the point of monitoring, assume flow is travelling at 1.00 m/s Peak Precipitation Intensity Over Tc: The peak rainfall intensity for the duration of the storm with the time interval defined by time of concentration 3 Return Period over Tc: The estimated time to elapse before a storm of equal or greater intensity will likely occur again, based on design storm criteria 4 Peak I/I Flow: The greatest difference captured between measured flow and estimated dry weather flow, Peak I/I Flow = Maximum (Measured Flow – Estimated Dry Weather Flow) 5 Peak I/I Rate: A normalized peak I/I flow based on catchment area size, Peak I/I Rate = Peak I/I Flow / Catchment Area 6 Volumetric Coefficient (Cv%): The ratio of total I/I volume and total rainfall volume, Cv% = Total I/I Flow Volume / Total Precipitation Volume * 100% 7 Peak I/ I Coefficient: The ratio of peak I/I flow and peak rainfall intensity, Peak I/ I Coefficient = Peak I/I Flow / (Peak Rainfall Intensity over Tc * Catchment Area) 8 Hourly Wet‐Weather Peaking Factor: The ratio of peak hourly wet‐weather measured flow and average dry‐weather flow, Wet‐Weather Peaking Factor = Peak Hourly Wet‐Weather Measured Flow / Average Dry-Weather Flow 9 Instantaneous Wet‐Weather Peaking Factor: The ratio of peak wet‐weather measured flow and average dry‐weather flow, Wet‐Weather Peaking Factor = Peak Wet‐Weather Measured Flow / Average Dry-Weather Flow 2
1097 Civica Infrastructure Inc. www.civi.ca
Civica Infrastructures Inc. Kawartha Lakes Flow Monitoring Report
Appendix - A June 03, 2024
I/I Analysis Graph Station: 4-1
1098 Civica Infrastructure Inc. www.civi.ca
Civica Infrastructures Inc. Kawartha Lakes Flow Monitoring Report
Appendix - A June 03, 2024
Infiltration/Inflow Event Analysis Station: 4-1 Aug 25, 2022 01:30 – Aug 26, 2022 10:05, Total Precipitation: 16.25 mm (8,856,250.00 L) Station Details
Storm Details
Catchment Area
54.50 ha
Total Precipitation
16.25 mm (8,856,250.00 L)
Duration of Storm
8.58 hr
Time of Concentration (Tc) 1
40 min
Peak Precipitation Intensity Over Tc 2
20.20 mm/hr
Return Period over Tc 3
< 2 Yr
Measured Flow
I/I Flow
Time of Peak Measured Flow
Aug 25, 2022 18:40
Time of Peak I/I Flow (TD)
Aug 25, 2022 18:40
Estimated Dry Weather Flow at TD
7.66 L/s
Peak Measured Flow
49.49 L/s
Peak I/I Flow 4
41.84 L/s
Peak I/I Rate 5
0.77 L/s/ha
Peak Measured Depth
218.00 mm
Total I/I Flow Volume during event
265,262.60 L
Volumetric Coefficient (Cv%) 6
3.00%
Total Measured Flow Volume during Event
663,755.50 L
Peak I/I Coefficient 7
0.0137
Hourly Wet-Weather Peaking Factor 8
6.45
Instantaneous Wet-Weather Peaking Factor 9
9.24
1
Time of Concentration (Tc): The estimated time for the flow to travel from the furthest point in the upstream area to the point of monitoring, assume flow is travelling at 1.00 m/s Peak Precipitation Intensity Over Tc: The peak rainfall intensity for the duration of the storm with the time interval defined by time of concentration 3 Return Period over Tc: The estimated time to elapse before a storm of equal or greater intensity will likely occur again, based on design storm criteria 4 Peak I/I Flow: The greatest difference captured between measured flow and estimated dry weather flow, Peak I/I Flow = Maximum (Measured Flow – Estimated Dry Weather Flow) 5 Peak I/I Rate: A normalized peak I/I flow based on catchment area size, Peak I/I Rate = Peak I/I Flow / Catchment Area 6 Volumetric Coefficient (Cv%): The ratio of total I/I volume and total rainfall volume, Cv% = Total I/I Flow Volume / Total Precipitation Volume * 100% 7 Peak I/ I Coefficient: The ratio of peak I/I flow and peak rainfall intensity, Peak I/ I Coefficient = Peak I/I Flow / (Peak Rainfall Intensity over Tc * Catchment Area) 8 Hourly Wet‐Weather Peaking Factor: The ratio of peak hourly wet‐weather measured flow and average dry‐weather flow, Wet‐Weather Peaking Factor = Peak Hourly Wet‐Weather Measured Flow / Average Dry-Weather Flow 9 Instantaneous Wet‐Weather Peaking Factor: The ratio of peak wet‐weather measured flow and average dry‐weather flow, Wet‐Weather Peaking Factor = Peak Wet‐Weather Measured Flow / Average Dry-Weather Flow 2
1099 Civica Infrastructure Inc. www.civi.ca
Civica Infrastructures Inc. Kawartha Lakes Flow Monitoring Report
Appendix - A June 03, 2024
I/I Analysis Graph Station: 4-1
1100 Civica Infrastructure Inc. www.civi.ca
Civica Infrastructures Inc. Kawartha Lakes Flow Monitoring Report
Appendix - A June 03, 2024
Infiltration/Inflow Event Analysis Station: 4-1 Aug 29, 2022 01:40 – Aug 30, 2022 04:10, Total Precipitation: 29.00 mm (15,805,000.00 L) Station Details
Storm Details
Catchment Area
54.50 ha
Total Precipitation
29.00 mm (15,805,000.00 L)
Duration of Storm
2.50 hr
Time of Concentration (Tc) 1
40 min
Peak Precipitation Intensity Over Tc 2
31.50 mm/hr
Return Period over Tc 3
< 2 Yr
Measured Flow
I/I Flow
Time of Peak Measured Flow
Aug 29, 2022 15:15
Time of Peak I/I Flow (TD)
Aug 29, 2022 15:15
Estimated Dry Weather Flow at TD
6.65 L/s
Peak Measured Flow
65.17 L/s
Peak I/I Flow 4
58.51 L/s
Peak I/I Rate 5
1.07 L/s/ha
Peak Measured Depth
247.00 mm
Total I/I Flow Volume during event
464,928.70 L
Volumetric Coefficient (Cv%) 6
2.94%
Total Measured Flow Volume during Event
750,119.00 L
Peak I/I Coefficient 7
0.0123
Hourly Wet-Weather Peaking Factor 8
9.27
Instantaneous Wet-Weather Peaking Factor 9
12.00
1
Time of Concentration (Tc): The estimated time for the flow to travel from the furthest point in the upstream area to the point of monitoring, assume flow is travelling at 1.00 m/s Peak Precipitation Intensity Over Tc: The peak rainfall intensity for the duration of the storm with the time interval defined by time of concentration 3 Return Period over Tc: The estimated time to elapse before a storm of equal or greater intensity will likely occur again, based on design storm criteria 4 Peak I/I Flow: The greatest difference captured between measured flow and estimated dry weather flow, Peak I/I Flow = Maximum (Measured Flow – Estimated Dry Weather Flow) 5 Peak I/I Rate: A normalized peak I/I flow based on catchment area size, Peak I/I Rate = Peak I/I Flow / Catchment Area 6 Volumetric Coefficient (Cv%): The ratio of total I/I volume and total rainfall volume, Cv% = Total I/I Flow Volume / Total Precipitation Volume * 100% 7 Peak I/ I Coefficient: The ratio of peak I/I flow and peak rainfall intensity, Peak I/ I Coefficient = Peak I/I Flow / (Peak Rainfall Intensity over Tc * Catchment Area) 8 Hourly Wet‐Weather Peaking Factor: The ratio of peak hourly wet‐weather measured flow and average dry‐weather flow, Wet‐Weather Peaking Factor = Peak Hourly Wet‐Weather Measured Flow / Average Dry-Weather Flow 9 Instantaneous Wet‐Weather Peaking Factor: The ratio of peak wet‐weather measured flow and average dry‐weather flow, Wet‐Weather Peaking Factor = Peak Wet‐Weather Measured Flow / Average Dry-Weather Flow 2
1101 Civica Infrastructure Inc. www.civi.ca
Civica Infrastructures Inc. Kawartha Lakes Flow Monitoring Report
Appendix - A June 03, 2024
I/I Analysis Graph Station: 4-1
1102 Civica Infrastructure Inc. www.civi.ca
Civica Infrastructures Inc. Kawartha Lakes Flow Monitoring Report
Appendix - A June 03, 2024
Infiltration/Inflow Event Analysis Station: 4-1 Sep 11, 2022 15:50 – Sep 13, 2022 16:55, Total Precipitation: 21.75 mm (11,853,750.00 L) Station Details
Storm Details
Catchment Area
54.50 ha
Total Precipitation
21.75 mm (11,853,750.00 L)
Duration of Storm
25.08 hr
Time of Concentration (Tc) 1
40 min
Peak Precipitation Intensity Over Tc 2
7.90 mm/hr
Return Period over Tc 3
< 2 Yr
Measured Flow
I/I Flow
Time of Peak Measured Flow
Sep 12, 2022 07:45
Time of Peak I/I Flow (TD)
Sep 12, 2022 07:45
Estimated Dry Weather Flow at TD
6.54 L/s
Peak Measured Flow
22.83 L/s
Peak I/I Flow 4
16.30 L/s
Peak I/I Rate 5
0.30 L/s/ha
Peak Measured Depth
131.00 mm
Total I/I Flow Volume during event
272,262.30 L
Volumetric Coefficient (Cv%) 6
2.30%
Total Measured Flow Volume during Event
1,054,948.30 L
Peak I/I Coefficient 7
0.0137
Hourly Wet-Weather Peaking Factor 8
3.40
Instantaneous Wet-Weather Peaking Factor 9
3.90
1
Time of Concentration (Tc): The estimated time for the flow to travel from the furthest point in the upstream area to the point of monitoring, assume flow is travelling at 1.00 m/s Peak Precipitation Intensity Over Tc: The peak rainfall intensity for the duration of the storm with the time interval defined by time of concentration 3 Return Period over Tc: The estimated time to elapse before a storm of equal or greater intensity will likely occur again, based on design storm criteria 4 Peak I/I Flow: The greatest difference captured between measured flow and estimated dry weather flow, Peak I/I Flow = Maximum (Measured Flow – Estimated Dry Weather Flow) 5 Peak I/I Rate: A normalized peak I/I flow based on catchment area size, Peak I/I Rate = Peak I/I Flow / Catchment Area 6 Volumetric Coefficient (Cv%): The ratio of total I/I volume and total rainfall volume, Cv% = Total I/I Flow Volume / Total Precipitation Volume * 100% 7 Peak I/ I Coefficient: The ratio of peak I/I flow and peak rainfall intensity, Peak I/ I Coefficient = Peak I/I Flow / (Peak Rainfall Intensity over Tc * Catchment Area) 8 Hourly Wet‐Weather Peaking Factor: The ratio of peak hourly wet‐weather measured flow and average dry‐weather flow, Wet‐Weather Peaking Factor = Peak Hourly Wet‐Weather Measured Flow / Average Dry-Weather Flow 9 Instantaneous Wet‐Weather Peaking Factor: The ratio of peak wet‐weather measured flow and average dry‐weather flow, Wet‐Weather Peaking Factor = Peak Wet‐Weather Measured Flow / Average Dry-Weather Flow 2
1103 Civica Infrastructure Inc. www.civi.ca
Civica Infrastructures Inc. Kawartha Lakes Flow Monitoring Report
Appendix - A June 03, 2024
I/I Analysis Graph Station: 4-1
1104 Civica Infrastructure Inc. www.civi.ca
Civica Infrastructures Inc. Kawartha Lakes Flow Monitoring Report
Appendix - A June 03, 2024
Infiltration/Inflow Event Analysis Station: 4-1 Sep 17, 2022 19:35 – Sep 19, 2022 01:10, Total Precipitation: 24.50 mm (13,352,500.00 L) Station Details
Storm Details
Catchment Area
54.50 ha
Total Precipitation
24.50 mm (13,352,500.00 L)
Duration of Storm
5.58 hr
Time of Concentration (Tc) 1
40 min
Peak Precipitation Intensity Over Tc 2
16.10 mm/hr
Return Period over Tc 3
< 2 Yr
Measured Flow
I/I Flow
Time of Peak Measured Flow
Sep 18, 2022 09:10
Time of Peak I/I Flow (TD)
Sep 18, 2022 09:10
Estimated Dry Weather Flow at TD
6.88 L/s
Peak Measured Flow
43.52 L/s
Peak I/I Flow 4
36.64 L/s
Peak I/I Rate 5
0.67 L/s/ha
Peak Measured Depth
194.00 mm
Total I/I Flow Volume during event
554,962.20 L
Volumetric Coefficient (Cv%) 6
4.16%
Total Measured Flow Volume during Event
911,929.80 L
Peak I/I Coefficient 7
0.0150
Hourly Wet-Weather Peaking Factor 8
5.99
Instantaneous Wet-Weather Peaking Factor 9
7.75
1
Time of Concentration (Tc): The estimated time for the flow to travel from the furthest point in the upstream area to the point of monitoring, assume flow is travelling at 1.00 m/s Peak Precipitation Intensity Over Tc: The peak rainfall intensity for the duration of the storm with the time interval defined by time of concentration 3 Return Period over Tc: The estimated time to elapse before a storm of equal or greater intensity will likely occur again, based on design storm criteria 4 Peak I/I Flow: The greatest difference captured between measured flow and estimated dry weather flow, Peak I/I Flow = Maximum (Measured Flow – Estimated Dry Weather Flow) 5 Peak I/I Rate: A normalized peak I/I flow based on catchment area size, Peak I/I Rate = Peak I/I Flow / Catchment Area 6 Volumetric Coefficient (Cv%): The ratio of total I/I volume and total rainfall volume, Cv% = Total I/I Flow Volume / Total Precipitation Volume * 100% 7 Peak I/ I Coefficient: The ratio of peak I/I flow and peak rainfall intensity, Peak I/ I Coefficient = Peak I/I Flow / (Peak Rainfall Intensity over Tc * Catchment Area) 8 Hourly Wet‐Weather Peaking Factor: The ratio of peak hourly wet‐weather measured flow and average dry‐weather flow, Wet‐Weather Peaking Factor = Peak Hourly Wet‐Weather Measured Flow / Average Dry-Weather Flow 9 Instantaneous Wet‐Weather Peaking Factor: The ratio of peak wet‐weather measured flow and average dry‐weather flow, Wet‐Weather Peaking Factor = Peak Wet‐Weather Measured Flow / Average Dry-Weather Flow 2
1105 Civica Infrastructure Inc. www.civi.ca
Civica Infrastructures Inc. Kawartha Lakes Flow Monitoring Report
Appendix - A June 03, 2024
I/I Analysis Graph Station: 4-1
1106 Civica Infrastructure Inc. www.civi.ca
Civica Infrastructures Inc. Kawartha Lakes Flow Monitoring Report
Appendix - A June 03, 2024
Infiltration/Inflow Event Analysis Station: 4-1 Oct 12, 2022 08:40 – Oct 13, 2022 23:55, Total Precipitation: 20.75 mm (11,308,750.00 L) Station Details
Storm Details
Catchment Area
54.50 ha
Total Precipitation
20.75 mm (11,308,750.00 L)
Duration of Storm
15.25 hr
Time of Concentration (Tc) 1
40 min
Peak Precipitation Intensity Over Tc 2
6.40 mm/hr
Return Period over Tc 3
< 2 Yr
Measured Flow
I/I Flow
Time of Peak Measured Flow
Oct 13, 2022 09:10
Time of Peak I/I Flow (TD)
Oct 13, 2022 04:05
Estimated Dry Weather Flow at TD
3.42 L/s
Peak Measured Flow
23.27 L/s
Peak I/I Flow 4
17.72 L/s
Peak I/I Rate 5
0.33 L/s/ha
Peak Measured Depth
144.00 mm
Total I/I Flow Volume during event
349,876.10 L
Volumetric Coefficient (Cv%) 6
3.09%
Total Measured Flow Volume during Event
835,106.30 L
Peak I/I Coefficient 7
0.0184
Hourly Wet-Weather Peaking Factor 8
4.01
Instantaneous Wet-Weather Peaking Factor 9
4.72
1
Time of Concentration (Tc): The estimated time for the flow to travel from the furthest point in the upstream area to the point of monitoring, assume flow is travelling at 1.00 m/s Peak Precipitation Intensity Over Tc: The peak rainfall intensity for the duration of the storm with the time interval defined by time of concentration 3 Return Period over Tc: The estimated time to elapse before a storm of equal or greater intensity will likely occur again, based on design storm criteria 4 Peak I/I Flow: The greatest difference captured between measured flow and estimated dry weather flow, Peak I/I Flow = Maximum (Measured Flow – Estimated Dry Weather Flow) 5 Peak I/I Rate: A normalized peak I/I flow based on catchment area size, Peak I/I Rate = Peak I/I Flow / Catchment Area 6 Volumetric Coefficient (Cv%): The ratio of total I/I volume and total rainfall volume, Cv% = Total I/I Flow Volume / Total Precipitation Volume * 100% 7 Peak I/ I Coefficient: The ratio of peak I/I flow and peak rainfall intensity, Peak I/ I Coefficient = Peak I/I Flow / (Peak Rainfall Intensity over Tc * Catchment Area) 8 Hourly Wet‐Weather Peaking Factor: The ratio of peak hourly wet‐weather measured flow and average dry‐weather flow, Wet‐Weather Peaking Factor = Peak Hourly Wet‐Weather Measured Flow / Average Dry-Weather Flow 9 Instantaneous Wet‐Weather Peaking Factor: The ratio of peak wet‐weather measured flow and average dry‐weather flow, Wet‐Weather Peaking Factor = Peak Wet‐Weather Measured Flow / Average Dry-Weather Flow 2
1107 Civica Infrastructure Inc. www.civi.ca
Civica Infrastructures Inc. Kawartha Lakes Flow Monitoring Report
Appendix - A June 03, 2024
Activity Log Station: 4-1 Date Time
Type
Purpose of Visit
23-Dec-2021 11:45:00 AM
Maintenance Log
CALIBRATION
20-Jan-2022 12:30:00 PM
Maintenance Log
CALIBRATION
09-Feb-2022 10:15:00 AM
03-Mar-2022 10:11:00 AM
Maintenance Log
Maintenance Log
Comment Debris cleared Telemetry sent Velocity not flatlining - don't why it said that on the worksheet Data downloaded Debris cleared Telemetry sent Ensured manual and sensor readings are satisfactory before leaving site
Calibration Measurement Yes
Yes
CALIBRATION
Data downloaded Debris cleared Telemetry sent Ensured manual and sensor readings are satisfactory before leaving site
Yes
calibration
Data downloaded Site calibrated Debris cleared Telemetry sent
Yes
Yes
Yes
17-Mar-2022 12:17:00 PM
Maintenance Log
calibration
Data downloaded site calibrated cleared minor debris telemetry sent
24-Mar-2022 11:27:00 AM
Maintenance Log
CALIBRATION
Data downloaded Debris cleared Telemetry sent
16-May-2022 11:00:00 AM
Maintenance Log
Calibration
Yes
25-May-2022 07:08:00 AM
Maintenance Log
Calibration
Yes
27-Jun-2022 01:45:00 PM
Maintenance Log
CALIBRATION
DATA DOWNLOADED SITE CALIBRATED DEBRIS CALIBRATED TELEMETRY SENT
Yes
ATA DOWNLOADED PHOTOS TAKEN SITE CALIBRATED BATTERY REPLACED CLEARED DEBRIS TELEMETRY SENT ANTENNA DRILLED
Yes
27-Jun-2022 02:51:00 PM
Maintenance Log
CALIBRATION
14-Jul-2022 10:27:00 AM
Maintenance Log
CALIBRATION
14-Jul-2022 10:27:00 AM
Maintenance Log
CALIBRATION
Yes DATA DOWNLOADED, SITE CALIBRATED, TELEMETRY SENT.
1108 Civica Infrastructure Inc. www.civi.ca
Yes
Civica Infrastructures Inc. Kawartha Lakes Flow Monitoring Report Date Time
20-Jul-2022 10:28:00 AM
03-Aug-2022 07:56:00 AM
24-Aug-2022 10:44:00 AM
15-Sep-2022 10:32:00 AM
21-Sep-2022 11:55:00 AM
03-Oct-2022 09:46:00 AM
03-Nov-2022 03:40:00 PM
Appendix - A June 03, 2024 Type
Maintenance Log
Maintenance Log
Maintenance Log
Maintenance Log
Maintenance Log
Maintenance Log
Maintenance Log
Purpose of Visit
Comment
Calibration Measurement
CALIBRATION
DATA DOWNLOADED, SITE CALIBRATED, DEBRIS CLEARED, TELEMETRY SENT
Yes
CALIBRATION
DATA DOWNLOADED, SITE CALIBRATED, TELEMETRY SENT AND CHECKED, PHOTOS TAKEN
Yes
CALIBRATION
DATA DOWNLOADED, SITE CALIBRATED TELEMETRY SENT
Yes
CALIBRATION
DATA DOWNLOADED, SITE CALIBRATED, DEBRIS CLEARED, TELEMETRY SENT, PHOTOS AND VIDEO TAKEN
Yes
CALIBRATION
DATA DOWNLOADED, SITE CALIBRATED, DEBRIS CLEARED, TELEMETRY SENT
Yes
CALIBRATION/SWAP
DATA DOWNLOADED, SITE CALIBRATED, DEBRIS CLEARED TELEMETRY SENT AND CHECKED, LOGGER WAS SWAPPED PHOTO AND VIDEO TAKEN
Yes
CALIBRATION
DATA DOWNLOADED TELEMETRY SENT SITE CALIBRATED LOGGER STARTED PHOTOS TAKEN PRESSURE DEPTH SENSOR INPUT ZEROED
Yes
1109 Civica Infrastructure Inc. www.civi.ca
Civica Infrastructures Inc. Kawartha Lakes Flow Monitoring Report
Appendix - A June 03, 2024
Aggregate Data Station: 5-1a
Level Date From
Date To
Days
Min (m)
Avg (m)
Max (m)
Count
Time of Min1
Time of Max1
Dec 01, 2021
Nov 04, 2022
338
0.01
0.04
0.11
96,997
Sun Aug 14, 2022 02:10
Sun Jun 12, 2022 09:35
Velocity Date From
Date To
Days
Min (m/s)
Avg (m/s)
Max (m/s)
Count
Time of Min1
Time of Max1
Dec 01, 2021
Nov 04, 2022
334
0.00
0.15
1.06
95,630
Thu Dec 02, 2021 11:30
Sun Jul 17, 2022 05:05
Flow Date From
Date To
Days
Min (L/s)
Avg (L/s)
Max (L/s)
Total Volume (1,000,000 L)
Count
Time of Min1
Time of Max1
Dec 01, 2021
Nov 04, 2022
338
0.06
1.35
9.35
39.37
96,997
Sun Aug 14, 2022 02:10
Sun Jun 12, 2022 09:35
Precipitation
1
Date From
Date To
Days
Min (mm)
Avg (mm)
Max (mm)
Sum (mm)
Count
Time of Min1
Time of Max1
Dec 01, 2021
Nov 04, 2022
329
0.00
0.01
9.75
654.45
93,912
Wed Dec 01, 2021 23:35
Mon Jul 25, 2022 00:00
Time of Min and Time of Max will be displayed by first occurrence
1110 Civica Infrastructure Inc. www.civi.ca
Civica Infrastructures Inc. Kawartha Lakes Flow Monitoring Report
Appendix - A June 03, 2024
Sanitary Report Station: 5-1a
1
Average Dry Weather Flow (L/s)
Average Dry Weather Flow (L/c/d)
Average Daily Minimum Dry Weather Flow (L/s)
Average Daily Peak Dry Weather Flow (L/s)
1.113
874.256
0.737
1.903
Peaking Factor
Groundwater Infiltration (L/s)1
Groundwater Infiltration (L/ha/d)
% of GWI in Average DWF
1.710
0.626
9,331.642
56.280
Groundwater infiltration (GWI) is assumed as 85% of the daily minimum flow averaged over the monitoring period
1111 Civica Infrastructure Inc. www.civi.ca
Civica Infrastructures Inc. Kawartha Lakes Flow Monitoring Report
Appendix - A June 03, 2024
Data Chart Station: 5-1a Dec 01, 2021 – Dec 31, 2021
1112 Civica Infrastructure Inc. www.civi.ca
Civica Infrastructures Inc. Kawartha Lakes Flow Monitoring Report
Appendix - A June 03, 2024
Data Chart Station: 5-1a Jan 01, 2022 – Jan 31, 2022
1113 Civica Infrastructure Inc. www.civi.ca
Civica Infrastructures Inc. Kawartha Lakes Flow Monitoring Report
Appendix - A June 03, 2024
Data Chart Station: 5-1a Feb 01, 2022 – Feb 28, 2022
1114 Civica Infrastructure Inc. www.civi.ca
Civica Infrastructures Inc. Kawartha Lakes Flow Monitoring Report
Appendix - A June 03, 2024
Data Chart Station: 5-1a Mar 01, 2022 – Mar 31, 2022
1115 Civica Infrastructure Inc. www.civi.ca
Civica Infrastructures Inc. Kawartha Lakes Flow Monitoring Report
Appendix - A June 03, 2024
Data Chart Station: 5-1a Apr 01, 2022 – Apr 30, 2022
1116 Civica Infrastructure Inc. www.civi.ca
Civica Infrastructures Inc. Kawartha Lakes Flow Monitoring Report
Appendix - A June 03, 2024
Data Chart Station: 5-1a May 01, 2022 – May 31, 2022
1117 Civica Infrastructure Inc. www.civi.ca
Civica Infrastructures Inc. Kawartha Lakes Flow Monitoring Report
Appendix - A June 03, 2024
Data Chart Station: 5-1a Jun 01, 2022 – Jun 30, 2022
1118 Civica Infrastructure Inc. www.civi.ca
Civica Infrastructures Inc. Kawartha Lakes Flow Monitoring Report
Appendix - A June 03, 2024
Data Chart Station: 5-1a Jul 01, 2022 – Jul 31, 2022
1119 Civica Infrastructure Inc. www.civi.ca
Civica Infrastructures Inc. Kawartha Lakes Flow Monitoring Report
Appendix - A June 03, 2024
Data Chart Station: 5-1a Aug 01, 2022 – Aug 31, 2022
1120 Civica Infrastructure Inc. www.civi.ca
Civica Infrastructures Inc. Kawartha Lakes Flow Monitoring Report
Appendix - A June 03, 2024
Data Chart Station: 5-1a Sep 01, 2022 – Sep 30, 2022
1121 Civica Infrastructure Inc. www.civi.ca
Civica Infrastructures Inc. Kawartha Lakes Flow Monitoring Report
Appendix - A June 03, 2024
Data Chart Station: 5-1a Oct 01, 2022 – Oct 31, 2022
1122 Civica Infrastructure Inc. www.civi.ca
Civica Infrastructures Inc. Kawartha Lakes Flow Monitoring Report
Appendix - A June 03, 2024
Data Chart Station: 5-1a Nov 01, 2022 – Nov 04, 2022
1123 Civica Infrastructure Inc. www.civi.ca
Civica Infrastructures Inc. Kawartha Lakes Flow Monitoring Report
Appendix - A June 03, 2024
I/I Analysis Table
1
Event1
Total Precipitation (mm)
Duration (hours)
Peak Intensity Over Tc at Station (mm/hr)
Feb 16, 2022
18.00
12.67
Apr 13, 2022
17.25
May 26, 2022
5-1a Measured Peak Flow (L/s)
Peak I/I Flow (L/s)
Peak I/I Rate (L/s/ha)
Volumetric Runoff Coefficient (CV%)
Peaking Factor (PF)
3.60
5.77
4.61
0.79
22.06 %
4.32
28.67
10.20
3.73
1.66
0.29
4.91 %
0.84
20.25
27.50
14.40
2.66
1.41
0.24
1.96 %
1.58
Jun 06, 2022
30.00
32.42
10.20
4.10
3.06
0.53
5.78 %
3.11
Jun 11, 2022
41.50
25.08
27.00
9.35
8.11
1.40
18.07 %
10.26
Jul 12, 2022
15.50
7.75
25.80
1.23
0.97
0.17
0.46 %
2.44
Jul 18, 2022
21.50
43.25
1.20
2.20
1.77
0.31
6.74 %
4.38
Aug 17, 2022
17.50
1.83
35.40
2.47
2.01
0.35
0.67 %
4.77
Aug 21, 2022
17.50
30.50
12.00
1.49
0.94
0.16
2.09 %
1.83
Aug 25, 2022
16.25
8.58
25.80
4.22
3.46
0.60
7.34 %
5.72
Aug 29, 2022
29.00
2.50
41.40
6.40
5.70
0.98
5.58 %
8.59
Sep 12, 2022
21.75
25.08
9.60
2.03
0.91
0.16
2.16 %
0.94
Sep 18, 2022
24.50
5.58
18.00
3.73
2.75
0.48
5.99 %
2.89
Oct 12, 2022
20.75
15.25
8.40
2.29
1.22
0.21
3.60 %
1.31
Average
22.23
19.05
17.36
3.69
2.76
0.48
6.24 %
3.78
Maximum
41.50
43.25
41.40
9.35
8.11
1.40
22.06 %
10.26
Flow KPIs
Measured Storms
Station: 5-1a
An event is a storm with a minimum volume of 15mm and a minimum inter-event dry period of 12 hours
1124 Civica Infrastructure Inc. www.civi.ca
Civica Infrastructures Inc. Kawartha Lakes Flow Monitoring Report
Appendix - A June 03, 2024
I/I Analysis Graph Station: 5-1a
1125 Civica Infrastructure Inc. www.civi.ca
Civica Infrastructures Inc. Kawartha Lakes Flow Monitoring Report
Appendix - A June 03, 2024
Infiltration/Inflow Event Analysis Station: 5-1a Feb 16, 2022 11:00 – Feb 17, 2022 23:40, Total Precipitation: 18.00 mm (1,044,000.00 L) Station Details
Storm Details
Catchment Area
5.80 ha
Total Precipitation
18.00 mm (1,044,000.00 L)
Duration of Storm
12.67 hr
Time of Concentration (Tc) 1
25 min
Peak Precipitation Intensity Over Tc 2
3.60 mm/hr
Return Period over Tc 3
< 2 Yr
Measured Flow
I/I Flow
Time of Peak Measured Flow
Feb 17, 2022 07:50
Time of Peak I/I Flow (TD)
Feb 17, 2022 07:50
Estimated Dry Weather Flow at TD
1.16 L/s
Peak Measured Flow
5.77 L/s
Peak I/I Flow 4
4.61 L/s
Peak I/I Rate 5
0.79 L/s/ha
Peak Measured Depth
85.70 mm
Total I/I Flow Volume during event
230,290.60 L
Volumetric Coefficient (Cv%) 6
22.06%
Total Measured Flow Volume during Event
325,374.70 L
Peak I/I Coefficient 7
0.0794
Hourly Wet-Weather Peaking Factor 8
4.88
Instantaneous Wet-Weather Peaking Factor 9
5.40
1
Time of Concentration (Tc): The estimated time for the flow to travel from the furthest point in the upstream area to the point of monitoring, assume flow is travelling at 1.00 m/s Peak Precipitation Intensity Over Tc: The peak rainfall intensity for the duration of the storm with the time interval defined by time of concentration 3 Return Period over Tc: The estimated time to elapse before a storm of equal or greater intensity will likely occur again, based on design storm criteria 4 Peak I/I Flow: The greatest difference captured between measured flow and estimated dry weather flow, Peak I/I Flow = Maximum (Measured Flow – Estimated Dry Weather Flow) 5 Peak I/I Rate: A normalized peak I/I flow based on catchment area size, Peak I/I Rate = Peak I/I Flow / Catchment Area 6 Volumetric Coefficient (Cv%): The ratio of total I/I volume and total rainfall volume, Cv% = Total I/I Flow Volume / Total Precipitation Volume * 100% 7 Peak I/ I Coefficient: The ratio of peak I/I flow and peak rainfall intensity, Peak I/ I Coefficient = Peak I/I Flow / (Peak Rainfall Intensity over Tc * Catchment Area) 8 Hourly Wet‐Weather Peaking Factor: The ratio of peak hourly wet‐weather measured flow and average dry‐weather flow, Wet‐Weather Peaking Factor = Peak Hourly Wet‐Weather Measured Flow / Average Dry-Weather Flow 9 Instantaneous Wet‐Weather Peaking Factor: The ratio of peak wet‐weather measured flow and average dry‐weather flow, Wet‐Weather Peaking Factor = Peak Wet‐Weather Measured Flow / Average Dry-Weather Flow 2
1126 Civica Infrastructure Inc. www.civi.ca
Civica Infrastructures Inc. Kawartha Lakes Flow Monitoring Report
Appendix - A June 03, 2024
I/I Analysis Graph Station: 5-1a
1127 Civica Infrastructure Inc. www.civi.ca
Civica Infrastructures Inc. Kawartha Lakes Flow Monitoring Report
Appendix - A June 03, 2024
Infiltration/Inflow Event Analysis Station: 5-1a Apr 12, 2022 17:25 – Apr 14, 2022 22:05, Total Precipitation: 17.25 mm (1,000,500.00 L) Station Details
Storm Details
Catchment Area
5.80 ha
Total Precipitation
17.25 mm (1,000,500.00 L)
Duration of Storm
28.67 hr
Time of Concentration (Tc) 1
25 min
Peak Precipitation Intensity Over Tc 2
10.20 mm/hr
Return Period over Tc 3
< 2 Yr
Measured Flow
I/I Flow
Time of Peak Measured Flow
Apr 14, 2022 16:15
Time of Peak I/I Flow (TD)
Apr 14, 2022 16:15
Estimated Dry Weather Flow at TD
2.07 L/s
Peak Measured Flow
3.73 L/s
Peak I/I Flow 4
1.66 L/s
Peak I/I Rate 5
0.29 L/s/ha
Peak Measured Depth
70.70 mm
Total I/I Flow Volume during event
49,118.20 L
Volumetric Coefficient (Cv%) 6
4.91%
Total Measured Flow Volume during Event
340,334.60 L
Peak I/I Coefficient 7
0.0101
Hourly Wet-Weather Peaking Factor 8
1.45
Instantaneous Wet-Weather Peaking Factor 9
1.88
1
Time of Concentration (Tc): The estimated time for the flow to travel from the furthest point in the upstream area to the point of monitoring, assume flow is travelling at 1.00 m/s Peak Precipitation Intensity Over Tc: The peak rainfall intensity for the duration of the storm with the time interval defined by time of concentration 3 Return Period over Tc: The estimated time to elapse before a storm of equal or greater intensity will likely occur again, based on design storm criteria 4 Peak I/I Flow: The greatest difference captured between measured flow and estimated dry weather flow, Peak I/I Flow = Maximum (Measured Flow – Estimated Dry Weather Flow) 5 Peak I/I Rate: A normalized peak I/I flow based on catchment area size, Peak I/I Rate = Peak I/I Flow / Catchment Area 6 Volumetric Coefficient (Cv%): The ratio of total I/I volume and total rainfall volume, Cv% = Total I/I Flow Volume / Total Precipitation Volume * 100% 7 Peak I/ I Coefficient: The ratio of peak I/I flow and peak rainfall intensity, Peak I/ I Coefficient = Peak I/I Flow / (Peak Rainfall Intensity over Tc * Catchment Area) 8 Hourly Wet‐Weather Peaking Factor: The ratio of peak hourly wet‐weather measured flow and average dry‐weather flow, Wet‐Weather Peaking Factor = Peak Hourly Wet‐Weather Measured Flow / Average Dry-Weather Flow 9 Instantaneous Wet‐Weather Peaking Factor: The ratio of peak wet‐weather measured flow and average dry‐weather flow, Wet‐Weather Peaking Factor = Peak Wet‐Weather Measured Flow / Average Dry-Weather Flow 2
1128 Civica Infrastructure Inc. www.civi.ca
Civica Infrastructures Inc. Kawartha Lakes Flow Monitoring Report
Appendix - A June 03, 2024
I/I Analysis Graph Station: 5-1a
1129 Civica Infrastructure Inc. www.civi.ca
Civica Infrastructures Inc. Kawartha Lakes Flow Monitoring Report
Appendix - A June 03, 2024
Infiltration/Inflow Event Analysis Station: 5-1a May 26, 2022 07:30 – May 28, 2022 11:00, Total Precipitation: 20.25 mm (1,174,500.00 L) Station Details
Storm Details
Catchment Area
5.80 ha
Total Precipitation
20.25 mm (1,174,500.00 L)
Duration of Storm
27.50 hr
Time of Concentration (Tc) 1
25 min
Peak Precipitation Intensity Over Tc 2
14.40 mm/hr
Return Period over Tc 3
< 2 Yr
Measured Flow
I/I Flow
Time of Peak Measured Flow
May 27, 2022 19:30
Time of Peak I/I Flow (TD)
May 27, 2022 19:30
Estimated Dry Weather Flow at TD
1.24 L/s
Peak Measured Flow
2.66 L/s
Peak I/I Flow 4
1.41 L/s
Peak I/I Rate 5
0.24 L/s/ha
Peak Measured Depth
60.70 mm
Total I/I Flow Volume during event
23,012.70 L
Volumetric Coefficient (Cv%) 6
1.96%
Total Measured Flow Volume during Event
150,057.30 L
Peak I/I Coefficient 7
0.0061
Hourly Wet-Weather Peaking Factor 8
2.45
Instantaneous Wet-Weather Peaking Factor 9
2.98
1
Time of Concentration (Tc): The estimated time for the flow to travel from the furthest point in the upstream area to the point of monitoring, assume flow is travelling at 1.00 m/s Peak Precipitation Intensity Over Tc: The peak rainfall intensity for the duration of the storm with the time interval defined by time of concentration 3 Return Period over Tc: The estimated time to elapse before a storm of equal or greater intensity will likely occur again, based on design storm criteria 4 Peak I/I Flow: The greatest difference captured between measured flow and estimated dry weather flow, Peak I/I Flow = Maximum (Measured Flow – Estimated Dry Weather Flow) 5 Peak I/I Rate: A normalized peak I/I flow based on catchment area size, Peak I/I Rate = Peak I/I Flow / Catchment Area 6 Volumetric Coefficient (Cv%): The ratio of total I/I volume and total rainfall volume, Cv% = Total I/I Flow Volume / Total Precipitation Volume * 100% 7 Peak I/ I Coefficient: The ratio of peak I/I flow and peak rainfall intensity, Peak I/ I Coefficient = Peak I/I Flow / (Peak Rainfall Intensity over Tc * Catchment Area) 8 Hourly Wet‐Weather Peaking Factor: The ratio of peak hourly wet‐weather measured flow and average dry‐weather flow, Wet‐Weather Peaking Factor = Peak Hourly Wet‐Weather Measured Flow / Average Dry-Weather Flow 9 Instantaneous Wet‐Weather Peaking Factor: The ratio of peak wet‐weather measured flow and average dry‐weather flow, Wet‐Weather Peaking Factor = Peak Wet‐Weather Measured Flow / Average Dry-Weather Flow 2
1130 Civica Infrastructure Inc. www.civi.ca
Civica Infrastructures Inc. Kawartha Lakes Flow Monitoring Report
Appendix - A June 03, 2024
I/I Analysis Graph Station: 5-1a
1131 Civica Infrastructure Inc. www.civi.ca
Civica Infrastructures Inc. Kawartha Lakes Flow Monitoring Report
Appendix - A June 03, 2024
Infiltration/Inflow Event Analysis Station: 5-1a Jun 05, 2022 18:20 – Jun 08, 2022 02:45, Total Precipitation: 30.00 mm (1,740,000.00 L) Station Details
Storm Details
Catchment Area
5.80 ha
Total Precipitation
30.00 mm (1,740,000.00 L)
Duration of Storm
32.42 hr
Time of Concentration (Tc) 1
25 min
Peak Precipitation Intensity Over Tc 2
10.20 mm/hr
Return Period over Tc 3
< 2 Yr
Measured Flow
I/I Flow
Time of Peak Measured Flow
Jun 07, 2022 09:55
Time of Peak I/I Flow (TD)
Jun 07, 2022 09:55
Estimated Dry Weather Flow at TD
1.04 L/s
Peak Measured Flow
4.10 L/s
Peak I/I Flow 4
3.06 L/s
Peak I/I Rate 5
0.53 L/s/ha
Peak Measured Depth
73.70 mm
Total I/I Flow Volume during event
100,568.10 L
Volumetric Coefficient (Cv%) 6
5.78%
Total Measured Flow Volume during Event
258,165.00 L
Peak I/I Coefficient 7
0.0186
Hourly Wet-Weather Peaking Factor 8
3.61
Instantaneous Wet-Weather Peaking Factor 9
4.17
1
Time of Concentration (Tc): The estimated time for the flow to travel from the furthest point in the upstream area to the point of monitoring, assume flow is travelling at 1.00 m/s Peak Precipitation Intensity Over Tc: The peak rainfall intensity for the duration of the storm with the time interval defined by time of concentration 3 Return Period over Tc: The estimated time to elapse before a storm of equal or greater intensity will likely occur again, based on design storm criteria 4 Peak I/I Flow: The greatest difference captured between measured flow and estimated dry weather flow, Peak I/I Flow = Maximum (Measured Flow – Estimated Dry Weather Flow) 5 Peak I/I Rate: A normalized peak I/I flow based on catchment area size, Peak I/I Rate = Peak I/I Flow / Catchment Area 6 Volumetric Coefficient (Cv%): The ratio of total I/I volume and total rainfall volume, Cv% = Total I/I Flow Volume / Total Precipitation Volume * 100% 7 Peak I/ I Coefficient: The ratio of peak I/I flow and peak rainfall intensity, Peak I/ I Coefficient = Peak I/I Flow / (Peak Rainfall Intensity over Tc * Catchment Area) 8 Hourly Wet‐Weather Peaking Factor: The ratio of peak hourly wet‐weather measured flow and average dry‐weather flow, Wet‐Weather Peaking Factor = Peak Hourly Wet‐Weather Measured Flow / Average Dry-Weather Flow 9 Instantaneous Wet‐Weather Peaking Factor: The ratio of peak wet‐weather measured flow and average dry‐weather flow, Wet‐Weather Peaking Factor = Peak Wet‐Weather Measured Flow / Average Dry-Weather Flow 2
1132 Civica Infrastructure Inc. www.civi.ca
Civica Infrastructures Inc. Kawartha Lakes Flow Monitoring Report
Appendix - A June 03, 2024
I/I Analysis Graph Station: 5-1a
1133 Civica Infrastructure Inc. www.civi.ca
Civica Infrastructures Inc. Kawartha Lakes Flow Monitoring Report
Appendix - A June 03, 2024
Infiltration/Inflow Event Analysis Station: 5-1a Jun 11, 2022 01:55 – Jun 13, 2022 03:00, Total Precipitation: 41.50 mm (2,407,000.00 L) Station Details
Storm Details
Catchment Area
5.80 ha
Total Precipitation
41.50 mm (2,407,000.00 L)
Duration of Storm
25.08 hr
Time of Concentration (Tc) 1
25 min
Peak Precipitation Intensity Over Tc 2
27.00 mm/hr
Return Period over Tc 3
< 2 Yr
Measured Flow
I/I Flow
Time of Peak Measured Flow
Jun 12, 2022 09:35
Time of Peak I/I Flow (TD)
Jun 12, 2022 09:35
Estimated Dry Weather Flow at TD
1.24 L/s
Peak Measured Flow
9.35 L/s
Peak I/I Flow 4
8.11 L/s
Peak I/I Rate 5
1.40 L/s/ha
Peak Measured Depth
105.70 mm
Total I/I Flow Volume during event
435,017.80 L
Volumetric Coefficient (Cv%) 6
18.07%
Total Measured Flow Volume during Event
540,840.40 L
Peak I/I Coefficient 7
0.0187
Hourly Wet-Weather Peaking Factor 8
11.17
Instantaneous Wet-Weather Peaking Factor 9
11.82
1
Time of Concentration (Tc): The estimated time for the flow to travel from the furthest point in the upstream area to the point of monitoring, assume flow is travelling at 1.00 m/s Peak Precipitation Intensity Over Tc: The peak rainfall intensity for the duration of the storm with the time interval defined by time of concentration 3 Return Period over Tc: The estimated time to elapse before a storm of equal or greater intensity will likely occur again, based on design storm criteria 4 Peak I/I Flow: The greatest difference captured between measured flow and estimated dry weather flow, Peak I/I Flow = Maximum (Measured Flow – Estimated Dry Weather Flow) 5 Peak I/I Rate: A normalized peak I/I flow based on catchment area size, Peak I/I Rate = Peak I/I Flow / Catchment Area 6 Volumetric Coefficient (Cv%): The ratio of total I/I volume and total rainfall volume, Cv% = Total I/I Flow Volume / Total Precipitation Volume * 100% 7 Peak I/ I Coefficient: The ratio of peak I/I flow and peak rainfall intensity, Peak I/ I Coefficient = Peak I/I Flow / (Peak Rainfall Intensity over Tc * Catchment Area) 8 Hourly Wet‐Weather Peaking Factor: The ratio of peak hourly wet‐weather measured flow and average dry‐weather flow, Wet‐Weather Peaking Factor = Peak Hourly Wet‐Weather Measured Flow / Average Dry-Weather Flow 9 Instantaneous Wet‐Weather Peaking Factor: The ratio of peak wet‐weather measured flow and average dry‐weather flow, Wet‐Weather Peaking Factor = Peak Wet‐Weather Measured Flow / Average Dry-Weather Flow 2
1134 Civica Infrastructure Inc. www.civi.ca
Civica Infrastructures Inc. Kawartha Lakes Flow Monitoring Report
Appendix - A June 03, 2024
I/I Analysis Graph Station: 5-1a
1135 Civica Infrastructure Inc. www.civi.ca
Civica Infrastructures Inc. Kawartha Lakes Flow Monitoring Report
Appendix - A June 03, 2024
Infiltration/Inflow Event Analysis Station: 5-1a Jul 11, 2022 14:25 – Jul 12, 2022 22:10, Total Precipitation: 15.50 mm (899,000.00 L) Station Details
Storm Details
Catchment Area
5.80 ha
Total Precipitation
15.50 mm (899,000.00 L)
Duration of Storm
7.75 hr
Time of Concentration (Tc) 1
25 min
Peak Precipitation Intensity Over Tc 2
25.80 mm/hr
Return Period over Tc 3
< 2 Yr
Measured Flow
I/I Flow
Time of Peak Measured Flow
Jul 12, 2022 03:20
Time of Peak I/I Flow (TD)
Jul 12, 2022 03:20
Estimated Dry Weather Flow at TD
0.26 L/s
Peak Measured Flow
1.23 L/s
Peak I/I Flow 4
0.97 L/s
Peak I/I Rate 5
0.17 L/s/ha
Peak Measured Depth
42.70 mm
Total I/I Flow Volume during event
4,097.60 L
Volumetric Coefficient (Cv%) 6
0.46%
Total Measured Flow Volume during Event
32,485.50 L
Peak I/I Coefficient 7
0.0023
Hourly Wet-Weather Peaking Factor 8
1.84
Instantaneous Wet-Weather Peaking Factor 9
3.09
1
Time of Concentration (Tc): The estimated time for the flow to travel from the furthest point in the upstream area to the point of monitoring, assume flow is travelling at 1.00 m/s Peak Precipitation Intensity Over Tc: The peak rainfall intensity for the duration of the storm with the time interval defined by time of concentration 3 Return Period over Tc: The estimated time to elapse before a storm of equal or greater intensity will likely occur again, based on design storm criteria 4 Peak I/I Flow: The greatest difference captured between measured flow and estimated dry weather flow, Peak I/I Flow = Maximum (Measured Flow – Estimated Dry Weather Flow) 5 Peak I/I Rate: A normalized peak I/I flow based on catchment area size, Peak I/I Rate = Peak I/I Flow / Catchment Area 6 Volumetric Coefficient (Cv%): The ratio of total I/I volume and total rainfall volume, Cv% = Total I/I Flow Volume / Total Precipitation Volume * 100% 7 Peak I/ I Coefficient: The ratio of peak I/I flow and peak rainfall intensity, Peak I/ I Coefficient = Peak I/I Flow / (Peak Rainfall Intensity over Tc * Catchment Area) 8 Hourly Wet‐Weather Peaking Factor: The ratio of peak hourly wet‐weather measured flow and average dry‐weather flow, Wet‐Weather Peaking Factor = Peak Hourly Wet‐Weather Measured Flow / Average Dry-Weather Flow 9 Instantaneous Wet‐Weather Peaking Factor: The ratio of peak wet‐weather measured flow and average dry‐weather flow, Wet‐Weather Peaking Factor = Peak Wet‐Weather Measured Flow / Average Dry-Weather Flow 2
1136 Civica Infrastructure Inc. www.civi.ca
Civica Infrastructures Inc. Kawartha Lakes Flow Monitoring Report
Appendix - A June 03, 2024
I/I Analysis Graph Station: 5-1a
1137 Civica Infrastructure Inc. www.civi.ca
Civica Infrastructures Inc. Kawartha Lakes Flow Monitoring Report
Appendix - A June 03, 2024
Infiltration/Inflow Event Analysis Station: 5-1a Jul 17, 2022 16:10 – Jul 20, 2022 11:25, Total Precipitation: 21.50 mm (1,247,000.00 L) Station Details
Storm Details
Catchment Area
5.80 ha
Total Precipitation
21.50 mm (1,247,000.00 L)
Duration of Storm
43.25 hr
Time of Concentration (Tc) 1
25 min
Peak Precipitation Intensity Over Tc 2
1.20 mm/hr
Return Period over Tc 3
< 2 Yr
Measured Flow
I/I Flow
Time of Peak Measured Flow
Jul 18, 2022 12:50
Time of Peak I/I Flow (TD)
Jul 18, 2022 12:50
Estimated Dry Weather Flow at TD
0.42 L/s
Peak Measured Flow
2.20 L/s
Peak I/I Flow 4
1.77 L/s
Peak I/I Rate 5
0.31 L/s/ha
Peak Measured Depth
55.70 mm
Total I/I Flow Volume during event
84,013.50 L
Volumetric Coefficient (Cv%) 6
6.74%
Total Measured Flow Volume during Event
164,679.20 L
Peak I/I Coefficient 7
0.0917
Hourly Wet-Weather Peaking Factor 8
5.01
Instantaneous Wet-Weather Peaking Factor 9
5.43
1
Time of Concentration (Tc): The estimated time for the flow to travel from the furthest point in the upstream area to the point of monitoring, assume flow is travelling at 1.00 m/s Peak Precipitation Intensity Over Tc: The peak rainfall intensity for the duration of the storm with the time interval defined by time of concentration 3 Return Period over Tc: The estimated time to elapse before a storm of equal or greater intensity will likely occur again, based on design storm criteria 4 Peak I/I Flow: The greatest difference captured between measured flow and estimated dry weather flow, Peak I/I Flow = Maximum (Measured Flow – Estimated Dry Weather Flow) 5 Peak I/I Rate: A normalized peak I/I flow based on catchment area size, Peak I/I Rate = Peak I/I Flow / Catchment Area 6 Volumetric Coefficient (Cv%): The ratio of total I/I volume and total rainfall volume, Cv% = Total I/I Flow Volume / Total Precipitation Volume * 100% 7 Peak I/ I Coefficient: The ratio of peak I/I flow and peak rainfall intensity, Peak I/ I Coefficient = Peak I/I Flow / (Peak Rainfall Intensity over Tc * Catchment Area) 8 Hourly Wet‐Weather Peaking Factor: The ratio of peak hourly wet‐weather measured flow and average dry‐weather flow, Wet‐Weather Peaking Factor = Peak Hourly Wet‐Weather Measured Flow / Average Dry-Weather Flow 9 Instantaneous Wet‐Weather Peaking Factor: The ratio of peak wet‐weather measured flow and average dry‐weather flow, Wet‐Weather Peaking Factor = Peak Wet‐Weather Measured Flow / Average Dry-Weather Flow 2
1138 Civica Infrastructure Inc. www.civi.ca
Civica Infrastructures Inc. Kawartha Lakes Flow Monitoring Report
Appendix - A June 03, 2024
I/I Analysis Graph Station: 5-1a
1139 Civica Infrastructure Inc. www.civi.ca
Civica Infrastructures Inc. Kawartha Lakes Flow Monitoring Report
Appendix - A June 03, 2024
Infiltration/Inflow Event Analysis Station: 5-1a Aug 17, 2022 03:20 – Aug 18, 2022 05:10, Total Precipitation: 17.50 mm (1,015,000.00 L) Station Details
Storm Details
Catchment Area
5.80 ha
Total Precipitation
17.50 mm (1,015,000.00 L)
Duration of Storm
1.83 hr
Time of Concentration (Tc) 1
25 min
Peak Precipitation Intensity Over Tc 2
35.40 mm/hr
Return Period over Tc 3
< 2 Yr
Measured Flow
I/I Flow
Time of Peak Measured Flow
Aug 17, 2022 15:40
Time of Peak I/I Flow (TD)
Aug 17, 2022 15:40
Estimated Dry Weather Flow at TD
0.46 L/s
Peak Measured Flow
2.47 L/s
Peak I/I Flow 4
2.01 L/s
Peak I/I Rate 5
0.35 L/s/ha
Peak Measured Depth
58.70 mm
Total I/I Flow Volume during event
6,814.50 L
Volumetric Coefficient (Cv%) 6
0.67%
Total Measured Flow Volume during Event
27,914.00 L
Peak I/I Coefficient 7
0.0035
Hourly Wet-Weather Peaking Factor 8
3.27
Instantaneous Wet-Weather Peaking Factor 9
5.86
1
Time of Concentration (Tc): The estimated time for the flow to travel from the furthest point in the upstream area to the point of monitoring, assume flow is travelling at 1.00 m/s Peak Precipitation Intensity Over Tc: The peak rainfall intensity for the duration of the storm with the time interval defined by time of concentration 3 Return Period over Tc: The estimated time to elapse before a storm of equal or greater intensity will likely occur again, based on design storm criteria 4 Peak I/I Flow: The greatest difference captured between measured flow and estimated dry weather flow, Peak I/I Flow = Maximum (Measured Flow – Estimated Dry Weather Flow) 5 Peak I/I Rate: A normalized peak I/I flow based on catchment area size, Peak I/I Rate = Peak I/I Flow / Catchment Area 6 Volumetric Coefficient (Cv%): The ratio of total I/I volume and total rainfall volume, Cv% = Total I/I Flow Volume / Total Precipitation Volume * 100% 7 Peak I/ I Coefficient: The ratio of peak I/I flow and peak rainfall intensity, Peak I/ I Coefficient = Peak I/I Flow / (Peak Rainfall Intensity over Tc * Catchment Area) 8 Hourly Wet‐Weather Peaking Factor: The ratio of peak hourly wet‐weather measured flow and average dry‐weather flow, Wet‐Weather Peaking Factor = Peak Hourly Wet‐Weather Measured Flow / Average Dry-Weather Flow 9 Instantaneous Wet‐Weather Peaking Factor: The ratio of peak wet‐weather measured flow and average dry‐weather flow, Wet‐Weather Peaking Factor = Peak Wet‐Weather Measured Flow / Average Dry-Weather Flow 2
1140 Civica Infrastructure Inc. www.civi.ca
Civica Infrastructures Inc. Kawartha Lakes Flow Monitoring Report
Appendix - A June 03, 2024
I/I Analysis Graph Station: 5-1a
1141 Civica Infrastructure Inc. www.civi.ca
Civica Infrastructures Inc. Kawartha Lakes Flow Monitoring Report
Appendix - A June 03, 2024
Infiltration/Inflow Event Analysis Station: 5-1a Aug 21, 2022 09:50 – Aug 23, 2022 16:20, Total Precipitation: 17.50 mm (1,015,000.00 L) Station Details
Storm Details
Catchment Area
5.80 ha
Total Precipitation
17.50 mm (1,015,000.00 L)
Duration of Storm
30.50 hr
Time of Concentration (Tc) 1
25 min
Peak Precipitation Intensity Over Tc 2
12.00 mm/hr
Return Period over Tc 3
< 2 Yr
Measured Flow
I/I Flow
Time of Peak Measured Flow
Aug 22, 2022 15:15
Time of Peak I/I Flow (TD)
Aug 22, 2022 15:15
Estimated Dry Weather Flow at TD
0.56 L/s
Peak Measured Flow
1.49 L/s
Peak I/I Flow 4
0.94 L/s
Peak I/I Rate 5
0.16 L/s/ha
Peak Measured Depth
46.70 mm
Total I/I Flow Volume during event
21,216.40 L
Volumetric Coefficient (Cv%) 6
2.09%
Total Measured Flow Volume during Event
99,620.10 L
Peak I/I Coefficient 7
0.0049
Hourly Wet-Weather Peaking Factor 8
2.28
Instantaneous Wet-Weather Peaking Factor 9
2.92
1
Time of Concentration (Tc): The estimated time for the flow to travel from the furthest point in the upstream area to the point of monitoring, assume flow is travelling at 1.00 m/s Peak Precipitation Intensity Over Tc: The peak rainfall intensity for the duration of the storm with the time interval defined by time of concentration 3 Return Period over Tc: The estimated time to elapse before a storm of equal or greater intensity will likely occur again, based on design storm criteria 4 Peak I/I Flow: The greatest difference captured between measured flow and estimated dry weather flow, Peak I/I Flow = Maximum (Measured Flow – Estimated Dry Weather Flow) 5 Peak I/I Rate: A normalized peak I/I flow based on catchment area size, Peak I/I Rate = Peak I/I Flow / Catchment Area 6 Volumetric Coefficient (Cv%): The ratio of total I/I volume and total rainfall volume, Cv% = Total I/I Flow Volume / Total Precipitation Volume * 100% 7 Peak I/ I Coefficient: The ratio of peak I/I flow and peak rainfall intensity, Peak I/ I Coefficient = Peak I/I Flow / (Peak Rainfall Intensity over Tc * Catchment Area) 8 Hourly Wet‐Weather Peaking Factor: The ratio of peak hourly wet‐weather measured flow and average dry‐weather flow, Wet‐Weather Peaking Factor = Peak Hourly Wet‐Weather Measured Flow / Average Dry-Weather Flow 9 Instantaneous Wet‐Weather Peaking Factor: The ratio of peak wet‐weather measured flow and average dry‐weather flow, Wet‐Weather Peaking Factor = Peak Wet‐Weather Measured Flow / Average Dry-Weather Flow 2
1142 Civica Infrastructure Inc. www.civi.ca
Civica Infrastructures Inc. Kawartha Lakes Flow Monitoring Report
Appendix - A June 03, 2024
I/I Analysis Graph Station: 5-1a
1143 Civica Infrastructure Inc. www.civi.ca
Civica Infrastructures Inc. Kawartha Lakes Flow Monitoring Report
Appendix - A June 03, 2024
Infiltration/Inflow Event Analysis Station: 5-1a Aug 25, 2022 01:30 – Aug 26, 2022 10:05, Total Precipitation: 16.25 mm (942,500.00 L) Station Details
Storm Details
Catchment Area
5.80 ha
Total Precipitation
16.25 mm (942,500.00 L)
Duration of Storm
8.58 hr
Time of Concentration (Tc) 1
25 min
Peak Precipitation Intensity Over Tc 2
25.80 mm/hr
Return Period over Tc 3
< 2 Yr
Measured Flow
I/I Flow
Time of Peak Measured Flow
Aug 25, 2022 18:55
Time of Peak I/I Flow (TD)
Aug 25, 2022 18:55
Estimated Dry Weather Flow at TD
0.76 L/s
Peak Measured Flow
4.22 L/s
Peak I/I Flow 4
3.46 L/s
Peak I/I Rate 5
0.60 L/s/ha
Peak Measured Depth
74.70 mm
Total I/I Flow Volume during event
69,167.60 L
Volumetric Coefficient (Cv%) 6
7.34%
Total Measured Flow Volume during Event
114,212.00 L
Peak I/I Coefficient 7
0.0083
Hourly Wet-Weather Peaking Factor 8
5.27
Instantaneous Wet-Weather Peaking Factor 9
6.98
1
Time of Concentration (Tc): The estimated time for the flow to travel from the furthest point in the upstream area to the point of monitoring, assume flow is travelling at 1.00 m/s Peak Precipitation Intensity Over Tc: The peak rainfall intensity for the duration of the storm with the time interval defined by time of concentration 3 Return Period over Tc: The estimated time to elapse before a storm of equal or greater intensity will likely occur again, based on design storm criteria 4 Peak I/I Flow: The greatest difference captured between measured flow and estimated dry weather flow, Peak I/I Flow = Maximum (Measured Flow – Estimated Dry Weather Flow) 5 Peak I/I Rate: A normalized peak I/I flow based on catchment area size, Peak I/I Rate = Peak I/I Flow / Catchment Area 6 Volumetric Coefficient (Cv%): The ratio of total I/I volume and total rainfall volume, Cv% = Total I/I Flow Volume / Total Precipitation Volume * 100% 7 Peak I/ I Coefficient: The ratio of peak I/I flow and peak rainfall intensity, Peak I/ I Coefficient = Peak I/I Flow / (Peak Rainfall Intensity over Tc * Catchment Area) 8 Hourly Wet‐Weather Peaking Factor: The ratio of peak hourly wet‐weather measured flow and average dry‐weather flow, Wet‐Weather Peaking Factor = Peak Hourly Wet‐Weather Measured Flow / Average Dry-Weather Flow 9 Instantaneous Wet‐Weather Peaking Factor: The ratio of peak wet‐weather measured flow and average dry‐weather flow, Wet‐Weather Peaking Factor = Peak Wet‐Weather Measured Flow / Average Dry-Weather Flow 2
1144 Civica Infrastructure Inc. www.civi.ca
Civica Infrastructures Inc. Kawartha Lakes Flow Monitoring Report
Appendix - A June 03, 2024
I/I Analysis Graph Station: 5-1a
1145 Civica Infrastructure Inc. www.civi.ca
Civica Infrastructures Inc. Kawartha Lakes Flow Monitoring Report
Appendix - A June 03, 2024
Infiltration/Inflow Event Analysis Station: 5-1a Aug 29, 2022 01:40 – Aug 30, 2022 04:10, Total Precipitation: 29.00 mm (1,682,000.00 L) Station Details
Storm Details
Catchment Area
5.80 ha
Total Precipitation
29.00 mm (1,682,000.00 L)
Duration of Storm
2.50 hr
Time of Concentration (Tc) 1
25 min
Peak Precipitation Intensity Over Tc 2
41.40 mm/hr
Return Period over Tc 3
< 2 Yr
Measured Flow
I/I Flow
Time of Peak Measured Flow
Aug 29, 2022 15:20
Time of Peak I/I Flow (TD)
Aug 29, 2022 15:20
Estimated Dry Weather Flow at TD
0.70 L/s
Peak Measured Flow
6.40 L/s
Peak I/I Flow 4
5.70 L/s
Peak I/I Rate 5
0.98 L/s/ha
Peak Measured Depth
89.70 mm
Total I/I Flow Volume during event
93,797.20 L
Volumetric Coefficient (Cv%) 6
5.58%
Total Measured Flow Volume during Event
128,606.10 L
Peak I/I Coefficient 7
0.0085
Hourly Wet-Weather Peaking Factor 8
7.71
Instantaneous Wet-Weather Peaking Factor 9
9.65
1
Time of Concentration (Tc): The estimated time for the flow to travel from the furthest point in the upstream area to the point of monitoring, assume flow is travelling at 1.00 m/s Peak Precipitation Intensity Over Tc: The peak rainfall intensity for the duration of the storm with the time interval defined by time of concentration 3 Return Period over Tc: The estimated time to elapse before a storm of equal or greater intensity will likely occur again, based on design storm criteria 4 Peak I/I Flow: The greatest difference captured between measured flow and estimated dry weather flow, Peak I/I Flow = Maximum (Measured Flow – Estimated Dry Weather Flow) 5 Peak I/I Rate: A normalized peak I/I flow based on catchment area size, Peak I/I Rate = Peak I/I Flow / Catchment Area 6 Volumetric Coefficient (Cv%): The ratio of total I/I volume and total rainfall volume, Cv% = Total I/I Flow Volume / Total Precipitation Volume * 100% 7 Peak I/ I Coefficient: The ratio of peak I/I flow and peak rainfall intensity, Peak I/ I Coefficient = Peak I/I Flow / (Peak Rainfall Intensity over Tc * Catchment Area) 8 Hourly Wet‐Weather Peaking Factor: The ratio of peak hourly wet‐weather measured flow and average dry‐weather flow, Wet‐Weather Peaking Factor = Peak Hourly Wet‐Weather Measured Flow / Average Dry-Weather Flow 9 Instantaneous Wet‐Weather Peaking Factor: The ratio of peak wet‐weather measured flow and average dry‐weather flow, Wet‐Weather Peaking Factor = Peak Wet‐Weather Measured Flow / Average Dry-Weather Flow 2
1146 Civica Infrastructure Inc. www.civi.ca
Civica Infrastructures Inc. Kawartha Lakes Flow Monitoring Report
Appendix - A June 03, 2024
I/I Analysis Graph Station: 5-1a
1147 Civica Infrastructure Inc. www.civi.ca
Civica Infrastructures Inc. Kawartha Lakes Flow Monitoring Report
Appendix - A June 03, 2024
Infiltration/Inflow Event Analysis Station: 5-1a Sep 11, 2022 15:50 – Sep 13, 2022 16:55, Total Precipitation: 21.75 mm (1,261,500.00 L) Station Details
Storm Details
Catchment Area
5.80 ha
Total Precipitation
21.75 mm (1,261,500.00 L)
Duration of Storm
25.08 hr
Time of Concentration (Tc) 1
25 min
Peak Precipitation Intensity Over Tc 2
9.60 mm/hr
Return Period over Tc 3
< 2 Yr
Measured Flow
I/I Flow
Time of Peak Measured Flow
Sep 12, 2022 06:55
Time of Peak I/I Flow (TD)
Sep 12, 2022 06:55
Estimated Dry Weather Flow at TD
1.12 L/s
Peak Measured Flow
2.03 L/s
Peak I/I Flow 4
0.91 L/s
Peak I/I Rate 5
0.16 L/s/ha
Peak Measured Depth
53.70 mm
Total I/I Flow Volume during event
27,259.50 L
Volumetric Coefficient (Cv%) 6
2.16%
Total Measured Flow Volume during Event
156,442.00 L
Peak I/I Coefficient 7
0.0059
Hourly Wet-Weather Peaking Factor 8
1.89
Instantaneous Wet-Weather Peaking Factor 9
2.10
1
Time of Concentration (Tc): The estimated time for the flow to travel from the furthest point in the upstream area to the point of monitoring, assume flow is travelling at 1.00 m/s Peak Precipitation Intensity Over Tc: The peak rainfall intensity for the duration of the storm with the time interval defined by time of concentration 3 Return Period over Tc: The estimated time to elapse before a storm of equal or greater intensity will likely occur again, based on design storm criteria 4 Peak I/I Flow: The greatest difference captured between measured flow and estimated dry weather flow, Peak I/I Flow = Maximum (Measured Flow – Estimated Dry Weather Flow) 5 Peak I/I Rate: A normalized peak I/I flow based on catchment area size, Peak I/I Rate = Peak I/I Flow / Catchment Area 6 Volumetric Coefficient (Cv%): The ratio of total I/I volume and total rainfall volume, Cv% = Total I/I Flow Volume / Total Precipitation Volume * 100% 7 Peak I/ I Coefficient: The ratio of peak I/I flow and peak rainfall intensity, Peak I/ I Coefficient = Peak I/I Flow / (Peak Rainfall Intensity over Tc * Catchment Area) 8 Hourly Wet‐Weather Peaking Factor: The ratio of peak hourly wet‐weather measured flow and average dry‐weather flow, Wet‐Weather Peaking Factor = Peak Hourly Wet‐Weather Measured Flow / Average Dry-Weather Flow 9 Instantaneous Wet‐Weather Peaking Factor: The ratio of peak wet‐weather measured flow and average dry‐weather flow, Wet‐Weather Peaking Factor = Peak Wet‐Weather Measured Flow / Average Dry-Weather Flow 2
1148 Civica Infrastructure Inc. www.civi.ca
Civica Infrastructures Inc. Kawartha Lakes Flow Monitoring Report
Appendix - A June 03, 2024
I/I Analysis Graph Station: 5-1a
1149 Civica Infrastructure Inc. www.civi.ca
Civica Infrastructures Inc. Kawartha Lakes Flow Monitoring Report
Appendix - A June 03, 2024
Infiltration/Inflow Event Analysis Station: 5-1a Sep 17, 2022 19:35 – Sep 19, 2022 01:10, Total Precipitation: 24.50 mm (1,421,000.00 L) Station Details
Storm Details
Catchment Area
5.80 ha
Total Precipitation
24.50 mm (1,421,000.00 L)
Duration of Storm
5.58 hr
Time of Concentration (Tc) 1
25 min
Peak Precipitation Intensity Over Tc 2
18.00 mm/hr
Return Period over Tc 3
< 2 Yr
Measured Flow
I/I Flow
Time of Peak Measured Flow
Sep 18, 2022 12:10
Time of Peak I/I Flow (TD)
Sep 18, 2022 12:20
Estimated Dry Weather Flow at TD
0.98 L/s
Peak Measured Flow
3.73 L/s
Peak I/I Flow 4
2.75 L/s
Peak I/I Rate 5
0.48 L/s/ha
Peak Measured Depth
70.70 mm
Total I/I Flow Volume during event
85,064.10 L
Volumetric Coefficient (Cv%) 6
5.99%
Total Measured Flow Volume during Event
145,719.00 L
Peak I/I Coefficient 7
0.0095
Hourly Wet-Weather Peaking Factor 8
3.64
Instantaneous Wet-Weather Peaking Factor 9
3.91
1
Time of Concentration (Tc): The estimated time for the flow to travel from the furthest point in the upstream area to the point of monitoring, assume flow is travelling at 1.00 m/s Peak Precipitation Intensity Over Tc: The peak rainfall intensity for the duration of the storm with the time interval defined by time of concentration 3 Return Period over Tc: The estimated time to elapse before a storm of equal or greater intensity will likely occur again, based on design storm criteria 4 Peak I/I Flow: The greatest difference captured between measured flow and estimated dry weather flow, Peak I/I Flow = Maximum (Measured Flow – Estimated Dry Weather Flow) 5 Peak I/I Rate: A normalized peak I/I flow based on catchment area size, Peak I/I Rate = Peak I/I Flow / Catchment Area 6 Volumetric Coefficient (Cv%): The ratio of total I/I volume and total rainfall volume, Cv% = Total I/I Flow Volume / Total Precipitation Volume * 100% 7 Peak I/ I Coefficient: The ratio of peak I/I flow and peak rainfall intensity, Peak I/ I Coefficient = Peak I/I Flow / (Peak Rainfall Intensity over Tc * Catchment Area) 8 Hourly Wet‐Weather Peaking Factor: The ratio of peak hourly wet‐weather measured flow and average dry‐weather flow, Wet‐Weather Peaking Factor = Peak Hourly Wet‐Weather Measured Flow / Average Dry-Weather Flow 9 Instantaneous Wet‐Weather Peaking Factor: The ratio of peak wet‐weather measured flow and average dry‐weather flow, Wet‐Weather Peaking Factor = Peak Wet‐Weather Measured Flow / Average Dry-Weather Flow 2
1150 Civica Infrastructure Inc. www.civi.ca
Civica Infrastructures Inc. Kawartha Lakes Flow Monitoring Report
Appendix - A June 03, 2024
I/I Analysis Graph Station: 5-1a
1151 Civica Infrastructure Inc. www.civi.ca
Civica Infrastructures Inc. Kawartha Lakes Flow Monitoring Report
Appendix - A June 03, 2024
Infiltration/Inflow Event Analysis Station: 5-1a Oct 12, 2022 08:40 – Oct 13, 2022 23:55, Total Precipitation: 20.75 mm (1,203,500.00 L) Station Details
Storm Details
Catchment Area
5.80 ha
Total Precipitation
20.75 mm (1,203,500.00 L)
Duration of Storm
15.25 hr
Time of Concentration (Tc) 1
25 min
Peak Precipitation Intensity Over Tc 2
8.40 mm/hr
Return Period over Tc 3
< 2 Yr
Measured Flow
I/I Flow
Time of Peak Measured Flow
Oct 13, 2022 17:25
Time of Peak I/I Flow (TD)
Oct 13, 2022 17:25
Estimated Dry Weather Flow at TD
1.07 L/s
Peak Measured Flow
2.29 L/s
Peak I/I Flow 4
1.22 L/s
Peak I/I Rate 5
0.21 L/s/ha
Peak Measured Depth
56.70 mm
Total I/I Flow Volume during event
43,325.90 L
Volumetric Coefficient (Cv%) 6
3.60%
Total Measured Flow Volume during Event
134,787.30 L
Peak I/I Coefficient 7
0.0090
Hourly Wet-Weather Peaking Factor 8
2.20
Instantaneous Wet-Weather Peaking Factor 9
2.46
1
Time of Concentration (Tc): The estimated time for the flow to travel from the furthest point in the upstream area to the point of monitoring, assume flow is travelling at 1.00 m/s Peak Precipitation Intensity Over Tc: The peak rainfall intensity for the duration of the storm with the time interval defined by time of concentration 3 Return Period over Tc: The estimated time to elapse before a storm of equal or greater intensity will likely occur again, based on design storm criteria 4 Peak I/I Flow: The greatest difference captured between measured flow and estimated dry weather flow, Peak I/I Flow = Maximum (Measured Flow – Estimated Dry Weather Flow) 5 Peak I/I Rate: A normalized peak I/I flow based on catchment area size, Peak I/I Rate = Peak I/I Flow / Catchment Area 6 Volumetric Coefficient (Cv%): The ratio of total I/I volume and total rainfall volume, Cv% = Total I/I Flow Volume / Total Precipitation Volume * 100% 7 Peak I/ I Coefficient: The ratio of peak I/I flow and peak rainfall intensity, Peak I/ I Coefficient = Peak I/I Flow / (Peak Rainfall Intensity over Tc * Catchment Area) 8 Hourly Wet‐Weather Peaking Factor: The ratio of peak hourly wet‐weather measured flow and average dry‐weather flow, Wet‐Weather Peaking Factor = Peak Hourly Wet‐Weather Measured Flow / Average Dry-Weather Flow 9 Instantaneous Wet‐Weather Peaking Factor: The ratio of peak wet‐weather measured flow and average dry‐weather flow, Wet‐Weather Peaking Factor = Peak Wet‐Weather Measured Flow / Average Dry-Weather Flow 2
1152 Civica Infrastructure Inc. www.civi.ca
Civica Infrastructures Inc. Kawartha Lakes Flow Monitoring Report
Appendix - A June 03, 2024
Activity Log Station: 5-1a Date Time
Type
Purpose of Visit
Comment
Calibration Measurement
02-Dec-2021 10:45:00 AM
Installation Log
Install flume + AV + LiDoTT
Had to replace the expander on the flume to make it fit right - put a smaller expander
Yes
NOTE: - ANTENNA WAS DAMAGED, REPLACED WITH ANTENNA UNDER LID 14-Dec-2021 02:10:00 PM
20-Jan-2022 12:50:00 PM
09-Feb-2022 02:30:00 PM
03-Mar-2022 10:28:00 AM
17-Mar-2022 12:34:00 PM
Maintenance Log
Maintenance Log
Maintenance Log
Maintenance Log
Maintenance Log
DATA DOWNLOADED SITE CALIBRATED DEBRIS CLEARED TELEMETRY SENT
CALIBRATION
Yes
CALIBRATION
Data downloaded Debris cleared Telemetry sent Ensured manual and sensor readings are satisfactory before leaving site
Yes
CALIBRATION
Data downloaded Debris cleared Telemetry sent Ensured manual and sensor readings are satisfactory before leaving site
Yes
calibration
Data downloaded Site calibrated Debris cleared Telemetry sent
Yes
calibration
Data downloaded site calibrated cleared minor debris telemetry sent
Yes
Data downloaded Site calibrated Debris cleared Telemetry sent
Yes
27-Apr-2022 12:17:00 PM
Maintenance Log
CALIBRATION
04-May-2022 07:32:00 AM
Maintenance Log
Calibration
Yes
25-May-2022 07:31:00 AM
Maintenance Log
Calibration
Yes
08-Jun-2022 11:02:00 AM
17-Jun-2022 12:23:00 PM
Maintenance Log
Maintenance Log
calibration
DATA DOWNLOADED, SITE CALIBRATED, DEBRIS CLEARED, TELEMETRY SENT
Yes
CALIBRATION
DATA DOWNLOADED, SITE CALIBRATED, DEBRIS CLEARED, TELEMETRY SENT
Yes
1153 Civica Infrastructure Inc. www.civi.ca
Civica Infrastructures Inc. Kawartha Lakes Flow Monitoring Report Date Time
23-Jun-2022 01:46:00 PM
27-Jun-2022 12:33:00 PM
Appendix - A June 03, 2024 Type
Maintenance Log
Maintenance Log
Purpose of Visit
Comment
Calibration Measurement
Data download and calibration
DATA DOWNLOADED PHOTOS TAKEN SITE CALIBRATED CLEARED DEBRIS TELEMETRY SENT ANTENNA DRILLED
Yes
CALIBRATION
DATA DOWNLOADED SITE CALIBRATED DEBRIS CALIBRATED TELEMETRY SENT
Yes
DATA DOWNLOADED, SITE CALIBRATED, DEBRIS CLEARED, TELEMETRY SENT
Yes
05-Jul-2022 11:49:00 AM
Maintenance Log
CALIBRATION
14-Jul-2022 11:03:00 AM
Maintenance Log
CALIBRATION
14-Jul-2022 11:03:00 AM
20-Jul-2022 09:01:00 AM
25-Aug-2022 08:48:00 AM
15-Sep-2022 10:58:00 AM
21-Sep-2022 12:53:00 PM
03-Oct-2022 12:54:00 PM
Maintenance Log
Maintenance Log
Maintenance Log
Maintenance Log
Maintenance Log
Maintenance Log
Yes
CALIBRATION
DATA DOWNLOADED, SITE CALIBRATED, DEBRIS CLEARED, TELEMETRY SENT. BATTERY REPLACED
Yes
CALIBRATION
DATA DOWNLOADED, SITE CALIBRATED, DEBRIS CLEARED, TELEMETRY SENT AND CHECKED.
Yes
CALIBRATION
DATA DOWNLOADED, SITE CALIBRATED TELEMETRY SENT, DEBRIS CLEARED, PHOTOS TAKEN VIDEO TAKEN
Yes
CALIBRATION
DATA DOWNLOADED, SITE CALIBRATED, DEBRIS CLEARED, TELEMETRY SENT, PHOTOS AND VIDEO TAKEN
Yes
CALIBRATION
DATA DOWNLOADED, SITE CALIBRATED, DEBRIS CLEARED, TELEMETRY SENT, PHOTOS AND VIDEO TAKEN
Yes
CALIBRATION
DATA DOWNLOADED, SITE CALIBRATED, DEBRIS CLEARED TELEMETRY SENT AND CHECKED, PHOTO AND VIDEO TAKEN
Yes
1154 Civica Infrastructure Inc. www.civi.ca
Civica Infrastructures Inc. Kawartha Lakes Flow Monitoring Report Date Time
11-Oct-2022 11:30:00 AM
04-Nov-2022 07:45:00 AM
Appendix - A June 03, 2024 Type
Maintenance Log
Maintenance Log
Purpose of Visit
Comment
Calibration Measurement
CALIBRATION
DATA DOWNLOADED, SITE CALIBRATED, DEBRIS CLEARED, TELEMETRY SENT PHOTO AND VIDEO TAKEN
Yes
CALIBRATION
DATA DOWNLOADED TELEMETRY SENT PHOTOS TAKEN SITE CALIBRATED
Yes
1155 Civica Infrastructure Inc. www.civi.ca
Civica Infrastructures Inc. Kawartha Lakes Flow Monitoring Report
Appendix - A June 03, 2024
Aggregate Data Station: 5-2
Level Date From
Date To
Days
Min (m)
Avg (m)
Max (m)
Count
Time of Min1
Time of Max1
Nov 25, 2021
Nov 04, 2022
296
0.02
0.06
0.16
84,951
Fri Jun 17, 2022 14:15
Sat Mar 19, 2022 16:00
Velocity Date From
Date To
Days
Min (m/s)
Avg (m/s)
Max (m/s)
Count
Time of Min1
Time of Max1
Nov 25, 2021
Nov 04, 2022
296
0.03
0.62
1.20
84,952
Wed Aug 31, 2022 15:40
Sun Jan 23, 2022 21:25
Flow Date From
Date To
Days
Min (L/s)
Avg (L/s)
Max (L/s)
Total Volume (1,000,000 L)
Count
Time of Min1
Time of Max1
Nov 25, 2021
Nov 04, 2022
296
0.80
3.98
23.87
101.49
84,951
Tue Feb 01, 2022 10:40
Sat Mar 19, 2022 18:05
Precipitation
1
Date From
Date To
Days
Min (mm)
Avg (mm)
Max (mm)
Sum (mm)
Count
Time of Min1
Time of Max1
Nov 25, 2021
Nov 04, 2022
335
0.00
0.01
9.75
660.70
95,922
Thu Nov 25, 2021 00:00
Mon Jul 25, 2022 00:00
Time of Min and Time of Max will be displayed by first occurrence
1156 Civica Infrastructure Inc. www.civi.ca
Civica Infrastructures Inc. Kawartha Lakes Flow Monitoring Report
Appendix - A June 03, 2024
Sanitary Report Station: 5-2
1
Average Dry Weather Flow (L/s)
Average Dry Weather Flow (L/c/d)
Average Daily Minimum Dry Weather Flow (L/s)
Average Daily Peak Dry Weather Flow (L/s)
3.556
274.300
2.268
5.266
Peaking Factor
Groundwater Infiltration (L/s)1
Groundwater Infiltration (L/ha/d)
% of GWI in Average DWF
1.481
1.927
4,417.199
54.206
Groundwater infiltration (GWI) is assumed as 85% of the daily minimum flow averaged over the monitoring period
1157 Civica Infrastructure Inc. www.civi.ca
Civica Infrastructures Inc. Kawartha Lakes Flow Monitoring Report
Appendix - A June 03, 2024
Data Chart Station: 5-2 Nov 25, 2021 – Nov 30, 2021
1158 Civica Infrastructure Inc. www.civi.ca
Civica Infrastructures Inc. Kawartha Lakes Flow Monitoring Report
Appendix - A June 03, 2024
Data Chart Station: 5-2 Dec 01, 2021 – Dec 31, 2021
1159 Civica Infrastructure Inc. www.civi.ca
Civica Infrastructures Inc. Kawartha Lakes Flow Monitoring Report
Appendix - A June 03, 2024
Data Chart Station: 5-2 Jan 01, 2022 – Jan 31, 2022
1160 Civica Infrastructure Inc. www.civi.ca
Civica Infrastructures Inc. Kawartha Lakes Flow Monitoring Report
Appendix - A June 03, 2024
Data Chart Station: 5-2 Feb 01, 2022 – Feb 28, 2022
1161 Civica Infrastructure Inc. www.civi.ca
Civica Infrastructures Inc. Kawartha Lakes Flow Monitoring Report
Appendix - A June 03, 2024
Data Chart Station: 5-2 Mar 01, 2022 – Mar 31, 2022
1162 Civica Infrastructure Inc. www.civi.ca
Civica Infrastructures Inc. Kawartha Lakes Flow Monitoring Report
Appendix - A June 03, 2024
Data Chart Station: 5-2 Apr 01, 2022 – Apr 30, 2022
1163 Civica Infrastructure Inc. www.civi.ca
Civica Infrastructures Inc. Kawartha Lakes Flow Monitoring Report
Appendix - A June 03, 2024
Data Chart Station: 5-2 May 01, 2022 – May 31, 2022
1164 Civica Infrastructure Inc. www.civi.ca
Civica Infrastructures Inc. Kawartha Lakes Flow Monitoring Report
Appendix - A June 03, 2024
Data Chart Station: 5-2 Jun 01, 2022 – Jun 30, 2022
1165 Civica Infrastructure Inc. www.civi.ca
Civica Infrastructures Inc. Kawartha Lakes Flow Monitoring Report
Appendix - A June 03, 2024
Data Chart Station: 5-2 Jul 01, 2022 – Jul 31, 2022
1166 Civica Infrastructure Inc. www.civi.ca
Civica Infrastructures Inc. Kawartha Lakes Flow Monitoring Report
Appendix - A June 03, 2024
Data Chart Station: 5-2 Aug 01, 2022 – Aug 31, 2022
1167 Civica Infrastructure Inc. www.civi.ca
Civica Infrastructures Inc. Kawartha Lakes Flow Monitoring Report
Appendix - A June 03, 2024
Data Chart Station: 5-2 Sep 01, 2022 – Sep 30, 2022
1168 Civica Infrastructure Inc. www.civi.ca
Civica Infrastructures Inc. Kawartha Lakes Flow Monitoring Report
Appendix - A June 03, 2024
Data Chart Station: 5-2 Oct 01, 2022 – Oct 31, 2022
1169 Civica Infrastructure Inc. www.civi.ca
Civica Infrastructures Inc. Kawartha Lakes Flow Monitoring Report
Appendix - A June 03, 2024
Data Chart Station: 5-2 Nov 01, 2022 – Nov 04, 2022
1170 Civica Infrastructure Inc. www.civi.ca
Civica Infrastructures Inc. Kawartha Lakes Flow Monitoring Report
Appendix - A June 03, 2024
I/I Analysis Table
1 2
5-2
Event1
Total Precipitation (mm)
Duration (hours)
Peak Intensity Over Tc at Station (mm/hr)
Feb 16, 2022
18.00
12.67
3.00
Apr 13, 2022
17.25
28.67
8.14
May 26, 2022
20.25
27.50
10.70
5.50
2.38
Jun 06, 2022
30.00
32.42
8.60
5.81
Jun 11, 2022
41.50
25.08
23.60
Jul 12, 2022
15.50
7.75
19.70
Jul 18, 2022
21.50
43.25
1.30
Aug 17, 2022
17.50
1.83
25.30
Aug 21, 2022
17.50
30.50
Aug 25, 2022
16.25
Aug 29, 2022
Measured Peak Flow (L/s)
Peak I/I Flow (L/s)
Peak I/I Rate (L/s/ha)
Volumetric Runoff Coefficient (CV%)
Peaking Factor (PF)
19.06
15.76
0.42
9.15 %
4.39
0.06
0.75 %
0.99
2.75
0.07
0.50 %
1.05
21.85
18.06
0.48
3.06 %
6.19
4.59
1.75
0.05
0.53 %
0.58
8.78
5.91
0.16
1.70 %
2.07
7.63
4.48
0.12
0.25 %
1.69
9.40
5.25
1.78
0.05
0.69 %
0.61
8.58
22.30
10.57
6.88
0.18
1.23 %
2.30
29.00
2.50
35.60
12.57
9.41
0.25
0.96 %
3.16
Sep 12, 2022
21.75
25.08
7.30
6.75
3.16
0.08
0.34 %
1.04
Sep 18, 2022
24.50
5.58
15.40
8.91
5.02
0.13
1.05 %
1.50
Oct 12, 2022
20.75
15.25
6.90
7.47
3.86
0.10
0.86 %
1.16
Average
22.23
19.05
14.09
9.60
6.25
0.17
1.62 %
2.06
Maximum
41.50
43.25
35.60
21.85
18.06
0.48
9.15 %
6.19
N/A 2
Flow KPIs
Measured Storms
Station: 5-2
An event is a storm with a minimum volume of 15mm and a minimum inter-event dry period of 12 hours I/I event analysis unable to be completed due to missing flow monitoring data during event
1171 Civica Infrastructure Inc. www.civi.ca
Civica Infrastructures Inc. Kawartha Lakes Flow Monitoring Report
Appendix - A June 03, 2024
I/I Analysis Graph Station: 5-2
1172 Civica Infrastructure Inc. www.civi.ca
Civica Infrastructures Inc. Kawartha Lakes Flow Monitoring Report
Appendix - A June 03, 2024
Infiltration/Inflow Event Analysis Station: 5-2 Feb 16, 2022 11:00 – Feb 17, 2022 23:40, Total Precipitation: 18.00 mm (6,786,000.00 L) Station Details
Storm Details
Catchment Area
37.70 ha
Total Precipitation
18.00 mm (6,786,000.00 L)
Duration of Storm
12.67 hr
Time of Concentration (Tc) 1
35 min
Peak Precipitation Intensity Over Tc 2
3.00 mm/hr
Return Period over Tc 3
< 2 Yr
Measured Flow
I/I Flow
Time of Peak Measured Flow
Feb 17, 2022 07:10
Time of Peak I/I Flow (TD)
Feb 17, 2022 07:10
Estimated Dry Weather Flow at TD
3.30 L/s
Peak Measured Flow
19.06 L/s
Peak I/I Flow 4
15.76 L/s
Peak I/I Rate 5
0.42 L/s/ha
Peak Measured Depth
132.00 mm
Total I/I Flow Volume during event
620,564.40 L
Volumetric Coefficient (Cv%) 6
9.15%
Total Measured Flow Volume during Event
940,156.90 L
Peak I/I Coefficient 7
0.0502
Hourly Wet-Weather Peaking Factor 8
4.92
Instantaneous Wet-Weather Peaking Factor 9
5.31
1
Time of Concentration (Tc): The estimated time for the flow to travel from the furthest point in the upstream area to the point of monitoring, assume flow is travelling at 1.00 m/s Peak Precipitation Intensity Over Tc: The peak rainfall intensity for the duration of the storm with the time interval defined by time of concentration 3 Return Period over Tc: The estimated time to elapse before a storm of equal or greater intensity will likely occur again, based on design storm criteria 4 Peak I/I Flow: The greatest difference captured between measured flow and estimated dry weather flow, Peak I/I Flow = Maximum (Measured Flow – Estimated Dry Weather Flow) 5 Peak I/I Rate: A normalized peak I/I flow based on catchment area size, Peak I/I Rate = Peak I/I Flow / Catchment Area 6 Volumetric Coefficient (Cv%): The ratio of total I/I volume and total rainfall volume, Cv% = Total I/I Flow Volume / Total Precipitation Volume * 100% 7 Peak I/ I Coefficient: The ratio of peak I/I flow and peak rainfall intensity, Peak I/ I Coefficient = Peak I/I Flow / (Peak Rainfall Intensity over Tc * Catchment Area) 8 Hourly Wet‐Weather Peaking Factor: The ratio of peak hourly wet‐weather measured flow and average dry‐weather flow, Wet‐Weather Peaking Factor = Peak Hourly Wet‐Weather Measured Flow / Average Dry-Weather Flow 9 Instantaneous Wet‐Weather Peaking Factor: The ratio of peak wet‐weather measured flow and average dry‐weather flow, Wet‐Weather Peaking Factor = Peak Wet‐Weather Measured Flow / Average Dry-Weather Flow 2
1173 Civica Infrastructure Inc. www.civi.ca
Civica Infrastructures Inc. Kawartha Lakes Flow Monitoring Report
Appendix - A June 03, 2024
I/I Analysis Graph Station: 5-2
1174 Civica Infrastructure Inc. www.civi.ca
Civica Infrastructures Inc. Kawartha Lakes Flow Monitoring Report
Appendix - A June 03, 2024
Infiltration/Inflow Event Analysis Station: 5-2 May 26, 2022 07:30 – May 28, 2022 11:00, Total Precipitation: 20.25 mm (7,634,250.00 L) Station Details
Storm Details
Catchment Area
37.70 ha
Total Precipitation
20.25 mm (7,634,250.00 L)
Duration of Storm
27.50 hr
Time of Concentration (Tc) 1
35 min
Peak Precipitation Intensity Over Tc 2
10.70 mm/hr
Return Period over Tc 3
< 2 Yr
Measured Flow
I/I Flow
Time of Peak Measured Flow
May 27, 2022 19:55
Time of Peak I/I Flow (TD)
May 27, 2022 19:55
Estimated Dry Weather Flow at TD
3.12 L/s
Peak Measured Flow
5.50 L/s
Peak I/I Flow 4
2.38 L/s
Peak I/I Rate 5
0.06 L/s/ha
Peak Measured Depth
79.00 mm
Total I/I Flow Volume during event
56,856.50 L
Volumetric Coefficient (Cv%) 6
0.75%
Total Measured Flow Volume during Event
399,740.60 L
Peak I/I Coefficient 7
0.0021
Hourly Wet-Weather Peaking Factor 8
2.10
Instantaneous Wet-Weather Peaking Factor 9
2.28
1
Time of Concentration (Tc): The estimated time for the flow to travel from the furthest point in the upstream area to the point of monitoring, assume flow is travelling at 1.00 m/s Peak Precipitation Intensity Over Tc: The peak rainfall intensity for the duration of the storm with the time interval defined by time of concentration 3 Return Period over Tc: The estimated time to elapse before a storm of equal or greater intensity will likely occur again, based on design storm criteria 4 Peak I/I Flow: The greatest difference captured between measured flow and estimated dry weather flow, Peak I/I Flow = Maximum (Measured Flow – Estimated Dry Weather Flow) 5 Peak I/I Rate: A normalized peak I/I flow based on catchment area size, Peak I/I Rate = Peak I/I Flow / Catchment Area 6 Volumetric Coefficient (Cv%): The ratio of total I/I volume and total rainfall volume, Cv% = Total I/I Flow Volume / Total Precipitation Volume * 100% 7 Peak I/ I Coefficient: The ratio of peak I/I flow and peak rainfall intensity, Peak I/ I Coefficient = Peak I/I Flow / (Peak Rainfall Intensity over Tc * Catchment Area) 8 Hourly Wet‐Weather Peaking Factor: The ratio of peak hourly wet‐weather measured flow and average dry‐weather flow, Wet‐Weather Peaking Factor = Peak Hourly Wet‐Weather Measured Flow / Average Dry-Weather Flow 9 Instantaneous Wet‐Weather Peaking Factor: The ratio of peak wet‐weather measured flow and average dry‐weather flow, Wet‐Weather Peaking Factor = Peak Wet‐Weather Measured Flow / Average Dry-Weather Flow 2
1175 Civica Infrastructure Inc. www.civi.ca
Civica Infrastructures Inc. Kawartha Lakes Flow Monitoring Report
Appendix - A June 03, 2024
I/I Analysis Graph Station: 5-2
1176 Civica Infrastructure Inc. www.civi.ca
Civica Infrastructures Inc. Kawartha Lakes Flow Monitoring Report
Appendix - A June 03, 2024
Infiltration/Inflow Event Analysis Station: 5-2 Jun 05, 2022 18:20 – Jun 08, 2022 02:45, Total Precipitation: 30.00 mm (11,310,000.00 L) Station Details
Storm Details
Catchment Area
37.70 ha
Total Precipitation
30.00 mm (11,310,000.00 L)
Duration of Storm
32.42 hr
Time of Concentration (Tc) 1
35 min
Peak Precipitation Intensity Over Tc 2
8.60 mm/hr
Return Period over Tc 3
< 2 Yr
Measured Flow
I/I Flow
Time of Peak Measured Flow
Jun 07, 2022 10:20
Time of Peak I/I Flow (TD)
Jun 07, 2022 10:20
Estimated Dry Weather Flow at TD
3.06 L/s
Peak Measured Flow
5.81 L/s
Peak I/I Flow 4
2.75 L/s
Peak I/I Rate 5
0.07 L/s/ha
Peak Measured Depth
88.00 mm
Total I/I Flow Volume during event
56,291.90 L
Volumetric Coefficient (Cv%) 6
0.50%
Total Measured Flow Volume during Event
476,277.70 L
Peak I/I Coefficient 7
0.0031
Hourly Wet-Weather Peaking Factor 8
2.06
Instantaneous Wet-Weather Peaking Factor 9
2.22
1
Time of Concentration (Tc): The estimated time for the flow to travel from the furthest point in the upstream area to the point of monitoring, assume flow is travelling at 1.00 m/s Peak Precipitation Intensity Over Tc: The peak rainfall intensity for the duration of the storm with the time interval defined by time of concentration 3 Return Period over Tc: The estimated time to elapse before a storm of equal or greater intensity will likely occur again, based on design storm criteria 4 Peak I/I Flow: The greatest difference captured between measured flow and estimated dry weather flow, Peak I/I Flow = Maximum (Measured Flow – Estimated Dry Weather Flow) 5 Peak I/I Rate: A normalized peak I/I flow based on catchment area size, Peak I/I Rate = Peak I/I Flow / Catchment Area 6 Volumetric Coefficient (Cv%): The ratio of total I/I volume and total rainfall volume, Cv% = Total I/I Flow Volume / Total Precipitation Volume * 100% 7 Peak I/ I Coefficient: The ratio of peak I/I flow and peak rainfall intensity, Peak I/ I Coefficient = Peak I/I Flow / (Peak Rainfall Intensity over Tc * Catchment Area) 8 Hourly Wet‐Weather Peaking Factor: The ratio of peak hourly wet‐weather measured flow and average dry‐weather flow, Wet‐Weather Peaking Factor = Peak Hourly Wet‐Weather Measured Flow / Average Dry-Weather Flow 9 Instantaneous Wet‐Weather Peaking Factor: The ratio of peak wet‐weather measured flow and average dry‐weather flow, Wet‐Weather Peaking Factor = Peak Wet‐Weather Measured Flow / Average Dry-Weather Flow 2
1177 Civica Infrastructure Inc. www.civi.ca
Civica Infrastructures Inc. Kawartha Lakes Flow Monitoring Report
Appendix - A June 03, 2024
I/I Analysis Graph Station: 5-2
1178 Civica Infrastructure Inc. www.civi.ca
Civica Infrastructures Inc. Kawartha Lakes Flow Monitoring Report
Appendix - A June 03, 2024
Infiltration/Inflow Event Analysis Station: 5-2 Jun 11, 2022 01:55 – Jun 13, 2022 03:00, Total Precipitation: 41.50 mm (15,645,500.00 L) Station Details
Storm Details
Catchment Area
37.70 ha
Total Precipitation
41.50 mm (15,645,500.00 L)
Duration of Storm
25.08 hr
Time of Concentration (Tc) 1
35 min
Peak Precipitation Intensity Over Tc 2
23.60 mm/hr
Return Period over Tc 3
< 2 Yr
Measured Flow
I/I Flow
Time of Peak Measured Flow
Jun 12, 2022 09:50
Time of Peak I/I Flow (TD)
Jun 12, 2022 09:50
Estimated Dry Weather Flow at TD
3.79 L/s
Peak Measured Flow
21.85 L/s
Peak I/I Flow 4
18.06 L/s
Peak I/I Rate 5
0.48 L/s/ha
Peak Measured Depth
129.00 mm
Total I/I Flow Volume during event
478,492.40 L
Volumetric Coefficient (Cv%) 6
3.06%
Total Measured Flow Volume during Event
868,630.90 L
Peak I/I Coefficient 7
0.0073
Hourly Wet-Weather Peaking Factor 8
6.74
Instantaneous Wet-Weather Peaking Factor 9
7.49
1
Time of Concentration (Tc): The estimated time for the flow to travel from the furthest point in the upstream area to the point of monitoring, assume flow is travelling at 1.00 m/s Peak Precipitation Intensity Over Tc: The peak rainfall intensity for the duration of the storm with the time interval defined by time of concentration 3 Return Period over Tc: The estimated time to elapse before a storm of equal or greater intensity will likely occur again, based on design storm criteria 4 Peak I/I Flow: The greatest difference captured between measured flow and estimated dry weather flow, Peak I/I Flow = Maximum (Measured Flow – Estimated Dry Weather Flow) 5 Peak I/I Rate: A normalized peak I/I flow based on catchment area size, Peak I/I Rate = Peak I/I Flow / Catchment Area 6 Volumetric Coefficient (Cv%): The ratio of total I/I volume and total rainfall volume, Cv% = Total I/I Flow Volume / Total Precipitation Volume * 100% 7 Peak I/ I Coefficient: The ratio of peak I/I flow and peak rainfall intensity, Peak I/ I Coefficient = Peak I/I Flow / (Peak Rainfall Intensity over Tc * Catchment Area) 8 Hourly Wet‐Weather Peaking Factor: The ratio of peak hourly wet‐weather measured flow and average dry‐weather flow, Wet‐Weather Peaking Factor = Peak Hourly Wet‐Weather Measured Flow / Average Dry-Weather Flow 9 Instantaneous Wet‐Weather Peaking Factor: The ratio of peak wet‐weather measured flow and average dry‐weather flow, Wet‐Weather Peaking Factor = Peak Wet‐Weather Measured Flow / Average Dry-Weather Flow 2
1179 Civica Infrastructure Inc. www.civi.ca
Civica Infrastructures Inc. Kawartha Lakes Flow Monitoring Report
Appendix - A June 03, 2024
I/I Analysis Graph Station: 5-2
1180 Civica Infrastructure Inc. www.civi.ca
Civica Infrastructures Inc. Kawartha Lakes Flow Monitoring Report
Appendix - A June 03, 2024
Infiltration/Inflow Event Analysis Station: 5-2 Jul 11, 2022 14:25 – Jul 12, 2022 22:10, Total Precipitation: 15.50 mm (5,843,500.00 L) Station Details
Storm Details
Catchment Area
37.70 ha
Total Precipitation
15.50 mm (5,843,500.00 L)
Duration of Storm
7.75 hr
Time of Concentration (Tc) 1
35 min
Peak Precipitation Intensity Over Tc 2
19.70 mm/hr
Return Period over Tc 3
< 2 Yr
Measured Flow
I/I Flow
Time of Peak Measured Flow
Jul 12, 2022 19:15
Time of Peak I/I Flow (TD)
Jul 12, 2022 03:40
Estimated Dry Weather Flow at TD
2.34 L/s
Peak Measured Flow
4.59 L/s
Peak I/I Flow 4
1.75 L/s
Peak I/I Rate 5
0.05 L/s/ha
Peak Measured Depth
71.00 mm
Total I/I Flow Volume during event
31,225.30 L
Volumetric Coefficient (Cv%) 6
0.53%
Total Measured Flow Volume during Event
244,527.90 L
Peak I/I Coefficient 7
0.0009
Hourly Wet-Weather Peaking Factor 8
1.49
Instantaneous Wet-Weather Peaking Factor 9
1.54
1
Time of Concentration (Tc): The estimated time for the flow to travel from the furthest point in the upstream area to the point of monitoring, assume flow is travelling at 1.00 m/s Peak Precipitation Intensity Over Tc: The peak rainfall intensity for the duration of the storm with the time interval defined by time of concentration 3 Return Period over Tc: The estimated time to elapse before a storm of equal or greater intensity will likely occur again, based on design storm criteria 4 Peak I/I Flow: The greatest difference captured between measured flow and estimated dry weather flow, Peak I/I Flow = Maximum (Measured Flow – Estimated Dry Weather Flow) 5 Peak I/I Rate: A normalized peak I/I flow based on catchment area size, Peak I/I Rate = Peak I/I Flow / Catchment Area 6 Volumetric Coefficient (Cv%): The ratio of total I/I volume and total rainfall volume, Cv% = Total I/I Flow Volume / Total Precipitation Volume * 100% 7 Peak I/ I Coefficient: The ratio of peak I/I flow and peak rainfall intensity, Peak I/ I Coefficient = Peak I/I Flow / (Peak Rainfall Intensity over Tc * Catchment Area) 8 Hourly Wet‐Weather Peaking Factor: The ratio of peak hourly wet‐weather measured flow and average dry‐weather flow, Wet‐Weather Peaking Factor = Peak Hourly Wet‐Weather Measured Flow / Average Dry-Weather Flow 9 Instantaneous Wet‐Weather Peaking Factor: The ratio of peak wet‐weather measured flow and average dry‐weather flow, Wet‐Weather Peaking Factor = Peak Wet‐Weather Measured Flow / Average Dry-Weather Flow 2
1181 Civica Infrastructure Inc. www.civi.ca
Civica Infrastructures Inc. Kawartha Lakes Flow Monitoring Report
Appendix - A June 03, 2024
I/I Analysis Graph Station: 5-2
1182 Civica Infrastructure Inc. www.civi.ca
Civica Infrastructures Inc. Kawartha Lakes Flow Monitoring Report
Appendix - A June 03, 2024
Infiltration/Inflow Event Analysis Station: 5-2 Jul 17, 2022 16:10 – Jul 20, 2022 11:25, Total Precipitation: 21.50 mm (8,105,500.00 L) Station Details
Storm Details
Catchment Area
37.70 ha
Total Precipitation
21.50 mm (8,105,500.00 L)
Duration of Storm
43.25 hr
Time of Concentration (Tc) 1
35 min
Peak Precipitation Intensity Over Tc 2
1.30 mm/hr
Return Period over Tc 3
< 2 Yr
Measured Flow
I/I Flow
Time of Peak Measured Flow
Jul 18, 2022 12:45
Time of Peak I/I Flow (TD)
Jul 18, 2022 13:00
Estimated Dry Weather Flow at TD
2.87 L/s
Peak Measured Flow
8.78 L/s
Peak I/I Flow 4
5.91 L/s
Peak I/I Rate 5
0.16 L/s/ha
Peak Measured Depth
83.00 mm
Total I/I Flow Volume during event
137,985.50 L
Volumetric Coefficient (Cv%) 6
1.70%
Total Measured Flow Volume during Event
706,709.10 L
Peak I/I Coefficient 7
0.0439
Hourly Wet-Weather Peaking Factor 8
3.00
Instantaneous Wet-Weather Peaking Factor 9
3.08
1
Time of Concentration (Tc): The estimated time for the flow to travel from the furthest point in the upstream area to the point of monitoring, assume flow is travelling at 1.00 m/s Peak Precipitation Intensity Over Tc: The peak rainfall intensity for the duration of the storm with the time interval defined by time of concentration 3 Return Period over Tc: The estimated time to elapse before a storm of equal or greater intensity will likely occur again, based on design storm criteria 4 Peak I/I Flow: The greatest difference captured between measured flow and estimated dry weather flow, Peak I/I Flow = Maximum (Measured Flow – Estimated Dry Weather Flow) 5 Peak I/I Rate: A normalized peak I/I flow based on catchment area size, Peak I/I Rate = Peak I/I Flow / Catchment Area 6 Volumetric Coefficient (Cv%): The ratio of total I/I volume and total rainfall volume, Cv% = Total I/I Flow Volume / Total Precipitation Volume * 100% 7 Peak I/ I Coefficient: The ratio of peak I/I flow and peak rainfall intensity, Peak I/ I Coefficient = Peak I/I Flow / (Peak Rainfall Intensity over Tc * Catchment Area) 8 Hourly Wet‐Weather Peaking Factor: The ratio of peak hourly wet‐weather measured flow and average dry‐weather flow, Wet‐Weather Peaking Factor = Peak Hourly Wet‐Weather Measured Flow / Average Dry-Weather Flow 9 Instantaneous Wet‐Weather Peaking Factor: The ratio of peak wet‐weather measured flow and average dry‐weather flow, Wet‐Weather Peaking Factor = Peak Wet‐Weather Measured Flow / Average Dry-Weather Flow 2
1183 Civica Infrastructure Inc. www.civi.ca
Civica Infrastructures Inc. Kawartha Lakes Flow Monitoring Report
Appendix - A June 03, 2024
I/I Analysis Graph Station: 5-2
1184 Civica Infrastructure Inc. www.civi.ca
Civica Infrastructures Inc. Kawartha Lakes Flow Monitoring Report
Appendix - A June 03, 2024
Infiltration/Inflow Event Analysis Station: 5-2 Aug 17, 2022 03:20 – Aug 18, 2022 05:10, Total Precipitation: 17.50 mm (6,597,500.00 L) Station Details
Storm Details
Catchment Area
37.70 ha
Total Precipitation
17.50 mm (6,597,500.00 L)
Duration of Storm
1.83 hr
Time of Concentration (Tc) 1
35 min
Peak Precipitation Intensity Over Tc 2
25.30 mm/hr
Return Period over Tc 3
< 2 Yr
Measured Flow
I/I Flow
Time of Peak Measured Flow
Aug 17, 2022 16:05
Time of Peak I/I Flow (TD)
Aug 17, 2022 16:05
Estimated Dry Weather Flow at TD
3.14 L/s
Peak Measured Flow
7.63 L/s
Peak I/I Flow 4
4.48 L/s
Peak I/I Rate 5
0.12 L/s/ha
Peak Measured Depth
69.00 mm
Total I/I Flow Volume during event
16,336.40 L
Volumetric Coefficient (Cv%) 6
0.25%
Total Measured Flow Volume during Event
149,004.30 L
Peak I/I Coefficient 7
0.0017
Hourly Wet-Weather Peaking Factor 8
2.40
Instantaneous Wet-Weather Peaking Factor 9
2.88
1
Time of Concentration (Tc): The estimated time for the flow to travel from the furthest point in the upstream area to the point of monitoring, assume flow is travelling at 1.00 m/s Peak Precipitation Intensity Over Tc: The peak rainfall intensity for the duration of the storm with the time interval defined by time of concentration 3 Return Period over Tc: The estimated time to elapse before a storm of equal or greater intensity will likely occur again, based on design storm criteria 4 Peak I/I Flow: The greatest difference captured between measured flow and estimated dry weather flow, Peak I/I Flow = Maximum (Measured Flow – Estimated Dry Weather Flow) 5 Peak I/I Rate: A normalized peak I/I flow based on catchment area size, Peak I/I Rate = Peak I/I Flow / Catchment Area 6 Volumetric Coefficient (Cv%): The ratio of total I/I volume and total rainfall volume, Cv% = Total I/I Flow Volume / Total Precipitation Volume * 100% 7 Peak I/ I Coefficient: The ratio of peak I/I flow and peak rainfall intensity, Peak I/ I Coefficient = Peak I/I Flow / (Peak Rainfall Intensity over Tc * Catchment Area) 8 Hourly Wet‐Weather Peaking Factor: The ratio of peak hourly wet‐weather measured flow and average dry‐weather flow, Wet‐Weather Peaking Factor = Peak Hourly Wet‐Weather Measured Flow / Average Dry-Weather Flow 9 Instantaneous Wet‐Weather Peaking Factor: The ratio of peak wet‐weather measured flow and average dry‐weather flow, Wet‐Weather Peaking Factor = Peak Wet‐Weather Measured Flow / Average Dry-Weather Flow 2
1185 Civica Infrastructure Inc. www.civi.ca
Civica Infrastructures Inc. Kawartha Lakes Flow Monitoring Report
Appendix - A June 03, 2024
I/I Analysis Graph Station: 5-2
1186 Civica Infrastructure Inc. www.civi.ca
Civica Infrastructures Inc. Kawartha Lakes Flow Monitoring Report
Appendix - A June 03, 2024
Infiltration/Inflow Event Analysis Station: 5-2 Aug 21, 2022 09:50 – Aug 23, 2022 16:20, Total Precipitation: 17.50 mm (6,597,500.00 L) Station Details
Storm Details
Catchment Area
37.70 ha
Total Precipitation
17.50 mm (6,597,500.00 L)
Duration of Storm
30.50 hr
Time of Concentration (Tc) 1
35 min
Peak Precipitation Intensity Over Tc 2
9.40 mm/hr
Return Period over Tc 3
< 2 Yr
Measured Flow
I/I Flow
Time of Peak Measured Flow
Aug 22, 2022 10:30
Time of Peak I/I Flow (TD)
Aug 22, 2022 00:40
Estimated Dry Weather Flow at TD
2.36 L/s
Peak Measured Flow
5.25 L/s
Peak I/I Flow 4
1.78 L/s
Peak I/I Rate 5
0.05 L/s/ha
Peak Measured Depth
72.00 mm
Total I/I Flow Volume during event
45,420.50 L
Volumetric Coefficient (Cv%) 6
0.69%
Total Measured Flow Volume during Event
494,489.30 L
Peak I/I Coefficient 7
0.0018
Hourly Wet-Weather Peaking Factor 8
1.72
Instantaneous Wet-Weather Peaking Factor 9
1.79
1
Time of Concentration (Tc): The estimated time for the flow to travel from the furthest point in the upstream area to the point of monitoring, assume flow is travelling at 1.00 m/s Peak Precipitation Intensity Over Tc: The peak rainfall intensity for the duration of the storm with the time interval defined by time of concentration 3 Return Period over Tc: The estimated time to elapse before a storm of equal or greater intensity will likely occur again, based on design storm criteria 4 Peak I/I Flow: The greatest difference captured between measured flow and estimated dry weather flow, Peak I/I Flow = Maximum (Measured Flow – Estimated Dry Weather Flow) 5 Peak I/I Rate: A normalized peak I/I flow based on catchment area size, Peak I/I Rate = Peak I/I Flow / Catchment Area 6 Volumetric Coefficient (Cv%): The ratio of total I/I volume and total rainfall volume, Cv% = Total I/I Flow Volume / Total Precipitation Volume * 100% 7 Peak I/ I Coefficient: The ratio of peak I/I flow and peak rainfall intensity, Peak I/ I Coefficient = Peak I/I Flow / (Peak Rainfall Intensity over Tc * Catchment Area) 8 Hourly Wet‐Weather Peaking Factor: The ratio of peak hourly wet‐weather measured flow and average dry‐weather flow, Wet‐Weather Peaking Factor = Peak Hourly Wet‐Weather Measured Flow / Average Dry-Weather Flow 9 Instantaneous Wet‐Weather Peaking Factor: The ratio of peak wet‐weather measured flow and average dry‐weather flow, Wet‐Weather Peaking Factor = Peak Wet‐Weather Measured Flow / Average Dry-Weather Flow 2
1187 Civica Infrastructure Inc. www.civi.ca
Civica Infrastructures Inc. Kawartha Lakes Flow Monitoring Report
Appendix - A June 03, 2024
I/I Analysis Graph Station: 5-2
1188 Civica Infrastructure Inc. www.civi.ca
Civica Infrastructures Inc. Kawartha Lakes Flow Monitoring Report
Appendix - A June 03, 2024
Infiltration/Inflow Event Analysis Station: 5-2 Aug 25, 2022 01:30 – Aug 26, 2022 10:05, Total Precipitation: 16.25 mm (6,126,250.00 L) Station Details
Storm Details
Catchment Area
37.70 ha
Total Precipitation
16.25 mm (6,126,250.00 L)
Duration of Storm
8.58 hr
Time of Concentration (Tc) 1
35 min
Peak Precipitation Intensity Over Tc 2
22.30 mm/hr
Return Period over Tc 3
< 2 Yr
Measured Flow
I/I Flow
Time of Peak Measured Flow
Aug 25, 2022 19:30
Time of Peak I/I Flow (TD)
Aug 25, 2022 19:30
Estimated Dry Weather Flow at TD
3.68 L/s
Peak Measured Flow
10.57 L/s
Peak I/I Flow 4
6.88 L/s
Peak I/I Rate 5
0.18 L/s/ha
Peak Measured Depth
85.00 mm
Total I/I Flow Volume during event
75,330.80 L
Volumetric Coefficient (Cv%) 6
1.23%
Total Measured Flow Volume during Event
297,600.70 L
Peak I/I Coefficient 7
0.0030
Hourly Wet-Weather Peaking Factor 8
3.11
Instantaneous Wet-Weather Peaking Factor 9
3.54
1
Time of Concentration (Tc): The estimated time for the flow to travel from the furthest point in the upstream area to the point of monitoring, assume flow is travelling at 1.00 m/s Peak Precipitation Intensity Over Tc: The peak rainfall intensity for the duration of the storm with the time interval defined by time of concentration 3 Return Period over Tc: The estimated time to elapse before a storm of equal or greater intensity will likely occur again, based on design storm criteria 4 Peak I/I Flow: The greatest difference captured between measured flow and estimated dry weather flow, Peak I/I Flow = Maximum (Measured Flow – Estimated Dry Weather Flow) 5 Peak I/I Rate: A normalized peak I/I flow based on catchment area size, Peak I/I Rate = Peak I/I Flow / Catchment Area 6 Volumetric Coefficient (Cv%): The ratio of total I/I volume and total rainfall volume, Cv% = Total I/I Flow Volume / Total Precipitation Volume * 100% 7 Peak I/ I Coefficient: The ratio of peak I/I flow and peak rainfall intensity, Peak I/ I Coefficient = Peak I/I Flow / (Peak Rainfall Intensity over Tc * Catchment Area) 8 Hourly Wet‐Weather Peaking Factor: The ratio of peak hourly wet‐weather measured flow and average dry‐weather flow, Wet‐Weather Peaking Factor = Peak Hourly Wet‐Weather Measured Flow / Average Dry-Weather Flow 9 Instantaneous Wet‐Weather Peaking Factor: The ratio of peak wet‐weather measured flow and average dry‐weather flow, Wet‐Weather Peaking Factor = Peak Wet‐Weather Measured Flow / Average Dry-Weather Flow 2
1189 Civica Infrastructure Inc. www.civi.ca
Civica Infrastructures Inc. Kawartha Lakes Flow Monitoring Report
Appendix - A June 03, 2024
I/I Analysis Graph Station: 5-2
1190 Civica Infrastructure Inc. www.civi.ca
Civica Infrastructures Inc. Kawartha Lakes Flow Monitoring Report
Appendix - A June 03, 2024
Infiltration/Inflow Event Analysis Station: 5-2 Aug 29, 2022 01:40 – Aug 30, 2022 04:10, Total Precipitation: 29.00 mm (10,933,000.00 L) Station Details
Storm Details
Catchment Area
37.70 ha
Total Precipitation
29.00 mm (10,933,000.00 L)
Duration of Storm
2.50 hr
Time of Concentration (Tc) 1
35 min
Peak Precipitation Intensity Over Tc 2
35.60 mm/hr
Return Period over Tc 3
< 2 Yr
Measured Flow
I/I Flow
Time of Peak Measured Flow
Aug 29, 2022 15:55
Time of Peak I/I Flow (TD)
Aug 29, 2022 15:55
Estimated Dry Weather Flow at TD
3.16 L/s
Peak Measured Flow
12.57 L/s
Peak I/I Flow 4
9.41 L/s
Peak I/I Rate 5
0.25 L/s/ha
Peak Measured Depth
93.00 mm
Total I/I Flow Volume during event
104,895.30 L
Volumetric Coefficient (Cv%) 6
0.96%
Total Measured Flow Volume during Event
261,504.80 L
Peak I/I Coefficient 7
0.0025
Hourly Wet-Weather Peaking Factor 8
3.79
Instantaneous Wet-Weather Peaking Factor 9
4.21
1
Time of Concentration (Tc): The estimated time for the flow to travel from the furthest point in the upstream area to the point of monitoring, assume flow is travelling at 1.00 m/s Peak Precipitation Intensity Over Tc: The peak rainfall intensity for the duration of the storm with the time interval defined by time of concentration 3 Return Period over Tc: The estimated time to elapse before a storm of equal or greater intensity will likely occur again, based on design storm criteria 4 Peak I/I Flow: The greatest difference captured between measured flow and estimated dry weather flow, Peak I/I Flow = Maximum (Measured Flow – Estimated Dry Weather Flow) 5 Peak I/I Rate: A normalized peak I/I flow based on catchment area size, Peak I/I Rate = Peak I/I Flow / Catchment Area 6 Volumetric Coefficient (Cv%): The ratio of total I/I volume and total rainfall volume, Cv% = Total I/I Flow Volume / Total Precipitation Volume * 100% 7 Peak I/ I Coefficient: The ratio of peak I/I flow and peak rainfall intensity, Peak I/ I Coefficient = Peak I/I Flow / (Peak Rainfall Intensity over Tc * Catchment Area) 8 Hourly Wet‐Weather Peaking Factor: The ratio of peak hourly wet‐weather measured flow and average dry‐weather flow, Wet‐Weather Peaking Factor = Peak Hourly Wet‐Weather Measured Flow / Average Dry-Weather Flow 9 Instantaneous Wet‐Weather Peaking Factor: The ratio of peak wet‐weather measured flow and average dry‐weather flow, Wet‐Weather Peaking Factor = Peak Wet‐Weather Measured Flow / Average Dry-Weather Flow 2
1191 Civica Infrastructure Inc. www.civi.ca
Civica Infrastructures Inc. Kawartha Lakes Flow Monitoring Report
Appendix - A June 03, 2024
I/I Analysis Graph Station: 5-2
1192 Civica Infrastructure Inc. www.civi.ca
Civica Infrastructures Inc. Kawartha Lakes Flow Monitoring Report
Appendix - A June 03, 2024
Infiltration/Inflow Event Analysis Station: 5-2 Sep 11, 2022 15:50 – Sep 13, 2022 16:55, Total Precipitation: 21.75 mm (8,199,750.00 L) Station Details
Storm Details
Catchment Area
37.70 ha
Total Precipitation
21.75 mm (8,199,750.00 L)
Duration of Storm
25.08 hr
Time of Concentration (Tc) 1
35 min
Peak Precipitation Intensity Over Tc 2
7.30 mm/hr
Return Period over Tc 3
< 2 Yr
Measured Flow
I/I Flow
Time of Peak Measured Flow
Sep 12, 2022 07:30
Time of Peak I/I Flow (TD)
Sep 12, 2022 07:45
Estimated Dry Weather Flow at TD
3.59 L/s
Peak Measured Flow
6.75 L/s
Peak I/I Flow 4
3.16 L/s
Peak I/I Rate 5
0.08 L/s/ha
Peak Measured Depth
72.00 mm
Total I/I Flow Volume during event
28,031.80 L
Volumetric Coefficient (Cv%) 6
0.34%
Total Measured Flow Volume during Event
435,261.50 L
Peak I/I Coefficient 7
0.0041
Hourly Wet-Weather Peaking Factor 8
2.10
Instantaneous Wet-Weather Peaking Factor 9
2.22
1
Time of Concentration (Tc): The estimated time for the flow to travel from the furthest point in the upstream area to the point of monitoring, assume flow is travelling at 1.00 m/s Peak Precipitation Intensity Over Tc: The peak rainfall intensity for the duration of the storm with the time interval defined by time of concentration 3 Return Period over Tc: The estimated time to elapse before a storm of equal or greater intensity will likely occur again, based on design storm criteria 4 Peak I/I Flow: The greatest difference captured between measured flow and estimated dry weather flow, Peak I/I Flow = Maximum (Measured Flow – Estimated Dry Weather Flow) 5 Peak I/I Rate: A normalized peak I/I flow based on catchment area size, Peak I/I Rate = Peak I/I Flow / Catchment Area 6 Volumetric Coefficient (Cv%): The ratio of total I/I volume and total rainfall volume, Cv% = Total I/I Flow Volume / Total Precipitation Volume * 100% 7 Peak I/ I Coefficient: The ratio of peak I/I flow and peak rainfall intensity, Peak I/ I Coefficient = Peak I/I Flow / (Peak Rainfall Intensity over Tc * Catchment Area) 8 Hourly Wet‐Weather Peaking Factor: The ratio of peak hourly wet‐weather measured flow and average dry‐weather flow, Wet‐Weather Peaking Factor = Peak Hourly Wet‐Weather Measured Flow / Average Dry-Weather Flow 9 Instantaneous Wet‐Weather Peaking Factor: The ratio of peak wet‐weather measured flow and average dry‐weather flow, Wet‐Weather Peaking Factor = Peak Wet‐Weather Measured Flow / Average Dry-Weather Flow 2
1193 Civica Infrastructure Inc. www.civi.ca
Civica Infrastructures Inc. Kawartha Lakes Flow Monitoring Report
Appendix - A June 03, 2024
I/I Analysis Graph Station: 5-2
1194 Civica Infrastructure Inc. www.civi.ca
Civica Infrastructures Inc. Kawartha Lakes Flow Monitoring Report
Appendix - A June 03, 2024
Infiltration/Inflow Event Analysis Station: 5-2 Sep 17, 2022 19:35 – Sep 19, 2022 01:10, Total Precipitation: 24.50 mm (9,236,500.00 L) Station Details
Storm Details
Catchment Area
37.70 ha
Total Precipitation
24.50 mm (9,236,500.00 L)
Duration of Storm
5.58 hr
Time of Concentration (Tc) 1
35 min
Peak Precipitation Intensity Over Tc 2
15.40 mm/hr
Return Period over Tc 3
< 2 Yr
Measured Flow
I/I Flow
Time of Peak Measured Flow
Sep 18, 2022 11:30
Time of Peak I/I Flow (TD)
Sep 18, 2022 11:30
Estimated Dry Weather Flow at TD
3.89 L/s
Peak Measured Flow
8.91 L/s
Peak I/I Flow 4
5.02 L/s
Peak I/I Rate 5
0.13 L/s/ha
Peak Measured Depth
81.00 mm
Total I/I Flow Volume during event
96,819.50 L
Volumetric Coefficient (Cv%) 6
1.05%
Total Measured Flow Volume during Event
309,888.30 L
Peak I/I Coefficient 7
0.0031
Hourly Wet-Weather Peaking Factor 8
2.54
Instantaneous Wet-Weather Peaking Factor 9
2.66
1
Time of Concentration (Tc): The estimated time for the flow to travel from the furthest point in the upstream area to the point of monitoring, assume flow is travelling at 1.00 m/s Peak Precipitation Intensity Over Tc: The peak rainfall intensity for the duration of the storm with the time interval defined by time of concentration 3 Return Period over Tc: The estimated time to elapse before a storm of equal or greater intensity will likely occur again, based on design storm criteria 4 Peak I/I Flow: The greatest difference captured between measured flow and estimated dry weather flow, Peak I/I Flow = Maximum (Measured Flow – Estimated Dry Weather Flow) 5 Peak I/I Rate: A normalized peak I/I flow based on catchment area size, Peak I/I Rate = Peak I/I Flow / Catchment Area 6 Volumetric Coefficient (Cv%): The ratio of total I/I volume and total rainfall volume, Cv% = Total I/I Flow Volume / Total Precipitation Volume * 100% 7 Peak I/ I Coefficient: The ratio of peak I/I flow and peak rainfall intensity, Peak I/ I Coefficient = Peak I/I Flow / (Peak Rainfall Intensity over Tc * Catchment Area) 8 Hourly Wet‐Weather Peaking Factor: The ratio of peak hourly wet‐weather measured flow and average dry‐weather flow, Wet‐Weather Peaking Factor = Peak Hourly Wet‐Weather Measured Flow / Average Dry-Weather Flow 9 Instantaneous Wet‐Weather Peaking Factor: The ratio of peak wet‐weather measured flow and average dry‐weather flow, Wet‐Weather Peaking Factor = Peak Wet‐Weather Measured Flow / Average Dry-Weather Flow 2
1195 Civica Infrastructure Inc. www.civi.ca
Civica Infrastructures Inc. Kawartha Lakes Flow Monitoring Report
Appendix - A June 03, 2024
I/I Analysis Graph Station: 5-2
1196 Civica Infrastructure Inc. www.civi.ca
Civica Infrastructures Inc. Kawartha Lakes Flow Monitoring Report
Appendix - A June 03, 2024
Infiltration/Inflow Event Analysis Station: 5-2 Oct 12, 2022 08:40 – Oct 13, 2022 23:55, Total Precipitation: 20.75 mm (7,822,750.00 L) Station Details
Storm Details
Catchment Area
37.70 ha
Total Precipitation
20.75 mm (7,822,750.00 L)
Duration of Storm
15.25 hr
Time of Concentration (Tc) 1
35 min
Peak Precipitation Intensity Over Tc 2
6.90 mm/hr
Return Period over Tc 3
< 2 Yr
Measured Flow
I/I Flow
Time of Peak Measured Flow
Oct 13, 2022 09:40
Time of Peak I/I Flow (TD)
Oct 13, 2022 09:40
Estimated Dry Weather Flow at TD
3.62 L/s
Peak Measured Flow
7.47 L/s
Peak I/I Flow 4
3.86 L/s
Peak I/I Rate 5
0.10 L/s/ha
Peak Measured Depth
75.00 mm
Total I/I Flow Volume during event
67,183.90 L
Volumetric Coefficient (Cv%) 6
0.86%
Total Measured Flow Volume during Event
393,124.30 L
Peak I/I Coefficient 7
0.0054
Hourly Wet-Weather Peaking Factor 8
2.14
Instantaneous Wet-Weather Peaking Factor 9
2.26
1
Time of Concentration (Tc): The estimated time for the flow to travel from the furthest point in the upstream area to the point of monitoring, assume flow is travelling at 1.00 m/s Peak Precipitation Intensity Over Tc: The peak rainfall intensity for the duration of the storm with the time interval defined by time of concentration 3 Return Period over Tc: The estimated time to elapse before a storm of equal or greater intensity will likely occur again, based on design storm criteria 4 Peak I/I Flow: The greatest difference captured between measured flow and estimated dry weather flow, Peak I/I Flow = Maximum (Measured Flow – Estimated Dry Weather Flow) 5 Peak I/I Rate: A normalized peak I/I flow based on catchment area size, Peak I/I Rate = Peak I/I Flow / Catchment Area 6 Volumetric Coefficient (Cv%): The ratio of total I/I volume and total rainfall volume, Cv% = Total I/I Flow Volume / Total Precipitation Volume * 100% 7 Peak I/ I Coefficient: The ratio of peak I/I flow and peak rainfall intensity, Peak I/ I Coefficient = Peak I/I Flow / (Peak Rainfall Intensity over Tc * Catchment Area) 8 Hourly Wet‐Weather Peaking Factor: The ratio of peak hourly wet‐weather measured flow and average dry‐weather flow, Wet‐Weather Peaking Factor = Peak Hourly Wet‐Weather Measured Flow / Average Dry-Weather Flow 9 Instantaneous Wet‐Weather Peaking Factor: The ratio of peak wet‐weather measured flow and average dry‐weather flow, Wet‐Weather Peaking Factor = Peak Wet‐Weather Measured Flow / Average Dry-Weather Flow 2
1197 Civica Infrastructure Inc. www.civi.ca
Civica Infrastructures Inc. Kawartha Lakes Flow Monitoring Report
Appendix - A June 03, 2024
Activity Log Station: 5-2 Date Time
Type
Purpose of Visit
25-Nov-2021 11:11:00 AM
Installation Log
Installation
20-Jan-2022 02:45:00 PM
Maintenance Log
CALIBRATION
09-Feb-2022 03:00:00 PM
Maintenance Log
CALIBRATION
Comment MANWINCH IS REQUIRED PMAC ID: 8078 Data downloaded Debris cleared Telemetry sent Ensured manual and sensor readings are satisfactory before leaving site Data downloaded Debris cleared Telemetry sent Ensured manual and sensor readings are satisfactory before leaving site
Calibration Measurement Yes
Yes
Yes
NOTE: Could not connect to logger. Tried for quite some time but hands started to hurt 03-Mar-2022 11:18:00 AM
Maintenance Log
calibration
Yes Site calibrated Debris cleared
17-Mar-2022 12:53:00 PM
Maintenance Log
Data downloaded site calibrated telemetry sent
calibration
Yes
NOTE: Loose cable and was on the channel that caught a lot of debris causing blockage in the outlet and water irised up to the benching. Not able to connect to the logger. swap logger. Set manual input to match manual reading 27-Apr-2022 03:26:00 PM
Maintenance Log
Swap
REMOVED: LOGGER S/N: 20193379637 PMAC: 8078 INSTALLED: LOGGER S/N 220220551126 PMAC: 8335
Yes
Data cannot be downloaded from old logger Site calibrated Debris cleared Telemetry sent 04-May-2022 10:14:00 AM
Maintenance Log
Calibration
Yes
25-May-2022 09:00:00 AM
Maintenance Log
Calibration
Yes
25-May-2022 09:00:00 AM
Maintenance Log
Calibration
Yes
17-Jun-2022 11:57:00 AM
Maintenance Log
CALIBRATION
DATA DOWNLOADED, SITE CALIBRATED, DEBRIS CLEARED, TELEMETRY SENT
27-Jun-2022 01:12:00 PM
Maintenance Log
CALIBRATION
DATA DOWNLOADED SITE CALIBRATED
1198 Civica Infrastructure Inc. www.civi.ca
Yes
Yes
Civica Infrastructures Inc. Kawartha Lakes Flow Monitoring Report Date Time
Appendix - A June 03, 2024 Type
Purpose of Visit
Comment
Calibration Measurement
DEBRIS CALIBRATED TELEMETRY SENT 20-Jul-2022 10:59:00 AM
Maintenance Log
CALIBRATION
25-Aug-2022 10:23:00 AM
Maintenance Log
CALIBRATION
DATA DOWNLOADED, TELEMETRY SENT AND CHECKED, PHOTOS TAKEN
Yes
CALIBRATION
DATA DOWNLOADED, SITE CALIBRATED, DEBRIS CLEARED, TELEMETRY SENT, PHOTOS AND VIDEO TAKEN
Yes
CALIBRATION
DATA DOWNLOADED, SITE CALIBRATED, DEBRIS CLEARED, TELEMETRY SENT PHOTO AND VIDEO TAKEN
Yes
CALIBRATION
DATA DOWNLOADED, SITE CALIBRATED, DEBRIS CLEARED TELEMETRY SENT AND CHECKED, PHOTO AND VIDEO TAKEN
Yes
CALIBRATION
DATA DOWNLOADED, SITE CALIBRATED, DEBRIS CLEARED, TELEMETRY SENT PHOTO AND VIDEO TAKEN, MANWINCH REQUIRED
Yes
CALIBRATION
DATA DOWNLOADED TELEMETRY SENT PHOTOS TAKEN SITE CALIBRATED DEPTH VALUE DRIFTED TO 0.710M,ZEROED THE VALUE
Yes
15-Sep-2022 11:24:00 AM
22-Sep-2022 08:00:00 AM
04-Oct-2022 07:47:00 AM
11-Oct-2022 11:56:00 AM
04-Nov-2022 08:16:00 AM
Maintenance Log
Maintenance Log
Maintenance Log
Maintenance Log
Maintenance Log
Yes
1199 Civica Infrastructure Inc. www.civi.ca
Civica Infrastructures Inc. Kawartha Lakes Flow Monitoring Report
Appendix - A June 03, 2024
Aggregate Data Station: 6-1
Level Date From
Date To
Days
Min (m)
Avg (m)
Max (m)
Count
Time of Min1
Time of Max1
Nov 18, 2021
Aug 02, 2022
222
0.00
0.03
0.07
62,984
Tue Dec 14, 2021 17:05
Mon Mar 21, 2022 18:50
Velocity Date From
Date To
Days
Min (m/s)
Avg (m/s)
Max (m/s)
Count
Time of Min1
Time of Max1
Nov 18, 2021
Aug 02, 2022
222
0.16
0.89
1.86
62,984
Fri Mar 18, 2022 01:50
Mon Dec 06, 2021 19:05
Flow Date From
Date To
Days
Min (L/s)
Avg (L/s)
Max (L/s)
Total Volume (1,000,000 L)
Count
Time of Min1
Time of Max1
Nov 18, 2021
Aug 02, 2022
222
0.00
2.86
17.76
54.07
62,984
Tue Dec 14, 2021 17:05
Mon Mar 21, 2022 18:50
Precipitation
1
Date From
Date To
Days
Min (mm)
Avg (mm)
Max (mm)
Sum (mm)
Count
Time of Min1
Time of Max1
Nov 18, 2021
Aug 02, 2022
248
0.00
0.01
9.75
437.20
70,700
Thu Nov 18, 2021 14:00
Mon Jul 25, 2022 00:00
Time of Min and Time of Max will be displayed by first occurrence
1200 Civica Infrastructure Inc. www.civi.ca
Civica Infrastructures Inc. Kawartha Lakes Flow Monitoring Report
Appendix - A June 03, 2024
Sanitary Report Station: 6-1
1
Average Dry Weather Flow (L/s)
Average Dry Weather Flow (L/c/d)
Average Daily Minimum Dry Weather Flow (L/s)
Average Daily Peak Dry Weather Flow (L/s)
2.415
671.001
0.855
6.357
Peaking Factor
Groundwater Infiltration (L/s)1
Groundwater Infiltration (L/ha/d)
% of GWI in Average DWF
2.632
0.727
5,021.678
30.080
Groundwater infiltration (GWI) is assumed as 85% of the daily minimum flow averaged over the monitoring period
1201 Civica Infrastructure Inc. www.civi.ca
Civica Infrastructures Inc. Kawartha Lakes Flow Monitoring Report
Appendix - A June 03, 2024
Data Chart Station: 6-1 Nov 18, 2021 – Nov 30, 2021
1202 Civica Infrastructure Inc. www.civi.ca
Civica Infrastructures Inc. Kawartha Lakes Flow Monitoring Report
Appendix - A June 03, 2024
Data Chart Station: 6-1 Dec 01, 2021 – Dec 31, 2021
1203 Civica Infrastructure Inc. www.civi.ca
Civica Infrastructures Inc. Kawartha Lakes Flow Monitoring Report
Appendix - A June 03, 2024
Data Chart Station: 6-1 Jan 01, 2022 – Jan 31, 2022
1204 Civica Infrastructure Inc. www.civi.ca
Civica Infrastructures Inc. Kawartha Lakes Flow Monitoring Report
Appendix - A June 03, 2024
Data Chart Station: 6-1 Feb 01, 2022 – Feb 28, 2022
1205 Civica Infrastructure Inc. www.civi.ca
Civica Infrastructures Inc. Kawartha Lakes Flow Monitoring Report
Appendix - A June 03, 2024
Data Chart Station: 6-1 Mar 01, 2022 – Mar 31, 2022
1206 Civica Infrastructure Inc. www.civi.ca
Civica Infrastructures Inc. Kawartha Lakes Flow Monitoring Report
Appendix - A June 03, 2024
Data Chart Station: 6-1 Apr 01, 2022 – Apr 30, 2022
1207 Civica Infrastructure Inc. www.civi.ca
Civica Infrastructures Inc. Kawartha Lakes Flow Monitoring Report
Appendix - A June 03, 2024
Data Chart Station: 6-1 May 01, 2022 – May 31, 2022
1208 Civica Infrastructure Inc. www.civi.ca
Civica Infrastructures Inc. Kawartha Lakes Flow Monitoring Report
Appendix - A June 03, 2024
Data Chart Station: 6-1 Jun 01, 2022 – Jun 30, 2022
1209 Civica Infrastructure Inc. www.civi.ca
Civica Infrastructures Inc. Kawartha Lakes Flow Monitoring Report
Appendix - A June 03, 2024
Data Chart Station: 6-1 Jul 01, 2022 – Jul 31, 2022
1210 Civica Infrastructure Inc. www.civi.ca
Civica Infrastructures Inc. Kawartha Lakes Flow Monitoring Report
Appendix - A June 03, 2024
Data Chart Station: 6-1 Aug 01, 2022 – Aug 02, 2022
1211 Civica Infrastructure Inc. www.civi.ca
Civica Infrastructures Inc. Kawartha Lakes Flow Monitoring Report
Appendix - A June 03, 2024
I/I Analysis Table
1 2
Event1
Total Precipitation (mm)
Duration (hours)
Peak Intensity Over Tc at Station (mm/hr)
Feb 16, 2022
18.00
12.67
Apr 13, 2022
17.25
28.67
6-1 Measured Peak Flow (L/s)
Peak I/I Flow (L/s)
Peak I/I Rate (L/s/ha)
Volumetric Runoff Coefficient (CV%)
Peaking Factor (PF)
3.80
13.74
11.14
0.89
12.87 %
5.36
10.50
9.02
4.37
0.35
2.91 %
1.34
Flow KPIs
Measured Storms
Station: 6-1
2
May 26, 2022
20.25
27.50
17.25
Jun 06, 2022
30.00
32.42
11.25
Jun 11, 2022
41.50
25.08
32.25
Jul 12, 2022
15.50
7.75
31.50
9.40
7.66
0.61
1.35 %
2.76
Jul 18, 2022
21.50
43.25
1.50
7.82
4.67
0.37
4.86 %
1.70
Average
23.43
25.33
15.44
10.00
6.96
0.56
5.50 %
2.79
Maximum
41.50
43.25
32.25
13.74
11.14
0.89
12.87 %
5.36
N/A
N/A 2 N/A 2
An event is a storm with a minimum volume of 15mm and a minimum inter-event dry period of 12 hours I/I event analysis unable to be completed due to missing flow monitoring data during event
1212 Civica Infrastructure Inc. www.civi.ca
Civica Infrastructures Inc. Kawartha Lakes Flow Monitoring Report
Appendix - A June 03, 2024
I/I Analysis Graph Station: 6-1
1213 Civica Infrastructure Inc. www.civi.ca
Civica Infrastructures Inc. Kawartha Lakes Flow Monitoring Report
Appendix - A June 03, 2024
Infiltration/Inflow Event Analysis Station: 6-1 Feb 16, 2022 11:00 – Feb 17, 2022 23:40, Total Precipitation: 18.00 mm (2,250,000.00 L) Station Details
Storm Details
Catchment Area
12.50 ha
Total Precipitation
18.00 mm (2,250,000.00 L)
Duration of Storm
12.67 hr
Time of Concentration (Tc) 1
20 min
Peak Precipitation Intensity Over Tc 2
3.80 mm/hr
Return Period over Tc 3
< 2 Yr
Measured Flow
I/I Flow
Time of Peak Measured Flow
Feb 17, 2022 08:50
Time of Peak I/I Flow (TD)
Feb 17, 2022 08:50
Estimated Dry Weather Flow at TD
2.59 L/s
Peak Measured Flow
13.74 L/s
Peak I/I Flow 4
11.14 L/s
Peak I/I Rate 5
0.89 L/s/ha
Peak Measured Depth
60.55 mm
Total I/I Flow Volume during event
289,580.60 L
Volumetric Coefficient (Cv%) 6
12.87%
Total Measured Flow Volume during Event
474,760.70 L
Peak I/I Coefficient 7
0.0856
Hourly Wet-Weather Peaking Factor 8
4.35
Instantaneous Wet-Weather Peaking Factor 9
6.61
1
Time of Concentration (Tc): The estimated time for the flow to travel from the furthest point in the upstream area to the point of monitoring, assume flow is travelling at 1.00 m/s Peak Precipitation Intensity Over Tc: The peak rainfall intensity for the duration of the storm with the time interval defined by time of concentration 3 Return Period over Tc: The estimated time to elapse before a storm of equal or greater intensity will likely occur again, based on design storm criteria 4 Peak I/I Flow: The greatest difference captured between measured flow and estimated dry weather flow, Peak I/I Flow = Maximum (Measured Flow – Estimated Dry Weather Flow) 5 Peak I/I Rate: A normalized peak I/I flow based on catchment area size, Peak I/I Rate = Peak I/I Flow / Catchment Area 6 Volumetric Coefficient (Cv%): The ratio of total I/I volume and total rainfall volume, Cv% = Total I/I Flow Volume / Total Precipitation Volume * 100% 7 Peak I/ I Coefficient: The ratio of peak I/I flow and peak rainfall intensity, Peak I/ I Coefficient = Peak I/I Flow / (Peak Rainfall Intensity over Tc * Catchment Area) 8 Hourly Wet‐Weather Peaking Factor: The ratio of peak hourly wet‐weather measured flow and average dry‐weather flow, Wet‐Weather Peaking Factor = Peak Hourly Wet‐Weather Measured Flow / Average Dry-Weather Flow 9 Instantaneous Wet‐Weather Peaking Factor: The ratio of peak wet‐weather measured flow and average dry‐weather flow, Wet‐Weather Peaking Factor = Peak Wet‐Weather Measured Flow / Average Dry-Weather Flow 2
1214 Civica Infrastructure Inc. www.civi.ca
Civica Infrastructures Inc. Kawartha Lakes Flow Monitoring Report
Appendix - A June 03, 2024
I/I Analysis Graph Station: 6-1
1215 Civica Infrastructure Inc. www.civi.ca
Civica Infrastructures Inc. Kawartha Lakes Flow Monitoring Report
Appendix - A June 03, 2024
Infiltration/Inflow Event Analysis Station: 6-1 Apr 12, 2022 17:25 – Apr 14, 2022 22:05, Total Precipitation: 17.25 mm (2,156,250.00 L) Station Details
Storm Details
Catchment Area
12.50 ha
Total Precipitation
17.25 mm (2,156,250.00 L)
Duration of Storm
28.67 hr
Time of Concentration (Tc) 1
20 min
Peak Precipitation Intensity Over Tc 2
10.50 mm/hr
Return Period over Tc 3
< 2 Yr
Measured Flow
I/I Flow
Time of Peak Measured Flow
Apr 13, 2022 21:05
Time of Peak I/I Flow (TD)
Apr 13, 2022 21:05
Estimated Dry Weather Flow at TD
4.65 L/s
Peak Measured Flow
9.02 L/s
Peak I/I Flow 4
4.37 L/s
Peak I/I Rate 5
0.35 L/s/ha
Peak Measured Depth
61.03 mm
Total I/I Flow Volume during event
62,633.50 L
Volumetric Coefficient (Cv%) 6
2.91%
Total Measured Flow Volume during Event
542,580.70 L
Peak I/I Coefficient 7
0.0120
Hourly Wet-Weather Peaking Factor 8
1.94
Instantaneous Wet-Weather Peaking Factor 9
2.76
1
Time of Concentration (Tc): The estimated time for the flow to travel from the furthest point in the upstream area to the point of monitoring, assume flow is travelling at 1.00 m/s Peak Precipitation Intensity Over Tc: The peak rainfall intensity for the duration of the storm with the time interval defined by time of concentration 3 Return Period over Tc: The estimated time to elapse before a storm of equal or greater intensity will likely occur again, based on design storm criteria 4 Peak I/I Flow: The greatest difference captured between measured flow and estimated dry weather flow, Peak I/I Flow = Maximum (Measured Flow – Estimated Dry Weather Flow) 5 Peak I/I Rate: A normalized peak I/I flow based on catchment area size, Peak I/I Rate = Peak I/I Flow / Catchment Area 6 Volumetric Coefficient (Cv%): The ratio of total I/I volume and total rainfall volume, Cv% = Total I/I Flow Volume / Total Precipitation Volume * 100% 7 Peak I/ I Coefficient: The ratio of peak I/I flow and peak rainfall intensity, Peak I/ I Coefficient = Peak I/I Flow / (Peak Rainfall Intensity over Tc * Catchment Area) 8 Hourly Wet‐Weather Peaking Factor: The ratio of peak hourly wet‐weather measured flow and average dry‐weather flow, Wet‐Weather Peaking Factor = Peak Hourly Wet‐Weather Measured Flow / Average Dry-Weather Flow 9 Instantaneous Wet‐Weather Peaking Factor: The ratio of peak wet‐weather measured flow and average dry‐weather flow, Wet‐Weather Peaking Factor = Peak Wet‐Weather Measured Flow / Average Dry-Weather Flow 2
1216 Civica Infrastructure Inc. www.civi.ca
Civica Infrastructures Inc. Kawartha Lakes Flow Monitoring Report
Appendix - A June 03, 2024
I/I Analysis Graph Station: 6-1
1217 Civica Infrastructure Inc. www.civi.ca
Civica Infrastructures Inc. Kawartha Lakes Flow Monitoring Report
Appendix - A June 03, 2024
Infiltration/Inflow Event Analysis Station: 6-1 Jul 11, 2022 14:25 – Jul 12, 2022 22:10, Total Precipitation: 15.50 mm (1,937,500.00 L) Station Details
Storm Details
Catchment Area
12.50 ha
Total Precipitation
15.50 mm (1,937,500.00 L)
Duration of Storm
7.75 hr
Time of Concentration (Tc) 1
20 min
Peak Precipitation Intensity Over Tc 2
31.50 mm/hr
Return Period over Tc 3
< 2 Yr
Measured Flow
I/I Flow
Time of Peak Measured Flow
Jul 12, 2022 03:40
Time of Peak I/I Flow (TD)
Jul 12, 2022 03:40
Estimated Dry Weather Flow at TD
1.74 L/s
Peak Measured Flow
9.40 L/s
Peak I/I Flow 4
7.66 L/s
Peak I/I Rate 5
0.61 L/s/ha
Peak Measured Depth
47.48 mm
Total I/I Flow Volume during event
26,135.80 L
Volumetric Coefficient (Cv%) 6
1.35%
Total Measured Flow Volume during Event
224,209.90 L
Peak I/I Coefficient 7
0.0070
Hourly Wet-Weather Peaking Factor 8
1.47
Instantaneous Wet-Weather Peaking Factor 9
3.39
1
Time of Concentration (Tc): The estimated time for the flow to travel from the furthest point in the upstream area to the point of monitoring, assume flow is travelling at 1.00 m/s Peak Precipitation Intensity Over Tc: The peak rainfall intensity for the duration of the storm with the time interval defined by time of concentration 3 Return Period over Tc: The estimated time to elapse before a storm of equal or greater intensity will likely occur again, based on design storm criteria 4 Peak I/I Flow: The greatest difference captured between measured flow and estimated dry weather flow, Peak I/I Flow = Maximum (Measured Flow – Estimated Dry Weather Flow) 5 Peak I/I Rate: A normalized peak I/I flow based on catchment area size, Peak I/I Rate = Peak I/I Flow / Catchment Area 6 Volumetric Coefficient (Cv%): The ratio of total I/I volume and total rainfall volume, Cv% = Total I/I Flow Volume / Total Precipitation Volume * 100% 7 Peak I/ I Coefficient: The ratio of peak I/I flow and peak rainfall intensity, Peak I/ I Coefficient = Peak I/I Flow / (Peak Rainfall Intensity over Tc * Catchment Area) 8 Hourly Wet‐Weather Peaking Factor: The ratio of peak hourly wet‐weather measured flow and average dry‐weather flow, Wet‐Weather Peaking Factor = Peak Hourly Wet‐Weather Measured Flow / Average Dry-Weather Flow 9 Instantaneous Wet‐Weather Peaking Factor: The ratio of peak wet‐weather measured flow and average dry‐weather flow, Wet‐Weather Peaking Factor = Peak Wet‐Weather Measured Flow / Average Dry-Weather Flow 2
1218 Civica Infrastructure Inc. www.civi.ca
Civica Infrastructures Inc. Kawartha Lakes Flow Monitoring Report
Appendix - A June 03, 2024
I/I Analysis Graph Station: 6-1
1219 Civica Infrastructure Inc. www.civi.ca
Civica Infrastructures Inc. Kawartha Lakes Flow Monitoring Report
Appendix - A June 03, 2024
Infiltration/Inflow Event Analysis Station: 6-1 Jul 17, 2022 16:10 – Jul 20, 2022 11:25, Total Precipitation: 21.50 mm (2,687,500.00 L) Station Details
Storm Details
Catchment Area
12.50 ha
Total Precipitation
21.50 mm (2,687,500.00 L)
Duration of Storm
43.25 hr
Time of Concentration (Tc) 1
20 min
Peak Precipitation Intensity Over Tc 2
1.50 mm/hr
Return Period over Tc 3
< 2 Yr
Measured Flow
I/I Flow
Time of Peak Measured Flow
Jul 19, 2022 09:30
Time of Peak I/I Flow (TD)
Jul 19, 2022 09:30
Estimated Dry Weather Flow at TD
3.15 L/s
Peak Measured Flow
7.82 L/s
Peak I/I Flow 4
4.67 L/s
Peak I/I Rate 5
0.37 L/s/ha
Peak Measured Depth
49.84 mm
Total I/I Flow Volume during event
130,495.60 L
Volumetric Coefficient (Cv%) 6
4.86%
Total Measured Flow Volume during Event
678,097.20 L
Peak I/I Coefficient 7
0.0896
Hourly Wet-Weather Peaking Factor 8
2.05
Instantaneous Wet-Weather Peaking Factor 9
2.84
1
Time of Concentration (Tc): The estimated time for the flow to travel from the furthest point in the upstream area to the point of monitoring, assume flow is travelling at 1.00 m/s Peak Precipitation Intensity Over Tc: The peak rainfall intensity for the duration of the storm with the time interval defined by time of concentration 3 Return Period over Tc: The estimated time to elapse before a storm of equal or greater intensity will likely occur again, based on design storm criteria 4 Peak I/I Flow: The greatest difference captured between measured flow and estimated dry weather flow, Peak I/I Flow = Maximum (Measured Flow – Estimated Dry Weather Flow) 5 Peak I/I Rate: A normalized peak I/I flow based on catchment area size, Peak I/I Rate = Peak I/I Flow / Catchment Area 6 Volumetric Coefficient (Cv%): The ratio of total I/I volume and total rainfall volume, Cv% = Total I/I Flow Volume / Total Precipitation Volume * 100% 7 Peak I/ I Coefficient: The ratio of peak I/I flow and peak rainfall intensity, Peak I/ I Coefficient = Peak I/I Flow / (Peak Rainfall Intensity over Tc * Catchment Area) 8 Hourly Wet‐Weather Peaking Factor: The ratio of peak hourly wet‐weather measured flow and average dry‐weather flow, Wet‐Weather Peaking Factor = Peak Hourly Wet‐Weather Measured Flow / Average Dry-Weather Flow 9 Instantaneous Wet‐Weather Peaking Factor: The ratio of peak wet‐weather measured flow and average dry‐weather flow, Wet‐Weather Peaking Factor = Peak Wet‐Weather Measured Flow / Average Dry-Weather Flow 2
1220 Civica Infrastructure Inc. www.civi.ca
Civica Infrastructures Inc. Kawartha Lakes Flow Monitoring Report
Appendix - A June 03, 2024
Activity Log Station: 6-1 Date Time
Type
Purpose of Visit
18-Nov-2021 02:00:00 PM
Installation Log
Install AV + Detec
08-Feb-2022 12:15:00 PM
Removal Log
DETEC REMOVAL
08-Feb-2022 01:15:00 PM
Installation Log
INSTALL ADS FM
FM INSTALLED S/N 65180
Yes
calibration
Note: top 3 measurements are of 300mm pipe, bottom 3 are 600mm pipe Data downloaded site calibrated telemetry sent
Yes
CALIBRATION
Data downloaded Debris cleared Telemetry sent BATTERY NOT REPLACED, NO TOOLS AVAILABLE FIRST 3 MEASUREMENTS ARE FOR 6-1 AND THE LAST 3 MEASUREMENTS ARE FOR 6-2
Yes
Site calibrated Telemetry sent DATA DOWNLOADED
Yes
17-Mar-2022 02:04:00 PM
24-Mar-2022 12:59:00 PM
Maintenance Log
Maintenance Log
Comment was given a flume instead of a ring - had to make a ring from scrap metal on site Can't install downward sensor here - raised inlet - cant install 3D bracket - encrustation around pipe and also pipe too small to put 3D bracket in FM REMOVED
Calibration Measurement Yes Yes
04-May-2022 10:54:00 AM
Maintenance Log
Calibration
16-May-2022 12:30:00 PM
Maintenance Log
Calibration
Yes
25-May-2022 08:20:00 AM
Maintenance Log
Calibration
Yes
17-Jun-2022 01:59:00 PM
Maintenance Log
CALIBRATION
DATA DOWNLOADED, SITE CALIBRATED, DEBRIS CLEARED, TELEMETRY SENT
20-Jul-2022 11:24:00 AM
Maintenance Log
CALIBRATION
DATA DOWNLOADED, SITE CALIBRATED,
Yes
SWAP
DATA DOWNLOADED, SITE CALIBRATED, DEBRIS CLEARED, TELEMETRY SENT, LOGGER STARTED
Yes
02-Aug-2022 11:09:00 AM
Removal Log
1221 Civica Infrastructure Inc. www.civi.ca
Yes
Civica Infrastructures Inc. Kawartha Lakes Flow Monitoring Report
Appendix - A June 03, 2024
Aggregate Data Station: 6-2
Level Date From
Date To
Days
Min (m)
Avg (m)
Max (m)
Count
Time of Min1
Time of Max1
Feb 07, 2022
Nov 04, 2022
234
0.05
0.09
0.22
66,597
Fri Aug 12, 2022 02:30
Mon Aug 29, 2022 16:20
Velocity Date From
Date To
Days
Min (m/s)
Avg (m/s)
Max (m/s)
Count
Time of Min1
Time of Max1
Feb 07, 2022
Nov 04, 2022
234
1.40
2.31
3.15
66,574
Fri Aug 12, 2022 02:30
Sun Mar 20, 2022 04:25
Flow Date From
Date To
Days
Min (L/s)
Avg (L/s)
Max (L/s)
Total Volume (1,000,000 L)
Count
Time of Min1
Time of Max1
Feb 07, 2022
Nov 04, 2022
140
0.00
73.88
208.55
873.32
39,401
Sun May 08, 2022 12:05
Sat Mar 19, 2022 12:55
Precipitation
1
Date From
Date To
Days
Min (mm)
Avg (mm)
Max (mm)
Sum (mm)
Count
Time of Min1
Time of Max1
Feb 07, 2022
Nov 04, 2022
261
0.00
0.01
9.75
601.45
74,382
Mon Feb 07, 2022 19:00
Mon Jul 25, 2022 00:00
Time of Min and Time of Max will be displayed by first occurrence
1222 Civica Infrastructure Inc. www.civi.ca
Civica Infrastructures Inc. Kawartha Lakes Flow Monitoring Report
Appendix - A June 03, 2024
Sanitary Report Station: 6-2
1
Average Dry Weather Flow (L/s)
Average Dry Weather Flow (L/c/d)
Average Daily Minimum Dry Weather Flow (L/s)
Average Daily Peak Dry Weather Flow (L/s)
67.359
757.093
51.978
83.487
Peaking Factor
Groundwater Infiltration (L/s)1
Groundwater Infiltration (L/ha/d)
% of GWI in Average DWF
1.239
44.181
9,067.064
65.591
Groundwater infiltration (GWI) is assumed as 85% of the daily minimum flow averaged over the monitoring period
1223 Civica Infrastructure Inc. www.civi.ca
Civica Infrastructures Inc. Kawartha Lakes Flow Monitoring Report
Appendix - A June 03, 2024
Data Chart Station: 6-2 Feb 07, 2022 – Feb 28, 2022
1224 Civica Infrastructure Inc. www.civi.ca
Civica Infrastructures Inc. Kawartha Lakes Flow Monitoring Report
Appendix - A June 03, 2024
Data Chart Station: 6-2 Mar 01, 2022 – Mar 31, 2022
1225 Civica Infrastructure Inc. www.civi.ca
Civica Infrastructures Inc. Kawartha Lakes Flow Monitoring Report
Appendix - A June 03, 2024
Data Chart Station: 6-2 Apr 01, 2022 – Apr 30, 2022
1226 Civica Infrastructure Inc. www.civi.ca
Civica Infrastructures Inc. Kawartha Lakes Flow Monitoring Report
Appendix - A June 03, 2024
Data Chart Station: 6-2 May 01, 2022 – May 31, 2022
1227 Civica Infrastructure Inc. www.civi.ca
Civica Infrastructures Inc. Kawartha Lakes Flow Monitoring Report
Appendix - A June 03, 2024
Data Chart Station: 6-2 Jun 01, 2022 – Jun 30, 2022
1228 Civica Infrastructure Inc. www.civi.ca
Civica Infrastructures Inc. Kawartha Lakes Flow Monitoring Report
Appendix - A June 03, 2024
Data Chart Station: 6-2 Jul 01, 2022 – Jul 31, 2022
1229 Civica Infrastructure Inc. www.civi.ca
Civica Infrastructures Inc. Kawartha Lakes Flow Monitoring Report
Appendix - A June 03, 2024
Data Chart Station: 6-2 Aug 01, 2022 – Aug 31, 2022
1230 Civica Infrastructure Inc. www.civi.ca
Civica Infrastructures Inc. Kawartha Lakes Flow Monitoring Report
Appendix - A June 03, 2024
Data Chart Station: 6-2 Sep 01, 2022 – Sep 30, 2022
1231 Civica Infrastructure Inc. www.civi.ca
Civica Infrastructures Inc. Kawartha Lakes Flow Monitoring Report
Appendix - A June 03, 2024
Data Chart Station: 6-2 Oct 01, 2022 – Oct 31, 2022
1232 Civica Infrastructure Inc. www.civi.ca
Civica Infrastructures Inc. Kawartha Lakes Flow Monitoring Report
Appendix - A June 03, 2024
Data Chart Station: 6-2 Nov 01, 2022 – Nov 04, 2022
1233 Civica Infrastructure Inc. www.civi.ca
Civica Infrastructures Inc. Kawartha Lakes Flow Monitoring Report
Appendix - A June 03, 2024
I/I Analysis Table
1 2
Event1
Total Precipitation (mm)
Duration (hours)
Peak Intensity Over Tc at Station (mm/hr)
Feb 16, 2022
18.00
12.67
Apr 13, 2022
17.25
28.67
6-2 Measured Peak Flow (L/s)
Peak I/I Flow (L/s)
Peak I/I Rate (L/s/ha)
Volumetric Runoff Coefficient (CV%)
Peaking Factor (PF)
2.70
176.39
117.85
0.28
6.67 %
1.78
4.20
111.34
25.98
0.06
1.90 %
0.31
2
May 26, 2022
20.25
27.50
5.85
N/A
Jun 06, 2022
30.00
32.42
4.95
N/A 2
Jun 11, 2022
41.50
25.08
12.45
N/A 2
Jul 12, 2022
15.50
7.75
8.10
Jul 18, 2022
21.50
43.25
1.00
Aug 17, 2022
17.50
1.83
10.35
Aug 21, 2022
17.50
30.50
4.50
N/A 2
Aug 25, 2022
16.25
8.58
8.85
N/A 2
Aug 29, 2022
29.00
2.50
16.80
N/A 2
Sep 12, 2022
21.75
25.08
5.70
N/A 2
Sep 18, 2022
24.50
5.58
10.05
N/A 2
Oct 12, 2022
20.75
15.25
3.75
N/A 2
Average
22.23
19.05
7.09
132.12
72.51
Maximum
41.50
43.25
16.80
176.39
117.85
Flow KPIs
Measured Storms
Station: 6-2
102.37
66.32
0.16
0.53 %
1.24
138.36
79.89
0.19
2.52 %
1.53
0.17
2.91 %
1.22
0.28
6.67 %
1.78
N/A 2
An event is a storm with a minimum volume of 15mm and a minimum inter-event dry period of 12 hours I/I event analysis unable to be completed due to missing flow monitoring data during event
1234 Civica Infrastructure Inc. www.civi.ca
Civica Infrastructures Inc. Kawartha Lakes Flow Monitoring Report
Appendix - A June 03, 2024
I/I Analysis Graph Station: 6-2
1235 Civica Infrastructure Inc. www.civi.ca
Civica Infrastructures Inc. Kawartha Lakes Flow Monitoring Report
Appendix - A June 03, 2024
Infiltration/Inflow Event Analysis Station: 6-2 Feb 16, 2022 11:00 – Feb 17, 2022 23:40, Total Precipitation: 18.00 mm (75,780,000.00 L) Station Details
Storm Details
Catchment Area
421.00 ha
Total Precipitation
18.00 mm (75,780,000.00 L)
Duration of Storm
12.67 hr
Time of Concentration (Tc) 1
100 min
Peak Precipitation Intensity Over Tc 2
2.70 mm/hr
Return Period over Tc 3
< 2 Yr
Measured Flow
I/I Flow
Time of Peak Measured Flow
Feb 17, 2022 07:10
Time of Peak I/I Flow (TD)
Feb 17, 2022 06:40
Estimated Dry Weather Flow at TD
56.50 L/s
Peak Measured Flow
176.39 L/s
Peak I/I Flow 4
117.85 L/s
Peak I/I Rate 5
0.28 L/s/ha
Peak Measured Depth
158.27 mm
Total I/I Flow Volume during event
5,056,121.50 L
Volumetric Coefficient (Cv%) 6
6.67%
Total Measured Flow Volume during Event
10,948,328.70 L
Peak I/I Coefficient 7
0.0373
Hourly Wet-Weather Peaking Factor 8
2.62
Instantaneous Wet-Weather Peaking Factor 9
2.67
1
Time of Concentration (Tc): The estimated time for the flow to travel from the furthest point in the upstream area to the point of monitoring, assume flow is travelling at 1.00 m/s Peak Precipitation Intensity Over Tc: The peak rainfall intensity for the duration of the storm with the time interval defined by time of concentration 3 Return Period over Tc: The estimated time to elapse before a storm of equal or greater intensity will likely occur again, based on design storm criteria 4 Peak I/I Flow: The greatest difference captured between measured flow and estimated dry weather flow, Peak I/I Flow = Maximum (Measured Flow – Estimated Dry Weather Flow) 5 Peak I/I Rate: A normalized peak I/I flow based on catchment area size, Peak I/I Rate = Peak I/I Flow / Catchment Area 6 Volumetric Coefficient (Cv%): The ratio of total I/I volume and total rainfall volume, Cv% = Total I/I Flow Volume / Total Precipitation Volume * 100% 7 Peak I/ I Coefficient: The ratio of peak I/I flow and peak rainfall intensity, Peak I/ I Coefficient = Peak I/I Flow / (Peak Rainfall Intensity over Tc * Catchment Area) 8 Hourly Wet‐Weather Peaking Factor: The ratio of peak hourly wet‐weather measured flow and average dry‐weather flow, Wet‐Weather Peaking Factor = Peak Hourly Wet‐Weather Measured Flow / Average Dry-Weather Flow 9 Instantaneous Wet‐Weather Peaking Factor: The ratio of peak wet‐weather measured flow and average dry‐weather flow, Wet‐Weather Peaking Factor = Peak Wet‐Weather Measured Flow / Average Dry-Weather Flow 2
1236 Civica Infrastructure Inc. www.civi.ca
Civica Infrastructures Inc. Kawartha Lakes Flow Monitoring Report
Appendix - A June 03, 2024
I/I Analysis Graph Station: 6-2
1237 Civica Infrastructure Inc. www.civi.ca
Civica Infrastructures Inc. Kawartha Lakes Flow Monitoring Report
Appendix - A June 03, 2024
Infiltration/Inflow Event Analysis Station: 6-2 Apr 12, 2022 17:25 – Apr 14, 2022 22:05, Total Precipitation: 17.25 mm (72,622,500.00 L) Station Details
Storm Details
Catchment Area
421.00 ha
Total Precipitation
17.25 mm (72,622,500.00 L)
Duration of Storm
28.67 hr
Time of Concentration (Tc) 1
100 min
Peak Precipitation Intensity Over Tc 2
4.20 mm/hr
Return Period over Tc 3
< 2 Yr
Measured Flow
I/I Flow
Time of Peak Measured Flow
Apr 13, 2022 10:15
Time of Peak I/I Flow (TD)
Apr 14, 2022 02:20
Estimated Dry Weather Flow at TD
68.08 L/s
Peak Measured Flow
111.34 L/s
Peak I/I Flow 4
25.98 L/s
Peak I/I Rate 5
0.06 L/s/ha
Peak Measured Depth
119.00 mm
Total I/I Flow Volume during event
1,382,974.40 L
Volumetric Coefficient (Cv%) 6
1.90%
Total Measured Flow Volume during Event
13,600,504.70 L
Peak I/I Coefficient 7
0.0053
Hourly Wet-Weather Peaking Factor 8
1.32
Instantaneous Wet-Weather Peaking Factor 9
1.34
1
Time of Concentration (Tc): The estimated time for the flow to travel from the furthest point in the upstream area to the point of monitoring, assume flow is travelling at 1.00 m/s Peak Precipitation Intensity Over Tc: The peak rainfall intensity for the duration of the storm with the time interval defined by time of concentration 3 Return Period over Tc: The estimated time to elapse before a storm of equal or greater intensity will likely occur again, based on design storm criteria 4 Peak I/I Flow: The greatest difference captured between measured flow and estimated dry weather flow, Peak I/I Flow = Maximum (Measured Flow – Estimated Dry Weather Flow) 5 Peak I/I Rate: A normalized peak I/I flow based on catchment area size, Peak I/I Rate = Peak I/I Flow / Catchment Area 6 Volumetric Coefficient (Cv%): The ratio of total I/I volume and total rainfall volume, Cv% = Total I/I Flow Volume / Total Precipitation Volume * 100% 7 Peak I/ I Coefficient: The ratio of peak I/I flow and peak rainfall intensity, Peak I/ I Coefficient = Peak I/I Flow / (Peak Rainfall Intensity over Tc * Catchment Area) 8 Hourly Wet‐Weather Peaking Factor: The ratio of peak hourly wet‐weather measured flow and average dry‐weather flow, Wet‐Weather Peaking Factor = Peak Hourly Wet‐Weather Measured Flow / Average Dry-Weather Flow 9 Instantaneous Wet‐Weather Peaking Factor: The ratio of peak wet‐weather measured flow and average dry‐weather flow, Wet‐Weather Peaking Factor = Peak Wet‐Weather Measured Flow / Average Dry-Weather Flow 2
1238 Civica Infrastructure Inc. www.civi.ca
Civica Infrastructures Inc. Kawartha Lakes Flow Monitoring Report
Appendix - A June 03, 2024
I/I Analysis Graph Station: 6-2
1239 Civica Infrastructure Inc. www.civi.ca
Civica Infrastructures Inc. Kawartha Lakes Flow Monitoring Report
Appendix - A June 03, 2024
Infiltration/Inflow Event Analysis Station: 6-2 Jul 11, 2022 14:25 – Jul 12, 2022 22:10, Total Precipitation: 15.50 mm (65,255,000.00 L) Station Details
Storm Details
Catchment Area
421.00 ha
Total Precipitation
15.50 mm (65,255,000.00 L)
Duration of Storm
7.75 hr
Time of Concentration (Tc) 1
100 min
Peak Precipitation Intensity Over Tc 2
8.10 mm/hr
Return Period over Tc 3
< 2 Yr
Measured Flow
I/I Flow
Time of Peak Measured Flow
Jul 12, 2022 03:10
Time of Peak I/I Flow (TD)
Jul 12, 2022 03:10
Estimated Dry Weather Flow at TD
36.05 L/s
Peak Measured Flow
102.37 L/s
Peak I/I Flow 4
66.32 L/s
Peak I/I Rate 5
0.16 L/s/ha
Peak Measured Depth
116.32 mm
Total I/I Flow Volume during event
342,533.30 L
Volumetric Coefficient (Cv%) 6
0.53%
Total Measured Flow Volume during Event
4,162,951.60 L
Peak I/I Coefficient 7
0.0070
Hourly Wet-Weather Peaking Factor 8
1.46
Instantaneous Wet-Weather Peaking Factor 9
1.91
1
Time of Concentration (Tc): The estimated time for the flow to travel from the furthest point in the upstream area to the point of monitoring, assume flow is travelling at 1.00 m/s Peak Precipitation Intensity Over Tc: The peak rainfall intensity for the duration of the storm with the time interval defined by time of concentration 3 Return Period over Tc: The estimated time to elapse before a storm of equal or greater intensity will likely occur again, based on design storm criteria 4 Peak I/I Flow: The greatest difference captured between measured flow and estimated dry weather flow, Peak I/I Flow = Maximum (Measured Flow – Estimated Dry Weather Flow) 5 Peak I/I Rate: A normalized peak I/I flow based on catchment area size, Peak I/I Rate = Peak I/I Flow / Catchment Area 6 Volumetric Coefficient (Cv%): The ratio of total I/I volume and total rainfall volume, Cv% = Total I/I Flow Volume / Total Precipitation Volume * 100% 7 Peak I/ I Coefficient: The ratio of peak I/I flow and peak rainfall intensity, Peak I/ I Coefficient = Peak I/I Flow / (Peak Rainfall Intensity over Tc * Catchment Area) 8 Hourly Wet‐Weather Peaking Factor: The ratio of peak hourly wet‐weather measured flow and average dry‐weather flow, Wet‐Weather Peaking Factor = Peak Hourly Wet‐Weather Measured Flow / Average Dry-Weather Flow 9 Instantaneous Wet‐Weather Peaking Factor: The ratio of peak wet‐weather measured flow and average dry‐weather flow, Wet‐Weather Peaking Factor = Peak Wet‐Weather Measured Flow / Average Dry-Weather Flow 2
1240 Civica Infrastructure Inc. www.civi.ca
Civica Infrastructures Inc. Kawartha Lakes Flow Monitoring Report
Appendix - A June 03, 2024
I/I Analysis Graph Station: 6-2
1241 Civica Infrastructure Inc. www.civi.ca
Civica Infrastructures Inc. Kawartha Lakes Flow Monitoring Report
Appendix - A June 03, 2024
Infiltration/Inflow Event Analysis Station: 6-2 Jul 17, 2022 16:10 – Jul 20, 2022 11:25, Total Precipitation: 21.50 mm (90,515,000.00 L) Station Details
Storm Details
Catchment Area
421.00 ha
Total Precipitation
21.50 mm (90,515,000.00 L)
Duration of Storm
43.25 hr
Time of Concentration (Tc) 1
100 min
Peak Precipitation Intensity Over Tc 2
1.00 mm/hr
Return Period over Tc 3
< 2 Yr
Measured Flow
I/I Flow
Time of Peak Measured Flow
Jul 18, 2022 12:20
Time of Peak I/I Flow (TD)
Jul 18, 2022 12:20
Estimated Dry Weather Flow at TD
58.47 L/s
Peak Measured Flow
138.36 L/s
Peak I/I Flow 4
79.89 L/s
Peak I/I Rate 5
0.19 L/s/ha
Peak Measured Depth
135.81 mm
Total I/I Flow Volume during event
2,283,207.80 L
Volumetric Coefficient (Cv%) 6
2.52%
Total Measured Flow Volume during Event
12,711,379.70 L
Peak I/I Coefficient 7
0.0651
Hourly Wet-Weather Peaking Factor 8
2.47
Instantaneous Wet-Weather Peaking Factor 9
2.64
1
Time of Concentration (Tc): The estimated time for the flow to travel from the furthest point in the upstream area to the point of monitoring, assume flow is travelling at 1.00 m/s Peak Precipitation Intensity Over Tc: The peak rainfall intensity for the duration of the storm with the time interval defined by time of concentration 3 Return Period over Tc: The estimated time to elapse before a storm of equal or greater intensity will likely occur again, based on design storm criteria 4 Peak I/I Flow: The greatest difference captured between measured flow and estimated dry weather flow, Peak I/I Flow = Maximum (Measured Flow – Estimated Dry Weather Flow) 5 Peak I/I Rate: A normalized peak I/I flow based on catchment area size, Peak I/I Rate = Peak I/I Flow / Catchment Area 6 Volumetric Coefficient (Cv%): The ratio of total I/I volume and total rainfall volume, Cv% = Total I/I Flow Volume / Total Precipitation Volume * 100% 7 Peak I/ I Coefficient: The ratio of peak I/I flow and peak rainfall intensity, Peak I/ I Coefficient = Peak I/I Flow / (Peak Rainfall Intensity over Tc * Catchment Area) 8 Hourly Wet‐Weather Peaking Factor: The ratio of peak hourly wet‐weather measured flow and average dry‐weather flow, Wet‐Weather Peaking Factor = Peak Hourly Wet‐Weather Measured Flow / Average Dry-Weather Flow 9 Instantaneous Wet‐Weather Peaking Factor: The ratio of peak wet‐weather measured flow and average dry‐weather flow, Wet‐Weather Peaking Factor = Peak Wet‐Weather Measured Flow / Average Dry-Weather Flow 2
1242 Civica Infrastructure Inc. www.civi.ca
Civica Infrastructures Inc. Kawartha Lakes Flow Monitoring Report
Appendix - A June 03, 2024
Activity Log Station: 6-2 Date Time
Type
Purpose of Visit
04-May-2022 10:54:00 AM
Maintenance Log
Calibration
24-Aug-2022 08:34:00 AM
Maintenance Log
CALIBRATION
DATA DOWNLOADED, SITE CALIBRATED TELEMETRY SENT
Yes
CALIBRATION
DATA DOWNLOADED, SITE CALIBRATED, TELEMETRY SENT PHOTO AND VIDEO TAKEN OFF ROAD
Yes
CALIBRATION
DATA DOWNLOADED, SITE CALIBRATED, DEBRIS CLEARED TELEMETRY SENT AND CHECKED, PHOTO AND VIDEO TAKEN
Yes
CALIBRATION
DATA DOWNLOADED TELEMETRY SENT PHOTOS TAKEN SITE CALIBRATED
Yes
22-Sep-2022 10:04:00 AM
03-Oct-2022 01:26:00 PM
04-Nov-2022 09:52:00 AM
Maintenance Log
Maintenance Log
Maintenance Log
Comment
Calibration Measurement Yes
1243 Civica Infrastructure Inc. www.civi.ca
Civica Infrastructures Inc. Kawartha Lakes Flow Monitoring Report
Appendix - A June 03, 2024
Aggregate Data Station: 6-3
Level Date From
Date To
Days
Min (m)
Avg (m)
Max (m)
Count
Time of Min1
Time of Max1
Nov 25, 2021
Nov 04, 2023
380
0.09
0.14
0.28
108,939
Tue Feb 01, 2022 05:05
Wed Jan 04, 2023 22:05
Velocity Date From
Date To
Days
Min (m/s)
Avg (m/s)
Max (m/s)
Count
Time of Min1
Time of Max1
Nov 25, 2021
Nov 04, 2023
380
0.52
0.79
1.64
108,941
Tue Feb 08, 2022 02:35
Wed Jan 04, 2023 21:25
Flow Date From
Date To
Days
Min (L/s)
Avg (L/s)
Max (L/s)
Total Volume (1,000,000 L)
Count
Time of Min1
Time of Max1
Nov 25, 2021
Nov 04, 2023
380
11.94
36.23
183.29
1,184.18
108,939
Tue Feb 01, 2022 05:05
Wed Jan 04, 2023 21:25
Precipitation
1
Date From
Date To
Days
Min (mm)
Avg (mm)
Max (mm)
Sum (mm)
Count
Time of Min1
Time of Max1
Nov 25, 2021
Nov 04, 2023
445
0.00
0.01
9.75
857.45
127,182
Thu Nov 25, 2021 00:00
Mon Jul 25, 2022 00:00
Time of Min and Time of Max will be displayed by first occurrence
1244 Civica Infrastructure Inc. www.civi.ca
Civica Infrastructures Inc. Kawartha Lakes Flow Monitoring Report
Appendix - A June 03, 2024
Sanitary Report Station: 6-3
1
Average Dry Weather Flow (L/s)
Average Dry Weather Flow (L/c/d)
Average Daily Minimum Dry Weather Flow (L/s)
Average Daily Peak Dry Weather Flow (L/s)
32.083
406.454
21.506
44.412
Peaking Factor
Groundwater Infiltration (L/s)1
Groundwater Infiltration (L/ha/d)
% of GWI in Average DWF
1.384
18.280
4,147.571
56.976
Groundwater infiltration (GWI) is assumed as 85% of the daily minimum flow averaged over the monitoring period
1245 Civica Infrastructure Inc. www.civi.ca
Civica Infrastructures Inc. Kawartha Lakes Flow Monitoring Report
Appendix - A June 03, 2024
Data Chart Station: 6-3 Nov 25, 2021 – Nov 30, 2021
1246 Civica Infrastructure Inc. www.civi.ca
Civica Infrastructures Inc. Kawartha Lakes Flow Monitoring Report
Appendix - A June 03, 2024
Data Chart Station: 6-3 Dec 01, 2021 – Dec 31, 2021
1247 Civica Infrastructure Inc. www.civi.ca
Civica Infrastructures Inc. Kawartha Lakes Flow Monitoring Report
Appendix - A June 03, 2024
Data Chart Station: 6-3 Jan 01, 2022 – Jan 31, 2022
1248 Civica Infrastructure Inc. www.civi.ca
Civica Infrastructures Inc. Kawartha Lakes Flow Monitoring Report
Appendix - A June 03, 2024
Data Chart Station: 6-3 Feb 01, 2022 – Feb 28, 2022
1249 Civica Infrastructure Inc. www.civi.ca
Civica Infrastructures Inc. Kawartha Lakes Flow Monitoring Report
Appendix - A June 03, 2024
Data Chart Station: 6-3 Mar 01, 2022 – Mar 31, 2022
1250 Civica Infrastructure Inc. www.civi.ca
Civica Infrastructures Inc. Kawartha Lakes Flow Monitoring Report
Appendix - A June 03, 2024
Data Chart Station: 6-3 Apr 01, 2022 – Apr 30, 2022
1251 Civica Infrastructure Inc. www.civi.ca
Civica Infrastructures Inc. Kawartha Lakes Flow Monitoring Report
Appendix - A June 03, 2024
Data Chart Station: 6-3 May 01, 2022 – May 31, 2022
1252 Civica Infrastructure Inc. www.civi.ca
Civica Infrastructures Inc. Kawartha Lakes Flow Monitoring Report
Appendix - A June 03, 2024
Data Chart Station: 6-3 Jun 01, 2022 – Jun 30, 2022
1253 Civica Infrastructure Inc. www.civi.ca
Civica Infrastructures Inc. Kawartha Lakes Flow Monitoring Report
Appendix - A June 03, 2024
Data Chart Station: 6-3 Jul 01, 2022 – Jul 31, 2022
1254 Civica Infrastructure Inc. www.civi.ca
Civica Infrastructures Inc. Kawartha Lakes Flow Monitoring Report
Appendix - A June 03, 2024
Data Chart Station: 6-3 Aug 01, 2022 – Aug 31, 2022
1255 Civica Infrastructure Inc. www.civi.ca
Civica Infrastructures Inc. Kawartha Lakes Flow Monitoring Report
Appendix - A June 03, 2024
Data Chart Station: 6-3 Sep 01, 2022 – Sep 30, 2022
1256 Civica Infrastructure Inc. www.civi.ca
Civica Infrastructures Inc. Kawartha Lakes Flow Monitoring Report
Appendix - A June 03, 2024
Data Chart Station: 6-3 Oct 01, 2022 – Oct 31, 2022
1257 Civica Infrastructure Inc. www.civi.ca
Civica Infrastructures Inc. Kawartha Lakes Flow Monitoring Report
Appendix - A June 03, 2024
Data Chart Station: 6-3 Nov 01, 2022 – Nov 30, 2022
1258 Civica Infrastructure Inc. www.civi.ca
Civica Infrastructures Inc. Kawartha Lakes Flow Monitoring Report
Appendix - A June 03, 2024
Data Chart Station: 6-3 Dec 01, 2022 – Dec 31, 2022
1259 Civica Infrastructure Inc. www.civi.ca
Civica Infrastructures Inc. Kawartha Lakes Flow Monitoring Report
Appendix - A June 03, 2024
Data Chart Station: 6-3 Jan 01, 2023 – Jan 31, 2023
1260 Civica Infrastructure Inc. www.civi.ca
Civica Infrastructures Inc. Kawartha Lakes Flow Monitoring Report
Appendix - A June 03, 2024
Data Chart Station: 6-3 Feb 01, 2023 – Feb 28, 2023
1261 Civica Infrastructure Inc. www.civi.ca
Civica Infrastructures Inc. Kawartha Lakes Flow Monitoring Report
Appendix - A June 03, 2024
Data Chart Station: 6-3 Mar 01, 2023 – Mar 31, 2023
1262 Civica Infrastructure Inc. www.civi.ca
Civica Infrastructures Inc. Kawartha Lakes Flow Monitoring Report
Appendix - A June 03, 2024
Data Chart Station: 6-3 Apr 01, 2023 – Apr 30, 2023
1263 Civica Infrastructure Inc. www.civi.ca
Civica Infrastructures Inc. Kawartha Lakes Flow Monitoring Report
Appendix - A June 03, 2024
Data Chart Station: 6-3 May 01, 2023 – May 31, 2023
1264 Civica Infrastructure Inc. www.civi.ca
Civica Infrastructures Inc. Kawartha Lakes Flow Monitoring Report
Appendix - A June 03, 2024
Data Chart Station: 6-3 Jun 01, 2023 – Jun 30, 2023
1265 Civica Infrastructure Inc. www.civi.ca
Civica Infrastructures Inc. Kawartha Lakes Flow Monitoring Report
Appendix - A June 03, 2024
Data Chart Station: 6-3 Jul 01, 2023 – Jul 31, 2023
1266 Civica Infrastructure Inc. www.civi.ca
Civica Infrastructures Inc. Kawartha Lakes Flow Monitoring Report
Appendix - A June 03, 2024
Data Chart Station: 6-3 Aug 01, 2023 – Aug 31, 2023
1267 Civica Infrastructure Inc. www.civi.ca
Civica Infrastructures Inc. Kawartha Lakes Flow Monitoring Report
Appendix - A June 03, 2024
Data Chart Station: 6-3 Sep 01, 2023 – Sep 30, 2023
1268 Civica Infrastructure Inc. www.civi.ca
Civica Infrastructures Inc. Kawartha Lakes Flow Monitoring Report
Appendix - A June 03, 2024
Data Chart Station: 6-3 Oct 01, 2023 – Oct 31, 2023
1269 Civica Infrastructure Inc. www.civi.ca
Civica Infrastructures Inc. Kawartha Lakes Flow Monitoring Report
Appendix - A June 03, 2024
Data Chart Station: 6-3 Nov 01, 2023 – Nov 04, 2023
1270 Civica Infrastructure Inc. www.civi.ca
Civica Infrastructures Inc. Kawartha Lakes Flow Monitoring Report
Appendix - A June 03, 2024
I/I Analysis Table
1 2
Event1
Total Precipitation (mm)
Duration (hours)
Peak Intensity Over Tc at Station (mm/hr)
Feb 16, 2022
18.00
12.67
Apr 13, 2022
17.25
May 26, 2022
6-3 Measured Peak Flow (L/s)
Peak I/I Flow (L/s)
Peak I/I Rate (L/s/ha)
Volumetric Runoff Coefficient (CV%)
Peaking Factor (PF)
2.80
93.64
70.06
0.18
4.24 %
2.63
28.67
4.90
67.74
20.24
0.05
0.67 %
0.47
20.25
27.50
6.80
60.55
23.54
0.06
0.67 %
0.74
Jun 06, 2022
30.00
32.42
5.40
60.49
21.23
0.06
0.89 %
0.61
Jun 11, 2022
41.50
25.08
15.40
146.81
104.34
0.27
2.56 %
3.25
Jul 12, 2022
15.50
7.75
9.80
39.36
14.61
0.04
0.24 %
0.50
Jul 18, 2022
21.50
43.25
1.10
73.17
42.14
0.11
1.71 %
1.50
Aug 17, 2022
17.50
1.83
12.60
69.89
41.52
0.11
0.32 %
1.70
Aug 21, 2022
17.50
30.50
5.40
50.53
27.01
0.07
1.46 %
0.95
Aug 25, 2022
16.25
8.58
10.90
69.75
38.27
0.10
0.86 %
1.35
Aug 29, 2022
29.00
2.50
16.10
142.26
109.90
0.29
1.17 %
3.91
Sep 12, 2022
21.75
25.08
6.20
65.35
24.64
0.07
0.58 %
0.75
Sep 18, 2022
24.50
5.58
11.80
77.82
35.32
0.09
0.99 %
1.09
Oct 12, 2022
20.75
15.25
4.30
65.89
25.33
0.07
0.83 %
0.79
Nov 30, 2022
21.00
10.83
3.40
105.02
62.99
0.17
2.81 %
1.69
Jan 03, 2023
27.25
43.42
6.80
183.29
131.82
0.35
10.17 %
2.94
Feb 09, 2023
35.75
21.58
5.63
Average
23.25
20.15
7.61
85.72
49.56
0.13
1.89 %
1.55
Maximum
41.50
43.42
16.10
183.29
131.82
0.35
10.17 %
3.91
Flow KPIs
Measured Storms
Station: 6-3
N/A 2
An event is a storm with a minimum volume of 15mm and a minimum inter-event dry period of 12 hours I/I event analysis unable to be completed due to missing flow monitoring data during event
1271 Civica Infrastructure Inc. www.civi.ca
Civica Infrastructures Inc. Kawartha Lakes Flow Monitoring Report
Appendix - A June 03, 2024
I/I Analysis Graph Station: 6-3
1272 Civica Infrastructure Inc. www.civi.ca
Civica Infrastructures Inc. Kawartha Lakes Flow Monitoring Report
Appendix - A June 03, 2024
Infiltration/Inflow Event Analysis Station: 6-3 Feb 16, 2022 11:00 – Feb 17, 2022 23:40, Total Precipitation: 18.00 mm (68,544,000.00 L) Station Details
Storm Details
Catchment Area
380.80 ha
Total Precipitation
18.00 mm (68,544,000.00 L)
Duration of Storm
12.67 hr
Time of Concentration (Tc) 1
80 min
Peak Precipitation Intensity Over Tc 2
2.80 mm/hr
Return Period over Tc 3
< 2 Yr
Measured Flow
I/I Flow
Time of Peak Measured Flow
Feb 17, 2022 07:35
Time of Peak I/I Flow (TD)
Feb 17, 2022 07:15
Estimated Dry Weather Flow at TD
22.96 L/s
Peak Measured Flow
93.64 L/s
Peak I/I Flow 4
70.06 L/s
Peak I/I Rate 5
0.18 L/s/ha
Peak Measured Depth
197.00 mm
Total I/I Flow Volume during event
2,907,711.40 L
Volumetric Coefficient (Cv%) 6
4.24%
Total Measured Flow Volume during Event
5,281,442.10 L
Peak I/I Coefficient 7
0.0236
Hourly Wet-Weather Peaking Factor 8
3.37
Instantaneous Wet-Weather Peaking Factor 9
3.51
1
Time of Concentration (Tc): The estimated time for the flow to travel from the furthest point in the upstream area to the point of monitoring, assume flow is travelling at 1.00 m/s Peak Precipitation Intensity Over Tc: The peak rainfall intensity for the duration of the storm with the time interval defined by time of concentration 3 Return Period over Tc: The estimated time to elapse before a storm of equal or greater intensity will likely occur again, based on design storm criteria 4 Peak I/I Flow: The greatest difference captured between measured flow and estimated dry weather flow, Peak I/I Flow = Maximum (Measured Flow – Estimated Dry Weather Flow) 5 Peak I/I Rate: A normalized peak I/I flow based on catchment area size, Peak I/I Rate = Peak I/I Flow / Catchment Area 6 Volumetric Coefficient (Cv%): The ratio of total I/I volume and total rainfall volume, Cv% = Total I/I Flow Volume / Total Precipitation Volume * 100% 7 Peak I/ I Coefficient: The ratio of peak I/I flow and peak rainfall intensity, Peak I/ I Coefficient = Peak I/I Flow / (Peak Rainfall Intensity over Tc * Catchment Area) 8 Hourly Wet‐Weather Peaking Factor: The ratio of peak hourly wet‐weather measured flow and average dry‐weather flow, Wet‐Weather Peaking Factor = Peak Hourly Wet‐Weather Measured Flow / Average Dry-Weather Flow 9 Instantaneous Wet‐Weather Peaking Factor: The ratio of peak wet‐weather measured flow and average dry‐weather flow, Wet‐Weather Peaking Factor = Peak Wet‐Weather Measured Flow / Average Dry-Weather Flow 2
1273 Civica Infrastructure Inc. www.civi.ca
Civica Infrastructures Inc. Kawartha Lakes Flow Monitoring Report
Appendix - A June 03, 2024
I/I Analysis Graph Station: 6-3
1274 Civica Infrastructure Inc. www.civi.ca
Civica Infrastructures Inc. Kawartha Lakes Flow Monitoring Report
Appendix - A June 03, 2024
Infiltration/Inflow Event Analysis Station: 6-3 Apr 12, 2022 17:25 – Apr 14, 2022 22:05, Total Precipitation: 17.25 mm (65,688,000.00 L) Station Details
Storm Details
Catchment Area
380.80 ha
Total Precipitation
17.25 mm (65,688,000.00 L)
Duration of Storm
28.67 hr
Time of Concentration (Tc) 1
80 min
Peak Precipitation Intensity Over Tc 2
4.90 mm/hr
Return Period over Tc 3
< 2 Yr
Measured Flow
I/I Flow
Time of Peak Measured Flow
Apr 13, 2022 10:50
Time of Peak I/I Flow (TD)
Apr 13, 2022 10:50
Estimated Dry Weather Flow at TD
47.50 L/s
Peak Measured Flow
67.74 L/s
Peak I/I Flow 4
20.24 L/s
Peak I/I Rate 5
0.05 L/s/ha
Peak Measured Depth
193.00 mm
Total I/I Flow Volume during event
438,106.20 L
Volumetric Coefficient (Cv%) 6
0.67%
Total Measured Flow Volume during Event
6,813,428.60 L
Peak I/I Coefficient 7
0.0039
Hourly Wet-Weather Peaking Factor 8
1.49
Instantaneous Wet-Weather Peaking Factor 9
1.56
1
Time of Concentration (Tc): The estimated time for the flow to travel from the furthest point in the upstream area to the point of monitoring, assume flow is travelling at 1.00 m/s Peak Precipitation Intensity Over Tc: The peak rainfall intensity for the duration of the storm with the time interval defined by time of concentration 3 Return Period over Tc: The estimated time to elapse before a storm of equal or greater intensity will likely occur again, based on design storm criteria 4 Peak I/I Flow: The greatest difference captured between measured flow and estimated dry weather flow, Peak I/I Flow = Maximum (Measured Flow – Estimated Dry Weather Flow) 5 Peak I/I Rate: A normalized peak I/I flow based on catchment area size, Peak I/I Rate = Peak I/I Flow / Catchment Area 6 Volumetric Coefficient (Cv%): The ratio of total I/I volume and total rainfall volume, Cv% = Total I/I Flow Volume / Total Precipitation Volume * 100% 7 Peak I/ I Coefficient: The ratio of peak I/I flow and peak rainfall intensity, Peak I/ I Coefficient = Peak I/I Flow / (Peak Rainfall Intensity over Tc * Catchment Area) 8 Hourly Wet‐Weather Peaking Factor: The ratio of peak hourly wet‐weather measured flow and average dry‐weather flow, Wet‐Weather Peaking Factor = Peak Hourly Wet‐Weather Measured Flow / Average Dry-Weather Flow 9 Instantaneous Wet‐Weather Peaking Factor: The ratio of peak wet‐weather measured flow and average dry‐weather flow, Wet‐Weather Peaking Factor = Peak Wet‐Weather Measured Flow / Average Dry-Weather Flow 2
1275 Civica Infrastructure Inc. www.civi.ca
Civica Infrastructures Inc. Kawartha Lakes Flow Monitoring Report
Appendix - A June 03, 2024
I/I Analysis Graph Station: 6-3
1276 Civica Infrastructure Inc. www.civi.ca
Civica Infrastructures Inc. Kawartha Lakes Flow Monitoring Report
Appendix - A June 03, 2024
Infiltration/Inflow Event Analysis Station: 6-3 May 26, 2022 07:30 – May 28, 2022 11:00, Total Precipitation: 20.25 mm (77,112,000.00 L) Station Details
Storm Details
Catchment Area
380.80 ha
Total Precipitation
20.25 mm (77,112,000.00 L)
Duration of Storm
27.50 hr
Time of Concentration (Tc) 1
80 min
Peak Precipitation Intensity Over Tc 2
6.80 mm/hr
Return Period over Tc 3
< 2 Yr
Measured Flow
I/I Flow
Time of Peak Measured Flow
May 27, 2022 19:20
Time of Peak I/I Flow (TD)
May 27, 2022 19:20
Estimated Dry Weather Flow at TD
37.02 L/s
Peak Measured Flow
60.55 L/s
Peak I/I Flow 4
23.54 L/s
Peak I/I Rate 5
0.06 L/s/ha
Peak Measured Depth
171.00 mm
Total I/I Flow Volume during event
516,294.80 L
Volumetric Coefficient (Cv%) 6
0.67%
Total Measured Flow Volume during Event
5,026,054.60 L
Peak I/I Coefficient 7
0.0033
Hourly Wet-Weather Peaking Factor 8
1.83
Instantaneous Wet-Weather Peaking Factor 9
1.91
1
Time of Concentration (Tc): The estimated time for the flow to travel from the furthest point in the upstream area to the point of monitoring, assume flow is travelling at 1.00 m/s Peak Precipitation Intensity Over Tc: The peak rainfall intensity for the duration of the storm with the time interval defined by time of concentration 3 Return Period over Tc: The estimated time to elapse before a storm of equal or greater intensity will likely occur again, based on design storm criteria 4 Peak I/I Flow: The greatest difference captured between measured flow and estimated dry weather flow, Peak I/I Flow = Maximum (Measured Flow – Estimated Dry Weather Flow) 5 Peak I/I Rate: A normalized peak I/I flow based on catchment area size, Peak I/I Rate = Peak I/I Flow / Catchment Area 6 Volumetric Coefficient (Cv%): The ratio of total I/I volume and total rainfall volume, Cv% = Total I/I Flow Volume / Total Precipitation Volume * 100% 7 Peak I/ I Coefficient: The ratio of peak I/I flow and peak rainfall intensity, Peak I/ I Coefficient = Peak I/I Flow / (Peak Rainfall Intensity over Tc * Catchment Area) 8 Hourly Wet‐Weather Peaking Factor: The ratio of peak hourly wet‐weather measured flow and average dry‐weather flow, Wet‐Weather Peaking Factor = Peak Hourly Wet‐Weather Measured Flow / Average Dry-Weather Flow 9 Instantaneous Wet‐Weather Peaking Factor: The ratio of peak wet‐weather measured flow and average dry‐weather flow, Wet‐Weather Peaking Factor = Peak Wet‐Weather Measured Flow / Average Dry-Weather Flow 2
1277 Civica Infrastructure Inc. www.civi.ca
Civica Infrastructures Inc. Kawartha Lakes Flow Monitoring Report
Appendix - A June 03, 2024
I/I Analysis Graph Station: 6-3
1278 Civica Infrastructure Inc. www.civi.ca
Civica Infrastructures Inc. Kawartha Lakes Flow Monitoring Report
Appendix - A June 03, 2024
Infiltration/Inflow Event Analysis Station: 6-3 Jun 05, 2022 18:20 – Jun 08, 2022 02:45, Total Precipitation: 30.00 mm (114,240,000.00 L) Station Details
Storm Details
Catchment Area
380.80 ha
Total Precipitation
30.00 mm (114,240,000.00 L)
Duration of Storm
32.42 hr
Time of Concentration (Tc) 1
80 min
Peak Precipitation Intensity Over Tc 2
5.40 mm/hr
Return Period over Tc 3
< 2 Yr
Measured Flow
I/I Flow
Time of Peak Measured Flow
Jun 07, 2022 09:10
Time of Peak I/I Flow (TD)
Jun 06, 2022 20:40
Estimated Dry Weather Flow at TD
35.92 L/s
Peak Measured Flow
60.49 L/s
Peak I/I Flow 4
21.23 L/s
Peak I/I Rate 5
0.06 L/s/ha
Peak Measured Depth
175.00 mm
Total I/I Flow Volume during event
1,012,817.30 L
Volumetric Coefficient (Cv%) 6
0.89%
Total Measured Flow Volume during Event
6,543,665.60 L
Peak I/I Coefficient 7
0.0037
Hourly Wet-Weather Peaking Factor 8
1.63
Instantaneous Wet-Weather Peaking Factor 9
1.75
1
Time of Concentration (Tc): The estimated time for the flow to travel from the furthest point in the upstream area to the point of monitoring, assume flow is travelling at 1.00 m/s Peak Precipitation Intensity Over Tc: The peak rainfall intensity for the duration of the storm with the time interval defined by time of concentration 3 Return Period over Tc: The estimated time to elapse before a storm of equal or greater intensity will likely occur again, based on design storm criteria 4 Peak I/I Flow: The greatest difference captured between measured flow and estimated dry weather flow, Peak I/I Flow = Maximum (Measured Flow – Estimated Dry Weather Flow) 5 Peak I/I Rate: A normalized peak I/I flow based on catchment area size, Peak I/I Rate = Peak I/I Flow / Catchment Area 6 Volumetric Coefficient (Cv%): The ratio of total I/I volume and total rainfall volume, Cv% = Total I/I Flow Volume / Total Precipitation Volume * 100% 7 Peak I/ I Coefficient: The ratio of peak I/I flow and peak rainfall intensity, Peak I/ I Coefficient = Peak I/I Flow / (Peak Rainfall Intensity over Tc * Catchment Area) 8 Hourly Wet‐Weather Peaking Factor: The ratio of peak hourly wet‐weather measured flow and average dry‐weather flow, Wet‐Weather Peaking Factor = Peak Hourly Wet‐Weather Measured Flow / Average Dry-Weather Flow 9 Instantaneous Wet‐Weather Peaking Factor: The ratio of peak wet‐weather measured flow and average dry‐weather flow, Wet‐Weather Peaking Factor = Peak Wet‐Weather Measured Flow / Average Dry-Weather Flow 2
1279 Civica Infrastructure Inc. www.civi.ca
Civica Infrastructures Inc. Kawartha Lakes Flow Monitoring Report
Appendix - A June 03, 2024
I/I Analysis Graph Station: 6-3
1280 Civica Infrastructure Inc. www.civi.ca
Civica Infrastructures Inc. Kawartha Lakes Flow Monitoring Report
Appendix - A June 03, 2024
Infiltration/Inflow Event Analysis Station: 6-3 Jun 11, 2022 01:55 – Jun 13, 2022 03:00, Total Precipitation: 41.50 mm (158,032,000.00 L) Station Details
Storm Details
Catchment Area
380.80 ha
Total Precipitation
41.50 mm (158,032,000.00 L)
Duration of Storm
25.08 hr
Time of Concentration (Tc) 1
80 min
Peak Precipitation Intensity Over Tc 2
15.40 mm/hr
Return Period over Tc 3
< 2 Yr
Measured Flow
I/I Flow
Time of Peak Measured Flow
Jun 12, 2022 09:45
Time of Peak I/I Flow (TD)
Jun 12, 2022 09:45
Estimated Dry Weather Flow at TD
42.48 L/s
Peak Measured Flow
146.81 L/s
Peak I/I Flow 4
104.34 L/s
Peak I/I Rate 5
0.27 L/s/ha
Peak Measured Depth
245.00 mm
Total I/I Flow Volume during event
4,047,353.20 L
Volumetric Coefficient (Cv%) 6
2.56%
Total Measured Flow Volume during Event
8,338,907.60 L
Peak I/I Coefficient 7
0.0064
Hourly Wet-Weather Peaking Factor 8
4.17
Instantaneous Wet-Weather Peaking Factor 9
4.58
1
Time of Concentration (Tc): The estimated time for the flow to travel from the furthest point in the upstream area to the point of monitoring, assume flow is travelling at 1.00 m/s Peak Precipitation Intensity Over Tc: The peak rainfall intensity for the duration of the storm with the time interval defined by time of concentration 3 Return Period over Tc: The estimated time to elapse before a storm of equal or greater intensity will likely occur again, based on design storm criteria 4 Peak I/I Flow: The greatest difference captured between measured flow and estimated dry weather flow, Peak I/I Flow = Maximum (Measured Flow – Estimated Dry Weather Flow) 5 Peak I/I Rate: A normalized peak I/I flow based on catchment area size, Peak I/I Rate = Peak I/I Flow / Catchment Area 6 Volumetric Coefficient (Cv%): The ratio of total I/I volume and total rainfall volume, Cv% = Total I/I Flow Volume / Total Precipitation Volume * 100% 7 Peak I/ I Coefficient: The ratio of peak I/I flow and peak rainfall intensity, Peak I/ I Coefficient = Peak I/I Flow / (Peak Rainfall Intensity over Tc * Catchment Area) 8 Hourly Wet‐Weather Peaking Factor: The ratio of peak hourly wet‐weather measured flow and average dry‐weather flow, Wet‐Weather Peaking Factor = Peak Hourly Wet‐Weather Measured Flow / Average Dry-Weather Flow 9 Instantaneous Wet‐Weather Peaking Factor: The ratio of peak wet‐weather measured flow and average dry‐weather flow, Wet‐Weather Peaking Factor = Peak Wet‐Weather Measured Flow / Average Dry-Weather Flow 2
1281 Civica Infrastructure Inc. www.civi.ca
Civica Infrastructures Inc. Kawartha Lakes Flow Monitoring Report
Appendix - A June 03, 2024
I/I Analysis Graph Station: 6-3
1282 Civica Infrastructure Inc. www.civi.ca
Civica Infrastructures Inc. Kawartha Lakes Flow Monitoring Report
Appendix - A June 03, 2024
Infiltration/Inflow Event Analysis Station: 6-3 Jul 11, 2022 14:25 – Jul 12, 2022 22:10, Total Precipitation: 15.50 mm (59,024,000.00 L) Station Details
Storm Details
Catchment Area
380.80 ha
Total Precipitation
15.50 mm (59,024,000.00 L)
Duration of Storm
7.75 hr
Time of Concentration (Tc) 1
80 min
Peak Precipitation Intensity Over Tc 2
9.80 mm/hr
Return Period over Tc 3
< 2 Yr
Measured Flow
I/I Flow
Time of Peak Measured Flow
Jul 12, 2022 07:10
Time of Peak I/I Flow (TD)
Jul 12, 2022 03:25
Estimated Dry Weather Flow at TD
19.95 L/s
Peak Measured Flow
39.36 L/s
Peak I/I Flow 4
14.61 L/s
Peak I/I Rate 5
0.04 L/s/ha
Peak Measured Depth
145.00 mm
Total I/I Flow Volume during event
139,661.00 L
Volumetric Coefficient (Cv%) 6
0.24%
Total Measured Flow Volume during Event
2,224,047.10 L
Peak I/I Coefficient 7
0.0014
Hourly Wet-Weather Peaking Factor 8
1.27
Instantaneous Wet-Weather Peaking Factor 9
1.35
1
Time of Concentration (Tc): The estimated time for the flow to travel from the furthest point in the upstream area to the point of monitoring, assume flow is travelling at 1.00 m/s Peak Precipitation Intensity Over Tc: The peak rainfall intensity for the duration of the storm with the time interval defined by time of concentration 3 Return Period over Tc: The estimated time to elapse before a storm of equal or greater intensity will likely occur again, based on design storm criteria 4 Peak I/I Flow: The greatest difference captured between measured flow and estimated dry weather flow, Peak I/I Flow = Maximum (Measured Flow – Estimated Dry Weather Flow) 5 Peak I/I Rate: A normalized peak I/I flow based on catchment area size, Peak I/I Rate = Peak I/I Flow / Catchment Area 6 Volumetric Coefficient (Cv%): The ratio of total I/I volume and total rainfall volume, Cv% = Total I/I Flow Volume / Total Precipitation Volume * 100% 7 Peak I/ I Coefficient: The ratio of peak I/I flow and peak rainfall intensity, Peak I/ I Coefficient = Peak I/I Flow / (Peak Rainfall Intensity over Tc * Catchment Area) 8 Hourly Wet‐Weather Peaking Factor: The ratio of peak hourly wet‐weather measured flow and average dry‐weather flow, Wet‐Weather Peaking Factor = Peak Hourly Wet‐Weather Measured Flow / Average Dry-Weather Flow 9 Instantaneous Wet‐Weather Peaking Factor: The ratio of peak wet‐weather measured flow and average dry‐weather flow, Wet‐Weather Peaking Factor = Peak Wet‐Weather Measured Flow / Average Dry-Weather Flow 2
1283 Civica Infrastructure Inc. www.civi.ca
Civica Infrastructures Inc. Kawartha Lakes Flow Monitoring Report
Appendix - A June 03, 2024
I/I Analysis Graph Station: 6-3
1284 Civica Infrastructure Inc. www.civi.ca
Civica Infrastructures Inc. Kawartha Lakes Flow Monitoring Report
Appendix - A June 03, 2024
Infiltration/Inflow Event Analysis Station: 6-3 Jul 17, 2022 16:10 – Jul 20, 2022 11:25, Total Precipitation: 21.50 mm (81,872,000.00 L) Station Details
Storm Details
Catchment Area
380.80 ha
Total Precipitation
21.50 mm (81,872,000.00 L)
Duration of Storm
43.25 hr
Time of Concentration (Tc) 1
80 min
Peak Precipitation Intensity Over Tc 2
1.10 mm/hr
Return Period over Tc 3
< 2 Yr
Measured Flow
I/I Flow
Time of Peak Measured Flow
Jul 18, 2022 12:45
Time of Peak I/I Flow (TD)
Jul 18, 2022 12:15
Estimated Dry Weather Flow at TD
30.97 L/s
Peak Measured Flow
73.17 L/s
Peak I/I Flow 4
42.14 L/s
Peak I/I Rate 5
0.11 L/s/ha
Peak Measured Depth
192.00 mm
Total I/I Flow Volume during event
1,397,190.50 L
Volumetric Coefficient (Cv%) 6
1.71%
Total Measured Flow Volume during Event
7,011,616.00 L
Peak I/I Coefficient 7
0.0354
Hourly Wet-Weather Peaking Factor 8
2.51
Instantaneous Wet-Weather Peaking Factor 9
2.60
1
Time of Concentration (Tc): The estimated time for the flow to travel from the furthest point in the upstream area to the point of monitoring, assume flow is travelling at 1.00 m/s Peak Precipitation Intensity Over Tc: The peak rainfall intensity for the duration of the storm with the time interval defined by time of concentration 3 Return Period over Tc: The estimated time to elapse before a storm of equal or greater intensity will likely occur again, based on design storm criteria 4 Peak I/I Flow: The greatest difference captured between measured flow and estimated dry weather flow, Peak I/I Flow = Maximum (Measured Flow – Estimated Dry Weather Flow) 5 Peak I/I Rate: A normalized peak I/I flow based on catchment area size, Peak I/I Rate = Peak I/I Flow / Catchment Area 6 Volumetric Coefficient (Cv%): The ratio of total I/I volume and total rainfall volume, Cv% = Total I/I Flow Volume / Total Precipitation Volume * 100% 7 Peak I/ I Coefficient: The ratio of peak I/I flow and peak rainfall intensity, Peak I/ I Coefficient = Peak I/I Flow / (Peak Rainfall Intensity over Tc * Catchment Area) 8 Hourly Wet‐Weather Peaking Factor: The ratio of peak hourly wet‐weather measured flow and average dry‐weather flow, Wet‐Weather Peaking Factor = Peak Hourly Wet‐Weather Measured Flow / Average Dry-Weather Flow 9 Instantaneous Wet‐Weather Peaking Factor: The ratio of peak wet‐weather measured flow and average dry‐weather flow, Wet‐Weather Peaking Factor = Peak Wet‐Weather Measured Flow / Average Dry-Weather Flow 2
1285 Civica Infrastructure Inc. www.civi.ca
Civica Infrastructures Inc. Kawartha Lakes Flow Monitoring Report
Appendix - A June 03, 2024
I/I Analysis Graph Station: 6-3
1286 Civica Infrastructure Inc. www.civi.ca
Civica Infrastructures Inc. Kawartha Lakes Flow Monitoring Report
Appendix - A June 03, 2024
Infiltration/Inflow Event Analysis Station: 6-3 Aug 17, 2022 03:20 – Aug 18, 2022 05:10, Total Precipitation: 17.50 mm (66,640,000.00 L) Station Details
Storm Details
Catchment Area
380.80 ha
Total Precipitation
17.50 mm (66,640,000.00 L)
Duration of Storm
1.83 hr
Time of Concentration (Tc) 1
80 min
Peak Precipitation Intensity Over Tc 2
12.60 mm/hr
Return Period over Tc 3
< 2 Yr
Measured Flow
I/I Flow
Time of Peak Measured Flow
Aug 17, 2022 16:05
Time of Peak I/I Flow (TD)
Aug 17, 2022 16:05
Estimated Dry Weather Flow at TD
28.37 L/s
Peak Measured Flow
69.89 L/s
Peak I/I Flow 4
41.52 L/s
Peak I/I Rate 5
0.11 L/s/ha
Peak Measured Depth
185.00 mm
Total I/I Flow Volume during event
211,953.10 L
Volumetric Coefficient (Cv%) 6
0.32%
Total Measured Flow Volume during Event
1,435,362.00 L
Peak I/I Coefficient 7
0.0031
Hourly Wet-Weather Peaking Factor 8
2.47
Instantaneous Wet-Weather Peaking Factor 9
2.86
1
Time of Concentration (Tc): The estimated time for the flow to travel from the furthest point in the upstream area to the point of monitoring, assume flow is travelling at 1.00 m/s Peak Precipitation Intensity Over Tc: The peak rainfall intensity for the duration of the storm with the time interval defined by time of concentration 3 Return Period over Tc: The estimated time to elapse before a storm of equal or greater intensity will likely occur again, based on design storm criteria 4 Peak I/I Flow: The greatest difference captured between measured flow and estimated dry weather flow, Peak I/I Flow = Maximum (Measured Flow – Estimated Dry Weather Flow) 5 Peak I/I Rate: A normalized peak I/I flow based on catchment area size, Peak I/I Rate = Peak I/I Flow / Catchment Area 6 Volumetric Coefficient (Cv%): The ratio of total I/I volume and total rainfall volume, Cv% = Total I/I Flow Volume / Total Precipitation Volume * 100% 7 Peak I/ I Coefficient: The ratio of peak I/I flow and peak rainfall intensity, Peak I/ I Coefficient = Peak I/I Flow / (Peak Rainfall Intensity over Tc * Catchment Area) 8 Hourly Wet‐Weather Peaking Factor: The ratio of peak hourly wet‐weather measured flow and average dry‐weather flow, Wet‐Weather Peaking Factor = Peak Hourly Wet‐Weather Measured Flow / Average Dry-Weather Flow 9 Instantaneous Wet‐Weather Peaking Factor: The ratio of peak wet‐weather measured flow and average dry‐weather flow, Wet‐Weather Peaking Factor = Peak Wet‐Weather Measured Flow / Average Dry-Weather Flow 2
1287 Civica Infrastructure Inc. www.civi.ca
Civica Infrastructures Inc. Kawartha Lakes Flow Monitoring Report
Appendix - A June 03, 2024
I/I Analysis Graph Station: 6-3
1288 Civica Infrastructure Inc. www.civi.ca
Civica Infrastructures Inc. Kawartha Lakes Flow Monitoring Report
Appendix - A June 03, 2024
Infiltration/Inflow Event Analysis Station: 6-3 Aug 21, 2022 09:50 – Aug 23, 2022 16:20, Total Precipitation: 17.50 mm (66,640,000.00 L) Station Details
Storm Details
Catchment Area
380.80 ha
Total Precipitation
17.50 mm (66,640,000.00 L)
Duration of Storm
30.50 hr
Time of Concentration (Tc) 1
80 min
Peak Precipitation Intensity Over Tc 2
5.40 mm/hr
Return Period over Tc 3
< 2 Yr
Measured Flow
I/I Flow
Time of Peak Measured Flow
Aug 22, 2022 14:10
Time of Peak I/I Flow (TD)
Aug 22, 2022 00:05
Estimated Dry Weather Flow at TD
21.70 L/s
Peak Measured Flow
50.53 L/s
Peak I/I Flow 4
27.01 L/s
Peak I/I Rate 5
0.07 L/s/ha
Peak Measured Depth
166.00 mm
Total I/I Flow Volume during event
974,591.50 L
Volumetric Coefficient (Cv%) 6
1.46%
Total Measured Flow Volume during Event
5,339,081.60 L
Peak I/I Coefficient 7
0.0047
Hourly Wet-Weather Peaking Factor 8
1.59
Instantaneous Wet-Weather Peaking Factor 9
1.77
1
Time of Concentration (Tc): The estimated time for the flow to travel from the furthest point in the upstream area to the point of monitoring, assume flow is travelling at 1.00 m/s Peak Precipitation Intensity Over Tc: The peak rainfall intensity for the duration of the storm with the time interval defined by time of concentration 3 Return Period over Tc: The estimated time to elapse before a storm of equal or greater intensity will likely occur again, based on design storm criteria 4 Peak I/I Flow: The greatest difference captured between measured flow and estimated dry weather flow, Peak I/I Flow = Maximum (Measured Flow – Estimated Dry Weather Flow) 5 Peak I/I Rate: A normalized peak I/I flow based on catchment area size, Peak I/I Rate = Peak I/I Flow / Catchment Area 6 Volumetric Coefficient (Cv%): The ratio of total I/I volume and total rainfall volume, Cv% = Total I/I Flow Volume / Total Precipitation Volume * 100% 7 Peak I/ I Coefficient: The ratio of peak I/I flow and peak rainfall intensity, Peak I/ I Coefficient = Peak I/I Flow / (Peak Rainfall Intensity over Tc * Catchment Area) 8 Hourly Wet‐Weather Peaking Factor: The ratio of peak hourly wet‐weather measured flow and average dry‐weather flow, Wet‐Weather Peaking Factor = Peak Hourly Wet‐Weather Measured Flow / Average Dry-Weather Flow 9 Instantaneous Wet‐Weather Peaking Factor: The ratio of peak wet‐weather measured flow and average dry‐weather flow, Wet‐Weather Peaking Factor = Peak Wet‐Weather Measured Flow / Average Dry-Weather Flow 2
1289 Civica Infrastructure Inc. www.civi.ca
Civica Infrastructures Inc. Kawartha Lakes Flow Monitoring Report
Appendix - A June 03, 2024
I/I Analysis Graph Station: 6-3
1290 Civica Infrastructure Inc. www.civi.ca
Civica Infrastructures Inc. Kawartha Lakes Flow Monitoring Report
Appendix - A June 03, 2024
Infiltration/Inflow Event Analysis Station: 6-3 Aug 25, 2022 01:30 – Aug 26, 2022 10:05, Total Precipitation: 16.25 mm (61,880,000.00 L) Station Details
Storm Details
Catchment Area
380.80 ha
Total Precipitation
16.25 mm (61,880,000.00 L)
Duration of Storm
8.58 hr
Time of Concentration (Tc) 1
80 min
Peak Precipitation Intensity Over Tc 2
10.90 mm/hr
Return Period over Tc 3
< 2 Yr
Measured Flow
I/I Flow
Time of Peak Measured Flow
Aug 25, 2022 19:15
Time of Peak I/I Flow (TD)
Aug 25, 2022 19:25
Estimated Dry Weather Flow at TD
31.22 L/s
Peak Measured Flow
69.75 L/s
Peak I/I Flow 4
38.27 L/s
Peak I/I Rate 5
0.10 L/s/ha
Peak Measured Depth
195.00 mm
Total I/I Flow Volume during event
531,796.50 L
Volumetric Coefficient (Cv%) 6
0.86%
Total Measured Flow Volume during Event
2,638,751.90 L
Peak I/I Coefficient 7
0.0033
Hourly Wet-Weather Peaking Factor 8
2.32
Instantaneous Wet-Weather Peaking Factor 9
2.46
1
Time of Concentration (Tc): The estimated time for the flow to travel from the furthest point in the upstream area to the point of monitoring, assume flow is travelling at 1.00 m/s Peak Precipitation Intensity Over Tc: The peak rainfall intensity for the duration of the storm with the time interval defined by time of concentration 3 Return Period over Tc: The estimated time to elapse before a storm of equal or greater intensity will likely occur again, based on design storm criteria 4 Peak I/I Flow: The greatest difference captured between measured flow and estimated dry weather flow, Peak I/I Flow = Maximum (Measured Flow – Estimated Dry Weather Flow) 5 Peak I/I Rate: A normalized peak I/I flow based on catchment area size, Peak I/I Rate = Peak I/I Flow / Catchment Area 6 Volumetric Coefficient (Cv%): The ratio of total I/I volume and total rainfall volume, Cv% = Total I/I Flow Volume / Total Precipitation Volume * 100% 7 Peak I/ I Coefficient: The ratio of peak I/I flow and peak rainfall intensity, Peak I/ I Coefficient = Peak I/I Flow / (Peak Rainfall Intensity over Tc * Catchment Area) 8 Hourly Wet‐Weather Peaking Factor: The ratio of peak hourly wet‐weather measured flow and average dry‐weather flow, Wet‐Weather Peaking Factor = Peak Hourly Wet‐Weather Measured Flow / Average Dry-Weather Flow 9 Instantaneous Wet‐Weather Peaking Factor: The ratio of peak wet‐weather measured flow and average dry‐weather flow, Wet‐Weather Peaking Factor = Peak Wet‐Weather Measured Flow / Average Dry-Weather Flow 2
1291 Civica Infrastructure Inc. www.civi.ca
Civica Infrastructures Inc. Kawartha Lakes Flow Monitoring Report
Appendix - A June 03, 2024
I/I Analysis Graph Station: 6-3
1292 Civica Infrastructure Inc. www.civi.ca
Civica Infrastructures Inc. Kawartha Lakes Flow Monitoring Report
Appendix - A June 03, 2024
Infiltration/Inflow Event Analysis Station: 6-3 Aug 29, 2022 01:40 – Aug 30, 2022 04:10, Total Precipitation: 29.00 mm (110,432,000.00 L) Station Details
Storm Details
Catchment Area
380.80 ha
Total Precipitation
29.00 mm (110,432,000.00 L)
Duration of Storm
2.50 hr
Time of Concentration (Tc) 1
80 min
Peak Precipitation Intensity Over Tc 2
16.10 mm/hr
Return Period over Tc 3
< 2 Yr
Measured Flow
I/I Flow
Time of Peak Measured Flow
Aug 29, 2022 15:25
Time of Peak I/I Flow (TD)
Aug 29, 2022 15:25
Estimated Dry Weather Flow at TD
32.36 L/s
Peak Measured Flow
142.26 L/s
Peak I/I Flow 4
109.90 L/s
Peak I/I Rate 5
0.29 L/s/ha
Peak Measured Depth
250.00 mm
Total I/I Flow Volume during event
1,289,153.50 L
Volumetric Coefficient (Cv%) 6
1.17%
Total Measured Flow Volume during Event
2,766,266.50 L
Peak I/I Coefficient 7
0.0064
Hourly Wet-Weather Peaking Factor 8
4.29
Instantaneous Wet-Weather Peaking Factor 9
5.06
1
Time of Concentration (Tc): The estimated time for the flow to travel from the furthest point in the upstream area to the point of monitoring, assume flow is travelling at 1.00 m/s Peak Precipitation Intensity Over Tc: The peak rainfall intensity for the duration of the storm with the time interval defined by time of concentration 3 Return Period over Tc: The estimated time to elapse before a storm of equal or greater intensity will likely occur again, based on design storm criteria 4 Peak I/I Flow: The greatest difference captured between measured flow and estimated dry weather flow, Peak I/I Flow = Maximum (Measured Flow – Estimated Dry Weather Flow) 5 Peak I/I Rate: A normalized peak I/I flow based on catchment area size, Peak I/I Rate = Peak I/I Flow / Catchment Area 6 Volumetric Coefficient (Cv%): The ratio of total I/I volume and total rainfall volume, Cv% = Total I/I Flow Volume / Total Precipitation Volume * 100% 7 Peak I/ I Coefficient: The ratio of peak I/I flow and peak rainfall intensity, Peak I/ I Coefficient = Peak I/I Flow / (Peak Rainfall Intensity over Tc * Catchment Area) 8 Hourly Wet‐Weather Peaking Factor: The ratio of peak hourly wet‐weather measured flow and average dry‐weather flow, Wet‐Weather Peaking Factor = Peak Hourly Wet‐Weather Measured Flow / Average Dry-Weather Flow 9 Instantaneous Wet‐Weather Peaking Factor: The ratio of peak wet‐weather measured flow and average dry‐weather flow, Wet‐Weather Peaking Factor = Peak Wet‐Weather Measured Flow / Average Dry-Weather Flow 2
1293 Civica Infrastructure Inc. www.civi.ca
Civica Infrastructures Inc. Kawartha Lakes Flow Monitoring Report
Appendix - A June 03, 2024
I/I Analysis Graph Station: 6-3
1294 Civica Infrastructure Inc. www.civi.ca
Civica Infrastructures Inc. Kawartha Lakes Flow Monitoring Report
Appendix - A June 03, 2024
Infiltration/Inflow Event Analysis Station: 6-3 Sep 11, 2022 15:50 – Sep 13, 2022 16:55, Total Precipitation: 21.75 mm (82,824,000.00 L) Station Details
Storm Details
Catchment Area
380.80 ha
Total Precipitation
21.75 mm (82,824,000.00 L)
Duration of Storm
25.08 hr
Time of Concentration (Tc) 1
80 min
Peak Precipitation Intensity Over Tc 2
6.20 mm/hr
Return Period over Tc 3
< 2 Yr
Measured Flow
I/I Flow
Time of Peak Measured Flow
Sep 12, 2022 08:05
Time of Peak I/I Flow (TD)
Sep 12, 2022 08:05
Estimated Dry Weather Flow at TD
40.71 L/s
Peak Measured Flow
65.35 L/s
Peak I/I Flow 4
24.64 L/s
Peak I/I Rate 5
0.07 L/s/ha
Peak Measured Depth
182.50 mm
Total I/I Flow Volume during event
483,794.30 L
Volumetric Coefficient (Cv%) 6
0.58%
Total Measured Flow Volume during Event
4,861,236.40 L
Peak I/I Coefficient 7
0.0038
Hourly Wet-Weather Peaking Factor 8
1.86
Instantaneous Wet-Weather Peaking Factor 9
2.00
1
Time of Concentration (Tc): The estimated time for the flow to travel from the furthest point in the upstream area to the point of monitoring, assume flow is travelling at 1.00 m/s Peak Precipitation Intensity Over Tc: The peak rainfall intensity for the duration of the storm with the time interval defined by time of concentration 3 Return Period over Tc: The estimated time to elapse before a storm of equal or greater intensity will likely occur again, based on design storm criteria 4 Peak I/I Flow: The greatest difference captured between measured flow and estimated dry weather flow, Peak I/I Flow = Maximum (Measured Flow – Estimated Dry Weather Flow) 5 Peak I/I Rate: A normalized peak I/I flow based on catchment area size, Peak I/I Rate = Peak I/I Flow / Catchment Area 6 Volumetric Coefficient (Cv%): The ratio of total I/I volume and total rainfall volume, Cv% = Total I/I Flow Volume / Total Precipitation Volume * 100% 7 Peak I/ I Coefficient: The ratio of peak I/I flow and peak rainfall intensity, Peak I/ I Coefficient = Peak I/I Flow / (Peak Rainfall Intensity over Tc * Catchment Area) 8 Hourly Wet‐Weather Peaking Factor: The ratio of peak hourly wet‐weather measured flow and average dry‐weather flow, Wet‐Weather Peaking Factor = Peak Hourly Wet‐Weather Measured Flow / Average Dry-Weather Flow 9 Instantaneous Wet‐Weather Peaking Factor: The ratio of peak wet‐weather measured flow and average dry‐weather flow, Wet‐Weather Peaking Factor = Peak Wet‐Weather Measured Flow / Average Dry-Weather Flow 2
1295 Civica Infrastructure Inc. www.civi.ca
Civica Infrastructures Inc. Kawartha Lakes Flow Monitoring Report
Appendix - A June 03, 2024
I/I Analysis Graph Station: 6-3
1296 Civica Infrastructure Inc. www.civi.ca
Civica Infrastructures Inc. Kawartha Lakes Flow Monitoring Report
Appendix - A June 03, 2024
Infiltration/Inflow Event Analysis Station: 6-3 Sep 17, 2022 19:35 – Sep 19, 2022 01:10, Total Precipitation: 24.50 mm (93,296,000.00 L) Station Details
Storm Details
Catchment Area
380.80 ha
Total Precipitation
24.50 mm (93,296,000.00 L)
Duration of Storm
5.58 hr
Time of Concentration (Tc) 1
80 min
Peak Precipitation Intensity Over Tc 2
11.80 mm/hr
Return Period over Tc 3
< 2 Yr
Measured Flow
I/I Flow
Time of Peak Measured Flow
Sep 18, 2022 09:55
Time of Peak I/I Flow (TD)
Sep 18, 2022 09:55
Estimated Dry Weather Flow at TD
42.49 L/s
Peak Measured Flow
77.82 L/s
Peak I/I Flow 4
35.32 L/s
Peak I/I Rate 5
0.09 L/s/ha
Peak Measured Depth
196.00 mm
Total I/I Flow Volume during event
920,512.10 L
Volumetric Coefficient (Cv%) 6
0.99%
Total Measured Flow Volume during Event
2,980,457.00 L
Peak I/I Coefficient 7
0.0028
Hourly Wet-Weather Peaking Factor 8
2.20
Instantaneous Wet-Weather Peaking Factor 9
2.40
1
Time of Concentration (Tc): The estimated time for the flow to travel from the furthest point in the upstream area to the point of monitoring, assume flow is travelling at 1.00 m/s Peak Precipitation Intensity Over Tc: The peak rainfall intensity for the duration of the storm with the time interval defined by time of concentration 3 Return Period over Tc: The estimated time to elapse before a storm of equal or greater intensity will likely occur again, based on design storm criteria 4 Peak I/I Flow: The greatest difference captured between measured flow and estimated dry weather flow, Peak I/I Flow = Maximum (Measured Flow – Estimated Dry Weather Flow) 5 Peak I/I Rate: A normalized peak I/I flow based on catchment area size, Peak I/I Rate = Peak I/I Flow / Catchment Area 6 Volumetric Coefficient (Cv%): The ratio of total I/I volume and total rainfall volume, Cv% = Total I/I Flow Volume / Total Precipitation Volume * 100% 7 Peak I/ I Coefficient: The ratio of peak I/I flow and peak rainfall intensity, Peak I/ I Coefficient = Peak I/I Flow / (Peak Rainfall Intensity over Tc * Catchment Area) 8 Hourly Wet‐Weather Peaking Factor: The ratio of peak hourly wet‐weather measured flow and average dry‐weather flow, Wet‐Weather Peaking Factor = Peak Hourly Wet‐Weather Measured Flow / Average Dry-Weather Flow 9 Instantaneous Wet‐Weather Peaking Factor: The ratio of peak wet‐weather measured flow and average dry‐weather flow, Wet‐Weather Peaking Factor = Peak Wet‐Weather Measured Flow / Average Dry-Weather Flow 2
1297 Civica Infrastructure Inc. www.civi.ca
Civica Infrastructures Inc. Kawartha Lakes Flow Monitoring Report
Appendix - A June 03, 2024
I/I Analysis Graph Station: 6-3
1298 Civica Infrastructure Inc. www.civi.ca
Civica Infrastructures Inc. Kawartha Lakes Flow Monitoring Report
Appendix - A June 03, 2024
Infiltration/Inflow Event Analysis Station: 6-3 Oct 12, 2022 08:40 – Oct 13, 2022 23:55, Total Precipitation: 20.75 mm (79,016,000.00 L) Station Details
Storm Details
Catchment Area
380.80 ha
Total Precipitation
20.75 mm (79,016,000.00 L)
Duration of Storm
15.25 hr
Time of Concentration (Tc) 1
80 min
Peak Precipitation Intensity Over Tc 2
4.30 mm/hr
Return Period over Tc 3
< 2 Yr
Measured Flow
I/I Flow
Time of Peak Measured Flow
Oct 13, 2022 09:10
Time of Peak I/I Flow (TD)
Oct 13, 2022 09:10
Estimated Dry Weather Flow at TD
40.56 L/s
Peak Measured Flow
65.89 L/s
Peak I/I Flow 4
25.33 L/s
Peak I/I Rate 5
0.07 L/s/ha
Peak Measured Depth
187.00 mm
Total I/I Flow Volume during event
653,461.00 L
Volumetric Coefficient (Cv%) 6
0.83%
Total Measured Flow Volume during Event
3,796,951.90 L
Peak I/I Coefficient 7
0.0056
Hourly Wet-Weather Peaking Factor 8
1.93
Instantaneous Wet-Weather Peaking Factor 9
2.06
1
Time of Concentration (Tc): The estimated time for the flow to travel from the furthest point in the upstream area to the point of monitoring, assume flow is travelling at 1.00 m/s Peak Precipitation Intensity Over Tc: The peak rainfall intensity for the duration of the storm with the time interval defined by time of concentration 3 Return Period over Tc: The estimated time to elapse before a storm of equal or greater intensity will likely occur again, based on design storm criteria 4 Peak I/I Flow: The greatest difference captured between measured flow and estimated dry weather flow, Peak I/I Flow = Maximum (Measured Flow – Estimated Dry Weather Flow) 5 Peak I/I Rate: A normalized peak I/I flow based on catchment area size, Peak I/I Rate = Peak I/I Flow / Catchment Area 6 Volumetric Coefficient (Cv%): The ratio of total I/I volume and total rainfall volume, Cv% = Total I/I Flow Volume / Total Precipitation Volume * 100% 7 Peak I/ I Coefficient: The ratio of peak I/I flow and peak rainfall intensity, Peak I/ I Coefficient = Peak I/I Flow / (Peak Rainfall Intensity over Tc * Catchment Area) 8 Hourly Wet‐Weather Peaking Factor: The ratio of peak hourly wet‐weather measured flow and average dry‐weather flow, Wet‐Weather Peaking Factor = Peak Hourly Wet‐Weather Measured Flow / Average Dry-Weather Flow 9 Instantaneous Wet‐Weather Peaking Factor: The ratio of peak wet‐weather measured flow and average dry‐weather flow, Wet‐Weather Peaking Factor = Peak Wet‐Weather Measured Flow / Average Dry-Weather Flow 2
1299 Civica Infrastructure Inc. www.civi.ca
Civica Infrastructures Inc. Kawartha Lakes Flow Monitoring Report
Appendix - A June 03, 2024
I/I Analysis Graph Station: 6-3
1300 Civica Infrastructure Inc. www.civi.ca
Civica Infrastructures Inc. Kawartha Lakes Flow Monitoring Report
Appendix - A June 03, 2024
Infiltration/Inflow Event Analysis Station: 6-3 Nov 29, 2022 15:35 – Dec 01, 2022 02:25, Total Precipitation: 21.00 mm (79,968,000.00 L) Station Details
Storm Details
Catchment Area
380.80 ha
Total Precipitation
21.00 mm (79,968,000.00 L)
Duration of Storm
10.83 hr
Time of Concentration (Tc) 1
80 min
Peak Precipitation Intensity Over Tc 2
3.40 mm/hr
Return Period over Tc 3
< 2 Yr
Measured Flow
I/I Flow
Time of Peak Measured Flow
Nov 30, 2022 12:20
Time of Peak I/I Flow (TD)
Nov 30, 2022 12:20
Estimated Dry Weather Flow at TD
42.04 L/s
Peak Measured Flow
105.02 L/s
Peak I/I Flow 4
62.99 L/s
Peak I/I Rate 5
0.17 L/s/ha
Peak Measured Depth
219.00 mm
Total I/I Flow Volume during event
2,244,230.50 L
Volumetric Coefficient (Cv%) 6
2.81%
Total Measured Flow Volume during Event
5,322,855.30 L
Peak I/I Coefficient 7
0.0176
Hourly Wet-Weather Peaking Factor 8
2.63
Instantaneous Wet-Weather Peaking Factor 9
2.81
1
Time of Concentration (Tc): The estimated time for the flow to travel from the furthest point in the upstream area to the point of monitoring, assume flow is travelling at 1.00 m/s Peak Precipitation Intensity Over Tc: The peak rainfall intensity for the duration of the storm with the time interval defined by time of concentration 3 Return Period over Tc: The estimated time to elapse before a storm of equal or greater intensity will likely occur again, based on design storm criteria 4 Peak I/I Flow: The greatest difference captured between measured flow and estimated dry weather flow, Peak I/I Flow = Maximum (Measured Flow – Estimated Dry Weather Flow) 5 Peak I/I Rate: A normalized peak I/I flow based on catchment area size, Peak I/I Rate = Peak I/I Flow / Catchment Area 6 Volumetric Coefficient (Cv%): The ratio of total I/I volume and total rainfall volume, Cv% = Total I/I Flow Volume / Total Precipitation Volume * 100% 7 Peak I/ I Coefficient: The ratio of peak I/I flow and peak rainfall intensity, Peak I/ I Coefficient = Peak I/I Flow / (Peak Rainfall Intensity over Tc * Catchment Area) 8 Hourly Wet‐Weather Peaking Factor: The ratio of peak hourly wet‐weather measured flow and average dry‐weather flow, Wet‐Weather Peaking Factor = Peak Hourly Wet‐Weather Measured Flow / Average Dry-Weather Flow 9 Instantaneous Wet‐Weather Peaking Factor: The ratio of peak wet‐weather measured flow and average dry‐weather flow, Wet‐Weather Peaking Factor = Peak Wet‐Weather Measured Flow / Average Dry-Weather Flow 2
1301 Civica Infrastructure Inc. www.civi.ca
Civica Infrastructures Inc. Kawartha Lakes Flow Monitoring Report
Appendix - A June 03, 2024
I/I Analysis Graph Station: 6-3
1302 Civica Infrastructure Inc. www.civi.ca
Civica Infrastructures Inc. Kawartha Lakes Flow Monitoring Report
Appendix - A June 03, 2024
Infiltration/Inflow Event Analysis Station: 6-3 Jan 03, 2023 10:15 – Jan 06, 2023 05:40, Total Precipitation: 27.25 mm (103,768,000.00 L) Station Details
Storm Details
Catchment Area
380.80 ha
Total Precipitation
27.25 mm (103,768,000.00 L)
Duration of Storm
43.42 hr
Time of Concentration (Tc) 1
80 min
Peak Precipitation Intensity Over Tc 2
6.80 mm/hr
Return Period over Tc 3
< 2 Yr
Measured Flow
I/I Flow
Time of Peak Measured Flow
Jan 04, 2023 21:25
Time of Peak I/I Flow (TD)
Jan 04, 2023 21:25
Estimated Dry Weather Flow at TD
51.47 L/s
Peak Measured Flow
183.29 L/s
Peak I/I Flow 4
131.82 L/s
Peak I/I Rate 5
0.35 L/s/ha
Peak Measured Depth
283.00 mm
Total I/I Flow Volume during event
10,555,343.30 L
Volumetric Coefficient (Cv%) 6
10.17%
Total Measured Flow Volume during Event
19,515,475.50 L
Peak I/I Coefficient 7
0.0185
Hourly Wet-Weather Peaking Factor 8
3.95
Instantaneous Wet-Weather Peaking Factor 9
4.09
1
Time of Concentration (Tc): The estimated time for the flow to travel from the furthest point in the upstream area to the point of monitoring, assume flow is travelling at 1.00 m/s Peak Precipitation Intensity Over Tc: The peak rainfall intensity for the duration of the storm with the time interval defined by time of concentration 3 Return Period over Tc: The estimated time to elapse before a storm of equal or greater intensity will likely occur again, based on design storm criteria 4 Peak I/I Flow: The greatest difference captured between measured flow and estimated dry weather flow, Peak I/I Flow = Maximum (Measured Flow – Estimated Dry Weather Flow) 5 Peak I/I Rate: A normalized peak I/I flow based on catchment area size, Peak I/I Rate = Peak I/I Flow / Catchment Area 6 Volumetric Coefficient (Cv%): The ratio of total I/I volume and total rainfall volume, Cv% = Total I/I Flow Volume / Total Precipitation Volume * 100% 7 Peak I/ I Coefficient: The ratio of peak I/I flow and peak rainfall intensity, Peak I/ I Coefficient = Peak I/I Flow / (Peak Rainfall Intensity over Tc * Catchment Area) 8 Hourly Wet‐Weather Peaking Factor: The ratio of peak hourly wet‐weather measured flow and average dry‐weather flow, Wet‐Weather Peaking Factor = Peak Hourly Wet‐Weather Measured Flow / Average Dry-Weather Flow 9 Instantaneous Wet‐Weather Peaking Factor: The ratio of peak wet‐weather measured flow and average dry‐weather flow, Wet‐Weather Peaking Factor = Peak Wet‐Weather Measured Flow / Average Dry-Weather Flow 2
1303 Civica Infrastructure Inc. www.civi.ca
Civica Infrastructures Inc. Kawartha Lakes Flow Monitoring Report
Appendix - A June 03, 2024
Activity Log Station: 6-3 Date Time
Type
Purpose of Visit
Comment
Calibration Measurement
25-Nov-2021 02:44:00 PM
Installation Log
INSTALL
NO DOWNWARD SENSOR INSTALLED. WE SPECIFICALLY NEED THE 3D BRACKET THAT GOES INTO THE PIPE.
Yes
02-Dec-2021 01:05:00 PM
Maintenance Log
Calibration
25-Jan-2022 10:10:00 AM
Maintenance Log
Yes
CALIBRATION
Data downloaded Debris cleared Lost and could not reestablish connection to logger after live readings Ensured manual and sensor readings are satisfactory before leaving site
Yes
Yes
09-Feb-2022 03:30:00 PM
Maintenance Log
CALIBRATION
Data downloaded Debris cleared Telemetry sent Ensured manual and sensor readings are satisfactory before leaving site
17-Mar-2022 02:27:00 PM
Maintenance Log
calibration
Data downloaded site calibrated telemetry sent
Yes
CALIBRATION
Data downloaded Debris cleared Telemetry sent
Yes
Data downloaded Debris cleared Telemetry sent ANTENNA REPLACED BUT NOT DRILLED. ELECTRIC DRILL AVAILABLE ON THE VAN IS NOT WORKING
Yes
24-Mar-2022 01:13:00 PM
Maintenance Log
24-Mar-2022 01:52:00 PM
Maintenance Log
CALIBRATION
24-May-2022 12:21:00 PM
Maintenance Log
SWAPPING
Yes
24-May-2022 12:21:00 PM
Maintenance Log
SWAPPING
Yes
08-Jun-2022 09:29:00 AM
17-Jun-2022 01:29:00 PM
27-Jun-2022 02:08:00 PM
03-Aug-2022 08:48:00 AM
Maintenance Log
Maintenance Log
Maintenance Log
Maintenance Log
CALIBRATION
DATA DOWNLOADED, SITE CALIBRATED, DEBRIS CLEARED, TELEMETRY SENT
Yes
CALIBRATION
DATA DOWNLOADED, SITE CALIBRATED, DEBRIS CLEARED, TELEMETRY SENT
Yes
CALIBRATION
DATA DOWNLOADED SITE CALIBRATED DEBRIS CALIBRATED TELEMETRY SENT
Yes
CALIBRATION
DATA DOWNLOADED, SITE CALIBRATED, TELEMETRY SENT AND CHECKED, PHOTOS TAKEN
Yes
1304 Civica Infrastructure Inc. www.civi.ca
Civica Infrastructures Inc. Kawartha Lakes Flow Monitoring Report Date Time
15-Sep-2022 11:51:00 AM
22-Sep-2022 09:25:00 AM
Appendix - A June 03, 2024 Type
Maintenance Log
Maintenance Log
Purpose of Visit
Comment
Calibration Measurement
CALIBRATION
DATA DOWNLOADED, SITE CALIBRATED, TELEMETRY SENT, PHOTOS AND VIDEO TAKEN
Yes
CALIBRATION
DATA DOWNLOADED, SITE CALIBRATED, DEBRIS CLEARED, TELEMETRY SENT PHOTO AND VIDEO TAKEN
Yes
Yes
Yes
04-Nov-2022 10:26:00 AM
Maintenance Log
CALIBRATION
DATA DOWNLOADED TELEMETRY SENT PHOTOS TAKEN SITE CALIBRATED NO DOWNWARD DEPTH SENSOR FOUND
11-Jan-2023 02:40:00 PM
Removal Log
REMOVAL
DATA DOWNLOADED, TELEMETRY SENT, PHOTOS TAKEN, MEASUREMENTS NOT TAKEN AS THE FLOW BEING TOO FAST, LOGGER REMOVED
1305 Civica Infrastructure Inc. www.civi.ca
Civica Infrastructures Inc. Kawartha Lakes Flow Monitoring Report
Appendix - A June 03, 2024
Aggregate Data Station: 6-4
Level Date From
Date To
Days
Min (m)
Avg (m)
Max (m)
Count
Time of Min1
Time of Max1
Nov 19, 2021
Nov 04, 2022
351
0.05
0.09
0.22
100,871
Thu May 26, 2022 00:50
Mon Aug 29, 2022 15:00
Velocity Date From
Date To
Days
Min (m/s)
Avg (m/s)
Max (m/s)
Count
Time of Min1
Time of Max1
Nov 19, 2021
Nov 04, 2022
351
0.00
0.21
0.61
100,871
Fri Nov 19, 2021 17:05
Tue Jul 12, 2022 03:05
Flow Date From
Date To
Days
Min (L/s)
Avg (L/s)
Max (L/s)
Total Volume (1,000,000 L)
Count
Time of Min1
Time of Max1
Nov 19, 2021
Nov 04, 2022
351
0.00
5.24
45.33
158.43
100,871
Fri Nov 19, 2021 17:05
Tue Jul 12, 2022 03:05
Precipitation
1
Date From
Date To
Days
Min (mm)
Avg (mm)
Max (mm)
Sum (mm)
Count
Time of Min1
Time of Max1
Nov 19, 2021
Nov 04, 2022
341
0.00
0.01
9.75
667.95
97,548
Fri Nov 19, 2021 08:30
Mon Jul 25, 2022 00:00
Time of Min and Time of Max will be displayed by first occurrence
1306 Civica Infrastructure Inc. www.civi.ca
Civica Infrastructures Inc. Kawartha Lakes Flow Monitoring Report
Appendix - A June 03, 2024
Sanitary Report Station: 6-4
1
Average Dry Weather Flow (L/s)
Average Dry Weather Flow (L/c/d)
Average Daily Minimum Dry Weather Flow (L/s)
Average Daily Peak Dry Weather Flow (L/s)
4.841
69.703
1.941
7.893
Peaking Factor
Groundwater Infiltration (L/s)1
Groundwater Infiltration (L/ha/d)
% of GWI in Average DWF
1.630
1.650
415.689
34.077
Groundwater infiltration (GWI) is assumed as 85% of the daily minimum flow averaged over the monitoring period
1307 Civica Infrastructure Inc. www.civi.ca
Civica Infrastructures Inc. Kawartha Lakes Flow Monitoring Report
Appendix - A June 03, 2024
Data Chart Station: 6-4 Nov 19, 2021 – Nov 30, 2021
1308 Civica Infrastructure Inc. www.civi.ca
Civica Infrastructures Inc. Kawartha Lakes Flow Monitoring Report
Appendix - A June 03, 2024
Data Chart Station: 6-4 Dec 01, 2021 – Dec 31, 2021
1309 Civica Infrastructure Inc. www.civi.ca
Civica Infrastructures Inc. Kawartha Lakes Flow Monitoring Report
Appendix - A June 03, 2024
Data Chart Station: 6-4 Jan 01, 2022 – Jan 31, 2022
1310 Civica Infrastructure Inc. www.civi.ca
Civica Infrastructures Inc. Kawartha Lakes Flow Monitoring Report
Appendix - A June 03, 2024
Data Chart Station: 6-4 Feb 01, 2022 – Feb 28, 2022
1311 Civica Infrastructure Inc. www.civi.ca
Civica Infrastructures Inc. Kawartha Lakes Flow Monitoring Report
Appendix - A June 03, 2024
Data Chart Station: 6-4 Mar 01, 2022 – Mar 31, 2022
1312 Civica Infrastructure Inc. www.civi.ca
Civica Infrastructures Inc. Kawartha Lakes Flow Monitoring Report
Appendix - A June 03, 2024
Data Chart Station: 6-4 Apr 01, 2022 – Apr 30, 2022
1313 Civica Infrastructure Inc. www.civi.ca
Civica Infrastructures Inc. Kawartha Lakes Flow Monitoring Report
Appendix - A June 03, 2024
Data Chart Station: 6-4 May 01, 2022 – May 31, 2022
1314 Civica Infrastructure Inc. www.civi.ca
Civica Infrastructures Inc. Kawartha Lakes Flow Monitoring Report
Appendix - A June 03, 2024
Data Chart Station: 6-4 Jun 01, 2022 – Jun 30, 2022
1315 Civica Infrastructure Inc. www.civi.ca
Civica Infrastructures Inc. Kawartha Lakes Flow Monitoring Report
Appendix - A June 03, 2024
Data Chart Station: 6-4 Jul 01, 2022 – Jul 31, 2022
1316 Civica Infrastructure Inc. www.civi.ca
Civica Infrastructures Inc. Kawartha Lakes Flow Monitoring Report
Appendix - A June 03, 2024
Data Chart Station: 6-4 Aug 01, 2022 – Aug 31, 2022
1317 Civica Infrastructure Inc. www.civi.ca
Civica Infrastructures Inc. Kawartha Lakes Flow Monitoring Report
Appendix - A June 03, 2024
Data Chart Station: 6-4 Sep 01, 2022 – Sep 30, 2022
1318 Civica Infrastructure Inc. www.civi.ca
Civica Infrastructures Inc. Kawartha Lakes Flow Monitoring Report
Appendix - A June 03, 2024
Data Chart Station: 6-4 Oct 01, 2022 – Oct 31, 2022
1319 Civica Infrastructure Inc. www.civi.ca
Civica Infrastructures Inc. Kawartha Lakes Flow Monitoring Report
Appendix - A June 03, 2024
Data Chart Station: 6-4 Nov 01, 2022 – Nov 04, 2022
1320 Civica Infrastructure Inc. www.civi.ca
Civica Infrastructures Inc. Kawartha Lakes Flow Monitoring Report
Appendix - A June 03, 2024
I/I Analysis Table
1
Event1
Total Precipitation (mm)
Duration (hours)
Peak Intensity Over Tc at Station (mm/hr)
Feb 16, 2022
18.00
12.67
Apr 13, 2022
17.25
May 26, 2022
6-4 Measured Peak Flow (L/s)
Peak I/I Flow (L/s)
Peak I/I Rate (L/s/ha)
Volumetric Runoff Coefficient (CV%)
Peaking Factor (PF)
3.00
31.08
24.35
0.07
1.70 %
3.83
28.67
7.50
12.81
7.44
0.02
0.37 %
1.51
20.25
27.50
9.80
19.43
15.77
0.05
0.19 %
5.08
Jun 06, 2022
30.00
32.42
7.90
16.84
12.60
0.04
0.20 %
3.47
Jun 11, 2022
41.50
25.08
22.50
37.25
32.50
0.10
0.41 %
8.56
Jul 12, 2022
15.50
7.75
17.60
45.33
41.36
0.12
0.08 %
7.83
Jul 18, 2022
21.50
43.25
1.10
24.23
16.98
0.05
1.03 %
2.92
Aug 17, 2022
17.50
1.83
22.10
41.63
35.89
0.11
0.18 %
9.53
Aug 21, 2022
17.50
30.50
9.00
25.54
22.44
0.07
0.39 %
5.38
Aug 25, 2022
16.25
8.58
20.20
26.54
21.49
0.06
0.23 %
5.63
Aug 29, 2022
29.00
2.50
31.50
43.62
39.02
0.11
0.18 %
11.06
Sep 12, 2022
21.75
25.08
7.90
11.94
7.19
0.02
0.07 %
2.63
Sep 18, 2022
24.50
5.58
16.10
27.73
23.99
0.07
0.32 %
8.08
Oct 12, 2022
20.75
15.25
6.40
16.38
13.70
0.04
0.16 %
3.49
Average
22.23
19.05
13.04
27.17
22.48
0.07
0.39 %
5.64
Maximum
41.50
43.25
31.50
45.33
41.36
0.12
1.70 %
11.06
Flow KPIs
Measured Storms
Station: 6-4
An event is a storm with a minimum volume of 15mm and a minimum inter-event dry period of 12 hours
1321 Civica Infrastructure Inc. www.civi.ca
Civica Infrastructures Inc. Kawartha Lakes Flow Monitoring Report
Appendix - A June 03, 2024
I/I Analysis Graph Station: 6-4
1322 Civica Infrastructure Inc. www.civi.ca
Civica Infrastructures Inc. Kawartha Lakes Flow Monitoring Report
Appendix - A June 03, 2024
Infiltration/Inflow Event Analysis Station: 6-4 Feb 16, 2022 11:00 – Feb 17, 2022 23:40, Total Precipitation: 18.00 mm (61,722,000.00 L) Station Details
Storm Details
Catchment Area
342.90 ha
Total Precipitation
18.00 mm (61,722,000.00 L)
Duration of Storm
12.67 hr
Time of Concentration (Tc) 1
40 min
Peak Precipitation Intensity Over Tc 2
3.00 mm/hr
Return Period over Tc 3
< 2 Yr
Measured Flow
I/I Flow
Time of Peak Measured Flow
Feb 17, 2022 11:15
Time of Peak I/I Flow (TD)
Feb 17, 2022 06:50
Estimated Dry Weather Flow at TD
4.75 L/s
Peak Measured Flow
31.08 L/s
Peak I/I Flow 4
24.35 L/s
Peak I/I Rate 5
0.07 L/s/ha
Peak Measured Depth
173.00 mm
Total I/I Flow Volume during event
1,049,533.20 L
Volumetric Coefficient (Cv%) 6
1.70%
Total Measured Flow Volume during Event
1,615,609.20 L
Peak I/I Coefficient 7
0.0085
Hourly Wet-Weather Peaking Factor 8
4.36
Instantaneous Wet-Weather Peaking Factor 9
4.89
1
Time of Concentration (Tc): The estimated time for the flow to travel from the furthest point in the upstream area to the point of monitoring, assume flow is travelling at 1.00 m/s Peak Precipitation Intensity Over Tc: The peak rainfall intensity for the duration of the storm with the time interval defined by time of concentration 3 Return Period over Tc: The estimated time to elapse before a storm of equal or greater intensity will likely occur again, based on design storm criteria 4 Peak I/I Flow: The greatest difference captured between measured flow and estimated dry weather flow, Peak I/I Flow = Maximum (Measured Flow – Estimated Dry Weather Flow) 5 Peak I/I Rate: A normalized peak I/I flow based on catchment area size, Peak I/I Rate = Peak I/I Flow / Catchment Area 6 Volumetric Coefficient (Cv%): The ratio of total I/I volume and total rainfall volume, Cv% = Total I/I Flow Volume / Total Precipitation Volume * 100% 7 Peak I/ I Coefficient: The ratio of peak I/I flow and peak rainfall intensity, Peak I/ I Coefficient = Peak I/I Flow / (Peak Rainfall Intensity over Tc * Catchment Area) 8 Hourly Wet‐Weather Peaking Factor: The ratio of peak hourly wet‐weather measured flow and average dry‐weather flow, Wet‐Weather Peaking Factor = Peak Hourly Wet‐Weather Measured Flow / Average Dry-Weather Flow 9 Instantaneous Wet‐Weather Peaking Factor: The ratio of peak wet‐weather measured flow and average dry‐weather flow, Wet‐Weather Peaking Factor = Peak Wet‐Weather Measured Flow / Average Dry-Weather Flow 2
1323 Civica Infrastructure Inc. www.civi.ca
Civica Infrastructures Inc. Kawartha Lakes Flow Monitoring Report
Appendix - A June 03, 2024
I/I Analysis Graph Station: 6-4
1324 Civica Infrastructure Inc. www.civi.ca
Civica Infrastructures Inc. Kawartha Lakes Flow Monitoring Report
Appendix - A June 03, 2024
Infiltration/Inflow Event Analysis Station: 6-4 Apr 12, 2022 17:25 – Apr 14, 2022 22:05, Total Precipitation: 17.25 mm (59,150,250.00 L) Station Details
Storm Details
Catchment Area
342.90 ha
Total Precipitation
17.25 mm (59,150,250.00 L)
Duration of Storm
28.67 hr
Time of Concentration (Tc) 1
40 min
Peak Precipitation Intensity Over Tc 2
7.50 mm/hr
Return Period over Tc 3
< 2 Yr
Measured Flow
I/I Flow
Time of Peak Measured Flow
Apr 13, 2022 19:45
Time of Peak I/I Flow (TD)
Apr 13, 2022 19:45
Estimated Dry Weather Flow at TD
5.37 L/s
Peak Measured Flow
12.81 L/s
Peak I/I Flow 4
7.44 L/s
Peak I/I Rate 5
0.02 L/s/ha
Peak Measured Depth
113.00 mm
Total I/I Flow Volume during event
216,103.00 L
Volumetric Coefficient (Cv%) 6
0.37%
Total Measured Flow Volume during Event
938,335.20 L
Peak I/I Coefficient 7
0.0010
Hourly Wet-Weather Peaking Factor 8
1.84
Instantaneous Wet-Weather Peaking Factor 9
2.60
1
Time of Concentration (Tc): The estimated time for the flow to travel from the furthest point in the upstream area to the point of monitoring, assume flow is travelling at 1.00 m/s Peak Precipitation Intensity Over Tc: The peak rainfall intensity for the duration of the storm with the time interval defined by time of concentration 3 Return Period over Tc: The estimated time to elapse before a storm of equal or greater intensity will likely occur again, based on design storm criteria 4 Peak I/I Flow: The greatest difference captured between measured flow and estimated dry weather flow, Peak I/I Flow = Maximum (Measured Flow – Estimated Dry Weather Flow) 5 Peak I/I Rate: A normalized peak I/I flow based on catchment area size, Peak I/I Rate = Peak I/I Flow / Catchment Area 6 Volumetric Coefficient (Cv%): The ratio of total I/I volume and total rainfall volume, Cv% = Total I/I Flow Volume / Total Precipitation Volume * 100% 7 Peak I/ I Coefficient: The ratio of peak I/I flow and peak rainfall intensity, Peak I/ I Coefficient = Peak I/I Flow / (Peak Rainfall Intensity over Tc * Catchment Area) 8 Hourly Wet‐Weather Peaking Factor: The ratio of peak hourly wet‐weather measured flow and average dry‐weather flow, Wet‐Weather Peaking Factor = Peak Hourly Wet‐Weather Measured Flow / Average Dry-Weather Flow 9 Instantaneous Wet‐Weather Peaking Factor: The ratio of peak wet‐weather measured flow and average dry‐weather flow, Wet‐Weather Peaking Factor = Peak Wet‐Weather Measured Flow / Average Dry-Weather Flow 2
1325 Civica Infrastructure Inc. www.civi.ca
Civica Infrastructures Inc. Kawartha Lakes Flow Monitoring Report
Appendix - A June 03, 2024
I/I Analysis Graph Station: 6-4
1326 Civica Infrastructure Inc. www.civi.ca
Civica Infrastructures Inc. Kawartha Lakes Flow Monitoring Report
Appendix - A June 03, 2024
Infiltration/Inflow Event Analysis Station: 6-4 May 26, 2022 07:30 – May 28, 2022 11:00, Total Precipitation: 20.25 mm (69,437,250.00 L) Station Details
Storm Details
Catchment Area
342.90 ha
Total Precipitation
20.25 mm (69,437,250.00 L)
Duration of Storm
27.50 hr
Time of Concentration (Tc) 1
40 min
Peak Precipitation Intensity Over Tc 2
9.80 mm/hr
Return Period over Tc 3
< 2 Yr
Measured Flow
I/I Flow
Time of Peak Measured Flow
May 27, 2022 16:35
Time of Peak I/I Flow (TD)
May 27, 2022 16:35
Estimated Dry Weather Flow at TD
3.66 L/s
Peak Measured Flow
19.43 L/s
Peak I/I Flow 4
15.77 L/s
Peak I/I Rate 5
0.05 L/s/ha
Peak Measured Depth
137.00 mm
Total I/I Flow Volume during event
131,762.30 L
Volumetric Coefficient (Cv%) 6
0.19%
Total Measured Flow Volume during Event
574,189.40 L
Peak I/I Coefficient 7
0.0017
Hourly Wet-Weather Peaking Factor 8
3.20
Instantaneous Wet-Weather Peaking Factor 9
6.26
1
Time of Concentration (Tc): The estimated time for the flow to travel from the furthest point in the upstream area to the point of monitoring, assume flow is travelling at 1.00 m/s Peak Precipitation Intensity Over Tc: The peak rainfall intensity for the duration of the storm with the time interval defined by time of concentration 3 Return Period over Tc: The estimated time to elapse before a storm of equal or greater intensity will likely occur again, based on design storm criteria 4 Peak I/I Flow: The greatest difference captured between measured flow and estimated dry weather flow, Peak I/I Flow = Maximum (Measured Flow – Estimated Dry Weather Flow) 5 Peak I/I Rate: A normalized peak I/I flow based on catchment area size, Peak I/I Rate = Peak I/I Flow / Catchment Area 6 Volumetric Coefficient (Cv%): The ratio of total I/I volume and total rainfall volume, Cv% = Total I/I Flow Volume / Total Precipitation Volume * 100% 7 Peak I/ I Coefficient: The ratio of peak I/I flow and peak rainfall intensity, Peak I/ I Coefficient = Peak I/I Flow / (Peak Rainfall Intensity over Tc * Catchment Area) 8 Hourly Wet‐Weather Peaking Factor: The ratio of peak hourly wet‐weather measured flow and average dry‐weather flow, Wet‐Weather Peaking Factor = Peak Hourly Wet‐Weather Measured Flow / Average Dry-Weather Flow 9 Instantaneous Wet‐Weather Peaking Factor: The ratio of peak wet‐weather measured flow and average dry‐weather flow, Wet‐Weather Peaking Factor = Peak Wet‐Weather Measured Flow / Average Dry-Weather Flow 2
1327 Civica Infrastructure Inc. www.civi.ca
Civica Infrastructures Inc. Kawartha Lakes Flow Monitoring Report
Appendix - A June 03, 2024
I/I Analysis Graph Station: 6-4
1328 Civica Infrastructure Inc. www.civi.ca
Civica Infrastructures Inc. Kawartha Lakes Flow Monitoring Report
Appendix - A June 03, 2024
Infiltration/Inflow Event Analysis Station: 6-4 Jun 05, 2022 18:20 – Jun 08, 2022 02:45, Total Precipitation: 30.00 mm (102,870,000.00 L) Station Details
Storm Details
Catchment Area
342.90 ha
Total Precipitation
30.00 mm (102,870,000.00 L)
Duration of Storm
32.42 hr
Time of Concentration (Tc) 1
40 min
Peak Precipitation Intensity Over Tc 2
7.90 mm/hr
Return Period over Tc 3
< 2 Yr
Measured Flow
I/I Flow
Time of Peak Measured Flow
Jun 06, 2022 20:05
Time of Peak I/I Flow (TD)
Jun 06, 2022 20:10
Estimated Dry Weather Flow at TD
4.24 L/s
Peak Measured Flow
16.84 L/s
Peak I/I Flow 4
12.60 L/s
Peak I/I Rate 5
0.04 L/s/ha
Peak Measured Depth
123.00 mm
Total I/I Flow Volume during event
208,278.20 L
Volumetric Coefficient (Cv%) 6
0.20%
Total Measured Flow Volume during Event
790,177.70 L
Peak I/I Coefficient 7
0.0017
Hourly Wet-Weather Peaking Factor 8
3.57
Instantaneous Wet-Weather Peaking Factor 9
4.64
1
Time of Concentration (Tc): The estimated time for the flow to travel from the furthest point in the upstream area to the point of monitoring, assume flow is travelling at 1.00 m/s Peak Precipitation Intensity Over Tc: The peak rainfall intensity for the duration of the storm with the time interval defined by time of concentration 3 Return Period over Tc: The estimated time to elapse before a storm of equal or greater intensity will likely occur again, based on design storm criteria 4 Peak I/I Flow: The greatest difference captured between measured flow and estimated dry weather flow, Peak I/I Flow = Maximum (Measured Flow – Estimated Dry Weather Flow) 5 Peak I/I Rate: A normalized peak I/I flow based on catchment area size, Peak I/I Rate = Peak I/I Flow / Catchment Area 6 Volumetric Coefficient (Cv%): The ratio of total I/I volume and total rainfall volume, Cv% = Total I/I Flow Volume / Total Precipitation Volume * 100% 7 Peak I/ I Coefficient: The ratio of peak I/I flow and peak rainfall intensity, Peak I/ I Coefficient = Peak I/I Flow / (Peak Rainfall Intensity over Tc * Catchment Area) 8 Hourly Wet‐Weather Peaking Factor: The ratio of peak hourly wet‐weather measured flow and average dry‐weather flow, Wet‐Weather Peaking Factor = Peak Hourly Wet‐Weather Measured Flow / Average Dry-Weather Flow 9 Instantaneous Wet‐Weather Peaking Factor: The ratio of peak wet‐weather measured flow and average dry‐weather flow, Wet‐Weather Peaking Factor = Peak Wet‐Weather Measured Flow / Average Dry-Weather Flow 2
1329 Civica Infrastructure Inc. www.civi.ca
Civica Infrastructures Inc. Kawartha Lakes Flow Monitoring Report
Appendix - A June 03, 2024
I/I Analysis Graph Station: 6-4
1330 Civica Infrastructure Inc. www.civi.ca
Civica Infrastructures Inc. Kawartha Lakes Flow Monitoring Report
Appendix - A June 03, 2024
Infiltration/Inflow Event Analysis Station: 6-4 Jun 11, 2022 01:55 – Jun 13, 2022 03:00, Total Precipitation: 41.50 mm (142,303,500.00 L) Station Details
Storm Details
Catchment Area
342.90 ha
Total Precipitation
41.50 mm (142,303,500.00 L)
Duration of Storm
25.08 hr
Time of Concentration (Tc) 1
40 min
Peak Precipitation Intensity Over Tc 2
22.50 mm/hr
Return Period over Tc 3
< 2 Yr
Measured Flow
I/I Flow
Time of Peak Measured Flow
Jun 12, 2022 08:35
Time of Peak I/I Flow (TD)
Jun 12, 2022 08:35
Estimated Dry Weather Flow at TD
4.75 L/s
Peak Measured Flow
37.25 L/s
Peak I/I Flow 4
32.50 L/s
Peak I/I Rate 5
0.10 L/s/ha
Peak Measured Depth
184.00 mm
Total I/I Flow Volume during event
575,932.90 L
Volumetric Coefficient (Cv%) 6
0.41%
Total Measured Flow Volume during Event
1,083,671.80 L
Peak I/I Coefficient 7
0.0015
Hourly Wet-Weather Peaking Factor 8
6.70
Instantaneous Wet-Weather Peaking Factor 9
9.82
1
Time of Concentration (Tc): The estimated time for the flow to travel from the furthest point in the upstream area to the point of monitoring, assume flow is travelling at 1.00 m/s Peak Precipitation Intensity Over Tc: The peak rainfall intensity for the duration of the storm with the time interval defined by time of concentration 3 Return Period over Tc: The estimated time to elapse before a storm of equal or greater intensity will likely occur again, based on design storm criteria 4 Peak I/I Flow: The greatest difference captured between measured flow and estimated dry weather flow, Peak I/I Flow = Maximum (Measured Flow – Estimated Dry Weather Flow) 5 Peak I/I Rate: A normalized peak I/I flow based on catchment area size, Peak I/I Rate = Peak I/I Flow / Catchment Area 6 Volumetric Coefficient (Cv%): The ratio of total I/I volume and total rainfall volume, Cv% = Total I/I Flow Volume / Total Precipitation Volume * 100% 7 Peak I/ I Coefficient: The ratio of peak I/I flow and peak rainfall intensity, Peak I/ I Coefficient = Peak I/I Flow / (Peak Rainfall Intensity over Tc * Catchment Area) 8 Hourly Wet‐Weather Peaking Factor: The ratio of peak hourly wet‐weather measured flow and average dry‐weather flow, Wet‐Weather Peaking Factor = Peak Hourly Wet‐Weather Measured Flow / Average Dry-Weather Flow 9 Instantaneous Wet‐Weather Peaking Factor: The ratio of peak wet‐weather measured flow and average dry‐weather flow, Wet‐Weather Peaking Factor = Peak Wet‐Weather Measured Flow / Average Dry-Weather Flow 2
1331 Civica Infrastructure Inc. www.civi.ca
Civica Infrastructures Inc. Kawartha Lakes Flow Monitoring Report
Appendix - A June 03, 2024
I/I Analysis Graph Station: 6-4
1332 Civica Infrastructure Inc. www.civi.ca
Civica Infrastructures Inc. Kawartha Lakes Flow Monitoring Report
Appendix - A June 03, 2024
Infiltration/Inflow Event Analysis Station: 6-4 Jul 11, 2022 14:25 – Jul 12, 2022 22:10, Total Precipitation: 15.50 mm (53,149,500.00 L) Station Details
Storm Details
Catchment Area
342.90 ha
Total Precipitation
15.50 mm (53,149,500.00 L)
Duration of Storm
7.75 hr
Time of Concentration (Tc) 1
40 min
Peak Precipitation Intensity Over Tc 2
17.60 mm/hr
Return Period over Tc 3
< 2 Yr
Measured Flow
I/I Flow
Time of Peak Measured Flow
Jul 12, 2022 03:05
Time of Peak I/I Flow (TD)
Jul 12, 2022 03:05
Estimated Dry Weather Flow at TD
3.97 L/s
Peak Measured Flow
45.33 L/s
Peak I/I Flow 4
41.36 L/s
Peak I/I Rate 5
0.12 L/s/ha
Peak Measured Depth
202.00 mm
Total I/I Flow Volume during event
41,644.30 L
Volumetric Coefficient (Cv%) 6
0.08%
Total Measured Flow Volume during Event
418,675.50 L
Peak I/I Coefficient 7
0.0025
Hourly Wet-Weather Peaking Factor 8
2.57
Instantaneous Wet-Weather Peaking Factor 9
8.58
1
Time of Concentration (Tc): The estimated time for the flow to travel from the furthest point in the upstream area to the point of monitoring, assume flow is travelling at 1.00 m/s Peak Precipitation Intensity Over Tc: The peak rainfall intensity for the duration of the storm with the time interval defined by time of concentration 3 Return Period over Tc: The estimated time to elapse before a storm of equal or greater intensity will likely occur again, based on design storm criteria 4 Peak I/I Flow: The greatest difference captured between measured flow and estimated dry weather flow, Peak I/I Flow = Maximum (Measured Flow – Estimated Dry Weather Flow) 5 Peak I/I Rate: A normalized peak I/I flow based on catchment area size, Peak I/I Rate = Peak I/I Flow / Catchment Area 6 Volumetric Coefficient (Cv%): The ratio of total I/I volume and total rainfall volume, Cv% = Total I/I Flow Volume / Total Precipitation Volume * 100% 7 Peak I/ I Coefficient: The ratio of peak I/I flow and peak rainfall intensity, Peak I/ I Coefficient = Peak I/I Flow / (Peak Rainfall Intensity over Tc * Catchment Area) 8 Hourly Wet‐Weather Peaking Factor: The ratio of peak hourly wet‐weather measured flow and average dry‐weather flow, Wet‐Weather Peaking Factor = Peak Hourly Wet‐Weather Measured Flow / Average Dry-Weather Flow 9 Instantaneous Wet‐Weather Peaking Factor: The ratio of peak wet‐weather measured flow and average dry‐weather flow, Wet‐Weather Peaking Factor = Peak Wet‐Weather Measured Flow / Average Dry-Weather Flow 2
1333 Civica Infrastructure Inc. www.civi.ca
Civica Infrastructures Inc. Kawartha Lakes Flow Monitoring Report
Appendix - A June 03, 2024
I/I Analysis Graph Station: 6-4
1334 Civica Infrastructure Inc. www.civi.ca
Civica Infrastructures Inc. Kawartha Lakes Flow Monitoring Report
Appendix - A June 03, 2024
Infiltration/Inflow Event Analysis Station: 6-4 Jul 17, 2022 16:10 – Jul 20, 2022 11:25, Total Precipitation: 21.50 mm (73,723,500.00 L) Station Details
Storm Details
Catchment Area
342.90 ha
Total Precipitation
21.50 mm (73,723,500.00 L)
Duration of Storm
43.25 hr
Time of Concentration (Tc) 1
40 min
Peak Precipitation Intensity Over Tc 2
1.10 mm/hr
Return Period over Tc 3
< 2 Yr
Measured Flow
I/I Flow
Time of Peak Measured Flow
Jul 18, 2022 11:30
Time of Peak I/I Flow (TD)
Jul 18, 2022 11:30
Estimated Dry Weather Flow at TD
7.24 L/s
Peak Measured Flow
24.23 L/s
Peak I/I Flow 4
16.98 L/s
Peak I/I Rate 5
0.05 L/s/ha
Peak Measured Depth
159.00 mm
Total I/I Flow Volume during event
757,136.40 L
Volumetric Coefficient (Cv%) 6
1.03%
Total Measured Flow Volume during Event
1,915,661.50 L
Peak I/I Coefficient 7
0.0159
Hourly Wet-Weather Peaking Factor 8
3.65
Instantaneous Wet-Weather Peaking Factor 9
4.17
1
Time of Concentration (Tc): The estimated time for the flow to travel from the furthest point in the upstream area to the point of monitoring, assume flow is travelling at 1.00 m/s Peak Precipitation Intensity Over Tc: The peak rainfall intensity for the duration of the storm with the time interval defined by time of concentration 3 Return Period over Tc: The estimated time to elapse before a storm of equal or greater intensity will likely occur again, based on design storm criteria 4 Peak I/I Flow: The greatest difference captured between measured flow and estimated dry weather flow, Peak I/I Flow = Maximum (Measured Flow – Estimated Dry Weather Flow) 5 Peak I/I Rate: A normalized peak I/I flow based on catchment area size, Peak I/I Rate = Peak I/I Flow / Catchment Area 6 Volumetric Coefficient (Cv%): The ratio of total I/I volume and total rainfall volume, Cv% = Total I/I Flow Volume / Total Precipitation Volume * 100% 7 Peak I/ I Coefficient: The ratio of peak I/I flow and peak rainfall intensity, Peak I/ I Coefficient = Peak I/I Flow / (Peak Rainfall Intensity over Tc * Catchment Area) 8 Hourly Wet‐Weather Peaking Factor: The ratio of peak hourly wet‐weather measured flow and average dry‐weather flow, Wet‐Weather Peaking Factor = Peak Hourly Wet‐Weather Measured Flow / Average Dry-Weather Flow 9 Instantaneous Wet‐Weather Peaking Factor: The ratio of peak wet‐weather measured flow and average dry‐weather flow, Wet‐Weather Peaking Factor = Peak Wet‐Weather Measured Flow / Average Dry-Weather Flow 2
1335 Civica Infrastructure Inc. www.civi.ca
Civica Infrastructures Inc. Kawartha Lakes Flow Monitoring Report
Appendix - A June 03, 2024
I/I Analysis Graph Station: 6-4
1336 Civica Infrastructure Inc. www.civi.ca
Civica Infrastructures Inc. Kawartha Lakes Flow Monitoring Report
Appendix - A June 03, 2024
Infiltration/Inflow Event Analysis Station: 6-4 Aug 17, 2022 03:20 – Aug 18, 2022 05:10, Total Precipitation: 17.50 mm (60,007,500.00 L) Station Details
Storm Details
Catchment Area
342.90 ha
Total Precipitation
17.50 mm (60,007,500.00 L)
Duration of Storm
1.83 hr
Time of Concentration (Tc) 1
40 min
Peak Precipitation Intensity Over Tc 2
22.10 mm/hr
Return Period over Tc 3
< 2 Yr
Measured Flow
I/I Flow
Time of Peak Measured Flow
Aug 17, 2022 15:35
Time of Peak I/I Flow (TD)
Aug 17, 2022 15:35
Estimated Dry Weather Flow at TD
5.74 L/s
Peak Measured Flow
41.63 L/s
Peak I/I Flow 4
35.89 L/s
Peak I/I Rate 5
0.11 L/s/ha
Peak Measured Depth
203.00 mm
Total I/I Flow Volume during event
106,052.90 L
Volumetric Coefficient (Cv%) 6
0.18%
Total Measured Flow Volume during Event
294,717.60 L
Peak I/I Coefficient 7
0.0017
Hourly Wet-Weather Peaking Factor 8
5.61
Instantaneous Wet-Weather Peaking Factor 9
11.05
1
Time of Concentration (Tc): The estimated time for the flow to travel from the furthest point in the upstream area to the point of monitoring, assume flow is travelling at 1.00 m/s Peak Precipitation Intensity Over Tc: The peak rainfall intensity for the duration of the storm with the time interval defined by time of concentration 3 Return Period over Tc: The estimated time to elapse before a storm of equal or greater intensity will likely occur again, based on design storm criteria 4 Peak I/I Flow: The greatest difference captured between measured flow and estimated dry weather flow, Peak I/I Flow = Maximum (Measured Flow – Estimated Dry Weather Flow) 5 Peak I/I Rate: A normalized peak I/I flow based on catchment area size, Peak I/I Rate = Peak I/I Flow / Catchment Area 6 Volumetric Coefficient (Cv%): The ratio of total I/I volume and total rainfall volume, Cv% = Total I/I Flow Volume / Total Precipitation Volume * 100% 7 Peak I/ I Coefficient: The ratio of peak I/I flow and peak rainfall intensity, Peak I/ I Coefficient = Peak I/I Flow / (Peak Rainfall Intensity over Tc * Catchment Area) 8 Hourly Wet‐Weather Peaking Factor: The ratio of peak hourly wet‐weather measured flow and average dry‐weather flow, Wet‐Weather Peaking Factor = Peak Hourly Wet‐Weather Measured Flow / Average Dry-Weather Flow 9 Instantaneous Wet‐Weather Peaking Factor: The ratio of peak wet‐weather measured flow and average dry‐weather flow, Wet‐Weather Peaking Factor = Peak Wet‐Weather Measured Flow / Average Dry-Weather Flow 2
1337 Civica Infrastructure Inc. www.civi.ca
Civica Infrastructures Inc. Kawartha Lakes Flow Monitoring Report
Appendix - A June 03, 2024
I/I Analysis Graph Station: 6-4
1338 Civica Infrastructure Inc. www.civi.ca
Civica Infrastructures Inc. Kawartha Lakes Flow Monitoring Report
Appendix - A June 03, 2024
Infiltration/Inflow Event Analysis Station: 6-4 Aug 21, 2022 09:50 – Aug 23, 2022 16:20, Total Precipitation: 17.50 mm (60,007,500.00 L) Station Details
Storm Details
Catchment Area
342.90 ha
Total Precipitation
17.50 mm (60,007,500.00 L)
Duration of Storm
30.50 hr
Time of Concentration (Tc) 1
40 min
Peak Precipitation Intensity Over Tc 2
9.00 mm/hr
Return Period over Tc 3
< 2 Yr
Measured Flow
I/I Flow
Time of Peak Measured Flow
Aug 21, 2022 23:25
Time of Peak I/I Flow (TD)
Aug 21, 2022 23:25
Estimated Dry Weather Flow at TD
3.10 L/s
Peak Measured Flow
25.54 L/s
Peak I/I Flow 4
22.44 L/s
Peak I/I Rate 5
0.07 L/s/ha
Peak Measured Depth
161.00 mm
Total I/I Flow Volume during event
230,974.70 L
Volumetric Coefficient (Cv%) 6
0.39%
Total Measured Flow Volume during Event
870,191.00 L
Peak I/I Coefficient 7
0.0026
Hourly Wet-Weather Peaking Factor 8
2.91
Instantaneous Wet-Weather Peaking Factor 9
6.12
1
Time of Concentration (Tc): The estimated time for the flow to travel from the furthest point in the upstream area to the point of monitoring, assume flow is travelling at 1.00 m/s Peak Precipitation Intensity Over Tc: The peak rainfall intensity for the duration of the storm with the time interval defined by time of concentration 3 Return Period over Tc: The estimated time to elapse before a storm of equal or greater intensity will likely occur again, based on design storm criteria 4 Peak I/I Flow: The greatest difference captured between measured flow and estimated dry weather flow, Peak I/I Flow = Maximum (Measured Flow – Estimated Dry Weather Flow) 5 Peak I/I Rate: A normalized peak I/I flow based on catchment area size, Peak I/I Rate = Peak I/I Flow / Catchment Area 6 Volumetric Coefficient (Cv%): The ratio of total I/I volume and total rainfall volume, Cv% = Total I/I Flow Volume / Total Precipitation Volume * 100% 7 Peak I/ I Coefficient: The ratio of peak I/I flow and peak rainfall intensity, Peak I/ I Coefficient = Peak I/I Flow / (Peak Rainfall Intensity over Tc * Catchment Area) 8 Hourly Wet‐Weather Peaking Factor: The ratio of peak hourly wet‐weather measured flow and average dry‐weather flow, Wet‐Weather Peaking Factor = Peak Hourly Wet‐Weather Measured Flow / Average Dry-Weather Flow 9 Instantaneous Wet‐Weather Peaking Factor: The ratio of peak wet‐weather measured flow and average dry‐weather flow, Wet‐Weather Peaking Factor = Peak Wet‐Weather Measured Flow / Average Dry-Weather Flow 2
1339 Civica Infrastructure Inc. www.civi.ca
Civica Infrastructures Inc. Kawartha Lakes Flow Monitoring Report
Appendix - A June 03, 2024
I/I Analysis Graph Station: 6-4
1340 Civica Infrastructure Inc. www.civi.ca
Civica Infrastructures Inc. Kawartha Lakes Flow Monitoring Report
Appendix - A June 03, 2024
Infiltration/Inflow Event Analysis Station: 6-4 Aug 25, 2022 01:30 – Aug 26, 2022 10:05, Total Precipitation: 16.25 mm (55,721,250.00 L) Station Details
Storm Details
Catchment Area
342.90 ha
Total Precipitation
16.25 mm (55,721,250.00 L)
Duration of Storm
8.58 hr
Time of Concentration (Tc) 1
40 min
Peak Precipitation Intensity Over Tc 2
20.20 mm/hr
Return Period over Tc 3
< 2 Yr
Measured Flow
I/I Flow
Time of Peak Measured Flow
Aug 25, 2022 18:40
Time of Peak I/I Flow (TD)
Aug 25, 2022 18:40
Estimated Dry Weather Flow at TD
5.04 L/s
Peak Measured Flow
26.54 L/s
Peak I/I Flow 4
21.49 L/s
Peak I/I Rate 5
0.06 L/s/ha
Peak Measured Depth
190.00 mm
Total I/I Flow Volume during event
128,731.00 L
Volumetric Coefficient (Cv%) 6
0.23%
Total Measured Flow Volume during Event
412,688.60 L
Peak I/I Coefficient 7
0.0011
Hourly Wet-Weather Peaking Factor 8
3.62
Instantaneous Wet-Weather Peaking Factor 9
6.95
1
Time of Concentration (Tc): The estimated time for the flow to travel from the furthest point in the upstream area to the point of monitoring, assume flow is travelling at 1.00 m/s Peak Precipitation Intensity Over Tc: The peak rainfall intensity for the duration of the storm with the time interval defined by time of concentration 3 Return Period over Tc: The estimated time to elapse before a storm of equal or greater intensity will likely occur again, based on design storm criteria 4 Peak I/I Flow: The greatest difference captured between measured flow and estimated dry weather flow, Peak I/I Flow = Maximum (Measured Flow – Estimated Dry Weather Flow) 5 Peak I/I Rate: A normalized peak I/I flow based on catchment area size, Peak I/I Rate = Peak I/I Flow / Catchment Area 6 Volumetric Coefficient (Cv%): The ratio of total I/I volume and total rainfall volume, Cv% = Total I/I Flow Volume / Total Precipitation Volume * 100% 7 Peak I/ I Coefficient: The ratio of peak I/I flow and peak rainfall intensity, Peak I/ I Coefficient = Peak I/I Flow / (Peak Rainfall Intensity over Tc * Catchment Area) 8 Hourly Wet‐Weather Peaking Factor: The ratio of peak hourly wet‐weather measured flow and average dry‐weather flow, Wet‐Weather Peaking Factor = Peak Hourly Wet‐Weather Measured Flow / Average Dry-Weather Flow 9 Instantaneous Wet‐Weather Peaking Factor: The ratio of peak wet‐weather measured flow and average dry‐weather flow, Wet‐Weather Peaking Factor = Peak Wet‐Weather Measured Flow / Average Dry-Weather Flow 2
1341 Civica Infrastructure Inc. www.civi.ca
Civica Infrastructures Inc. Kawartha Lakes Flow Monitoring Report
Appendix - A June 03, 2024
I/I Analysis Graph Station: 6-4
1342 Civica Infrastructure Inc. www.civi.ca
Civica Infrastructures Inc. Kawartha Lakes Flow Monitoring Report
Appendix - A June 03, 2024
Infiltration/Inflow Event Analysis Station: 6-4 Aug 29, 2022 01:40 – Aug 30, 2022 04:10, Total Precipitation: 29.00 mm (99,441,000.00 L) Station Details
Storm Details
Catchment Area
342.90 ha
Total Precipitation
29.00 mm (99,441,000.00 L)
Duration of Storm
2.50 hr
Time of Concentration (Tc) 1
40 min
Peak Precipitation Intensity Over Tc 2
31.50 mm/hr
Return Period over Tc 3
< 2 Yr
Measured Flow
I/I Flow
Time of Peak Measured Flow
Aug 29, 2022 15:00
Time of Peak I/I Flow (TD)
Aug 29, 2022 15:00
Estimated Dry Weather Flow at TD
4.61 L/s
Peak Measured Flow
43.62 L/s
Peak I/I Flow 4
39.02 L/s
Peak I/I Rate 5
0.11 L/s/ha
Peak Measured Depth
219.00 mm
Total I/I Flow Volume during event
183,325.40 L
Volumetric Coefficient (Cv%) 6
0.18%
Total Measured Flow Volume during Event
368,503.30 L
Peak I/I Coefficient 7
0.0013
Hourly Wet-Weather Peaking Factor 8
7.68
Instantaneous Wet-Weather Peaking Factor 9
12.37
1
Time of Concentration (Tc): The estimated time for the flow to travel from the furthest point in the upstream area to the point of monitoring, assume flow is travelling at 1.00 m/s Peak Precipitation Intensity Over Tc: The peak rainfall intensity for the duration of the storm with the time interval defined by time of concentration 3 Return Period over Tc: The estimated time to elapse before a storm of equal or greater intensity will likely occur again, based on design storm criteria 4 Peak I/I Flow: The greatest difference captured between measured flow and estimated dry weather flow, Peak I/I Flow = Maximum (Measured Flow – Estimated Dry Weather Flow) 5 Peak I/I Rate: A normalized peak I/I flow based on catchment area size, Peak I/I Rate = Peak I/I Flow / Catchment Area 6 Volumetric Coefficient (Cv%): The ratio of total I/I volume and total rainfall volume, Cv% = Total I/I Flow Volume / Total Precipitation Volume * 100% 7 Peak I/ I Coefficient: The ratio of peak I/I flow and peak rainfall intensity, Peak I/ I Coefficient = Peak I/I Flow / (Peak Rainfall Intensity over Tc * Catchment Area) 8 Hourly Wet‐Weather Peaking Factor: The ratio of peak hourly wet‐weather measured flow and average dry‐weather flow, Wet‐Weather Peaking Factor = Peak Hourly Wet‐Weather Measured Flow / Average Dry-Weather Flow 9 Instantaneous Wet‐Weather Peaking Factor: The ratio of peak wet‐weather measured flow and average dry‐weather flow, Wet‐Weather Peaking Factor = Peak Wet‐Weather Measured Flow / Average Dry-Weather Flow 2
1343 Civica Infrastructure Inc. www.civi.ca
Civica Infrastructures Inc. Kawartha Lakes Flow Monitoring Report
Appendix - A June 03, 2024
I/I Analysis Graph Station: 6-4
1344 Civica Infrastructure Inc. www.civi.ca
Civica Infrastructures Inc. Kawartha Lakes Flow Monitoring Report
Appendix - A June 03, 2024
Infiltration/Inflow Event Analysis Station: 6-4 Sep 11, 2022 15:50 – Sep 13, 2022 16:55, Total Precipitation: 21.75 mm (74,580,750.00 L) Station Details
Storm Details
Catchment Area
342.90 ha
Total Precipitation
21.75 mm (74,580,750.00 L)
Duration of Storm
25.08 hr
Time of Concentration (Tc) 1
40 min
Peak Precipitation Intensity Over Tc 2
7.90 mm/hr
Return Period over Tc 3
< 2 Yr
Measured Flow
I/I Flow
Time of Peak Measured Flow
Sep 12, 2022 07:50
Time of Peak I/I Flow (TD)
Sep 12, 2022 07:50
Estimated Dry Weather Flow at TD
4.75 L/s
Peak Measured Flow
11.94 L/s
Peak I/I Flow 4
7.19 L/s
Peak I/I Rate 5
0.02 L/s/ha
Peak Measured Depth
123.00 mm
Total I/I Flow Volume during event
48,350.20 L
Volumetric Coefficient (Cv%) 6
0.07%
Total Measured Flow Volume during Event
414,848.00 L
Peak I/I Coefficient 7
0.0010
Hourly Wet-Weather Peaking Factor 8
3.27
Instantaneous Wet-Weather Peaking Factor 9
4.36
1
Time of Concentration (Tc): The estimated time for the flow to travel from the furthest point in the upstream area to the point of monitoring, assume flow is travelling at 1.00 m/s Peak Precipitation Intensity Over Tc: The peak rainfall intensity for the duration of the storm with the time interval defined by time of concentration 3 Return Period over Tc: The estimated time to elapse before a storm of equal or greater intensity will likely occur again, based on design storm criteria 4 Peak I/I Flow: The greatest difference captured between measured flow and estimated dry weather flow, Peak I/I Flow = Maximum (Measured Flow – Estimated Dry Weather Flow) 5 Peak I/I Rate: A normalized peak I/I flow based on catchment area size, Peak I/I Rate = Peak I/I Flow / Catchment Area 6 Volumetric Coefficient (Cv%): The ratio of total I/I volume and total rainfall volume, Cv% = Total I/I Flow Volume / Total Precipitation Volume * 100% 7 Peak I/ I Coefficient: The ratio of peak I/I flow and peak rainfall intensity, Peak I/ I Coefficient = Peak I/I Flow / (Peak Rainfall Intensity over Tc * Catchment Area) 8 Hourly Wet‐Weather Peaking Factor: The ratio of peak hourly wet‐weather measured flow and average dry‐weather flow, Wet‐Weather Peaking Factor = Peak Hourly Wet‐Weather Measured Flow / Average Dry-Weather Flow 9 Instantaneous Wet‐Weather Peaking Factor: The ratio of peak wet‐weather measured flow and average dry‐weather flow, Wet‐Weather Peaking Factor = Peak Wet‐Weather Measured Flow / Average Dry-Weather Flow 2
1345 Civica Infrastructure Inc. www.civi.ca
Civica Infrastructures Inc. Kawartha Lakes Flow Monitoring Report
Appendix - A June 03, 2024
I/I Analysis Graph Station: 6-4
1346 Civica Infrastructure Inc. www.civi.ca
Civica Infrastructures Inc. Kawartha Lakes Flow Monitoring Report
Appendix - A June 03, 2024
Infiltration/Inflow Event Analysis Station: 6-4 Sep 17, 2022 19:35 – Sep 19, 2022 01:10, Total Precipitation: 24.50 mm (84,010,500.00 L) Station Details
Storm Details
Catchment Area
342.90 ha
Total Precipitation
24.50 mm (84,010,500.00 L)
Duration of Storm
5.58 hr
Time of Concentration (Tc) 1
40 min
Peak Precipitation Intensity Over Tc 2
16.10 mm/hr
Return Period over Tc 3
< 2 Yr
Measured Flow
I/I Flow
Time of Peak Measured Flow
Sep 18, 2022 09:10
Time of Peak I/I Flow (TD)
Sep 18, 2022 09:10
Estimated Dry Weather Flow at TD
3.74 L/s
Peak Measured Flow
27.73 L/s
Peak I/I Flow 4
23.99 L/s
Peak I/I Rate 5
0.07 L/s/ha
Peak Measured Depth
166.00 mm
Total I/I Flow Volume during event
269,680.50 L
Volumetric Coefficient (Cv%) 6
0.32%
Total Measured Flow Volume during Event
458,585.90 L
Peak I/I Coefficient 7
0.0016
Hourly Wet-Weather Peaking Factor 8
5.23
Instantaneous Wet-Weather Peaking Factor 9
9.33
1
Time of Concentration (Tc): The estimated time for the flow to travel from the furthest point in the upstream area to the point of monitoring, assume flow is travelling at 1.00 m/s Peak Precipitation Intensity Over Tc: The peak rainfall intensity for the duration of the storm with the time interval defined by time of concentration 3 Return Period over Tc: The estimated time to elapse before a storm of equal or greater intensity will likely occur again, based on design storm criteria 4 Peak I/I Flow: The greatest difference captured between measured flow and estimated dry weather flow, Peak I/I Flow = Maximum (Measured Flow – Estimated Dry Weather Flow) 5 Peak I/I Rate: A normalized peak I/I flow based on catchment area size, Peak I/I Rate = Peak I/I Flow / Catchment Area 6 Volumetric Coefficient (Cv%): The ratio of total I/I volume and total rainfall volume, Cv% = Total I/I Flow Volume / Total Precipitation Volume * 100% 7 Peak I/ I Coefficient: The ratio of peak I/I flow and peak rainfall intensity, Peak I/ I Coefficient = Peak I/I Flow / (Peak Rainfall Intensity over Tc * Catchment Area) 8 Hourly Wet‐Weather Peaking Factor: The ratio of peak hourly wet‐weather measured flow and average dry‐weather flow, Wet‐Weather Peaking Factor = Peak Hourly Wet‐Weather Measured Flow / Average Dry-Weather Flow 9 Instantaneous Wet‐Weather Peaking Factor: The ratio of peak wet‐weather measured flow and average dry‐weather flow, Wet‐Weather Peaking Factor = Peak Wet‐Weather Measured Flow / Average Dry-Weather Flow 2
1347 Civica Infrastructure Inc. www.civi.ca
Civica Infrastructures Inc. Kawartha Lakes Flow Monitoring Report
Appendix - A June 03, 2024
I/I Analysis Graph Station: 6-4
1348 Civica Infrastructure Inc. www.civi.ca
Civica Infrastructures Inc. Kawartha Lakes Flow Monitoring Report
Appendix - A June 03, 2024
Infiltration/Inflow Event Analysis Station: 6-4 Oct 12, 2022 08:40 – Oct 13, 2022 23:55, Total Precipitation: 20.75 mm (71,151,750.00 L) Station Details
Storm Details
Catchment Area
342.90 ha
Total Precipitation
20.75 mm (71,151,750.00 L)
Duration of Storm
15.25 hr
Time of Concentration (Tc) 1
40 min
Peak Precipitation Intensity Over Tc 2
6.40 mm/hr
Return Period over Tc 3
< 2 Yr
Measured Flow
I/I Flow
Time of Peak Measured Flow
Oct 13, 2022 04:05
Time of Peak I/I Flow (TD)
Oct 13, 2022 04:05
Estimated Dry Weather Flow at TD
2.68 L/s
Peak Measured Flow
16.38 L/s
Peak I/I Flow 4
13.70 L/s
Peak I/I Rate 5
0.04 L/s/ha
Peak Measured Depth
125.00 mm
Total I/I Flow Volume during event
116,706.90 L
Volumetric Coefficient (Cv%) 6
0.16%
Total Measured Flow Volume during Event
503,238.40 L
Peak I/I Coefficient 7
0.0023
Hourly Wet-Weather Peaking Factor 8
2.59
Instantaneous Wet-Weather Peaking Factor 9
4.17
1
Time of Concentration (Tc): The estimated time for the flow to travel from the furthest point in the upstream area to the point of monitoring, assume flow is travelling at 1.00 m/s Peak Precipitation Intensity Over Tc: The peak rainfall intensity for the duration of the storm with the time interval defined by time of concentration 3 Return Period over Tc: The estimated time to elapse before a storm of equal or greater intensity will likely occur again, based on design storm criteria 4 Peak I/I Flow: The greatest difference captured between measured flow and estimated dry weather flow, Peak I/I Flow = Maximum (Measured Flow – Estimated Dry Weather Flow) 5 Peak I/I Rate: A normalized peak I/I flow based on catchment area size, Peak I/I Rate = Peak I/I Flow / Catchment Area 6 Volumetric Coefficient (Cv%): The ratio of total I/I volume and total rainfall volume, Cv% = Total I/I Flow Volume / Total Precipitation Volume * 100% 7 Peak I/ I Coefficient: The ratio of peak I/I flow and peak rainfall intensity, Peak I/ I Coefficient = Peak I/I Flow / (Peak Rainfall Intensity over Tc * Catchment Area) 8 Hourly Wet‐Weather Peaking Factor: The ratio of peak hourly wet‐weather measured flow and average dry‐weather flow, Wet‐Weather Peaking Factor = Peak Hourly Wet‐Weather Measured Flow / Average Dry-Weather Flow 9 Instantaneous Wet‐Weather Peaking Factor: The ratio of peak wet‐weather measured flow and average dry‐weather flow, Wet‐Weather Peaking Factor = Peak Wet‐Weather Measured Flow / Average Dry-Weather Flow 2
1349 Civica Infrastructure Inc. www.civi.ca
Civica Infrastructures Inc. Kawartha Lakes Flow Monitoring Report
Appendix - A June 03, 2024
Activity Log Station: 6-4 Date Time
Type
Purpose of Visit
19-Nov-2021 08:30:00 AM
Installation Log
FM INSTALL
02-Dec-2021 11:25:00 AM
Maintenance Log
Calibration
14-Dec-2021 03:50:00 PM
20-Jan-2022 01:30:00 PM
09-Feb-2022 11:55:00 AM
17-Mar-2022 02:45:00 PM
Maintenance Log
Maintenance Log
Maintenance Log
Maintenance Log
Yes
Yes
CALIBRATION
Yes
CALIBRATION
Data downloaded Debris cleared Telemetry sent Ensured manual and sensor readings are satisfactory before leaving site Velocity issue should be resolved ; Sensor moved to 5 o'clock position
Yes
CALIBRATION
Data downloaded Debris cleared Heavy debris build up causing velocity to flat line Telemetry sent Ensured manual and sensor readings are satisfactory before leaving site Rotated sensor to 4 o'clock position to reduce debris build up
Yes
calibration
Data downloaded site calibrated cleared minor debris telemetry sent
Yes
Data downloaded Debris cleared Telemetry sent however we could not verify from filezilla, connection error ANTENNA IS DAMAGED, REPLACED BUT NOT DRILLED, REFER TO PHOTOS. ELECTRIC DRILL AVAILABLE ON THE VAN IS NOT WORKING
Yes
Maintenance Log
CALIBRATION
25-May-2022 09:35:00 AM
Maintenance Log
Calibration
Maintenance Log
FM INSTALLED IN INLET PMAC 8235 Data downloaded Debris cleared Telemetry sent Ensured manual and sensor readings are satisfactory before leaving site Downward data not the greatest - CSO sensor wasn't level - leveled before leaving
Calibration Measurement
DATA DOWNLOADED - DATA DROPOUTS VELOCITY DROPOUTS - Alot of silt around the sensor which we cleared DOWNWARD SENSOR DROPOUTS - Ensured sensor is leveled. No black ring to secure downward sensor however we used electrical tape to create a gasket. See video of the sensor. SITE CALIBRATED DEBRIS CLEARED SENT TELEMETRY
25-Mar-2022 03:44:00 PM
27-Jun-2022 03:25:00 PM
Comment
Yes DATA DOWNLOADED PHOTOS TAKEN BATTERY REPLACED PRESENCE OF ROCKS ON CHANEL SITE CALIBRATED
CALIBRATION
1350 Civica Infrastructure Inc. www.civi.ca
Yes
Civica Infrastructures Inc. Kawartha Lakes Flow Monitoring Report Date Time
Appendix - A June 03, 2024 Type
Purpose of Visit
Comment
Calibration Measurement
CLEARED DEBRIS TELEMETRY SENT ANTENNA DRILLED
14-Jul-2022 12:20:00 PM
20-Jul-2022 12:01:00 PM
03-Aug-2022 10:02:00 AM
25-Aug-2022 07:49:00 AM
04-Oct-2022 08:51:00 AM
21-Oct-2022 11:18:00 AM
04-Nov-2022 11:36:00 AM
Maintenance Log
Maintenance Log
Maintenance Log
Maintenance Log
Maintenance Log
Maintenance Log
Maintenance Log
CALIBRATION
DATA DOWNLOADED, SITE CALIBRATED, DEBRIS CLEARED, TELEMETRY SENT.
Yes
CALIBRATION
DATA DOWNLOADED, SITE CALIBRATED, DEBRIS CLEARED, TELEMETRY SENT
Yes
CALIBRATION
DATA DOWNLOADED, SITE CALIBRATED, TELEMETRY SENT AND CHECKED, PHOTOS TAKEN
Yes
CALIBRATION
DATA DOWNLOADED, SITE CALIBRATED TELEMETRY SENT PHOTOS TAKEN VIDEO TAKEN
Yes
CALIBRATION
DATA DOWNLOADED, SITE CALIBRATED, DEBRIS CLEARED (LOTS OF DEBRIS), 20MM OF SILT TELEMETRY SENT AND CHECKED, PHOTO AND VIDEO TAKEN
Yes
Calibration
DATA DOWNLOADED TELEMETRY SENT SITE CALIBRATED PHOTOS TAKEN
Yes
CALIBRATION
DATA DOWNLOADED TELEMETRY SENT PHOTOS TAKEN SITE CALIBRATED
Yes
1351 Civica Infrastructure Inc. www.civi.ca
Civica Infrastructures Inc. Kawartha Lakes Flow Monitoring Report
Appendix - A June 03, 2024
Aggregate Data Station: 6-5
Level Date From
Date To
Days
Min (m)
Avg (m)
Max (m)
Count
Time of Min1
Time of Max1
Nov 25, 2021
Nov 04, 2022
345
0.05
0.11
0.23
99,152
Tue Aug 09, 2022 23:55
Sun Jun 12, 2022 09:35
Velocity Date From
Date To
Days
Min (m/s)
Avg (m/s)
Max (m/s)
Count
Time of Min1
Time of Max1
Nov 25, 2021
Nov 04, 2022
345
0.38
0.62
1.13
99,152
Fri Aug 12, 2022 04:55
Sun Jun 12, 2022 09:35
Flow Date From
Date To
Days
Min (L/s)
Avg (L/s)
Max (L/s)
Total Volume (1,000,000 L)
Count
Time of Min1
Time of Max1
Nov 25, 2021
Nov 04, 2022
345
4.69
21.47
103.90
638.53
99,152
Tue Aug 09, 2022 23:55
Sun Jun 12, 2022 09:35
Precipitation
1
Date From
Date To
Days
Min (mm)
Avg (mm)
Max (mm)
Sum (mm)
Count
Time of Min1
Time of Max1
Nov 25, 2021
Nov 04, 2022
335
0.00
0.01
9.75
657.70
95,832
Thu Nov 25, 2021 07:30
Mon Jul 25, 2022 00:00
Time of Min and Time of Max will be displayed by first occurrence
1352 Civica Infrastructure Inc. www.civi.ca
Civica Infrastructures Inc. Kawartha Lakes Flow Monitoring Report
Appendix - A June 03, 2024
Sanitary Report Station: 6-5
1
Average Dry Weather Flow (L/s)
Average Dry Weather Flow (L/c/d)
Average Daily Minimum Dry Weather Flow (L/s)
Average Daily Peak Dry Weather Flow (L/s)
19.784
392.597
12.703
28.156
Peaking Factor
Groundwater Infiltration (L/s)1
Groundwater Infiltration (L/ha/d)
% of GWI in Average DWF
1.423
10.798
3,388.820
54.578
Groundwater infiltration (GWI) is assumed as 85% of the daily minimum flow averaged over the monitoring period
1353 Civica Infrastructure Inc. www.civi.ca
Civica Infrastructures Inc. Kawartha Lakes Flow Monitoring Report
Appendix - A June 03, 2024
Data Chart Station: 6-5 Nov 25, 2021 – Nov 30, 2021
1354 Civica Infrastructure Inc. www.civi.ca
Civica Infrastructures Inc. Kawartha Lakes Flow Monitoring Report
Appendix - A June 03, 2024
Data Chart Station: 6-5 Dec 01, 2021 – Dec 31, 2021
1355 Civica Infrastructure Inc. www.civi.ca
Civica Infrastructures Inc. Kawartha Lakes Flow Monitoring Report
Appendix - A June 03, 2024
Data Chart Station: 6-5 Jan 01, 2022 – Jan 31, 2022
1356 Civica Infrastructure Inc. www.civi.ca
Civica Infrastructures Inc. Kawartha Lakes Flow Monitoring Report
Appendix - A June 03, 2024
Data Chart Station: 6-5 Feb 01, 2022 – Feb 28, 2022
1357 Civica Infrastructure Inc. www.civi.ca
Civica Infrastructures Inc. Kawartha Lakes Flow Monitoring Report
Appendix - A June 03, 2024
Data Chart Station: 6-5 Mar 01, 2022 – Mar 31, 2022
1358 Civica Infrastructure Inc. www.civi.ca
Civica Infrastructures Inc. Kawartha Lakes Flow Monitoring Report
Appendix - A June 03, 2024
Data Chart Station: 6-5 Apr 01, 2022 – Apr 30, 2022
1359 Civica Infrastructure Inc. www.civi.ca
Civica Infrastructures Inc. Kawartha Lakes Flow Monitoring Report
Appendix - A June 03, 2024
Data Chart Station: 6-5 May 01, 2022 – May 31, 2022
1360 Civica Infrastructure Inc. www.civi.ca
Civica Infrastructures Inc. Kawartha Lakes Flow Monitoring Report
Appendix - A June 03, 2024
Data Chart Station: 6-5 Jun 01, 2022 – Jun 30, 2022
1361 Civica Infrastructure Inc. www.civi.ca
Civica Infrastructures Inc. Kawartha Lakes Flow Monitoring Report
Appendix - A June 03, 2024
Data Chart Station: 6-5 Jul 01, 2022 – Jul 31, 2022
1362 Civica Infrastructure Inc. www.civi.ca
Civica Infrastructures Inc. Kawartha Lakes Flow Monitoring Report
Appendix - A June 03, 2024
Data Chart Station: 6-5 Aug 01, 2022 – Aug 31, 2022
1363 Civica Infrastructure Inc. www.civi.ca
Civica Infrastructures Inc. Kawartha Lakes Flow Monitoring Report
Appendix - A June 03, 2024
Data Chart Station: 6-5 Sep 01, 2022 – Sep 30, 2022
1364 Civica Infrastructure Inc. www.civi.ca
Civica Infrastructures Inc. Kawartha Lakes Flow Monitoring Report
Appendix - A June 03, 2024
Data Chart Station: 6-5 Oct 01, 2022 – Oct 31, 2022
1365 Civica Infrastructure Inc. www.civi.ca
Civica Infrastructures Inc. Kawartha Lakes Flow Monitoring Report
Appendix - A June 03, 2024
Data Chart Station: 6-5 Nov 01, 2022 – Nov 04, 2022
1366 Civica Infrastructure Inc. www.civi.ca
Civica Infrastructures Inc. Kawartha Lakes Flow Monitoring Report
Appendix - A June 03, 2024
I/I Analysis Table
1
Event1
Total Precipitation (mm)
Duration (hours)
Peak Intensity Over Tc at Station (mm/hr)
Feb 16, 2022
18.00
12.67
Apr 13, 2022
17.25
May 26, 2022
6-5 Measured Peak Flow (L/s)
Peak I/I Flow (L/s)
Peak I/I Rate (L/s/ha)
Volumetric Runoff Coefficient (CV%)
Peaking Factor (PF)
3.00
68.69
50.24
0.18
3.90 %
2.50
28.67
5.80
34.20
7.45
0.03
0.41 %
0.31
20.25
27.50
8.00
34.10
12.70
0.05
0.45 %
0.69
Jun 06, 2022
30.00
32.42
6.50
44.81
22.33
0.08
0.75 %
1.16
Jun 11, 2022
41.50
25.08
19.50
103.90
78.88
0.29
2.11 %
4.22
Jul 12, 2022
15.50
7.75
12.20
23.02
9.36
0.03
0.17 %
0.57
Jul 18, 2022
21.50
43.25
1.00
39.48
21.73
0.08
1.19 %
1.37
Aug 17, 2022
17.50
1.83
14.80
54.41
37.26
0.14
0.37 %
2.60
Aug 21, 2022
17.50
30.50
7.00
27.67
12.73
0.05
0.71 %
0.80
Aug 25, 2022
16.25
8.58
14.20
46.30
28.13
0.10
0.71 %
1.75
Aug 29, 2022
29.00
2.50
21.00
92.22
74.60
0.27
0.82 %
4.73
Sep 12, 2022
21.75
25.08
6.20
34.11
10.31
0.04
0.21 %
0.57
Sep 18, 2022
24.50
5.58
14.00
44.71
24.02
0.09
0.97 %
1.28
Oct 12, 2022
20.75
15.25
5.00
32.01
9.96
0.04
0.44 %
0.57
Average
22.23
19.05
9.87
48.55
28.55
0.11
0.94 %
1.65
Maximum
41.50
43.25
21.00
103.90
78.88
0.29
3.90 %
4.73
Flow KPIs
Measured Storms
Station: 6-5
An event is a storm with a minimum volume of 15mm and a minimum inter-event dry period of 12 hours
1367 Civica Infrastructure Inc. www.civi.ca
Civica Infrastructures Inc. Kawartha Lakes Flow Monitoring Report
Appendix - A June 03, 2024
I/I Analysis Graph Station: 6-5
1368 Civica Infrastructure Inc. www.civi.ca
Civica Infrastructures Inc. Kawartha Lakes Flow Monitoring Report
Appendix - A June 03, 2024
Infiltration/Inflow Event Analysis Station: 6-5 Feb 16, 2022 11:00 – Feb 17, 2022 23:40, Total Precipitation: 18.00 mm (49,554,000.00 L) Station Details
Storm Details
Catchment Area
275.30 ha
Total Precipitation
18.00 mm (49,554,000.00 L)
Duration of Storm
12.67 hr
Time of Concentration (Tc) 1
60 min
Peak Precipitation Intensity Over Tc 2
3.00 mm/hr
Return Period over Tc 3
< 2 Yr
Measured Flow
I/I Flow
Time of Peak Measured Flow
Feb 17, 2022 07:00
Time of Peak I/I Flow (TD)
Feb 17, 2022 07:00
Estimated Dry Weather Flow at TD
18.45 L/s
Peak Measured Flow
68.69 L/s
Peak I/I Flow 4
50.24 L/s
Peak I/I Rate 5
0.18 L/s/ha
Peak Measured Depth
190.00 mm
Total I/I Flow Volume during event
1,933,534.90 L
Volumetric Coefficient (Cv%) 6
3.90%
Total Measured Flow Volume during Event
3,723,564.60 L
Peak I/I Coefficient 7
0.0219
Hourly Wet-Weather Peaking Factor 8
3.21
Instantaneous Wet-Weather Peaking Factor 9
3.42
1
Time of Concentration (Tc): The estimated time for the flow to travel from the furthest point in the upstream area to the point of monitoring, assume flow is travelling at 1.00 m/s Peak Precipitation Intensity Over Tc: The peak rainfall intensity for the duration of the storm with the time interval defined by time of concentration 3 Return Period over Tc: The estimated time to elapse before a storm of equal or greater intensity will likely occur again, based on design storm criteria 4 Peak I/I Flow: The greatest difference captured between measured flow and estimated dry weather flow, Peak I/I Flow = Maximum (Measured Flow – Estimated Dry Weather Flow) 5 Peak I/I Rate: A normalized peak I/I flow based on catchment area size, Peak I/I Rate = Peak I/I Flow / Catchment Area 6 Volumetric Coefficient (Cv%): The ratio of total I/I volume and total rainfall volume, Cv% = Total I/I Flow Volume / Total Precipitation Volume * 100% 7 Peak I/ I Coefficient: The ratio of peak I/I flow and peak rainfall intensity, Peak I/ I Coefficient = Peak I/I Flow / (Peak Rainfall Intensity over Tc * Catchment Area) 8 Hourly Wet‐Weather Peaking Factor: The ratio of peak hourly wet‐weather measured flow and average dry‐weather flow, Wet‐Weather Peaking Factor = Peak Hourly Wet‐Weather Measured Flow / Average Dry-Weather Flow 9 Instantaneous Wet‐Weather Peaking Factor: The ratio of peak wet‐weather measured flow and average dry‐weather flow, Wet‐Weather Peaking Factor = Peak Wet‐Weather Measured Flow / Average Dry-Weather Flow 2
1369 Civica Infrastructure Inc. www.civi.ca
Civica Infrastructures Inc. Kawartha Lakes Flow Monitoring Report
Appendix - A June 03, 2024
I/I Analysis Graph Station: 6-5
1370 Civica Infrastructure Inc. www.civi.ca
Civica Infrastructures Inc. Kawartha Lakes Flow Monitoring Report
Appendix - A June 03, 2024
Infiltration/Inflow Event Analysis Station: 6-5 Apr 12, 2022 17:25 – Apr 14, 2022 22:05, Total Precipitation: 17.25 mm (47,489,250.00 L) Station Details
Storm Details
Catchment Area
275.30 ha
Total Precipitation
17.25 mm (47,489,250.00 L)
Duration of Storm
28.67 hr
Time of Concentration (Tc) 1
60 min
Peak Precipitation Intensity Over Tc 2
5.80 mm/hr
Return Period over Tc 3
< 2 Yr
Measured Flow
I/I Flow
Time of Peak Measured Flow
Apr 13, 2022 09:10
Time of Peak I/I Flow (TD)
Apr 13, 2022 09:10
Estimated Dry Weather Flow at TD
26.75 L/s
Peak Measured Flow
34.20 L/s
Peak I/I Flow 4
7.45 L/s
Peak I/I Rate 5
0.03 L/s/ha
Peak Measured Depth
139.00 mm
Total I/I Flow Volume during event
192,861.40 L
Volumetric Coefficient (Cv%) 6
0.41%
Total Measured Flow Volume during Event
3,679,155.90 L
Peak I/I Coefficient 7
0.0017
Hourly Wet-Weather Peaking Factor 8
1.29
Instantaneous Wet-Weather Peaking Factor 9
1.44
1
Time of Concentration (Tc): The estimated time for the flow to travel from the furthest point in the upstream area to the point of monitoring, assume flow is travelling at 1.00 m/s Peak Precipitation Intensity Over Tc: The peak rainfall intensity for the duration of the storm with the time interval defined by time of concentration 3 Return Period over Tc: The estimated time to elapse before a storm of equal or greater intensity will likely occur again, based on design storm criteria 4 Peak I/I Flow: The greatest difference captured between measured flow and estimated dry weather flow, Peak I/I Flow = Maximum (Measured Flow – Estimated Dry Weather Flow) 5 Peak I/I Rate: A normalized peak I/I flow based on catchment area size, Peak I/I Rate = Peak I/I Flow / Catchment Area 6 Volumetric Coefficient (Cv%): The ratio of total I/I volume and total rainfall volume, Cv% = Total I/I Flow Volume / Total Precipitation Volume * 100% 7 Peak I/ I Coefficient: The ratio of peak I/I flow and peak rainfall intensity, Peak I/ I Coefficient = Peak I/I Flow / (Peak Rainfall Intensity over Tc * Catchment Area) 8 Hourly Wet‐Weather Peaking Factor: The ratio of peak hourly wet‐weather measured flow and average dry‐weather flow, Wet‐Weather Peaking Factor = Peak Hourly Wet‐Weather Measured Flow / Average Dry-Weather Flow 9 Instantaneous Wet‐Weather Peaking Factor: The ratio of peak wet‐weather measured flow and average dry‐weather flow, Wet‐Weather Peaking Factor = Peak Wet‐Weather Measured Flow / Average Dry-Weather Flow 2
1371 Civica Infrastructure Inc. www.civi.ca
Civica Infrastructures Inc. Kawartha Lakes Flow Monitoring Report
Appendix - A June 03, 2024
I/I Analysis Graph Station: 6-5
1372 Civica Infrastructure Inc. www.civi.ca
Civica Infrastructures Inc. Kawartha Lakes Flow Monitoring Report
Appendix - A June 03, 2024
Infiltration/Inflow Event Analysis Station: 6-5 May 26, 2022 07:30 – May 28, 2022 11:00, Total Precipitation: 20.25 mm (55,748,250.00 L) Station Details
Storm Details
Catchment Area
275.30 ha
Total Precipitation
20.25 mm (55,748,250.00 L)
Duration of Storm
27.50 hr
Time of Concentration (Tc) 1
60 min
Peak Precipitation Intensity Over Tc 2
8.00 mm/hr
Return Period over Tc 3
< 2 Yr
Measured Flow
I/I Flow
Time of Peak Measured Flow
May 27, 2022 19:50
Time of Peak I/I Flow (TD)
May 27, 2022 19:50
Estimated Dry Weather Flow at TD
21.41 L/s
Peak Measured Flow
34.10 L/s
Peak I/I Flow 4
12.70 L/s
Peak I/I Rate 5
0.05 L/s/ha
Peak Measured Depth
135.00 mm
Total I/I Flow Volume during event
251,350.00 L
Volumetric Coefficient (Cv%) 6
0.45%
Total Measured Flow Volume during Event
2,859,511.00 L
Peak I/I Coefficient 7
0.0021
Hourly Wet-Weather Peaking Factor 8
1.77
Instantaneous Wet-Weather Peaking Factor 9
1.86
1
Time of Concentration (Tc): The estimated time for the flow to travel from the furthest point in the upstream area to the point of monitoring, assume flow is travelling at 1.00 m/s Peak Precipitation Intensity Over Tc: The peak rainfall intensity for the duration of the storm with the time interval defined by time of concentration 3 Return Period over Tc: The estimated time to elapse before a storm of equal or greater intensity will likely occur again, based on design storm criteria 4 Peak I/I Flow: The greatest difference captured between measured flow and estimated dry weather flow, Peak I/I Flow = Maximum (Measured Flow – Estimated Dry Weather Flow) 5 Peak I/I Rate: A normalized peak I/I flow based on catchment area size, Peak I/I Rate = Peak I/I Flow / Catchment Area 6 Volumetric Coefficient (Cv%): The ratio of total I/I volume and total rainfall volume, Cv% = Total I/I Flow Volume / Total Precipitation Volume * 100% 7 Peak I/ I Coefficient: The ratio of peak I/I flow and peak rainfall intensity, Peak I/ I Coefficient = Peak I/I Flow / (Peak Rainfall Intensity over Tc * Catchment Area) 8 Hourly Wet‐Weather Peaking Factor: The ratio of peak hourly wet‐weather measured flow and average dry‐weather flow, Wet‐Weather Peaking Factor = Peak Hourly Wet‐Weather Measured Flow / Average Dry-Weather Flow 9 Instantaneous Wet‐Weather Peaking Factor: The ratio of peak wet‐weather measured flow and average dry‐weather flow, Wet‐Weather Peaking Factor = Peak Wet‐Weather Measured Flow / Average Dry-Weather Flow 2
1373 Civica Infrastructure Inc. www.civi.ca
Civica Infrastructures Inc. Kawartha Lakes Flow Monitoring Report
Appendix - A June 03, 2024
I/I Analysis Graph Station: 6-5
1374 Civica Infrastructure Inc. www.civi.ca
Civica Infrastructures Inc. Kawartha Lakes Flow Monitoring Report
Appendix - A June 03, 2024
Infiltration/Inflow Event Analysis Station: 6-5 Jun 05, 2022 18:20 – Jun 08, 2022 02:45, Total Precipitation: 30.00 mm (82,590,000.00 L) Station Details
Storm Details
Catchment Area
275.30 ha
Total Precipitation
30.00 mm (82,590,000.00 L)
Duration of Storm
32.42 hr
Time of Concentration (Tc) 1
60 min
Peak Precipitation Intensity Over Tc 2
6.50 mm/hr
Return Period over Tc 3
< 2 Yr
Measured Flow
I/I Flow
Time of Peak Measured Flow
Jun 07, 2022 10:45
Time of Peak I/I Flow (TD)
Jun 07, 2022 10:45
Estimated Dry Weather Flow at TD
22.48 L/s
Peak Measured Flow
44.81 L/s
Peak I/I Flow 4
22.33 L/s
Peak I/I Rate 5
0.08 L/s/ha
Peak Measured Depth
156.00 mm
Total I/I Flow Volume during event
618,946.10 L
Volumetric Coefficient (Cv%) 6
0.75%
Total Measured Flow Volume during Event
3,710,346.60 L
Peak I/I Coefficient 7
0.0045
Hourly Wet-Weather Peaking Factor 8
2.11
Instantaneous Wet-Weather Peaking Factor 9
2.32
1
Time of Concentration (Tc): The estimated time for the flow to travel from the furthest point in the upstream area to the point of monitoring, assume flow is travelling at 1.00 m/s Peak Precipitation Intensity Over Tc: The peak rainfall intensity for the duration of the storm with the time interval defined by time of concentration 3 Return Period over Tc: The estimated time to elapse before a storm of equal or greater intensity will likely occur again, based on design storm criteria 4 Peak I/I Flow: The greatest difference captured between measured flow and estimated dry weather flow, Peak I/I Flow = Maximum (Measured Flow – Estimated Dry Weather Flow) 5 Peak I/I Rate: A normalized peak I/I flow based on catchment area size, Peak I/I Rate = Peak I/I Flow / Catchment Area 6 Volumetric Coefficient (Cv%): The ratio of total I/I volume and total rainfall volume, Cv% = Total I/I Flow Volume / Total Precipitation Volume * 100% 7 Peak I/ I Coefficient: The ratio of peak I/I flow and peak rainfall intensity, Peak I/ I Coefficient = Peak I/I Flow / (Peak Rainfall Intensity over Tc * Catchment Area) 8 Hourly Wet‐Weather Peaking Factor: The ratio of peak hourly wet‐weather measured flow and average dry‐weather flow, Wet‐Weather Peaking Factor = Peak Hourly Wet‐Weather Measured Flow / Average Dry-Weather Flow 9 Instantaneous Wet‐Weather Peaking Factor: The ratio of peak wet‐weather measured flow and average dry‐weather flow, Wet‐Weather Peaking Factor = Peak Wet‐Weather Measured Flow / Average Dry-Weather Flow 2
1375 Civica Infrastructure Inc. www.civi.ca
Civica Infrastructures Inc. Kawartha Lakes Flow Monitoring Report
Appendix - A June 03, 2024
I/I Analysis Graph Station: 6-5
1376 Civica Infrastructure Inc. www.civi.ca
Civica Infrastructures Inc. Kawartha Lakes Flow Monitoring Report
Appendix - A June 03, 2024
Infiltration/Inflow Event Analysis Station: 6-5 Jun 11, 2022 01:55 – Jun 13, 2022 03:00, Total Precipitation: 41.50 mm (114,249,500.00 L) Station Details
Storm Details
Catchment Area
275.30 ha
Total Precipitation
41.50 mm (114,249,500.00 L)
Duration of Storm
25.08 hr
Time of Concentration (Tc) 1
60 min
Peak Precipitation Intensity Over Tc 2
19.50 mm/hr
Return Period over Tc 3
< 2 Yr
Measured Flow
I/I Flow
Time of Peak Measured Flow
Jun 12, 2022 09:35
Time of Peak I/I Flow (TD)
Jun 12, 2022 09:35
Estimated Dry Weather Flow at TD
25.03 L/s
Peak Measured Flow
103.90 L/s
Peak I/I Flow 4
78.88 L/s
Peak I/I Rate 5
0.29 L/s/ha
Peak Measured Depth
232.00 mm
Total I/I Flow Volume during event
2,415,287.90 L
Volumetric Coefficient (Cv%) 6
2.11%
Total Measured Flow Volume during Event
4,915,363.90 L
Peak I/I Coefficient 7
0.0053
Hourly Wet-Weather Peaking Factor 8
4.57
Instantaneous Wet-Weather Peaking Factor 9
5.56
1
Time of Concentration (Tc): The estimated time for the flow to travel from the furthest point in the upstream area to the point of monitoring, assume flow is travelling at 1.00 m/s Peak Precipitation Intensity Over Tc: The peak rainfall intensity for the duration of the storm with the time interval defined by time of concentration 3 Return Period over Tc: The estimated time to elapse before a storm of equal or greater intensity will likely occur again, based on design storm criteria 4 Peak I/I Flow: The greatest difference captured between measured flow and estimated dry weather flow, Peak I/I Flow = Maximum (Measured Flow – Estimated Dry Weather Flow) 5 Peak I/I Rate: A normalized peak I/I flow based on catchment area size, Peak I/I Rate = Peak I/I Flow / Catchment Area 6 Volumetric Coefficient (Cv%): The ratio of total I/I volume and total rainfall volume, Cv% = Total I/I Flow Volume / Total Precipitation Volume * 100% 7 Peak I/ I Coefficient: The ratio of peak I/I flow and peak rainfall intensity, Peak I/ I Coefficient = Peak I/I Flow / (Peak Rainfall Intensity over Tc * Catchment Area) 8 Hourly Wet‐Weather Peaking Factor: The ratio of peak hourly wet‐weather measured flow and average dry‐weather flow, Wet‐Weather Peaking Factor = Peak Hourly Wet‐Weather Measured Flow / Average Dry-Weather Flow 9 Instantaneous Wet‐Weather Peaking Factor: The ratio of peak wet‐weather measured flow and average dry‐weather flow, Wet‐Weather Peaking Factor = Peak Wet‐Weather Measured Flow / Average Dry-Weather Flow 2
1377 Civica Infrastructure Inc. www.civi.ca
Civica Infrastructures Inc. Kawartha Lakes Flow Monitoring Report
Appendix - A June 03, 2024
I/I Analysis Graph Station: 6-5
1378 Civica Infrastructure Inc. www.civi.ca
Civica Infrastructures Inc. Kawartha Lakes Flow Monitoring Report
Appendix - A June 03, 2024
Infiltration/Inflow Event Analysis Station: 6-5 Jul 11, 2022 14:25 – Jul 12, 2022 22:10, Total Precipitation: 15.50 mm (42,671,500.00 L) Station Details
Storm Details
Catchment Area
275.30 ha
Total Precipitation
15.50 mm (42,671,500.00 L)
Duration of Storm
7.75 hr
Time of Concentration (Tc) 1
60 min
Peak Precipitation Intensity Over Tc 2
12.20 mm/hr
Return Period over Tc 3
< 2 Yr
Measured Flow
I/I Flow
Time of Peak Measured Flow
Jul 12, 2022 09:55
Time of Peak I/I Flow (TD)
Jul 12, 2022 03:20
Estimated Dry Weather Flow at TD
10.97 L/s
Peak Measured Flow
23.02 L/s
Peak I/I Flow 4
9.36 L/s
Peak I/I Rate 5
0.03 L/s/ha
Peak Measured Depth
115.00 mm
Total I/I Flow Volume during event
70,704.00 L
Volumetric Coefficient (Cv%) 6
0.17%
Total Measured Flow Volume during Event
1,248,982.10 L
Peak I/I Coefficient 7
0.0010
Hourly Wet-Weather Peaking Factor 8
1.24
Instantaneous Wet-Weather Peaking Factor 9
1.39
1
Time of Concentration (Tc): The estimated time for the flow to travel from the furthest point in the upstream area to the point of monitoring, assume flow is travelling at 1.00 m/s Peak Precipitation Intensity Over Tc: The peak rainfall intensity for the duration of the storm with the time interval defined by time of concentration 3 Return Period over Tc: The estimated time to elapse before a storm of equal or greater intensity will likely occur again, based on design storm criteria 4 Peak I/I Flow: The greatest difference captured between measured flow and estimated dry weather flow, Peak I/I Flow = Maximum (Measured Flow – Estimated Dry Weather Flow) 5 Peak I/I Rate: A normalized peak I/I flow based on catchment area size, Peak I/I Rate = Peak I/I Flow / Catchment Area 6 Volumetric Coefficient (Cv%): The ratio of total I/I volume and total rainfall volume, Cv% = Total I/I Flow Volume / Total Precipitation Volume * 100% 7 Peak I/ I Coefficient: The ratio of peak I/I flow and peak rainfall intensity, Peak I/ I Coefficient = Peak I/I Flow / (Peak Rainfall Intensity over Tc * Catchment Area) 8 Hourly Wet‐Weather Peaking Factor: The ratio of peak hourly wet‐weather measured flow and average dry‐weather flow, Wet‐Weather Peaking Factor = Peak Hourly Wet‐Weather Measured Flow / Average Dry-Weather Flow 9 Instantaneous Wet‐Weather Peaking Factor: The ratio of peak wet‐weather measured flow and average dry‐weather flow, Wet‐Weather Peaking Factor = Peak Wet‐Weather Measured Flow / Average Dry-Weather Flow 2
1379 Civica Infrastructure Inc. www.civi.ca
Civica Infrastructures Inc. Kawartha Lakes Flow Monitoring Report
Appendix - A June 03, 2024
I/I Analysis Graph Station: 6-5
1380 Civica Infrastructure Inc. www.civi.ca
Civica Infrastructures Inc. Kawartha Lakes Flow Monitoring Report
Appendix - A June 03, 2024
Infiltration/Inflow Event Analysis Station: 6-5 Jul 17, 2022 16:10 – Jul 20, 2022 11:25, Total Precipitation: 21.50 mm (59,189,500.00 L) Station Details
Storm Details
Catchment Area
275.30 ha
Total Precipitation
21.50 mm (59,189,500.00 L)
Duration of Storm
43.25 hr
Time of Concentration (Tc) 1
60 min
Peak Precipitation Intensity Over Tc 2
1.00 mm/hr
Return Period over Tc 3
< 2 Yr
Measured Flow
I/I Flow
Time of Peak Measured Flow
Jul 18, 2022 12:00
Time of Peak I/I Flow (TD)
Jul 18, 2022 12:00
Estimated Dry Weather Flow at TD
17.76 L/s
Peak Measured Flow
39.48 L/s
Peak I/I Flow 4
21.73 L/s
Peak I/I Rate 5
0.08 L/s/ha
Peak Measured Depth
149.00 mm
Total I/I Flow Volume during event
705,682.00 L
Volumetric Coefficient (Cv%) 6
1.19%
Total Measured Flow Volume during Event
3,867,432.90 L
Peak I/I Coefficient 7
0.0284
Hourly Wet-Weather Peaking Factor 8
2.31
Instantaneous Wet-Weather Peaking Factor 9
2.49
1
Time of Concentration (Tc): The estimated time for the flow to travel from the furthest point in the upstream area to the point of monitoring, assume flow is travelling at 1.00 m/s Peak Precipitation Intensity Over Tc: The peak rainfall intensity for the duration of the storm with the time interval defined by time of concentration 3 Return Period over Tc: The estimated time to elapse before a storm of equal or greater intensity will likely occur again, based on design storm criteria 4 Peak I/I Flow: The greatest difference captured between measured flow and estimated dry weather flow, Peak I/I Flow = Maximum (Measured Flow – Estimated Dry Weather Flow) 5 Peak I/I Rate: A normalized peak I/I flow based on catchment area size, Peak I/I Rate = Peak I/I Flow / Catchment Area 6 Volumetric Coefficient (Cv%): The ratio of total I/I volume and total rainfall volume, Cv% = Total I/I Flow Volume / Total Precipitation Volume * 100% 7 Peak I/ I Coefficient: The ratio of peak I/I flow and peak rainfall intensity, Peak I/ I Coefficient = Peak I/I Flow / (Peak Rainfall Intensity over Tc * Catchment Area) 8 Hourly Wet‐Weather Peaking Factor: The ratio of peak hourly wet‐weather measured flow and average dry‐weather flow, Wet‐Weather Peaking Factor = Peak Hourly Wet‐Weather Measured Flow / Average Dry-Weather Flow 9 Instantaneous Wet‐Weather Peaking Factor: The ratio of peak wet‐weather measured flow and average dry‐weather flow, Wet‐Weather Peaking Factor = Peak Wet‐Weather Measured Flow / Average Dry-Weather Flow 2
1381 Civica Infrastructure Inc. www.civi.ca
Civica Infrastructures Inc. Kawartha Lakes Flow Monitoring Report
Appendix - A June 03, 2024
I/I Analysis Graph Station: 6-5
1382 Civica Infrastructure Inc. www.civi.ca
Civica Infrastructures Inc. Kawartha Lakes Flow Monitoring Report
Appendix - A June 03, 2024
Infiltration/Inflow Event Analysis Station: 6-5 Aug 17, 2022 03:20 – Aug 18, 2022 05:10, Total Precipitation: 17.50 mm (48,177,500.00 L) Station Details
Storm Details
Catchment Area
275.30 ha
Total Precipitation
17.50 mm (48,177,500.00 L)
Duration of Storm
1.83 hr
Time of Concentration (Tc) 1
60 min
Peak Precipitation Intensity Over Tc 2
14.80 mm/hr
Return Period over Tc 3
< 2 Yr
Measured Flow
I/I Flow
Time of Peak Measured Flow
Aug 17, 2022 16:00
Time of Peak I/I Flow (TD)
Aug 17, 2022 16:00
Estimated Dry Weather Flow at TD
17.15 L/s
Peak Measured Flow
54.41 L/s
Peak I/I Flow 4
37.26 L/s
Peak I/I Rate 5
0.14 L/s/ha
Peak Measured Depth
167.00 mm
Total I/I Flow Volume during event
178,596.30 L
Volumetric Coefficient (Cv%) 6
0.37%
Total Measured Flow Volume during Event
896,330.50 L
Peak I/I Coefficient 7
0.0033
Hourly Wet-Weather Peaking Factor 8
2.93
Instantaneous Wet-Weather Peaking Factor 9
3.80
1
Time of Concentration (Tc): The estimated time for the flow to travel from the furthest point in the upstream area to the point of monitoring, assume flow is travelling at 1.00 m/s Peak Precipitation Intensity Over Tc: The peak rainfall intensity for the duration of the storm with the time interval defined by time of concentration 3 Return Period over Tc: The estimated time to elapse before a storm of equal or greater intensity will likely occur again, based on design storm criteria 4 Peak I/I Flow: The greatest difference captured between measured flow and estimated dry weather flow, Peak I/I Flow = Maximum (Measured Flow – Estimated Dry Weather Flow) 5 Peak I/I Rate: A normalized peak I/I flow based on catchment area size, Peak I/I Rate = Peak I/I Flow / Catchment Area 6 Volumetric Coefficient (Cv%): The ratio of total I/I volume and total rainfall volume, Cv% = Total I/I Flow Volume / Total Precipitation Volume * 100% 7 Peak I/ I Coefficient: The ratio of peak I/I flow and peak rainfall intensity, Peak I/ I Coefficient = Peak I/I Flow / (Peak Rainfall Intensity over Tc * Catchment Area) 8 Hourly Wet‐Weather Peaking Factor: The ratio of peak hourly wet‐weather measured flow and average dry‐weather flow, Wet‐Weather Peaking Factor = Peak Hourly Wet‐Weather Measured Flow / Average Dry-Weather Flow 9 Instantaneous Wet‐Weather Peaking Factor: The ratio of peak wet‐weather measured flow and average dry‐weather flow, Wet‐Weather Peaking Factor = Peak Wet‐Weather Measured Flow / Average Dry-Weather Flow 2
1383 Civica Infrastructure Inc. www.civi.ca
Civica Infrastructures Inc. Kawartha Lakes Flow Monitoring Report
Appendix - A June 03, 2024
I/I Analysis Graph Station: 6-5
1384 Civica Infrastructure Inc. www.civi.ca
Civica Infrastructures Inc. Kawartha Lakes Flow Monitoring Report
Appendix - A June 03, 2024
Infiltration/Inflow Event Analysis Station: 6-5 Aug 21, 2022 09:50 – Aug 23, 2022 16:20, Total Precipitation: 17.50 mm (48,177,500.00 L) Station Details
Storm Details
Catchment Area
275.30 ha
Total Precipitation
17.50 mm (48,177,500.00 L)
Duration of Storm
30.50 hr
Time of Concentration (Tc) 1
60 min
Peak Precipitation Intensity Over Tc 2
7.00 mm/hr
Return Period over Tc 3
< 2 Yr
Measured Flow
I/I Flow
Time of Peak Measured Flow
Aug 22, 2022 14:00
Time of Peak I/I Flow (TD)
Aug 22, 2022 00:20
Estimated Dry Weather Flow at TD
11.94 L/s
Peak Measured Flow
27.67 L/s
Peak I/I Flow 4
12.73 L/s
Peak I/I Rate 5
0.05 L/s/ha
Peak Measured Depth
123.00 mm
Total I/I Flow Volume during event
341,134.90 L
Volumetric Coefficient (Cv%) 6
0.71%
Total Measured Flow Volume during Event
2,782,380.20 L
Peak I/I Coefficient 7
0.0024
Hourly Wet-Weather Peaking Factor 8
1.49
Instantaneous Wet-Weather Peaking Factor 9
1.74
1
Time of Concentration (Tc): The estimated time for the flow to travel from the furthest point in the upstream area to the point of monitoring, assume flow is travelling at 1.00 m/s Peak Precipitation Intensity Over Tc: The peak rainfall intensity for the duration of the storm with the time interval defined by time of concentration 3 Return Period over Tc: The estimated time to elapse before a storm of equal or greater intensity will likely occur again, based on design storm criteria 4 Peak I/I Flow: The greatest difference captured between measured flow and estimated dry weather flow, Peak I/I Flow = Maximum (Measured Flow – Estimated Dry Weather Flow) 5 Peak I/I Rate: A normalized peak I/I flow based on catchment area size, Peak I/I Rate = Peak I/I Flow / Catchment Area 6 Volumetric Coefficient (Cv%): The ratio of total I/I volume and total rainfall volume, Cv% = Total I/I Flow Volume / Total Precipitation Volume * 100% 7 Peak I/ I Coefficient: The ratio of peak I/I flow and peak rainfall intensity, Peak I/ I Coefficient = Peak I/I Flow / (Peak Rainfall Intensity over Tc * Catchment Area) 8 Hourly Wet‐Weather Peaking Factor: The ratio of peak hourly wet‐weather measured flow and average dry‐weather flow, Wet‐Weather Peaking Factor = Peak Hourly Wet‐Weather Measured Flow / Average Dry-Weather Flow 9 Instantaneous Wet‐Weather Peaking Factor: The ratio of peak wet‐weather measured flow and average dry‐weather flow, Wet‐Weather Peaking Factor = Peak Wet‐Weather Measured Flow / Average Dry-Weather Flow 2
1385 Civica Infrastructure Inc. www.civi.ca
Civica Infrastructures Inc. Kawartha Lakes Flow Monitoring Report
Appendix - A June 03, 2024
I/I Analysis Graph Station: 6-5
1386 Civica Infrastructure Inc. www.civi.ca
Civica Infrastructures Inc. Kawartha Lakes Flow Monitoring Report
Appendix - A June 03, 2024
Infiltration/Inflow Event Analysis Station: 6-5 Aug 25, 2022 01:30 – Aug 26, 2022 10:05, Total Precipitation: 16.25 mm (44,736,250.00 L) Station Details
Storm Details
Catchment Area
275.30 ha
Total Precipitation
16.25 mm (44,736,250.00 L)
Duration of Storm
8.58 hr
Time of Concentration (Tc) 1
60 min
Peak Precipitation Intensity Over Tc 2
14.20 mm/hr
Return Period over Tc 3
< 2 Yr
Measured Flow
I/I Flow
Time of Peak Measured Flow
Aug 25, 2022 19:10
Time of Peak I/I Flow (TD)
Aug 25, 2022 19:10
Estimated Dry Weather Flow at TD
18.17 L/s
Peak Measured Flow
46.30 L/s
Peak I/I Flow 4
28.13 L/s
Peak I/I Rate 5
0.10 L/s/ha
Peak Measured Depth
161.00 mm
Total I/I Flow Volume during event
317,960.00 L
Volumetric Coefficient (Cv%) 6
0.71%
Total Measured Flow Volume during Event
1,513,565.00 L
Peak I/I Coefficient 7
0.0026
Hourly Wet-Weather Peaking Factor 8
2.45
Instantaneous Wet-Weather Peaking Factor 9
2.88
1
Time of Concentration (Tc): The estimated time for the flow to travel from the furthest point in the upstream area to the point of monitoring, assume flow is travelling at 1.00 m/s Peak Precipitation Intensity Over Tc: The peak rainfall intensity for the duration of the storm with the time interval defined by time of concentration 3 Return Period over Tc: The estimated time to elapse before a storm of equal or greater intensity will likely occur again, based on design storm criteria 4 Peak I/I Flow: The greatest difference captured between measured flow and estimated dry weather flow, Peak I/I Flow = Maximum (Measured Flow – Estimated Dry Weather Flow) 5 Peak I/I Rate: A normalized peak I/I flow based on catchment area size, Peak I/I Rate = Peak I/I Flow / Catchment Area 6 Volumetric Coefficient (Cv%): The ratio of total I/I volume and total rainfall volume, Cv% = Total I/I Flow Volume / Total Precipitation Volume * 100% 7 Peak I/ I Coefficient: The ratio of peak I/I flow and peak rainfall intensity, Peak I/ I Coefficient = Peak I/I Flow / (Peak Rainfall Intensity over Tc * Catchment Area) 8 Hourly Wet‐Weather Peaking Factor: The ratio of peak hourly wet‐weather measured flow and average dry‐weather flow, Wet‐Weather Peaking Factor = Peak Hourly Wet‐Weather Measured Flow / Average Dry-Weather Flow 9 Instantaneous Wet‐Weather Peaking Factor: The ratio of peak wet‐weather measured flow and average dry‐weather flow, Wet‐Weather Peaking Factor = Peak Wet‐Weather Measured Flow / Average Dry-Weather Flow 2
1387 Civica Infrastructure Inc. www.civi.ca
Civica Infrastructures Inc. Kawartha Lakes Flow Monitoring Report
Appendix - A June 03, 2024
I/I Analysis Graph Station: 6-5
1388 Civica Infrastructure Inc. www.civi.ca
Civica Infrastructures Inc. Kawartha Lakes Flow Monitoring Report
Appendix - A June 03, 2024
Infiltration/Inflow Event Analysis Station: 6-5 Aug 29, 2022 01:40 – Aug 30, 2022 04:10, Total Precipitation: 29.00 mm (79,837,000.00 L) Station Details
Storm Details
Catchment Area
275.30 ha
Total Precipitation
29.00 mm (79,837,000.00 L)
Duration of Storm
2.50 hr
Time of Concentration (Tc) 1
60 min
Peak Precipitation Intensity Over Tc 2
21.00 mm/hr
Return Period over Tc 3
< 2 Yr
Measured Flow
I/I Flow
Time of Peak Measured Flow
Aug 29, 2022 15:25
Time of Peak I/I Flow (TD)
Aug 29, 2022 15:25
Estimated Dry Weather Flow at TD
17.62 L/s
Peak Measured Flow
92.22 L/s
Peak I/I Flow 4
74.60 L/s
Peak I/I Rate 5
0.27 L/s/ha
Peak Measured Depth
219.00 mm
Total I/I Flow Volume during event
654,713.00 L
Volumetric Coefficient (Cv%) 6
0.82%
Total Measured Flow Volume during Event
1,483,290.60 L
Peak I/I Coefficient 7
0.0047
Hourly Wet-Weather Peaking Factor 8
4.39
Instantaneous Wet-Weather Peaking Factor 9
5.84
1
Time of Concentration (Tc): The estimated time for the flow to travel from the furthest point in the upstream area to the point of monitoring, assume flow is travelling at 1.00 m/s Peak Precipitation Intensity Over Tc: The peak rainfall intensity for the duration of the storm with the time interval defined by time of concentration 3 Return Period over Tc: The estimated time to elapse before a storm of equal or greater intensity will likely occur again, based on design storm criteria 4 Peak I/I Flow: The greatest difference captured between measured flow and estimated dry weather flow, Peak I/I Flow = Maximum (Measured Flow – Estimated Dry Weather Flow) 5 Peak I/I Rate: A normalized peak I/I flow based on catchment area size, Peak I/I Rate = Peak I/I Flow / Catchment Area 6 Volumetric Coefficient (Cv%): The ratio of total I/I volume and total rainfall volume, Cv% = Total I/I Flow Volume / Total Precipitation Volume * 100% 7 Peak I/ I Coefficient: The ratio of peak I/I flow and peak rainfall intensity, Peak I/ I Coefficient = Peak I/I Flow / (Peak Rainfall Intensity over Tc * Catchment Area) 8 Hourly Wet‐Weather Peaking Factor: The ratio of peak hourly wet‐weather measured flow and average dry‐weather flow, Wet‐Weather Peaking Factor = Peak Hourly Wet‐Weather Measured Flow / Average Dry-Weather Flow 9 Instantaneous Wet‐Weather Peaking Factor: The ratio of peak wet‐weather measured flow and average dry‐weather flow, Wet‐Weather Peaking Factor = Peak Wet‐Weather Measured Flow / Average Dry-Weather Flow 2
1389 Civica Infrastructure Inc. www.civi.ca
Civica Infrastructures Inc. Kawartha Lakes Flow Monitoring Report
Appendix - A June 03, 2024
I/I Analysis Graph Station: 6-5
1390 Civica Infrastructure Inc. www.civi.ca
Civica Infrastructures Inc. Kawartha Lakes Flow Monitoring Report
Appendix - A June 03, 2024
Infiltration/Inflow Event Analysis Station: 6-5 Sep 11, 2022 15:50 – Sep 13, 2022 16:55, Total Precipitation: 21.75 mm (59,877,750.00 L) Station Details
Storm Details
Catchment Area
275.30 ha
Total Precipitation
21.75 mm (59,877,750.00 L)
Duration of Storm
25.08 hr
Time of Concentration (Tc) 1
60 min
Peak Precipitation Intensity Over Tc 2
6.20 mm/hr
Return Period over Tc 3
< 2 Yr
Measured Flow
I/I Flow
Time of Peak Measured Flow
Sep 12, 2022 08:00
Time of Peak I/I Flow (TD)
Sep 12, 2022 08:00
Estimated Dry Weather Flow at TD
23.81 L/s
Peak Measured Flow
34.11 L/s
Peak I/I Flow 4
10.31 L/s
Peak I/I Rate 5
0.04 L/s/ha
Peak Measured Depth
140.00 mm
Total I/I Flow Volume during event
123,514.40 L
Volumetric Coefficient (Cv%) 6
0.21%
Total Measured Flow Volume during Event
2,559,729.70 L
Peak I/I Coefficient 7
0.0022
Hourly Wet-Weather Peaking Factor 8
1.61
Instantaneous Wet-Weather Peaking Factor 9
1.87
1
Time of Concentration (Tc): The estimated time for the flow to travel from the furthest point in the upstream area to the point of monitoring, assume flow is travelling at 1.00 m/s Peak Precipitation Intensity Over Tc: The peak rainfall intensity for the duration of the storm with the time interval defined by time of concentration 3 Return Period over Tc: The estimated time to elapse before a storm of equal or greater intensity will likely occur again, based on design storm criteria 4 Peak I/I Flow: The greatest difference captured between measured flow and estimated dry weather flow, Peak I/I Flow = Maximum (Measured Flow – Estimated Dry Weather Flow) 5 Peak I/I Rate: A normalized peak I/I flow based on catchment area size, Peak I/I Rate = Peak I/I Flow / Catchment Area 6 Volumetric Coefficient (Cv%): The ratio of total I/I volume and total rainfall volume, Cv% = Total I/I Flow Volume / Total Precipitation Volume * 100% 7 Peak I/ I Coefficient: The ratio of peak I/I flow and peak rainfall intensity, Peak I/ I Coefficient = Peak I/I Flow / (Peak Rainfall Intensity over Tc * Catchment Area) 8 Hourly Wet‐Weather Peaking Factor: The ratio of peak hourly wet‐weather measured flow and average dry‐weather flow, Wet‐Weather Peaking Factor = Peak Hourly Wet‐Weather Measured Flow / Average Dry-Weather Flow 9 Instantaneous Wet‐Weather Peaking Factor: The ratio of peak wet‐weather measured flow and average dry‐weather flow, Wet‐Weather Peaking Factor = Peak Wet‐Weather Measured Flow / Average Dry-Weather Flow 2
1391 Civica Infrastructure Inc. www.civi.ca
Civica Infrastructures Inc. Kawartha Lakes Flow Monitoring Report
Appendix - A June 03, 2024
I/I Analysis Graph Station: 6-5
1392 Civica Infrastructure Inc. www.civi.ca
Civica Infrastructures Inc. Kawartha Lakes Flow Monitoring Report
Appendix - A June 03, 2024
Infiltration/Inflow Event Analysis Station: 6-5 Sep 17, 2022 19:35 – Sep 19, 2022 01:10, Total Precipitation: 24.50 mm (67,448,500.00 L) Station Details
Storm Details
Catchment Area
275.30 ha
Total Precipitation
24.50 mm (67,448,500.00 L)
Duration of Storm
5.58 hr
Time of Concentration (Tc) 1
60 min
Peak Precipitation Intensity Over Tc 2
14.00 mm/hr
Return Period over Tc 3
< 2 Yr
Measured Flow
I/I Flow
Time of Peak Measured Flow
Sep 18, 2022 12:35
Time of Peak I/I Flow (TD)
Sep 18, 2022 12:35
Estimated Dry Weather Flow at TD
20.69 L/s
Peak Measured Flow
44.71 L/s
Peak I/I Flow 4
24.02 L/s
Peak I/I Rate 5
0.09 L/s/ha
Peak Measured Depth
157.00 mm
Total I/I Flow Volume during event
654,634.50 L
Volumetric Coefficient (Cv%) 6
0.97%
Total Measured Flow Volume during Event
1,847,362.90 L
Peak I/I Coefficient 7
0.0022
Hourly Wet-Weather Peaking Factor 8
2.23
Instantaneous Wet-Weather Peaking Factor 9
2.38
1
Time of Concentration (Tc): The estimated time for the flow to travel from the furthest point in the upstream area to the point of monitoring, assume flow is travelling at 1.00 m/s Peak Precipitation Intensity Over Tc: The peak rainfall intensity for the duration of the storm with the time interval defined by time of concentration 3 Return Period over Tc: The estimated time to elapse before a storm of equal or greater intensity will likely occur again, based on design storm criteria 4 Peak I/I Flow: The greatest difference captured between measured flow and estimated dry weather flow, Peak I/I Flow = Maximum (Measured Flow – Estimated Dry Weather Flow) 5 Peak I/I Rate: A normalized peak I/I flow based on catchment area size, Peak I/I Rate = Peak I/I Flow / Catchment Area 6 Volumetric Coefficient (Cv%): The ratio of total I/I volume and total rainfall volume, Cv% = Total I/I Flow Volume / Total Precipitation Volume * 100% 7 Peak I/ I Coefficient: The ratio of peak I/I flow and peak rainfall intensity, Peak I/ I Coefficient = Peak I/I Flow / (Peak Rainfall Intensity over Tc * Catchment Area) 8 Hourly Wet‐Weather Peaking Factor: The ratio of peak hourly wet‐weather measured flow and average dry‐weather flow, Wet‐Weather Peaking Factor = Peak Hourly Wet‐Weather Measured Flow / Average Dry-Weather Flow 9 Instantaneous Wet‐Weather Peaking Factor: The ratio of peak wet‐weather measured flow and average dry‐weather flow, Wet‐Weather Peaking Factor = Peak Wet‐Weather Measured Flow / Average Dry-Weather Flow 2
1393 Civica Infrastructure Inc. www.civi.ca
Civica Infrastructures Inc. Kawartha Lakes Flow Monitoring Report
Appendix - A June 03, 2024
I/I Analysis Graph Station: 6-5
1394 Civica Infrastructure Inc. www.civi.ca
Civica Infrastructures Inc. Kawartha Lakes Flow Monitoring Report
Appendix - A June 03, 2024
Infiltration/Inflow Event Analysis Station: 6-5 Oct 12, 2022 08:40 – Oct 13, 2022 23:55, Total Precipitation: 20.75 mm (57,124,750.00 L) Station Details
Storm Details
Catchment Area
275.30 ha
Total Precipitation
20.75 mm (57,124,750.00 L)
Duration of Storm
15.25 hr
Time of Concentration (Tc) 1
60 min
Peak Precipitation Intensity Over Tc 2
5.00 mm/hr
Return Period over Tc 3
< 2 Yr
Measured Flow
I/I Flow
Time of Peak Measured Flow
Oct 13, 2022 09:30
Time of Peak I/I Flow (TD)
Oct 13, 2022 09:30
Estimated Dry Weather Flow at TD
22.04 L/s
Peak Measured Flow
32.01 L/s
Peak I/I Flow 4
9.96 L/s
Peak I/I Rate 5
0.04 L/s/ha
Peak Measured Depth
138.00 mm
Total I/I Flow Volume during event
250,150.00 L
Volumetric Coefficient (Cv%) 6
0.44%
Total Measured Flow Volume during Event
1,982,372.00 L
Peak I/I Coefficient 7
0.0026
Hourly Wet-Weather Peaking Factor 8
1.68
Instantaneous Wet-Weather Peaking Factor 9
1.82
1
Time of Concentration (Tc): The estimated time for the flow to travel from the furthest point in the upstream area to the point of monitoring, assume flow is travelling at 1.00 m/s Peak Precipitation Intensity Over Tc: The peak rainfall intensity for the duration of the storm with the time interval defined by time of concentration 3 Return Period over Tc: The estimated time to elapse before a storm of equal or greater intensity will likely occur again, based on design storm criteria 4 Peak I/I Flow: The greatest difference captured between measured flow and estimated dry weather flow, Peak I/I Flow = Maximum (Measured Flow – Estimated Dry Weather Flow) 5 Peak I/I Rate: A normalized peak I/I flow based on catchment area size, Peak I/I Rate = Peak I/I Flow / Catchment Area 6 Volumetric Coefficient (Cv%): The ratio of total I/I volume and total rainfall volume, Cv% = Total I/I Flow Volume / Total Precipitation Volume * 100% 7 Peak I/ I Coefficient: The ratio of peak I/I flow and peak rainfall intensity, Peak I/ I Coefficient = Peak I/I Flow / (Peak Rainfall Intensity over Tc * Catchment Area) 8 Hourly Wet‐Weather Peaking Factor: The ratio of peak hourly wet‐weather measured flow and average dry‐weather flow, Wet‐Weather Peaking Factor = Peak Hourly Wet‐Weather Measured Flow / Average Dry-Weather Flow 9 Instantaneous Wet‐Weather Peaking Factor: The ratio of peak wet‐weather measured flow and average dry‐weather flow, Wet‐Weather Peaking Factor = Peak Wet‐Weather Measured Flow / Average Dry-Weather Flow 2
1395 Civica Infrastructure Inc. www.civi.ca
Civica Infrastructures Inc. Kawartha Lakes Flow Monitoring Report
Appendix - A June 03, 2024
Activity Log Station: 6-5 Date Time
Type
Purpose of Visit
25-Nov-2021 03:44:00 PM
Installation Log
INSTALL
02-Dec-2021 11:45:00 AM
14-Dec-2021 04:13:00 PM
10-Feb-2022 10:00:00 AM
Maintenance Log
Maintenance Log
Maintenance Log
Comment
Calibration Measurement Yes
Calibration
Data downloaded Debris cleared Telemetry sent Ensured manual and sensor readings are satisfactory before leaving site Had to reconfigure logger - battery reading was wonky
Yes
CALIBRATION
DATA DOWNLOADED SITE CALIBRATED DEBRIS CLEARED SENT TELEMETRY ON SITE - ANTENNA WAS BROKEN. WE REPLACED IT WITH THE OLD ANTENNA AND HUNG IT ON THE CHIMNEY
Yes
CALIBRATION
Data downloaded Debris cleared Telemetry sent Ensured manual and sensor readings are satisfactory before leaving site Antenna drilled
Yes
Data downloaded site calibrated telemetry sent
Yes
17-Mar-2022 03:11:00 PM
Maintenance Log
calibration
25-May-2022 10:22:00 AM
Maintenance Log
Calibration
Yes
08-Jun-2022 12:39:00 PM
Maintenance Log
calibration
Yes
03-Aug-2022 08:26:00 AM
25-Aug-2022 08:27:00 AM
22-Sep-2022 09:02:00 AM
04-Oct-2022 09:41:00 AM
Maintenance Log
Maintenance Log
Maintenance Log
Maintenance Log
CALIBRATION
DATA DOWNLOADED, SITE CALIBRATED, TELEMETRY SENT AND CHECKED, PHOTOS TAKEN
Yes
CALIBRATION
DATA DOWNLOADED, SITE CALIBRATED TELEMETRY SENT PHOTOS TAKEN VIDEO TAKEN
Yes
CALIBRATION
DATA DOWNLOADED, SITE CALIBRATED, TELEMETRY SENT PHOTO AND VIDEO TAKEN BATTERY SWAPPED
Yes
CALIBRATION
DATA DOWNLOADED, SITE CALIBRATED, DEBRIS CLEARED
Yes
1396 Civica Infrastructure Inc. www.civi.ca
Civica Infrastructures Inc. Kawartha Lakes Flow Monitoring Report Date Time
Appendix - A June 03, 2024 Type
Purpose of Visit
Comment
Calibration Measurement
TELEMETRY SENT AND CHECKED, PHOTO AND VIDEO TAKEN
04-Oct-2022 09:41:00 AM
Maintenance Log
DATA DOWNLOADED, SITE CALIBRATED, DEBRIS CLEARED TELEMETRY SENT AND CHECKED, PHOTO AND VIDEO TAKEN
CALIBRATION
1397 Civica Infrastructure Inc. www.civi.ca
Yes
Civica Infrastructures Inc. Kawartha Lakes Flow Monitoring Report
Appendix - A June 03, 2024
Aggregate Data Station: 6-6
Level Date From
Date To
Days
Min (m)
Avg (m)
Max (m)
Count
Time of Min1
Time of Max1
Feb 07, 2022
Nov 04, 2022
270
0.05
0.11
0.19
77,586
Wed Feb 16, 2022 04:20
Thu Jun 23, 2022 14:35
Velocity Date From
Date To
Days
Min (m/s)
Avg (m/s)
Max (m/s)
Count
Time of Min1
Time of Max1
Feb 07, 2022
Nov 04, 2022
270
0.10
0.48
0.92
77,595
Wed Jun 08, 2022 01:55
Thu Mar 17, 2022 20:30
Flow Date From
Date To
Days
Min (L/s)
Avg (L/s)
Max (L/s)
Total Volume (1,000,000 L)
Count
Time of Min1
Time of Max1
Feb 07, 2022
Nov 04, 2022
270
1.17
11.07
35.55
257.74
77,576
Sat Aug 06, 2022 03:15
Sat Mar 19, 2022 15:15
Precipitation
1
Date From
Date To
Days
Min (mm)
Avg (mm)
Max (mm)
Sum (mm)
Count
Time of Min1
Time of Max1
Feb 07, 2022
Nov 04, 2022
261
0.00
0.01
9.75
601.45
74,610
Mon Feb 07, 2022 00:00
Mon Jul 25, 2022 00:00
Time of Min and Time of Max will be displayed by first occurrence
1398 Civica Infrastructure Inc. www.civi.ca
Civica Infrastructures Inc. Kawartha Lakes Flow Monitoring Report
Appendix - A June 03, 2024
Sanitary Report Station: 6-6
1
Average Dry Weather Flow (L/s)
Average Dry Weather Flow (L/c/d)
Average Daily Minimum Dry Weather Flow (L/s)
Average Daily Peak Dry Weather Flow (L/s)
10.328
708.190
4.863
17.501
Peaking Factor
Groundwater Infiltration (L/s)1
Groundwater Infiltration (L/ha/d)
% of GWI in Average DWF
1.695
4.134
2,279.319
40.027
Groundwater infiltration (GWI) is assumed as 85% of the daily minimum flow averaged over the monitoring period
1399 Civica Infrastructure Inc. www.civi.ca
Civica Infrastructures Inc. Kawartha Lakes Flow Monitoring Report
Appendix - A June 03, 2024
Data Chart Station: 6-6 Feb 07, 2022 – Feb 28, 2022
1400 Civica Infrastructure Inc. www.civi.ca
Civica Infrastructures Inc. Kawartha Lakes Flow Monitoring Report
Appendix - A June 03, 2024
Data Chart Station: 6-6 Mar 01, 2022 – Mar 31, 2022
1401 Civica Infrastructure Inc. www.civi.ca
Civica Infrastructures Inc. Kawartha Lakes Flow Monitoring Report
Appendix - A June 03, 2024
Data Chart Station: 6-6 Apr 01, 2022 – Apr 30, 2022
1402 Civica Infrastructure Inc. www.civi.ca
Civica Infrastructures Inc. Kawartha Lakes Flow Monitoring Report
Appendix - A June 03, 2024
Data Chart Station: 6-6 May 01, 2022 – May 31, 2022
1403 Civica Infrastructure Inc. www.civi.ca
Civica Infrastructures Inc. Kawartha Lakes Flow Monitoring Report
Appendix - A June 03, 2024
Data Chart Station: 6-6 Jun 01, 2022 – Jun 30, 2022
1404 Civica Infrastructure Inc. www.civi.ca
Civica Infrastructures Inc. Kawartha Lakes Flow Monitoring Report
Appendix - A June 03, 2024
Data Chart Station: 6-6 Jul 01, 2022 – Jul 31, 2022
1405 Civica Infrastructure Inc. www.civi.ca
Civica Infrastructures Inc. Kawartha Lakes Flow Monitoring Report
Appendix - A June 03, 2024
Data Chart Station: 6-6 Aug 01, 2022 – Aug 31, 2022
1406 Civica Infrastructure Inc. www.civi.ca
Civica Infrastructures Inc. Kawartha Lakes Flow Monitoring Report
Appendix - A June 03, 2024
Data Chart Station: 6-6 Sep 01, 2022 – Sep 30, 2022
1407 Civica Infrastructure Inc. www.civi.ca
Civica Infrastructures Inc. Kawartha Lakes Flow Monitoring Report
Appendix - A June 03, 2024
Data Chart Station: 6-6 Oct 01, 2022 – Oct 31, 2022
1408 Civica Infrastructure Inc. www.civi.ca
Civica Infrastructures Inc. Kawartha Lakes Flow Monitoring Report
Appendix - A June 03, 2024
Data Chart Station: 6-6 Nov 01, 2022 – Nov 04, 2022
1409 Civica Infrastructure Inc. www.civi.ca
Civica Infrastructures Inc. Kawartha Lakes Flow Monitoring Report
Appendix - A June 03, 2024
I/I Analysis Table
1
Event1
Total Precipitation (mm)
Duration (hours)
Peak Intensity Over Tc at Station (mm/hr)
Feb 16, 2022
18.00
12.67
Apr 13, 2022
17.25
May 26, 2022
6-6 Measured Peak Flow (L/s)
Peak I/I Flow (L/s)
Peak I/I Rate (L/s/ha)
Volumetric Runoff Coefficient (CV%)
Peaking Factor (PF)
3.00
19.79
10.39
0.07
1.50 %
1.17
28.67
8.10
19.35
1.69
0.01
0.05 %
0.12
20.25
27.50
10.70
19.78
7.19
0.05
0.09 %
1.08
Jun 06, 2022
30.00
32.42
8.60
16.35
6.00
0.04
0.05 %
1.01
Jun 11, 2022
41.50
25.08
23.60
27.59
18.05
0.12
1.39 %
1.99
Jul 12, 2022
15.50
7.75
19.70
14.69
6.14
0.04
0.32 %
0.64
Jul 18, 2022
21.50
43.25
1.30
18.21
7.89
0.05
0.67 %
0.88
Aug 17, 2022
17.50
1.83
25.30
28.46
19.11
0.12
0.18 %
2.77
Aug 21, 2022
17.50
30.50
9.40
20.71
8.16
0.05
0.81 %
0.90
Aug 25, 2022
16.25
8.58
22.30
22.93
11.15
0.07
1.20 %
1.17
Aug 29, 2022
29.00
2.50
35.60
22.74
12.17
0.08
0.34 %
1.35
Sep 12, 2022
21.75
25.08
7.30
22.23
7.64
0.05
0.60 %
0.67
Sep 18, 2022
24.50
5.58
15.40
22.95
12.34
0.08
0.89 %
1.18
Oct 12, 2022
20.75
15.25
6.90
18.17
4.12
0.03
0.13 %
0.44
Average
22.23
19.05
14.09
21.00
9.43
0.06
0.59 %
1.10
Maximum
41.50
43.25
35.60
28.46
19.11
0.12
1.50 %
2.77
Flow KPIs
Measured Storms
Station: 6-6
An event is a storm with a minimum volume of 15mm and a minimum inter-event dry period of 12 hours
1410 Civica Infrastructure Inc. www.civi.ca
Civica Infrastructures Inc. Kawartha Lakes Flow Monitoring Report
Appendix - A June 03, 2024
I/I Analysis Graph Station: 6-6
1411 Civica Infrastructure Inc. www.civi.ca
Civica Infrastructures Inc. Kawartha Lakes Flow Monitoring Report
Appendix - A June 03, 2024
Infiltration/Inflow Event Analysis Station: 6-6 Feb 16, 2022 11:00 – Feb 17, 2022 23:40, Total Precipitation: 18.00 mm (28,206,000.00 L) Station Details
Storm Details
Catchment Area
156.70 ha
Total Precipitation
18.00 mm (28,206,000.00 L)
Duration of Storm
12.67 hr
Time of Concentration (Tc) 1
35 min
Peak Precipitation Intensity Over Tc 2
3.00 mm/hr
Return Period over Tc 3
< 2 Yr
Measured Flow
I/I Flow
Time of Peak Measured Flow
Feb 17, 2022 10:20
Time of Peak I/I Flow (TD)
Feb 17, 2022 06:55
Estimated Dry Weather Flow at TD
8.79 L/s
Peak Measured Flow
19.79 L/s
Peak I/I Flow 4
10.39 L/s
Peak I/I Rate 5
0.07 L/s/ha
Peak Measured Depth
132.57 mm
Total I/I Flow Volume during event
421,812.80 L
Volumetric Coefficient (Cv%) 6
1.50%
Total Measured Flow Volume during Event
1,214,579.90 L
Peak I/I Coefficient 7
0.0080
Hourly Wet-Weather Peaking Factor 8
2.07
Instantaneous Wet-Weather Peaking Factor 9
2.22
1
Time of Concentration (Tc): The estimated time for the flow to travel from the furthest point in the upstream area to the point of monitoring, assume flow is travelling at 1.00 m/s Peak Precipitation Intensity Over Tc: The peak rainfall intensity for the duration of the storm with the time interval defined by time of concentration 3 Return Period over Tc: The estimated time to elapse before a storm of equal or greater intensity will likely occur again, based on design storm criteria 4 Peak I/I Flow: The greatest difference captured between measured flow and estimated dry weather flow, Peak I/I Flow = Maximum (Measured Flow – Estimated Dry Weather Flow) 5 Peak I/I Rate: A normalized peak I/I flow based on catchment area size, Peak I/I Rate = Peak I/I Flow / Catchment Area 6 Volumetric Coefficient (Cv%): The ratio of total I/I volume and total rainfall volume, Cv% = Total I/I Flow Volume / Total Precipitation Volume * 100% 7 Peak I/ I Coefficient: The ratio of peak I/I flow and peak rainfall intensity, Peak I/ I Coefficient = Peak I/I Flow / (Peak Rainfall Intensity over Tc * Catchment Area) 8 Hourly Wet‐Weather Peaking Factor: The ratio of peak hourly wet‐weather measured flow and average dry‐weather flow, Wet‐Weather Peaking Factor = Peak Hourly Wet‐Weather Measured Flow / Average Dry-Weather Flow 9 Instantaneous Wet‐Weather Peaking Factor: The ratio of peak wet‐weather measured flow and average dry‐weather flow, Wet‐Weather Peaking Factor = Peak Wet‐Weather Measured Flow / Average Dry-Weather Flow 2
1412 Civica Infrastructure Inc. www.civi.ca
Civica Infrastructures Inc. Kawartha Lakes Flow Monitoring Report
Appendix - A June 03, 2024
I/I Analysis Graph Station: 6-6
1413 Civica Infrastructure Inc. www.civi.ca
Civica Infrastructures Inc. Kawartha Lakes Flow Monitoring Report
Appendix - A June 03, 2024
Infiltration/Inflow Event Analysis Station: 6-6 Apr 12, 2022 17:25 – Apr 14, 2022 22:05, Total Precipitation: 17.25 mm (27,030,750.00 L) Station Details
Storm Details
Catchment Area
156.70 ha
Total Precipitation
17.25 mm (27,030,750.00 L)
Duration of Storm
28.67 hr
Time of Concentration (Tc) 1
35 min
Peak Precipitation Intensity Over Tc 2
8.10 mm/hr
Return Period over Tc 3
< 2 Yr
Measured Flow
I/I Flow
Time of Peak Measured Flow
Apr 14, 2022 07:10
Time of Peak I/I Flow (TD)
Apr 14, 2022 13:45
Estimated Dry Weather Flow at TD
15.48 L/s
Peak Measured Flow
19.35 L/s
Peak I/I Flow 4
1.69 L/s
Peak I/I Rate 5
0.01 L/s/ha
Peak Measured Depth
119.40 mm
Total I/I Flow Volume during event
12,291.30 L
Volumetric Coefficient (Cv%) 6
0.05%
Total Measured Flow Volume during Event
2,091,858.40 L
Peak I/I Coefficient 7
0.0005
Hourly Wet-Weather Peaking Factor 8
1.18
Instantaneous Wet-Weather Peaking Factor 9
1.36
1
Time of Concentration (Tc): The estimated time for the flow to travel from the furthest point in the upstream area to the point of monitoring, assume flow is travelling at 1.00 m/s Peak Precipitation Intensity Over Tc: The peak rainfall intensity for the duration of the storm with the time interval defined by time of concentration 3 Return Period over Tc: The estimated time to elapse before a storm of equal or greater intensity will likely occur again, based on design storm criteria 4 Peak I/I Flow: The greatest difference captured between measured flow and estimated dry weather flow, Peak I/I Flow = Maximum (Measured Flow – Estimated Dry Weather Flow) 5 Peak I/I Rate: A normalized peak I/I flow based on catchment area size, Peak I/I Rate = Peak I/I Flow / Catchment Area 6 Volumetric Coefficient (Cv%): The ratio of total I/I volume and total rainfall volume, Cv% = Total I/I Flow Volume / Total Precipitation Volume * 100% 7 Peak I/ I Coefficient: The ratio of peak I/I flow and peak rainfall intensity, Peak I/ I Coefficient = Peak I/I Flow / (Peak Rainfall Intensity over Tc * Catchment Area) 8 Hourly Wet‐Weather Peaking Factor: The ratio of peak hourly wet‐weather measured flow and average dry‐weather flow, Wet‐Weather Peaking Factor = Peak Hourly Wet‐Weather Measured Flow / Average Dry-Weather Flow 9 Instantaneous Wet‐Weather Peaking Factor: The ratio of peak wet‐weather measured flow and average dry‐weather flow, Wet‐Weather Peaking Factor = Peak Wet‐Weather Measured Flow / Average Dry-Weather Flow 2
1414 Civica Infrastructure Inc. www.civi.ca
Civica Infrastructures Inc. Kawartha Lakes Flow Monitoring Report
Appendix - A June 03, 2024
I/I Analysis Graph Station: 6-6
1415 Civica Infrastructure Inc. www.civi.ca
Civica Infrastructures Inc. Kawartha Lakes Flow Monitoring Report
Appendix - A June 03, 2024
Infiltration/Inflow Event Analysis Station: 6-6 May 26, 2022 07:30 – May 28, 2022 11:00, Total Precipitation: 20.25 mm (31,731,750.00 L) Station Details
Storm Details
Catchment Area
156.70 ha
Total Precipitation
20.25 mm (31,731,750.00 L)
Duration of Storm
27.50 hr
Time of Concentration (Tc) 1
35 min
Peak Precipitation Intensity Over Tc 2
10.70 mm/hr
Return Period over Tc 3
< 2 Yr
Measured Flow
I/I Flow
Time of Peak Measured Flow
May 28, 2022 09:10
Time of Peak I/I Flow (TD)
May 28, 2022 09:10
Estimated Dry Weather Flow at TD
12.59 L/s
Peak Measured Flow
19.78 L/s
Peak I/I Flow 4
7.19 L/s
Peak I/I Rate 5
0.05 L/s/ha
Peak Measured Depth
156.90 mm
Total I/I Flow Volume during event
29,091.10 L
Volumetric Coefficient (Cv%) 6
0.09%
Total Measured Flow Volume during Event
975,384.00 L
Peak I/I Coefficient 7
0.0015
Hourly Wet-Weather Peaking Factor 8
1.80
Instantaneous Wet-Weather Peaking Factor 9
2.98
1
Time of Concentration (Tc): The estimated time for the flow to travel from the furthest point in the upstream area to the point of monitoring, assume flow is travelling at 1.00 m/s Peak Precipitation Intensity Over Tc: The peak rainfall intensity for the duration of the storm with the time interval defined by time of concentration 3 Return Period over Tc: The estimated time to elapse before a storm of equal or greater intensity will likely occur again, based on design storm criteria 4 Peak I/I Flow: The greatest difference captured between measured flow and estimated dry weather flow, Peak I/I Flow = Maximum (Measured Flow – Estimated Dry Weather Flow) 5 Peak I/I Rate: A normalized peak I/I flow based on catchment area size, Peak I/I Rate = Peak I/I Flow / Catchment Area 6 Volumetric Coefficient (Cv%): The ratio of total I/I volume and total rainfall volume, Cv% = Total I/I Flow Volume / Total Precipitation Volume * 100% 7 Peak I/ I Coefficient: The ratio of peak I/I flow and peak rainfall intensity, Peak I/ I Coefficient = Peak I/I Flow / (Peak Rainfall Intensity over Tc * Catchment Area) 8 Hourly Wet‐Weather Peaking Factor: The ratio of peak hourly wet‐weather measured flow and average dry‐weather flow, Wet‐Weather Peaking Factor = Peak Hourly Wet‐Weather Measured Flow / Average Dry-Weather Flow 9 Instantaneous Wet‐Weather Peaking Factor: The ratio of peak wet‐weather measured flow and average dry‐weather flow, Wet‐Weather Peaking Factor = Peak Wet‐Weather Measured Flow / Average Dry-Weather Flow 2
1416 Civica Infrastructure Inc. www.civi.ca
Civica Infrastructures Inc. Kawartha Lakes Flow Monitoring Report
Appendix - A June 03, 2024
I/I Analysis Graph Station: 6-6
1417 Civica Infrastructure Inc. www.civi.ca
Civica Infrastructures Inc. Kawartha Lakes Flow Monitoring Report
Appendix - A June 03, 2024
Infiltration/Inflow Event Analysis Station: 6-6 Jun 05, 2022 18:20 – Jun 08, 2022 02:45, Total Precipitation: 30.00 mm (47,010,000.00 L) Station Details
Storm Details
Catchment Area
156.70 ha
Total Precipitation
30.00 mm (47,010,000.00 L)
Duration of Storm
32.42 hr
Time of Concentration (Tc) 1
35 min
Peak Precipitation Intensity Over Tc 2
8.60 mm/hr
Return Period over Tc 3
< 2 Yr
Measured Flow
I/I Flow
Time of Peak Measured Flow
Jun 07, 2022 18:35
Time of Peak I/I Flow (TD)
Jun 07, 2022 18:35
Estimated Dry Weather Flow at TD
10.35 L/s
Peak Measured Flow
16.35 L/s
Peak I/I Flow 4
6.00 L/s
Peak I/I Rate 5
0.04 L/s/ha
Peak Measured Depth
140.83 mm
Total I/I Flow Volume during event
25,239.00 L
Volumetric Coefficient (Cv%) 6
0.05%
Total Measured Flow Volume during Event
981,683.90 L
Peak I/I Coefficient 7
0.0016
Hourly Wet-Weather Peaking Factor 8
2.07
Instantaneous Wet-Weather Peaking Factor 9
2.74
1
Time of Concentration (Tc): The estimated time for the flow to travel from the furthest point in the upstream area to the point of monitoring, assume flow is travelling at 1.00 m/s Peak Precipitation Intensity Over Tc: The peak rainfall intensity for the duration of the storm with the time interval defined by time of concentration 3 Return Period over Tc: The estimated time to elapse before a storm of equal or greater intensity will likely occur again, based on design storm criteria 4 Peak I/I Flow: The greatest difference captured between measured flow and estimated dry weather flow, Peak I/I Flow = Maximum (Measured Flow – Estimated Dry Weather Flow) 5 Peak I/I Rate: A normalized peak I/I flow based on catchment area size, Peak I/I Rate = Peak I/I Flow / Catchment Area 6 Volumetric Coefficient (Cv%): The ratio of total I/I volume and total rainfall volume, Cv% = Total I/I Flow Volume / Total Precipitation Volume * 100% 7 Peak I/ I Coefficient: The ratio of peak I/I flow and peak rainfall intensity, Peak I/ I Coefficient = Peak I/I Flow / (Peak Rainfall Intensity over Tc * Catchment Area) 8 Hourly Wet‐Weather Peaking Factor: The ratio of peak hourly wet‐weather measured flow and average dry‐weather flow, Wet‐Weather Peaking Factor = Peak Hourly Wet‐Weather Measured Flow / Average Dry-Weather Flow 9 Instantaneous Wet‐Weather Peaking Factor: The ratio of peak wet‐weather measured flow and average dry‐weather flow, Wet‐Weather Peaking Factor = Peak Wet‐Weather Measured Flow / Average Dry-Weather Flow 2
1418 Civica Infrastructure Inc. www.civi.ca
Civica Infrastructures Inc. Kawartha Lakes Flow Monitoring Report
Appendix - A June 03, 2024
I/I Analysis Graph Station: 6-6
1419 Civica Infrastructure Inc. www.civi.ca
Civica Infrastructures Inc. Kawartha Lakes Flow Monitoring Report
Appendix - A June 03, 2024
Infiltration/Inflow Event Analysis Station: 6-6 Jun 11, 2022 01:55 – Jun 13, 2022 03:00, Total Precipitation: 41.50 mm (65,030,500.00 L) Station Details
Storm Details
Catchment Area
156.70 ha
Total Precipitation
41.50 mm (65,030,500.00 L)
Duration of Storm
25.08 hr
Time of Concentration (Tc) 1
35 min
Peak Precipitation Intensity Over Tc 2
23.60 mm/hr
Return Period over Tc 3
< 2 Yr
Measured Flow
I/I Flow
Time of Peak Measured Flow
Jun 12, 2022 15:35
Time of Peak I/I Flow (TD)
Jun 12, 2022 15:35
Estimated Dry Weather Flow at TD
9.54 L/s
Peak Measured Flow
27.59 L/s
Peak I/I Flow 4
18.05 L/s
Peak I/I Rate 5
0.12 L/s/ha
Peak Measured Depth
166.53 mm
Total I/I Flow Volume during event
905,383.90 L
Volumetric Coefficient (Cv%) 6
1.39%
Total Measured Flow Volume during Event
2,121,663.70 L
Peak I/I Coefficient 7
0.0018
Hourly Wet-Weather Peaking Factor 8
2.78
Instantaneous Wet-Weather Peaking Factor 9
3.03
1
Time of Concentration (Tc): The estimated time for the flow to travel from the furthest point in the upstream area to the point of monitoring, assume flow is travelling at 1.00 m/s Peak Precipitation Intensity Over Tc: The peak rainfall intensity for the duration of the storm with the time interval defined by time of concentration 3 Return Period over Tc: The estimated time to elapse before a storm of equal or greater intensity will likely occur again, based on design storm criteria 4 Peak I/I Flow: The greatest difference captured between measured flow and estimated dry weather flow, Peak I/I Flow = Maximum (Measured Flow – Estimated Dry Weather Flow) 5 Peak I/I Rate: A normalized peak I/I flow based on catchment area size, Peak I/I Rate = Peak I/I Flow / Catchment Area 6 Volumetric Coefficient (Cv%): The ratio of total I/I volume and total rainfall volume, Cv% = Total I/I Flow Volume / Total Precipitation Volume * 100% 7 Peak I/ I Coefficient: The ratio of peak I/I flow and peak rainfall intensity, Peak I/ I Coefficient = Peak I/I Flow / (Peak Rainfall Intensity over Tc * Catchment Area) 8 Hourly Wet‐Weather Peaking Factor: The ratio of peak hourly wet‐weather measured flow and average dry‐weather flow, Wet‐Weather Peaking Factor = Peak Hourly Wet‐Weather Measured Flow / Average Dry-Weather Flow 9 Instantaneous Wet‐Weather Peaking Factor: The ratio of peak wet‐weather measured flow and average dry‐weather flow, Wet‐Weather Peaking Factor = Peak Wet‐Weather Measured Flow / Average Dry-Weather Flow 2
1420 Civica Infrastructure Inc. www.civi.ca
Civica Infrastructures Inc. Kawartha Lakes Flow Monitoring Report
Appendix - A June 03, 2024
I/I Analysis Graph Station: 6-6
1421 Civica Infrastructure Inc. www.civi.ca
Civica Infrastructures Inc. Kawartha Lakes Flow Monitoring Report
Appendix - A June 03, 2024
Infiltration/Inflow Event Analysis Station: 6-6 Jul 11, 2022 14:25 – Jul 12, 2022 22:10, Total Precipitation: 15.50 mm (24,288,500.00 L) Station Details
Storm Details
Catchment Area
156.70 ha
Total Precipitation
15.50 mm (24,288,500.00 L)
Duration of Storm
7.75 hr
Time of Concentration (Tc) 1
35 min
Peak Precipitation Intensity Over Tc 2
19.70 mm/hr
Return Period over Tc 3
< 2 Yr
Measured Flow
I/I Flow
Time of Peak Measured Flow
Jul 12, 2022 12:20
Time of Peak I/I Flow (TD)
Jul 12, 2022 05:10
Estimated Dry Weather Flow at TD
7.86 L/s
Peak Measured Flow
14.69 L/s
Peak I/I Flow 4
6.14 L/s
Peak I/I Rate 5
0.04 L/s/ha
Peak Measured Depth
141.81 mm
Total I/I Flow Volume during event
77,767.80 L
Volumetric Coefficient (Cv%) 6
0.32%
Total Measured Flow Volume during Event
763,961.10 L
Peak I/I Coefficient 7
0.0007
Hourly Wet-Weather Peaking Factor 8
1.33
Instantaneous Wet-Weather Peaking Factor 9
1.53
1
Time of Concentration (Tc): The estimated time for the flow to travel from the furthest point in the upstream area to the point of monitoring, assume flow is travelling at 1.00 m/s Peak Precipitation Intensity Over Tc: The peak rainfall intensity for the duration of the storm with the time interval defined by time of concentration 3 Return Period over Tc: The estimated time to elapse before a storm of equal or greater intensity will likely occur again, based on design storm criteria 4 Peak I/I Flow: The greatest difference captured between measured flow and estimated dry weather flow, Peak I/I Flow = Maximum (Measured Flow – Estimated Dry Weather Flow) 5 Peak I/I Rate: A normalized peak I/I flow based on catchment area size, Peak I/I Rate = Peak I/I Flow / Catchment Area 6 Volumetric Coefficient (Cv%): The ratio of total I/I volume and total rainfall volume, Cv% = Total I/I Flow Volume / Total Precipitation Volume * 100% 7 Peak I/ I Coefficient: The ratio of peak I/I flow and peak rainfall intensity, Peak I/ I Coefficient = Peak I/I Flow / (Peak Rainfall Intensity over Tc * Catchment Area) 8 Hourly Wet‐Weather Peaking Factor: The ratio of peak hourly wet‐weather measured flow and average dry‐weather flow, Wet‐Weather Peaking Factor = Peak Hourly Wet‐Weather Measured Flow / Average Dry-Weather Flow 9 Instantaneous Wet‐Weather Peaking Factor: The ratio of peak wet‐weather measured flow and average dry‐weather flow, Wet‐Weather Peaking Factor = Peak Wet‐Weather Measured Flow / Average Dry-Weather Flow 2
1422 Civica Infrastructure Inc. www.civi.ca
Civica Infrastructures Inc. Kawartha Lakes Flow Monitoring Report
Appendix - A June 03, 2024
I/I Analysis Graph Station: 6-6
1423 Civica Infrastructure Inc. www.civi.ca
Civica Infrastructures Inc. Kawartha Lakes Flow Monitoring Report
Appendix - A June 03, 2024
Infiltration/Inflow Event Analysis Station: 6-6 Jul 17, 2022 16:10 – Jul 20, 2022 11:25, Total Precipitation: 21.50 mm (33,690,500.00 L) Station Details
Storm Details
Catchment Area
156.70 ha
Total Precipitation
21.50 mm (33,690,500.00 L)
Duration of Storm
43.25 hr
Time of Concentration (Tc) 1
35 min
Peak Precipitation Intensity Over Tc 2
1.30 mm/hr
Return Period over Tc 3
< 2 Yr
Measured Flow
I/I Flow
Time of Peak Measured Flow
Jul 18, 2022 11:35
Time of Peak I/I Flow (TD)
Jul 18, 2022 11:35
Estimated Dry Weather Flow at TD
10.32 L/s
Peak Measured Flow
18.21 L/s
Peak I/I Flow 4
7.89 L/s
Peak I/I Rate 5
0.05 L/s/ha
Peak Measured Depth
151.47 mm
Total I/I Flow Volume during event
226,097.10 L
Volumetric Coefficient (Cv%) 6
0.67%
Total Measured Flow Volume during Event
2,004,880.40 L
Peak I/I Coefficient 7
0.0141
Hourly Wet-Weather Peaking Factor 8
1.75
Instantaneous Wet-Weather Peaking Factor 9
2.04
1
Time of Concentration (Tc): The estimated time for the flow to travel from the furthest point in the upstream area to the point of monitoring, assume flow is travelling at 1.00 m/s Peak Precipitation Intensity Over Tc: The peak rainfall intensity for the duration of the storm with the time interval defined by time of concentration 3 Return Period over Tc: The estimated time to elapse before a storm of equal or greater intensity will likely occur again, based on design storm criteria 4 Peak I/I Flow: The greatest difference captured between measured flow and estimated dry weather flow, Peak I/I Flow = Maximum (Measured Flow – Estimated Dry Weather Flow) 5 Peak I/I Rate: A normalized peak I/I flow based on catchment area size, Peak I/I Rate = Peak I/I Flow / Catchment Area 6 Volumetric Coefficient (Cv%): The ratio of total I/I volume and total rainfall volume, Cv% = Total I/I Flow Volume / Total Precipitation Volume * 100% 7 Peak I/ I Coefficient: The ratio of peak I/I flow and peak rainfall intensity, Peak I/ I Coefficient = Peak I/I Flow / (Peak Rainfall Intensity over Tc * Catchment Area) 8 Hourly Wet‐Weather Peaking Factor: The ratio of peak hourly wet‐weather measured flow and average dry‐weather flow, Wet‐Weather Peaking Factor = Peak Hourly Wet‐Weather Measured Flow / Average Dry-Weather Flow 9 Instantaneous Wet‐Weather Peaking Factor: The ratio of peak wet‐weather measured flow and average dry‐weather flow, Wet‐Weather Peaking Factor = Peak Wet‐Weather Measured Flow / Average Dry-Weather Flow 2
1424 Civica Infrastructure Inc. www.civi.ca
Civica Infrastructures Inc. Kawartha Lakes Flow Monitoring Report
Appendix - A June 03, 2024
I/I Analysis Graph Station: 6-6
1425 Civica Infrastructure Inc. www.civi.ca
Civica Infrastructures Inc. Kawartha Lakes Flow Monitoring Report
Appendix - A June 03, 2024
Infiltration/Inflow Event Analysis Station: 6-6 Aug 17, 2022 03:20 – Aug 18, 2022 05:10, Total Precipitation: 17.50 mm (27,422,500.00 L) Station Details
Storm Details
Catchment Area
156.70 ha
Total Precipitation
17.50 mm (27,422,500.00 L)
Duration of Storm
1.83 hr
Time of Concentration (Tc) 1
35 min
Peak Precipitation Intensity Over Tc 2
25.30 mm/hr
Return Period over Tc 3
< 2 Yr
Measured Flow
I/I Flow
Time of Peak Measured Flow
Aug 17, 2022 15:45
Time of Peak I/I Flow (TD)
Aug 17, 2022 15:45
Estimated Dry Weather Flow at TD
9.36 L/s
Peak Measured Flow
28.46 L/s
Peak I/I Flow 4
19.11 L/s
Peak I/I Rate 5
0.12 L/s/ha
Peak Measured Depth
155.20 mm
Total I/I Flow Volume during event
48,074.80 L
Volumetric Coefficient (Cv%) 6
0.18%
Total Measured Flow Volume during Event
393,404.90 L
Peak I/I Coefficient 7
0.0017
Hourly Wet-Weather Peaking Factor 8
2.76
Instantaneous Wet-Weather Peaking Factor 9
4.13
1
Time of Concentration (Tc): The estimated time for the flow to travel from the furthest point in the upstream area to the point of monitoring, assume flow is travelling at 1.00 m/s Peak Precipitation Intensity Over Tc: The peak rainfall intensity for the duration of the storm with the time interval defined by time of concentration 3 Return Period over Tc: The estimated time to elapse before a storm of equal or greater intensity will likely occur again, based on design storm criteria 4 Peak I/I Flow: The greatest difference captured between measured flow and estimated dry weather flow, Peak I/I Flow = Maximum (Measured Flow – Estimated Dry Weather Flow) 5 Peak I/I Rate: A normalized peak I/I flow based on catchment area size, Peak I/I Rate = Peak I/I Flow / Catchment Area 6 Volumetric Coefficient (Cv%): The ratio of total I/I volume and total rainfall volume, Cv% = Total I/I Flow Volume / Total Precipitation Volume * 100% 7 Peak I/ I Coefficient: The ratio of peak I/I flow and peak rainfall intensity, Peak I/ I Coefficient = Peak I/I Flow / (Peak Rainfall Intensity over Tc * Catchment Area) 8 Hourly Wet‐Weather Peaking Factor: The ratio of peak hourly wet‐weather measured flow and average dry‐weather flow, Wet‐Weather Peaking Factor = Peak Hourly Wet‐Weather Measured Flow / Average Dry-Weather Flow 9 Instantaneous Wet‐Weather Peaking Factor: The ratio of peak wet‐weather measured flow and average dry‐weather flow, Wet‐Weather Peaking Factor = Peak Wet‐Weather Measured Flow / Average Dry-Weather Flow 2
1426 Civica Infrastructure Inc. www.civi.ca
Civica Infrastructures Inc. Kawartha Lakes Flow Monitoring Report
Appendix - A June 03, 2024
I/I Analysis Graph Station: 6-6
1427 Civica Infrastructure Inc. www.civi.ca
Civica Infrastructures Inc. Kawartha Lakes Flow Monitoring Report
Appendix - A June 03, 2024
Infiltration/Inflow Event Analysis Station: 6-6 Aug 21, 2022 09:50 – Aug 23, 2022 16:20, Total Precipitation: 17.50 mm (27,422,500.00 L) Station Details
Storm Details
Catchment Area
156.70 ha
Total Precipitation
17.50 mm (27,422,500.00 L)
Duration of Storm
30.50 hr
Time of Concentration (Tc) 1
35 min
Peak Precipitation Intensity Over Tc 2
9.40 mm/hr
Return Period over Tc 3
< 2 Yr
Measured Flow
I/I Flow
Time of Peak Measured Flow
Aug 23, 2022 09:10
Time of Peak I/I Flow (TD)
Aug 22, 2022 15:20
Estimated Dry Weather Flow at TD
10.20 L/s
Peak Measured Flow
20.71 L/s
Peak I/I Flow 4
8.16 L/s
Peak I/I Rate 5
0.05 L/s/ha
Peak Measured Depth
145.20 mm
Total I/I Flow Volume during event
220,822.90 L
Volumetric Coefficient (Cv%) 6
0.81%
Total Measured Flow Volume during Event
1,614,740.50 L
Peak I/I Coefficient 7
0.0020
Hourly Wet-Weather Peaking Factor 8
1.84
Instantaneous Wet-Weather Peaking Factor 9
2.27
1
Time of Concentration (Tc): The estimated time for the flow to travel from the furthest point in the upstream area to the point of monitoring, assume flow is travelling at 1.00 m/s Peak Precipitation Intensity Over Tc: The peak rainfall intensity for the duration of the storm with the time interval defined by time of concentration 3 Return Period over Tc: The estimated time to elapse before a storm of equal or greater intensity will likely occur again, based on design storm criteria 4 Peak I/I Flow: The greatest difference captured between measured flow and estimated dry weather flow, Peak I/I Flow = Maximum (Measured Flow – Estimated Dry Weather Flow) 5 Peak I/I Rate: A normalized peak I/I flow based on catchment area size, Peak I/I Rate = Peak I/I Flow / Catchment Area 6 Volumetric Coefficient (Cv%): The ratio of total I/I volume and total rainfall volume, Cv% = Total I/I Flow Volume / Total Precipitation Volume * 100% 7 Peak I/ I Coefficient: The ratio of peak I/I flow and peak rainfall intensity, Peak I/ I Coefficient = Peak I/I Flow / (Peak Rainfall Intensity over Tc * Catchment Area) 8 Hourly Wet‐Weather Peaking Factor: The ratio of peak hourly wet‐weather measured flow and average dry‐weather flow, Wet‐Weather Peaking Factor = Peak Hourly Wet‐Weather Measured Flow / Average Dry-Weather Flow 9 Instantaneous Wet‐Weather Peaking Factor: The ratio of peak wet‐weather measured flow and average dry‐weather flow, Wet‐Weather Peaking Factor = Peak Wet‐Weather Measured Flow / Average Dry-Weather Flow 2
1428 Civica Infrastructure Inc. www.civi.ca
Civica Infrastructures Inc. Kawartha Lakes Flow Monitoring Report
Appendix - A June 03, 2024
I/I Analysis Graph Station: 6-6
1429 Civica Infrastructure Inc. www.civi.ca
Civica Infrastructures Inc. Kawartha Lakes Flow Monitoring Report
Appendix - A June 03, 2024
Infiltration/Inflow Event Analysis Station: 6-6 Aug 25, 2022 01:30 – Aug 26, 2022 10:05, Total Precipitation: 16.25 mm (25,463,750.00 L) Station Details
Storm Details
Catchment Area
156.70 ha
Total Precipitation
16.25 mm (25,463,750.00 L)
Duration of Storm
8.58 hr
Time of Concentration (Tc) 1
35 min
Peak Precipitation Intensity Over Tc 2
22.30 mm/hr
Return Period over Tc 3
< 2 Yr
Measured Flow
I/I Flow
Time of Peak Measured Flow
Aug 26, 2022 07:05
Time of Peak I/I Flow (TD)
Aug 25, 2022 19:55
Estimated Dry Weather Flow at TD
10.94 L/s
Peak Measured Flow
22.93 L/s
Peak I/I Flow 4
11.15 L/s
Peak I/I Rate 5
0.07 L/s/ha
Peak Measured Depth
136.37 mm
Total I/I Flow Volume during event
305,811.50 L
Volumetric Coefficient (Cv%) 6
1.20%
Total Measured Flow Volume during Event
1,015,471.30 L
Peak I/I Coefficient 7
0.0012
Hourly Wet-Weather Peaking Factor 8
1.95
Instantaneous Wet-Weather Peaking Factor 9
2.40
1
Time of Concentration (Tc): The estimated time for the flow to travel from the furthest point in the upstream area to the point of monitoring, assume flow is travelling at 1.00 m/s Peak Precipitation Intensity Over Tc: The peak rainfall intensity for the duration of the storm with the time interval defined by time of concentration 3 Return Period over Tc: The estimated time to elapse before a storm of equal or greater intensity will likely occur again, based on design storm criteria 4 Peak I/I Flow: The greatest difference captured between measured flow and estimated dry weather flow, Peak I/I Flow = Maximum (Measured Flow – Estimated Dry Weather Flow) 5 Peak I/I Rate: A normalized peak I/I flow based on catchment area size, Peak I/I Rate = Peak I/I Flow / Catchment Area 6 Volumetric Coefficient (Cv%): The ratio of total I/I volume and total rainfall volume, Cv% = Total I/I Flow Volume / Total Precipitation Volume * 100% 7 Peak I/ I Coefficient: The ratio of peak I/I flow and peak rainfall intensity, Peak I/ I Coefficient = Peak I/I Flow / (Peak Rainfall Intensity over Tc * Catchment Area) 8 Hourly Wet‐Weather Peaking Factor: The ratio of peak hourly wet‐weather measured flow and average dry‐weather flow, Wet‐Weather Peaking Factor = Peak Hourly Wet‐Weather Measured Flow / Average Dry-Weather Flow 9 Instantaneous Wet‐Weather Peaking Factor: The ratio of peak wet‐weather measured flow and average dry‐weather flow, Wet‐Weather Peaking Factor = Peak Wet‐Weather Measured Flow / Average Dry-Weather Flow 2
1430 Civica Infrastructure Inc. www.civi.ca
Civica Infrastructures Inc. Kawartha Lakes Flow Monitoring Report
Appendix - A June 03, 2024
I/I Analysis Graph Station: 6-6
1431 Civica Infrastructure Inc. www.civi.ca
Civica Infrastructures Inc. Kawartha Lakes Flow Monitoring Report
Appendix - A June 03, 2024
Infiltration/Inflow Event Analysis Station: 6-6 Aug 29, 2022 01:40 – Aug 30, 2022 04:10, Total Precipitation: 29.00 mm (45,443,000.00 L) Station Details
Storm Details
Catchment Area
156.70 ha
Total Precipitation
29.00 mm (45,443,000.00 L)
Duration of Storm
2.50 hr
Time of Concentration (Tc) 1
35 min
Peak Precipitation Intensity Over Tc 2
35.60 mm/hr
Return Period over Tc 3
< 2 Yr
Measured Flow
I/I Flow
Time of Peak Measured Flow
Aug 29, 2022 15:15
Time of Peak I/I Flow (TD)
Aug 29, 2022 15:15
Estimated Dry Weather Flow at TD
10.57 L/s
Peak Measured Flow
22.74 L/s
Peak I/I Flow 4
12.17 L/s
Peak I/I Rate 5
0.08 L/s/ha
Peak Measured Depth
155.47 mm
Total I/I Flow Volume during event
154,027.80 L
Volumetric Coefficient (Cv%) 6
0.34%
Total Measured Flow Volume during Event
626,893.40 L
Peak I/I Coefficient 7
0.0008
Hourly Wet-Weather Peaking Factor 8
2.20
Instantaneous Wet-Weather Peaking Factor 9
2.52
1
Time of Concentration (Tc): The estimated time for the flow to travel from the furthest point in the upstream area to the point of monitoring, assume flow is travelling at 1.00 m/s Peak Precipitation Intensity Over Tc: The peak rainfall intensity for the duration of the storm with the time interval defined by time of concentration 3 Return Period over Tc: The estimated time to elapse before a storm of equal or greater intensity will likely occur again, based on design storm criteria 4 Peak I/I Flow: The greatest difference captured between measured flow and estimated dry weather flow, Peak I/I Flow = Maximum (Measured Flow – Estimated Dry Weather Flow) 5 Peak I/I Rate: A normalized peak I/I flow based on catchment area size, Peak I/I Rate = Peak I/I Flow / Catchment Area 6 Volumetric Coefficient (Cv%): The ratio of total I/I volume and total rainfall volume, Cv% = Total I/I Flow Volume / Total Precipitation Volume * 100% 7 Peak I/ I Coefficient: The ratio of peak I/I flow and peak rainfall intensity, Peak I/ I Coefficient = Peak I/I Flow / (Peak Rainfall Intensity over Tc * Catchment Area) 8 Hourly Wet‐Weather Peaking Factor: The ratio of peak hourly wet‐weather measured flow and average dry‐weather flow, Wet‐Weather Peaking Factor = Peak Hourly Wet‐Weather Measured Flow / Average Dry-Weather Flow 9 Instantaneous Wet‐Weather Peaking Factor: The ratio of peak wet‐weather measured flow and average dry‐weather flow, Wet‐Weather Peaking Factor = Peak Wet‐Weather Measured Flow / Average Dry-Weather Flow 2
1432 Civica Infrastructure Inc. www.civi.ca
Civica Infrastructures Inc. Kawartha Lakes Flow Monitoring Report
Appendix - A June 03, 2024
I/I Analysis Graph Station: 6-6
1433 Civica Infrastructure Inc. www.civi.ca
Civica Infrastructures Inc. Kawartha Lakes Flow Monitoring Report
Appendix - A June 03, 2024
Infiltration/Inflow Event Analysis Station: 6-6 Sep 11, 2022 15:50 – Sep 13, 2022 16:55, Total Precipitation: 21.75 mm (34,082,250.00 L) Station Details
Storm Details
Catchment Area
156.70 ha
Total Precipitation
21.75 mm (34,082,250.00 L)
Duration of Storm
25.08 hr
Time of Concentration (Tc) 1
35 min
Peak Precipitation Intensity Over Tc 2
7.30 mm/hr
Return Period over Tc 3
< 2 Yr
Measured Flow
I/I Flow
Time of Peak Measured Flow
Sep 13, 2022 08:10
Time of Peak I/I Flow (TD)
Sep 13, 2022 08:10
Estimated Dry Weather Flow at TD
14.59 L/s
Peak Measured Flow
22.23 L/s
Peak I/I Flow 4
7.64 L/s
Peak I/I Rate 5
0.05 L/s/ha
Peak Measured Depth
126.23 mm
Total I/I Flow Volume during event
204,313.00 L
Volumetric Coefficient (Cv%) 6
0.60%
Total Measured Flow Volume during Event
1,741,560.20 L
Peak I/I Coefficient 7
0.0024
Hourly Wet-Weather Peaking Factor 8
1.63
Instantaneous Wet-Weather Peaking Factor 9
1.93
1
Time of Concentration (Tc): The estimated time for the flow to travel from the furthest point in the upstream area to the point of monitoring, assume flow is travelling at 1.00 m/s Peak Precipitation Intensity Over Tc: The peak rainfall intensity for the duration of the storm with the time interval defined by time of concentration 3 Return Period over Tc: The estimated time to elapse before a storm of equal or greater intensity will likely occur again, based on design storm criteria 4 Peak I/I Flow: The greatest difference captured between measured flow and estimated dry weather flow, Peak I/I Flow = Maximum (Measured Flow – Estimated Dry Weather Flow) 5 Peak I/I Rate: A normalized peak I/I flow based on catchment area size, Peak I/I Rate = Peak I/I Flow / Catchment Area 6 Volumetric Coefficient (Cv%): The ratio of total I/I volume and total rainfall volume, Cv% = Total I/I Flow Volume / Total Precipitation Volume * 100% 7 Peak I/ I Coefficient: The ratio of peak I/I flow and peak rainfall intensity, Peak I/ I Coefficient = Peak I/I Flow / (Peak Rainfall Intensity over Tc * Catchment Area) 8 Hourly Wet‐Weather Peaking Factor: The ratio of peak hourly wet‐weather measured flow and average dry‐weather flow, Wet‐Weather Peaking Factor = Peak Hourly Wet‐Weather Measured Flow / Average Dry-Weather Flow 9 Instantaneous Wet‐Weather Peaking Factor: The ratio of peak wet‐weather measured flow and average dry‐weather flow, Wet‐Weather Peaking Factor = Peak Wet‐Weather Measured Flow / Average Dry-Weather Flow 2
1434 Civica Infrastructure Inc. www.civi.ca
Civica Infrastructures Inc. Kawartha Lakes Flow Monitoring Report
Appendix - A June 03, 2024
I/I Analysis Graph Station: 6-6
1435 Civica Infrastructure Inc. www.civi.ca
Civica Infrastructures Inc. Kawartha Lakes Flow Monitoring Report
Appendix - A June 03, 2024
Infiltration/Inflow Event Analysis Station: 6-6 Sep 17, 2022 19:35 – Sep 19, 2022 01:10, Total Precipitation: 24.50 mm (38,391,500.00 L) Station Details
Storm Details
Catchment Area
156.70 ha
Total Precipitation
24.50 mm (38,391,500.00 L)
Duration of Storm
5.58 hr
Time of Concentration (Tc) 1
35 min
Peak Precipitation Intensity Over Tc 2
15.40 mm/hr
Return Period over Tc 3
< 2 Yr
Measured Flow
I/I Flow
Time of Peak Measured Flow
Sep 18, 2022 16:20
Time of Peak I/I Flow (TD)
Sep 18, 2022 16:20
Estimated Dry Weather Flow at TD
10.61 L/s
Peak Measured Flow
22.95 L/s
Peak I/I Flow 4
12.34 L/s
Peak I/I Rate 5
0.08 L/s/ha
Peak Measured Depth
133.33 mm
Total I/I Flow Volume during event
340,157.60 L
Volumetric Coefficient (Cv%) 6
0.89%
Total Measured Flow Volume during Event
1,006,114.70 L
Peak I/I Coefficient 7
0.0018
Hourly Wet-Weather Peaking Factor 8
1.85
Instantaneous Wet-Weather Peaking Factor 9
2.19
1
Time of Concentration (Tc): The estimated time for the flow to travel from the furthest point in the upstream area to the point of monitoring, assume flow is travelling at 1.00 m/s Peak Precipitation Intensity Over Tc: The peak rainfall intensity for the duration of the storm with the time interval defined by time of concentration 3 Return Period over Tc: The estimated time to elapse before a storm of equal or greater intensity will likely occur again, based on design storm criteria 4 Peak I/I Flow: The greatest difference captured between measured flow and estimated dry weather flow, Peak I/I Flow = Maximum (Measured Flow – Estimated Dry Weather Flow) 5 Peak I/I Rate: A normalized peak I/I flow based on catchment area size, Peak I/I Rate = Peak I/I Flow / Catchment Area 6 Volumetric Coefficient (Cv%): The ratio of total I/I volume and total rainfall volume, Cv% = Total I/I Flow Volume / Total Precipitation Volume * 100% 7 Peak I/ I Coefficient: The ratio of peak I/I flow and peak rainfall intensity, Peak I/ I Coefficient = Peak I/I Flow / (Peak Rainfall Intensity over Tc * Catchment Area) 8 Hourly Wet‐Weather Peaking Factor: The ratio of peak hourly wet‐weather measured flow and average dry‐weather flow, Wet‐Weather Peaking Factor = Peak Hourly Wet‐Weather Measured Flow / Average Dry-Weather Flow 9 Instantaneous Wet‐Weather Peaking Factor: The ratio of peak wet‐weather measured flow and average dry‐weather flow, Wet‐Weather Peaking Factor = Peak Wet‐Weather Measured Flow / Average Dry-Weather Flow 2
1436 Civica Infrastructure Inc. www.civi.ca
Civica Infrastructures Inc. Kawartha Lakes Flow Monitoring Report
Appendix - A June 03, 2024
I/I Analysis Graph Station: 6-6
1437 Civica Infrastructure Inc. www.civi.ca
Civica Infrastructures Inc. Kawartha Lakes Flow Monitoring Report
Appendix - A June 03, 2024
Infiltration/Inflow Event Analysis Station: 6-6 Oct 12, 2022 08:40 – Oct 13, 2022 23:55, Total Precipitation: 20.75 mm (32,515,250.00 L) Station Details
Storm Details
Catchment Area
156.70 ha
Total Precipitation
20.75 mm (32,515,250.00 L)
Duration of Storm
15.25 hr
Time of Concentration (Tc) 1
35 min
Peak Precipitation Intensity Over Tc 2
6.90 mm/hr
Return Period over Tc 3
< 2 Yr
Measured Flow
I/I Flow
Time of Peak Measured Flow
Oct 13, 2022 09:00
Time of Peak I/I Flow (TD)
Oct 13, 2022 09:00
Estimated Dry Weather Flow at TD
14.05 L/s
Peak Measured Flow
18.17 L/s
Peak I/I Flow 4
4.12 L/s
Peak I/I Rate 5
0.03 L/s/ha
Peak Measured Depth
129.31 mm
Total I/I Flow Volume during event
43,278.20 L
Volumetric Coefficient (Cv%) 6
0.13%
Total Measured Flow Volume during Event
973,956.50 L
Peak I/I Coefficient 7
0.0014
Hourly Wet-Weather Peaking Factor 8
1.53
Instantaneous Wet-Weather Peaking Factor 9
1.92
1
Time of Concentration (Tc): The estimated time for the flow to travel from the furthest point in the upstream area to the point of monitoring, assume flow is travelling at 1.00 m/s Peak Precipitation Intensity Over Tc: The peak rainfall intensity for the duration of the storm with the time interval defined by time of concentration 3 Return Period over Tc: The estimated time to elapse before a storm of equal or greater intensity will likely occur again, based on design storm criteria 4 Peak I/I Flow: The greatest difference captured between measured flow and estimated dry weather flow, Peak I/I Flow = Maximum (Measured Flow – Estimated Dry Weather Flow) 5 Peak I/I Rate: A normalized peak I/I flow based on catchment area size, Peak I/I Rate = Peak I/I Flow / Catchment Area 6 Volumetric Coefficient (Cv%): The ratio of total I/I volume and total rainfall volume, Cv% = Total I/I Flow Volume / Total Precipitation Volume * 100% 7 Peak I/ I Coefficient: The ratio of peak I/I flow and peak rainfall intensity, Peak I/ I Coefficient = Peak I/I Flow / (Peak Rainfall Intensity over Tc * Catchment Area) 8 Hourly Wet‐Weather Peaking Factor: The ratio of peak hourly wet‐weather measured flow and average dry‐weather flow, Wet‐Weather Peaking Factor = Peak Hourly Wet‐Weather Measured Flow / Average Dry-Weather Flow 9 Instantaneous Wet‐Weather Peaking Factor: The ratio of peak wet‐weather measured flow and average dry‐weather flow, Wet‐Weather Peaking Factor = Peak Wet‐Weather Measured Flow / Average Dry-Weather Flow 2
1438 Civica Infrastructure Inc. www.civi.ca
Civica Infrastructures Inc. Kawartha Lakes Flow Monitoring Report
Appendix - A June 03, 2024
Activity Log Station: 6-6 Date Time
Type
Purpose of Visit
08-Feb-2022 11:15:00 AM
Maintenance Log
CALIBRATION
17-Mar-2022 03:32:00 PM
Maintenance Log
calibration
25-May-2022 10:45:00 PM
Maintenance Log
Calibration
08-Jun-2022 12:04:00 PM
17-Jun-2022 12:55:00 PM
03-Aug-2022 09:50:00 AM
11-Aug-2022 10:21:00 AM
25-Aug-2022 09:15:00 AM
15-Sep-2022 12:19:00 PM
Maintenance Log
Maintenance Log
Maintenance Log
Maintenance Log
Maintenance Log
Maintenance Log
Comment Data downloaded Debris cleared Telemetry sent Ensured manual and sensor readings are satisfactory before leaving site Logger swapped S/N 65345 Note: top 3 readings are for 300mm pipe, bottom 3 readings are for 225mm pipe Data downloaded site calibrated telemetry sent
Calibration Measurement
Yes
Yes
Yes
CALIBRATION
DATA DOWNLOADED, SITE CALIBRATED, DEBRIS CLEARED, TELEMETRY SENT
Yes
CALIBRATION
DATA DOWNLOADED, SITE CALIBRATED, DEBRIS CLEARED, TELEMETRY SENT
Yes
CALIBRATION
DATA DOWNLOADED, SITE CALIBRATED, TELEMETRY SENT AND CHECKED, PHOTOS TAKEN
Yes
CALIBRATION
DATA DOWNLOADED, SITE CALIBRATED, TELEMETRY SENT AND CHECKED, PHOTOS TAKEN
Yes
CAIBRATION
DATA DOWNLOADED, SITE CALIBRATED SIGNIFICANT DEBRIS CLEARED, TELEMETRY SENT PHOTOS TAKEN VIDEO TAKEN
Yes
CALIBRATION
DATA DOWNLOADED, SITE CALIBRATED, DEBRIS CLEARED, TELEMETRY SENT, PHOTOS AND VIDEO TAKEN
Yes
1439 Civica Infrastructure Inc. www.civi.ca
Civica Infrastructures Inc. Kawartha Lakes Flow Monitoring Report Date Time
21-Sep-2022 12:21:00 PM
04-Oct-2022 11:45:00 AM
11-Oct-2022 09:00:00 AM
04-Nov-2022 11:20:00 AM
Appendix - A June 03, 2024 Type
Maintenance Log
Maintenance Log
Maintenance Log
Maintenance Log
Purpose of Visit
Comment
Calibration Measurement
CALIBRATION
DATA DOWNLOADED, SITE CALIBRATED, DEBRIS CLEARED, TELEMETRY SENT, PHOTOS AND VIDEO TAKEN
Yes
CALIBRATION
DATA DOWNLOADED, SITE CALIBRATED, DEBRIS CLEARED TELEMETRY SENT AND CHECKED, PHOTO AND VIDEO TAKEN
Yes
CALIBRATION
DATA DOWNLOADED, SITE CALIBRATED, DEBRIS CLEARED, TELEMETRY SENT PHOTO AND VIDEO TAKEN, BATTERY SWAPPED
Yes
CALIBRATION
DATA DOWNLOADED TELEMETRY SENT PHOTOS TAKEN SITE CALIBRATED MEASUREMENT FOR 300MM PIPE
Yes
1440 Civica Infrastructure Inc. www.civi.ca
Civica Infrastructures Inc. Kawartha Lakes Flow Monitoring Report
Appendix - A June 03, 2024
Aggregate Data Station: 6-7
Level Date From
Date To
Days
Min (m)
Avg (m)
Max (m)
Count
Time of Min1
Time of Max1
Nov 25, 2021
Nov 04, 2022
282
0.04
0.05
0.08
80,712
Wed Mar 02, 2022 05:15
Mon Dec 06, 2021 10:40
Velocity Date From
Date To
Days
Min (m/s)
Avg (m/s)
Max (m/s)
Count
Time of Min1
Time of Max1
Nov 25, 2021
Nov 04, 2022
279
0.45
1.09
1.49
79,820
Mon Oct 24, 2022 01:30
Sun Mar 20, 2022 08:00
Flow Date From
Date To
Days
Min (L/s)
Avg (L/s)
Max (L/s)
Total Volume (1,000,000 L)
Count
Time of Min1
Time of Max1
Nov 25, 2021
Nov 04, 2022
279
1.48
4.97
15.24
119.11
79,817
Mon Oct 24, 2022 01:35
Sun Mar 20, 2022 08:00
Precipitation
1
Date From
Date To
Days
Min (mm)
Avg (mm)
Max (mm)
Sum (mm)
Count
Time of Min1
Time of Max1
Nov 25, 2021
Nov 04, 2022
335
0.00
0.01
9.75
660.70
95,922
Thu Nov 25, 2021 00:00
Mon Jul 25, 2022 00:00
Time of Min and Time of Max will be displayed by first occurrence
1441 Civica Infrastructure Inc. www.civi.ca
Civica Infrastructures Inc. Kawartha Lakes Flow Monitoring Report
Appendix - A June 03, 2024
Sanitary Report Station: 6-7
1
Average Dry Weather Flow (L/s)
Average Dry Weather Flow (L/c/d)
Average Daily Minimum Dry Weather Flow (L/s)
Average Daily Peak Dry Weather Flow (L/s)
4.753
620.357
3.046
7.795
Peaking Factor
Groundwater Infiltration (L/s)1
Groundwater Infiltration (L/ha/d)
% of GWI in Average DWF
1.640
2.589
6,095.114
54.469
Groundwater infiltration (GWI) is assumed as 85% of the daily minimum flow averaged over the monitoring period
1442 Civica Infrastructure Inc. www.civi.ca
Civica Infrastructures Inc. Kawartha Lakes Flow Monitoring Report
Appendix - A June 03, 2024
Data Chart Station: 6-7 Nov 25, 2021 – Nov 30, 2021
1443 Civica Infrastructure Inc. www.civi.ca
Civica Infrastructures Inc. Kawartha Lakes Flow Monitoring Report
Appendix - A June 03, 2024
Data Chart Station: 6-7 Dec 01, 2021 – Dec 31, 2021
1444 Civica Infrastructure Inc. www.civi.ca
Civica Infrastructures Inc. Kawartha Lakes Flow Monitoring Report
Appendix - A June 03, 2024
Data Chart Station: 6-7 Jan 01, 2022 – Jan 31, 2022
1445 Civica Infrastructure Inc. www.civi.ca
Civica Infrastructures Inc. Kawartha Lakes Flow Monitoring Report
Appendix - A June 03, 2024
Data Chart Station: 6-7 Feb 01, 2022 – Feb 28, 2022
1446 Civica Infrastructure Inc. www.civi.ca
Civica Infrastructures Inc. Kawartha Lakes Flow Monitoring Report
Appendix - A June 03, 2024
Data Chart Station: 6-7 Mar 01, 2022 – Mar 31, 2022
1447 Civica Infrastructure Inc. www.civi.ca
Civica Infrastructures Inc. Kawartha Lakes Flow Monitoring Report
Appendix - A June 03, 2024
Data Chart Station: 6-7 Apr 01, 2022 – Apr 30, 2022
1448 Civica Infrastructure Inc. www.civi.ca
Civica Infrastructures Inc. Kawartha Lakes Flow Monitoring Report
Appendix - A June 03, 2024
Data Chart Station: 6-7 May 01, 2022 – May 31, 2022
1449 Civica Infrastructure Inc. www.civi.ca
Civica Infrastructures Inc. Kawartha Lakes Flow Monitoring Report
Appendix - A June 03, 2024
Data Chart Station: 6-7 Jun 01, 2022 – Jun 30, 2022
1450 Civica Infrastructure Inc. www.civi.ca
Civica Infrastructures Inc. Kawartha Lakes Flow Monitoring Report
Appendix - A June 03, 2024
Data Chart Station: 6-7 Jul 01, 2022 – Jul 31, 2022
1451 Civica Infrastructure Inc. www.civi.ca
Civica Infrastructures Inc. Kawartha Lakes Flow Monitoring Report
Appendix - A June 03, 2024
Data Chart Station: 6-7 Aug 01, 2022 – Aug 31, 2022
1452 Civica Infrastructure Inc. www.civi.ca
Civica Infrastructures Inc. Kawartha Lakes Flow Monitoring Report
Appendix - A June 03, 2024
Data Chart Station: 6-7 Sep 01, 2022 – Sep 30, 2022
1453 Civica Infrastructure Inc. www.civi.ca
Civica Infrastructures Inc. Kawartha Lakes Flow Monitoring Report
Appendix - A June 03, 2024
Data Chart Station: 6-7 Oct 01, 2022 – Oct 31, 2022
1454 Civica Infrastructure Inc. www.civi.ca
Civica Infrastructures Inc. Kawartha Lakes Flow Monitoring Report
Appendix - A June 03, 2024
Data Chart Station: 6-7 Nov 01, 2022 – Nov 04, 2022
1455 Civica Infrastructure Inc. www.civi.ca
Civica Infrastructures Inc. Kawartha Lakes Flow Monitoring Report
Appendix - A June 03, 2024
I/I Analysis Table
1
Event1
Total Precipitation (mm)
Duration (hours)
Peak Intensity Over Tc at Station (mm/hr)
Feb 16, 2022
18.00
12.67
Apr 13, 2022
17.25
May 26, 2022
6-7 Measured Peak Flow (L/s)
Peak I/I Flow (L/s)
Peak I/I Rate (L/s/ha)
Volumetric Runoff Coefficient (CV%)
Peaking Factor (PF)
3.00
12.85
8.04
0.22
3.60 %
1.65
28.67
9.00
8.83
2.67
0.07
0.51 %
0.51
20.25
27.50
12.00
8.58
2.40
0.07
1.03 %
0.52
Jun 06, 2022
30.00
32.42
9.00
10.13
4.27
0.12
0.60 %
0.95
Jun 11, 2022
41.50
25.08
24.00
13.45
7.56
0.21
1.56 %
1.69
Jul 12, 2022
15.50
7.75
22.50
8.05
3.38
0.09
0.53 %
0.77
Jul 18, 2022
21.50
43.25
1.00
8.64
3.70
0.10
1.08 %
0.88
Aug 17, 2022
17.50
1.83
29.50
13.50
9.00
0.25
0.68 %
2.25
Aug 21, 2022
17.50
30.50
10.50
6.42
2.28
0.06
0.66 %
0.54
Aug 25, 2022
16.25
8.58
24.00
8.96
4.14
0.11
0.70 %
0.94
Aug 29, 2022
29.00
2.50
39.50
12.95
8.17
0.22
0.74 %
1.87
Sep 12, 2022
21.75
25.08
8.00
8.59
3.10
0.09
0.48 %
0.65
Sep 18, 2022
24.50
5.58
17.00
11.83
6.01
0.16
0.89 %
1.25
Oct 12, 2022
20.75
15.25
7.50
7.41
2.61
0.07
0.42 %
0.62
Average
22.23
19.05
15.46
10.01
4.81
0.13
0.96 %
1.08
Maximum
41.50
43.25
39.50
13.50
9.00
0.25
3.60 %
2.25
Flow KPIs
Measured Storms
Station: 6-7
An event is a storm with a minimum volume of 15mm and a minimum inter-event dry period of 12 hours
1456 Civica Infrastructure Inc. www.civi.ca
Civica Infrastructures Inc. Kawartha Lakes Flow Monitoring Report
Appendix - A June 03, 2024
I/I Analysis Graph Station: 6-7
1457 Civica Infrastructure Inc. www.civi.ca
Civica Infrastructures Inc. Kawartha Lakes Flow Monitoring Report
Appendix - A June 03, 2024
Infiltration/Inflow Event Analysis Station: 6-7 Feb 16, 2022 11:00 – Feb 17, 2022 23:40, Total Precipitation: 18.00 mm (6,606,000.00 L) Station Details
Storm Details
Catchment Area
36.70 ha
Total Precipitation
18.00 mm (6,606,000.00 L)
Duration of Storm
12.67 hr
Time of Concentration (Tc) 1
30 min
Peak Precipitation Intensity Over Tc 2
3.00 mm/hr
Return Period over Tc 3
< 2 Yr
Measured Flow
I/I Flow
Time of Peak Measured Flow
Feb 17, 2022 06:40
Time of Peak I/I Flow (TD)
Feb 17, 2022 06:30
Estimated Dry Weather Flow at TD
4.36 L/s
Peak Measured Flow
12.85 L/s
Peak I/I Flow 4
8.04 L/s
Peak I/I Rate 5
0.22 L/s/ha
Peak Measured Depth
78.82 mm
Total I/I Flow Volume during event
237,677.20 L
Volumetric Coefficient (Cv%) 6
3.60%
Total Measured Flow Volume during Event
671,904.00 L
Peak I/I Coefficient 7
0.0263
Hourly Wet-Weather Peaking Factor 8
2.51
Instantaneous Wet-Weather Peaking Factor 9
2.64
1
Time of Concentration (Tc): The estimated time for the flow to travel from the furthest point in the upstream area to the point of monitoring, assume flow is travelling at 1.00 m/s Peak Precipitation Intensity Over Tc: The peak rainfall intensity for the duration of the storm with the time interval defined by time of concentration 3 Return Period over Tc: The estimated time to elapse before a storm of equal or greater intensity will likely occur again, based on design storm criteria 4 Peak I/I Flow: The greatest difference captured between measured flow and estimated dry weather flow, Peak I/I Flow = Maximum (Measured Flow – Estimated Dry Weather Flow) 5 Peak I/I Rate: A normalized peak I/I flow based on catchment area size, Peak I/I Rate = Peak I/I Flow / Catchment Area 6 Volumetric Coefficient (Cv%): The ratio of total I/I volume and total rainfall volume, Cv% = Total I/I Flow Volume / Total Precipitation Volume * 100% 7 Peak I/ I Coefficient: The ratio of peak I/I flow and peak rainfall intensity, Peak I/ I Coefficient = Peak I/I Flow / (Peak Rainfall Intensity over Tc * Catchment Area) 8 Hourly Wet‐Weather Peaking Factor: The ratio of peak hourly wet‐weather measured flow and average dry‐weather flow, Wet‐Weather Peaking Factor = Peak Hourly Wet‐Weather Measured Flow / Average Dry-Weather Flow 9 Instantaneous Wet‐Weather Peaking Factor: The ratio of peak wet‐weather measured flow and average dry‐weather flow, Wet‐Weather Peaking Factor = Peak Wet‐Weather Measured Flow / Average Dry-Weather Flow 2
1458 Civica Infrastructure Inc. www.civi.ca
Civica Infrastructures Inc. Kawartha Lakes Flow Monitoring Report
Appendix - A June 03, 2024
I/I Analysis Graph Station: 6-7
1459 Civica Infrastructure Inc. www.civi.ca
Civica Infrastructures Inc. Kawartha Lakes Flow Monitoring Report
Appendix - A June 03, 2024
Infiltration/Inflow Event Analysis Station: 6-7 Apr 12, 2022 17:25 – Apr 14, 2022 22:05, Total Precipitation: 17.25 mm (6,330,750.00 L) Station Details
Storm Details
Catchment Area
36.70 ha
Total Precipitation
17.25 mm (6,330,750.00 L)
Duration of Storm
28.67 hr
Time of Concentration (Tc) 1
30 min
Peak Precipitation Intensity Over Tc 2
9.00 mm/hr
Return Period over Tc 3
< 2 Yr
Measured Flow
I/I Flow
Time of Peak Measured Flow
Apr 13, 2022 07:00
Time of Peak I/I Flow (TD)
Apr 13, 2022 07:00
Estimated Dry Weather Flow at TD
6.16 L/s
Peak Measured Flow
8.83 L/s
Peak I/I Flow 4
2.67 L/s
Peak I/I Rate 5
0.07 L/s/ha
Peak Measured Depth
68.70 mm
Total I/I Flow Volume during event
32,059.50 L
Volumetric Coefficient (Cv%) 6
0.51%
Total Measured Flow Volume during Event
803,085.20 L
Peak I/I Coefficient 7
0.0029
Hourly Wet-Weather Peaking Factor 8
1.39
Instantaneous Wet-Weather Peaking Factor 9
1.68
1
Time of Concentration (Tc): The estimated time for the flow to travel from the furthest point in the upstream area to the point of monitoring, assume flow is travelling at 1.00 m/s Peak Precipitation Intensity Over Tc: The peak rainfall intensity for the duration of the storm with the time interval defined by time of concentration 3 Return Period over Tc: The estimated time to elapse before a storm of equal or greater intensity will likely occur again, based on design storm criteria 4 Peak I/I Flow: The greatest difference captured between measured flow and estimated dry weather flow, Peak I/I Flow = Maximum (Measured Flow – Estimated Dry Weather Flow) 5 Peak I/I Rate: A normalized peak I/I flow based on catchment area size, Peak I/I Rate = Peak I/I Flow / Catchment Area 6 Volumetric Coefficient (Cv%): The ratio of total I/I volume and total rainfall volume, Cv% = Total I/I Flow Volume / Total Precipitation Volume * 100% 7 Peak I/ I Coefficient: The ratio of peak I/I flow and peak rainfall intensity, Peak I/ I Coefficient = Peak I/I Flow / (Peak Rainfall Intensity over Tc * Catchment Area) 8 Hourly Wet‐Weather Peaking Factor: The ratio of peak hourly wet‐weather measured flow and average dry‐weather flow, Wet‐Weather Peaking Factor = Peak Hourly Wet‐Weather Measured Flow / Average Dry-Weather Flow 9 Instantaneous Wet‐Weather Peaking Factor: The ratio of peak wet‐weather measured flow and average dry‐weather flow, Wet‐Weather Peaking Factor = Peak Wet‐Weather Measured Flow / Average Dry-Weather Flow 2
1460 Civica Infrastructure Inc. www.civi.ca
Civica Infrastructures Inc. Kawartha Lakes Flow Monitoring Report
Appendix - A June 03, 2024
I/I Analysis Graph Station: 6-7
1461 Civica Infrastructure Inc. www.civi.ca
Civica Infrastructures Inc. Kawartha Lakes Flow Monitoring Report
Appendix - A June 03, 2024
Infiltration/Inflow Event Analysis Station: 6-7 May 26, 2022 07:30 – May 28, 2022 11:00, Total Precipitation: 20.25 mm (7,431,750.00 L) Station Details
Storm Details
Catchment Area
36.70 ha
Total Precipitation
20.25 mm (7,431,750.00 L)
Duration of Storm
27.50 hr
Time of Concentration (Tc) 1
30 min
Peak Precipitation Intensity Over Tc 2
12.00 mm/hr
Return Period over Tc 3
< 2 Yr
Measured Flow
I/I Flow
Time of Peak Measured Flow
May 28, 2022 09:50
Time of Peak I/I Flow (TD)
May 28, 2022 07:05
Estimated Dry Weather Flow at TD
5.03 L/s
Peak Measured Flow
8.58 L/s
Peak I/I Flow 4
2.40 L/s
Peak I/I Rate 5
0.07 L/s/ha
Peak Measured Depth
65.77 mm
Total I/I Flow Volume during event
76,311.00 L
Volumetric Coefficient (Cv%) 6
1.03%
Total Measured Flow Volume during Event
736,082.30 L
Peak I/I Coefficient 7
0.0020
Hourly Wet-Weather Peaking Factor 8
1.63
Instantaneous Wet-Weather Peaking Factor 9
1.85
1
Time of Concentration (Tc): The estimated time for the flow to travel from the furthest point in the upstream area to the point of monitoring, assume flow is travelling at 1.00 m/s Peak Precipitation Intensity Over Tc: The peak rainfall intensity for the duration of the storm with the time interval defined by time of concentration 3 Return Period over Tc: The estimated time to elapse before a storm of equal or greater intensity will likely occur again, based on design storm criteria 4 Peak I/I Flow: The greatest difference captured between measured flow and estimated dry weather flow, Peak I/I Flow = Maximum (Measured Flow – Estimated Dry Weather Flow) 5 Peak I/I Rate: A normalized peak I/I flow based on catchment area size, Peak I/I Rate = Peak I/I Flow / Catchment Area 6 Volumetric Coefficient (Cv%): The ratio of total I/I volume and total rainfall volume, Cv% = Total I/I Flow Volume / Total Precipitation Volume * 100% 7 Peak I/ I Coefficient: The ratio of peak I/I flow and peak rainfall intensity, Peak I/ I Coefficient = Peak I/I Flow / (Peak Rainfall Intensity over Tc * Catchment Area) 8 Hourly Wet‐Weather Peaking Factor: The ratio of peak hourly wet‐weather measured flow and average dry‐weather flow, Wet‐Weather Peaking Factor = Peak Hourly Wet‐Weather Measured Flow / Average Dry-Weather Flow 9 Instantaneous Wet‐Weather Peaking Factor: The ratio of peak wet‐weather measured flow and average dry‐weather flow, Wet‐Weather Peaking Factor = Peak Wet‐Weather Measured Flow / Average Dry-Weather Flow 2
1462 Civica Infrastructure Inc. www.civi.ca
Civica Infrastructures Inc. Kawartha Lakes Flow Monitoring Report
Appendix - A June 03, 2024
I/I Analysis Graph Station: 6-7
1463 Civica Infrastructure Inc. www.civi.ca
Civica Infrastructures Inc. Kawartha Lakes Flow Monitoring Report
Appendix - A June 03, 2024
Infiltration/Inflow Event Analysis Station: 6-7 Jun 05, 2022 18:20 – Jun 08, 2022 02:45, Total Precipitation: 30.00 mm (11,010,000.00 L) Station Details
Storm Details
Catchment Area
36.70 ha
Total Precipitation
30.00 mm (11,010,000.00 L)
Duration of Storm
32.42 hr
Time of Concentration (Tc) 1
30 min
Peak Precipitation Intensity Over Tc 2
9.00 mm/hr
Return Period over Tc 3
< 2 Yr
Measured Flow
I/I Flow
Time of Peak Measured Flow
Jun 07, 2022 09:25
Time of Peak I/I Flow (TD)
Jun 07, 2022 09:25
Estimated Dry Weather Flow at TD
5.85 L/s
Peak Measured Flow
10.13 L/s
Peak I/I Flow 4
4.27 L/s
Peak I/I Rate 5
0.12 L/s/ha
Peak Measured Depth
69.75 mm
Total I/I Flow Volume during event
65,622.60 L
Volumetric Coefficient (Cv%) 6
0.60%
Total Measured Flow Volume during Event
784,931.10 L
Peak I/I Coefficient 7
0.0047
Hourly Wet-Weather Peaking Factor 8
1.93
Instantaneous Wet-Weather Peaking Factor 9
2.26
1
Time of Concentration (Tc): The estimated time for the flow to travel from the furthest point in the upstream area to the point of monitoring, assume flow is travelling at 1.00 m/s Peak Precipitation Intensity Over Tc: The peak rainfall intensity for the duration of the storm with the time interval defined by time of concentration 3 Return Period over Tc: The estimated time to elapse before a storm of equal or greater intensity will likely occur again, based on design storm criteria 4 Peak I/I Flow: The greatest difference captured between measured flow and estimated dry weather flow, Peak I/I Flow = Maximum (Measured Flow – Estimated Dry Weather Flow) 5 Peak I/I Rate: A normalized peak I/I flow based on catchment area size, Peak I/I Rate = Peak I/I Flow / Catchment Area 6 Volumetric Coefficient (Cv%): The ratio of total I/I volume and total rainfall volume, Cv% = Total I/I Flow Volume / Total Precipitation Volume * 100% 7 Peak I/ I Coefficient: The ratio of peak I/I flow and peak rainfall intensity, Peak I/ I Coefficient = Peak I/I Flow / (Peak Rainfall Intensity over Tc * Catchment Area) 8 Hourly Wet‐Weather Peaking Factor: The ratio of peak hourly wet‐weather measured flow and average dry‐weather flow, Wet‐Weather Peaking Factor = Peak Hourly Wet‐Weather Measured Flow / Average Dry-Weather Flow 9 Instantaneous Wet‐Weather Peaking Factor: The ratio of peak wet‐weather measured flow and average dry‐weather flow, Wet‐Weather Peaking Factor = Peak Wet‐Weather Measured Flow / Average Dry-Weather Flow 2
1464 Civica Infrastructure Inc. www.civi.ca
Civica Infrastructures Inc. Kawartha Lakes Flow Monitoring Report
Appendix - A June 03, 2024
I/I Analysis Graph Station: 6-7
1465 Civica Infrastructure Inc. www.civi.ca
Civica Infrastructures Inc. Kawartha Lakes Flow Monitoring Report
Appendix - A June 03, 2024
Infiltration/Inflow Event Analysis Station: 6-7 Jun 11, 2022 01:55 – Jun 13, 2022 03:00, Total Precipitation: 41.50 mm (15,230,500.00 L) Station Details
Storm Details
Catchment Area
36.70 ha
Total Precipitation
41.50 mm (15,230,500.00 L)
Duration of Storm
25.08 hr
Time of Concentration (Tc) 1
30 min
Peak Precipitation Intensity Over Tc 2
24.00 mm/hr
Return Period over Tc 3
< 2 Yr
Measured Flow
I/I Flow
Time of Peak Measured Flow
Jun 12, 2022 09:20
Time of Peak I/I Flow (TD)
Jun 12, 2022 09:20
Estimated Dry Weather Flow at TD
5.90 L/s
Peak Measured Flow
13.45 L/s
Peak I/I Flow 4
7.56 L/s
Peak I/I Rate 5
0.21 L/s/ha
Peak Measured Depth
80.46 mm
Total I/I Flow Volume during event
238,221.80 L
Volumetric Coefficient (Cv%) 6
1.56%
Total Measured Flow Volume during Event
835,453.40 L
Peak I/I Coefficient 7
0.0031
Hourly Wet-Weather Peaking Factor 8
2.62
Instantaneous Wet-Weather Peaking Factor 9
3.01
1
Time of Concentration (Tc): The estimated time for the flow to travel from the furthest point in the upstream area to the point of monitoring, assume flow is travelling at 1.00 m/s Peak Precipitation Intensity Over Tc: The peak rainfall intensity for the duration of the storm with the time interval defined by time of concentration 3 Return Period over Tc: The estimated time to elapse before a storm of equal or greater intensity will likely occur again, based on design storm criteria 4 Peak I/I Flow: The greatest difference captured between measured flow and estimated dry weather flow, Peak I/I Flow = Maximum (Measured Flow – Estimated Dry Weather Flow) 5 Peak I/I Rate: A normalized peak I/I flow based on catchment area size, Peak I/I Rate = Peak I/I Flow / Catchment Area 6 Volumetric Coefficient (Cv%): The ratio of total I/I volume and total rainfall volume, Cv% = Total I/I Flow Volume / Total Precipitation Volume * 100% 7 Peak I/ I Coefficient: The ratio of peak I/I flow and peak rainfall intensity, Peak I/ I Coefficient = Peak I/I Flow / (Peak Rainfall Intensity over Tc * Catchment Area) 8 Hourly Wet‐Weather Peaking Factor: The ratio of peak hourly wet‐weather measured flow and average dry‐weather flow, Wet‐Weather Peaking Factor = Peak Hourly Wet‐Weather Measured Flow / Average Dry-Weather Flow 9 Instantaneous Wet‐Weather Peaking Factor: The ratio of peak wet‐weather measured flow and average dry‐weather flow, Wet‐Weather Peaking Factor = Peak Wet‐Weather Measured Flow / Average Dry-Weather Flow 2
1466 Civica Infrastructure Inc. www.civi.ca
Civica Infrastructures Inc. Kawartha Lakes Flow Monitoring Report
Appendix - A June 03, 2024
I/I Analysis Graph Station: 6-7
1467 Civica Infrastructure Inc. www.civi.ca
Civica Infrastructures Inc. Kawartha Lakes Flow Monitoring Report
Appendix - A June 03, 2024
Infiltration/Inflow Event Analysis Station: 6-7 Jul 11, 2022 14:25 – Jul 12, 2022 22:10, Total Precipitation: 15.50 mm (5,688,500.00 L) Station Details
Storm Details
Catchment Area
36.70 ha
Total Precipitation
15.50 mm (5,688,500.00 L)
Duration of Storm
7.75 hr
Time of Concentration (Tc) 1
30 min
Peak Precipitation Intensity Over Tc 2
22.50 mm/hr
Return Period over Tc 3
< 2 Yr
Measured Flow
I/I Flow
Time of Peak Measured Flow
Jul 12, 2022 13:05
Time of Peak I/I Flow (TD)
Jul 12, 2022 13:05
Estimated Dry Weather Flow at TD
4.66 L/s
Peak Measured Flow
8.05 L/s
Peak I/I Flow 4
3.38 L/s
Peak I/I Rate 5
0.09 L/s/ha
Peak Measured Depth
63.82 mm
Total I/I Flow Volume during event
30,136.90 L
Volumetric Coefficient (Cv%) 6
0.53%
Total Measured Flow Volume during Event
343,327.60 L
Peak I/I Coefficient 7
0.0015
Hourly Wet-Weather Peaking Factor 8
1.28
Instantaneous Wet-Weather Peaking Factor 9
1.83
1
Time of Concentration (Tc): The estimated time for the flow to travel from the furthest point in the upstream area to the point of monitoring, assume flow is travelling at 1.00 m/s Peak Precipitation Intensity Over Tc: The peak rainfall intensity for the duration of the storm with the time interval defined by time of concentration 3 Return Period over Tc: The estimated time to elapse before a storm of equal or greater intensity will likely occur again, based on design storm criteria 4 Peak I/I Flow: The greatest difference captured between measured flow and estimated dry weather flow, Peak I/I Flow = Maximum (Measured Flow – Estimated Dry Weather Flow) 5 Peak I/I Rate: A normalized peak I/I flow based on catchment area size, Peak I/I Rate = Peak I/I Flow / Catchment Area 6 Volumetric Coefficient (Cv%): The ratio of total I/I volume and total rainfall volume, Cv% = Total I/I Flow Volume / Total Precipitation Volume * 100% 7 Peak I/ I Coefficient: The ratio of peak I/I flow and peak rainfall intensity, Peak I/ I Coefficient = Peak I/I Flow / (Peak Rainfall Intensity over Tc * Catchment Area) 8 Hourly Wet‐Weather Peaking Factor: The ratio of peak hourly wet‐weather measured flow and average dry‐weather flow, Wet‐Weather Peaking Factor = Peak Hourly Wet‐Weather Measured Flow / Average Dry-Weather Flow 9 Instantaneous Wet‐Weather Peaking Factor: The ratio of peak wet‐weather measured flow and average dry‐weather flow, Wet‐Weather Peaking Factor = Peak Wet‐Weather Measured Flow / Average Dry-Weather Flow 2
1468 Civica Infrastructure Inc. www.civi.ca
Civica Infrastructures Inc. Kawartha Lakes Flow Monitoring Report
Appendix - A June 03, 2024
I/I Analysis Graph Station: 6-7
1469 Civica Infrastructure Inc. www.civi.ca
Civica Infrastructures Inc. Kawartha Lakes Flow Monitoring Report
Appendix - A June 03, 2024
Infiltration/Inflow Event Analysis Station: 6-7 Jul 17, 2022 16:10 – Jul 20, 2022 11:25, Total Precipitation: 21.50 mm (7,890,500.00 L) Station Details
Storm Details
Catchment Area
36.70 ha
Total Precipitation
21.50 mm (7,890,500.00 L)
Duration of Storm
43.25 hr
Time of Concentration (Tc) 1
30 min
Peak Precipitation Intensity Over Tc 2
1.00 mm/hr
Return Period over Tc 3
< 2 Yr
Measured Flow
I/I Flow
Time of Peak Measured Flow
Jul 18, 2022 12:30
Time of Peak I/I Flow (TD)
Jul 18, 2022 12:30
Estimated Dry Weather Flow at TD
4.95 L/s
Peak Measured Flow
8.64 L/s
Peak I/I Flow 4
3.70 L/s
Peak I/I Rate 5
0.10 L/s/ha
Peak Measured Depth
66.84 mm
Total I/I Flow Volume during event
84,979.80 L
Volumetric Coefficient (Cv%) 6
1.08%
Total Measured Flow Volume during Event
920,803.70 L
Peak I/I Coefficient 7
0.0363
Hourly Wet-Weather Peaking Factor 8
1.69
Instantaneous Wet-Weather Peaking Factor 9
2.06
1
Time of Concentration (Tc): The estimated time for the flow to travel from the furthest point in the upstream area to the point of monitoring, assume flow is travelling at 1.00 m/s Peak Precipitation Intensity Over Tc: The peak rainfall intensity for the duration of the storm with the time interval defined by time of concentration 3 Return Period over Tc: The estimated time to elapse before a storm of equal or greater intensity will likely occur again, based on design storm criteria 4 Peak I/I Flow: The greatest difference captured between measured flow and estimated dry weather flow, Peak I/I Flow = Maximum (Measured Flow – Estimated Dry Weather Flow) 5 Peak I/I Rate: A normalized peak I/I flow based on catchment area size, Peak I/I Rate = Peak I/I Flow / Catchment Area 6 Volumetric Coefficient (Cv%): The ratio of total I/I volume and total rainfall volume, Cv% = Total I/I Flow Volume / Total Precipitation Volume * 100% 7 Peak I/ I Coefficient: The ratio of peak I/I flow and peak rainfall intensity, Peak I/ I Coefficient = Peak I/I Flow / (Peak Rainfall Intensity over Tc * Catchment Area) 8 Hourly Wet‐Weather Peaking Factor: The ratio of peak hourly wet‐weather measured flow and average dry‐weather flow, Wet‐Weather Peaking Factor = Peak Hourly Wet‐Weather Measured Flow / Average Dry-Weather Flow 9 Instantaneous Wet‐Weather Peaking Factor: The ratio of peak wet‐weather measured flow and average dry‐weather flow, Wet‐Weather Peaking Factor = Peak Wet‐Weather Measured Flow / Average Dry-Weather Flow 2
1470 Civica Infrastructure Inc. www.civi.ca
Civica Infrastructures Inc. Kawartha Lakes Flow Monitoring Report
Appendix - A June 03, 2024
I/I Analysis Graph Station: 6-7
1471 Civica Infrastructure Inc. www.civi.ca
Civica Infrastructures Inc. Kawartha Lakes Flow Monitoring Report
Appendix - A June 03, 2024
Infiltration/Inflow Event Analysis Station: 6-7 Aug 17, 2022 03:20 – Aug 18, 2022 05:10, Total Precipitation: 17.50 mm (6,422,500.00 L) Station Details
Storm Details
Catchment Area
36.70 ha
Total Precipitation
17.50 mm (6,422,500.00 L)
Duration of Storm
1.83 hr
Time of Concentration (Tc) 1
30 min
Peak Precipitation Intensity Over Tc 2
29.50 mm/hr
Return Period over Tc 3
< 2 Yr
Measured Flow
I/I Flow
Time of Peak Measured Flow
Aug 17, 2022 15:40
Time of Peak I/I Flow (TD)
Aug 17, 2022 15:40
Estimated Dry Weather Flow at TD
4.50 L/s
Peak Measured Flow
13.50 L/s
Peak I/I Flow 4
9.00 L/s
Peak I/I Rate 5
0.25 L/s/ha
Peak Measured Depth
80.36 mm
Total I/I Flow Volume during event
43,759.50 L
Volumetric Coefficient (Cv%) 6
0.68%
Total Measured Flow Volume during Event
243,843.90 L
Peak I/I Coefficient 7
0.0030
Hourly Wet-Weather Peaking Factor 8
2.27
Instantaneous Wet-Weather Peaking Factor 9
3.38
1
Time of Concentration (Tc): The estimated time for the flow to travel from the furthest point in the upstream area to the point of monitoring, assume flow is travelling at 1.00 m/s Peak Precipitation Intensity Over Tc: The peak rainfall intensity for the duration of the storm with the time interval defined by time of concentration 3 Return Period over Tc: The estimated time to elapse before a storm of equal or greater intensity will likely occur again, based on design storm criteria 4 Peak I/I Flow: The greatest difference captured between measured flow and estimated dry weather flow, Peak I/I Flow = Maximum (Measured Flow – Estimated Dry Weather Flow) 5 Peak I/I Rate: A normalized peak I/I flow based on catchment area size, Peak I/I Rate = Peak I/I Flow / Catchment Area 6 Volumetric Coefficient (Cv%): The ratio of total I/I volume and total rainfall volume, Cv% = Total I/I Flow Volume / Total Precipitation Volume * 100% 7 Peak I/ I Coefficient: The ratio of peak I/I flow and peak rainfall intensity, Peak I/ I Coefficient = Peak I/I Flow / (Peak Rainfall Intensity over Tc * Catchment Area) 8 Hourly Wet‐Weather Peaking Factor: The ratio of peak hourly wet‐weather measured flow and average dry‐weather flow, Wet‐Weather Peaking Factor = Peak Hourly Wet‐Weather Measured Flow / Average Dry-Weather Flow 9 Instantaneous Wet‐Weather Peaking Factor: The ratio of peak wet‐weather measured flow and average dry‐weather flow, Wet‐Weather Peaking Factor = Peak Wet‐Weather Measured Flow / Average Dry-Weather Flow 2
1472 Civica Infrastructure Inc. www.civi.ca
Civica Infrastructures Inc. Kawartha Lakes Flow Monitoring Report
Appendix - A June 03, 2024
I/I Analysis Graph Station: 6-7
1473 Civica Infrastructure Inc. www.civi.ca
Civica Infrastructures Inc. Kawartha Lakes Flow Monitoring Report
Appendix - A June 03, 2024
Infiltration/Inflow Event Analysis Station: 6-7 Aug 21, 2022 09:50 – Aug 23, 2022 16:20, Total Precipitation: 17.50 mm (6,422,500.00 L) Station Details
Storm Details
Catchment Area
36.70 ha
Total Precipitation
17.50 mm (6,422,500.00 L)
Duration of Storm
30.50 hr
Time of Concentration (Tc) 1
30 min
Peak Precipitation Intensity Over Tc 2
10.50 mm/hr
Return Period over Tc 3
< 2 Yr
Measured Flow
I/I Flow
Time of Peak Measured Flow
Aug 22, 2022 22:55
Time of Peak I/I Flow (TD)
Aug 22, 2022 22:55
Estimated Dry Weather Flow at TD
4.15 L/s
Peak Measured Flow
6.42 L/s
Peak I/I Flow 4
2.28 L/s
Peak I/I Rate 5
0.06 L/s/ha
Peak Measured Depth
61.95 mm
Total I/I Flow Volume during event
42,294.50 L
Volumetric Coefficient (Cv%) 6
0.66%
Total Measured Flow Volume during Event
693,357.10 L
Peak I/I Coefficient 7
0.0021
Hourly Wet-Weather Peaking Factor 8
1.28
Instantaneous Wet-Weather Peaking Factor 9
1.51
1
Time of Concentration (Tc): The estimated time for the flow to travel from the furthest point in the upstream area to the point of monitoring, assume flow is travelling at 1.00 m/s Peak Precipitation Intensity Over Tc: The peak rainfall intensity for the duration of the storm with the time interval defined by time of concentration 3 Return Period over Tc: The estimated time to elapse before a storm of equal or greater intensity will likely occur again, based on design storm criteria 4 Peak I/I Flow: The greatest difference captured between measured flow and estimated dry weather flow, Peak I/I Flow = Maximum (Measured Flow – Estimated Dry Weather Flow) 5 Peak I/I Rate: A normalized peak I/I flow based on catchment area size, Peak I/I Rate = Peak I/I Flow / Catchment Area 6 Volumetric Coefficient (Cv%): The ratio of total I/I volume and total rainfall volume, Cv% = Total I/I Flow Volume / Total Precipitation Volume * 100% 7 Peak I/ I Coefficient: The ratio of peak I/I flow and peak rainfall intensity, Peak I/ I Coefficient = Peak I/I Flow / (Peak Rainfall Intensity over Tc * Catchment Area) 8 Hourly Wet‐Weather Peaking Factor: The ratio of peak hourly wet‐weather measured flow and average dry‐weather flow, Wet‐Weather Peaking Factor = Peak Hourly Wet‐Weather Measured Flow / Average Dry-Weather Flow 9 Instantaneous Wet‐Weather Peaking Factor: The ratio of peak wet‐weather measured flow and average dry‐weather flow, Wet‐Weather Peaking Factor = Peak Wet‐Weather Measured Flow / Average Dry-Weather Flow 2
1474 Civica Infrastructure Inc. www.civi.ca
Civica Infrastructures Inc. Kawartha Lakes Flow Monitoring Report
Appendix - A June 03, 2024
I/I Analysis Graph Station: 6-7
1475 Civica Infrastructure Inc. www.civi.ca
Civica Infrastructures Inc. Kawartha Lakes Flow Monitoring Report
Appendix - A June 03, 2024
Infiltration/Inflow Event Analysis Station: 6-7 Aug 25, 2022 01:30 – Aug 26, 2022 10:05, Total Precipitation: 16.25 mm (5,963,750.00 L) Station Details
Storm Details
Catchment Area
36.70 ha
Total Precipitation
16.25 mm (5,963,750.00 L)
Duration of Storm
8.58 hr
Time of Concentration (Tc) 1
30 min
Peak Precipitation Intensity Over Tc 2
24.00 mm/hr
Return Period over Tc 3
< 2 Yr
Measured Flow
I/I Flow
Time of Peak Measured Flow
Aug 25, 2022 19:05
Time of Peak I/I Flow (TD)
Aug 25, 2022 19:05
Estimated Dry Weather Flow at TD
4.82 L/s
Peak Measured Flow
8.96 L/s
Peak I/I Flow 4
4.14 L/s
Peak I/I Rate 5
0.11 L/s/ha
Peak Measured Depth
66.45 mm
Total I/I Flow Volume during event
42,012.80 L
Volumetric Coefficient (Cv%) 6
0.70%
Total Measured Flow Volume during Event
368,908.20 L
Peak I/I Coefficient 7
0.0017
Hourly Wet-Weather Peaking Factor 8
1.79
Instantaneous Wet-Weather Peaking Factor 9
2.04
1
Time of Concentration (Tc): The estimated time for the flow to travel from the furthest point in the upstream area to the point of monitoring, assume flow is travelling at 1.00 m/s Peak Precipitation Intensity Over Tc: The peak rainfall intensity for the duration of the storm with the time interval defined by time of concentration 3 Return Period over Tc: The estimated time to elapse before a storm of equal or greater intensity will likely occur again, based on design storm criteria 4 Peak I/I Flow: The greatest difference captured between measured flow and estimated dry weather flow, Peak I/I Flow = Maximum (Measured Flow – Estimated Dry Weather Flow) 5 Peak I/I Rate: A normalized peak I/I flow based on catchment area size, Peak I/I Rate = Peak I/I Flow / Catchment Area 6 Volumetric Coefficient (Cv%): The ratio of total I/I volume and total rainfall volume, Cv% = Total I/I Flow Volume / Total Precipitation Volume * 100% 7 Peak I/ I Coefficient: The ratio of peak I/I flow and peak rainfall intensity, Peak I/ I Coefficient = Peak I/I Flow / (Peak Rainfall Intensity over Tc * Catchment Area) 8 Hourly Wet‐Weather Peaking Factor: The ratio of peak hourly wet‐weather measured flow and average dry‐weather flow, Wet‐Weather Peaking Factor = Peak Hourly Wet‐Weather Measured Flow / Average Dry-Weather Flow 9 Instantaneous Wet‐Weather Peaking Factor: The ratio of peak wet‐weather measured flow and average dry‐weather flow, Wet‐Weather Peaking Factor = Peak Wet‐Weather Measured Flow / Average Dry-Weather Flow 2
1476 Civica Infrastructure Inc. www.civi.ca
Civica Infrastructures Inc. Kawartha Lakes Flow Monitoring Report
Appendix - A June 03, 2024
I/I Analysis Graph Station: 6-7
1477 Civica Infrastructure Inc. www.civi.ca
Civica Infrastructures Inc. Kawartha Lakes Flow Monitoring Report
Appendix - A June 03, 2024
Infiltration/Inflow Event Analysis Station: 6-7 Aug 29, 2022 01:40 – Aug 30, 2022 04:10, Total Precipitation: 29.00 mm (10,643,000.00 L) Station Details
Storm Details
Catchment Area
36.70 ha
Total Precipitation
29.00 mm (10,643,000.00 L)
Duration of Storm
2.50 hr
Time of Concentration (Tc) 1
30 min
Peak Precipitation Intensity Over Tc 2
39.50 mm/hr
Return Period over Tc 3
< 2 Yr
Measured Flow
I/I Flow
Time of Peak Measured Flow
Aug 29, 2022 15:20
Time of Peak I/I Flow (TD)
Aug 29, 2022 15:05
Estimated Dry Weather Flow at TD
4.54 L/s
Peak Measured Flow
12.95 L/s
Peak I/I Flow 4
8.17 L/s
Peak I/I Rate 5
0.22 L/s/ha
Peak Measured Depth
78.04 mm
Total I/I Flow Volume during event
78,199.20 L
Volumetric Coefficient (Cv%) 6
0.74%
Total Measured Flow Volume during Event
307,422.10 L
Peak I/I Coefficient 7
0.0020
Hourly Wet-Weather Peaking Factor 8
2.60
Instantaneous Wet-Weather Peaking Factor 9
2.97
1
Time of Concentration (Tc): The estimated time for the flow to travel from the furthest point in the upstream area to the point of monitoring, assume flow is travelling at 1.00 m/s Peak Precipitation Intensity Over Tc: The peak rainfall intensity for the duration of the storm with the time interval defined by time of concentration 3 Return Period over Tc: The estimated time to elapse before a storm of equal or greater intensity will likely occur again, based on design storm criteria 4 Peak I/I Flow: The greatest difference captured between measured flow and estimated dry weather flow, Peak I/I Flow = Maximum (Measured Flow – Estimated Dry Weather Flow) 5 Peak I/I Rate: A normalized peak I/I flow based on catchment area size, Peak I/I Rate = Peak I/I Flow / Catchment Area 6 Volumetric Coefficient (Cv%): The ratio of total I/I volume and total rainfall volume, Cv% = Total I/I Flow Volume / Total Precipitation Volume * 100% 7 Peak I/ I Coefficient: The ratio of peak I/I flow and peak rainfall intensity, Peak I/ I Coefficient = Peak I/I Flow / (Peak Rainfall Intensity over Tc * Catchment Area) 8 Hourly Wet‐Weather Peaking Factor: The ratio of peak hourly wet‐weather measured flow and average dry‐weather flow, Wet‐Weather Peaking Factor = Peak Hourly Wet‐Weather Measured Flow / Average Dry-Weather Flow 9 Instantaneous Wet‐Weather Peaking Factor: The ratio of peak wet‐weather measured flow and average dry‐weather flow, Wet‐Weather Peaking Factor = Peak Wet‐Weather Measured Flow / Average Dry-Weather Flow 2
1478 Civica Infrastructure Inc. www.civi.ca
Civica Infrastructures Inc. Kawartha Lakes Flow Monitoring Report
Appendix - A June 03, 2024
I/I Analysis Graph Station: 6-7
1479 Civica Infrastructure Inc. www.civi.ca
Civica Infrastructures Inc. Kawartha Lakes Flow Monitoring Report
Appendix - A June 03, 2024
Infiltration/Inflow Event Analysis Station: 6-7 Sep 11, 2022 15:50 – Sep 13, 2022 16:55, Total Precipitation: 21.75 mm (7,982,250.00 L) Station Details
Storm Details
Catchment Area
36.70 ha
Total Precipitation
21.75 mm (7,982,250.00 L)
Duration of Storm
25.08 hr
Time of Concentration (Tc) 1
30 min
Peak Precipitation Intensity Over Tc 2
8.00 mm/hr
Return Period over Tc 3
< 2 Yr
Measured Flow
I/I Flow
Time of Peak Measured Flow
Sep 13, 2022 06:35
Time of Peak I/I Flow (TD)
Sep 13, 2022 06:35
Estimated Dry Weather Flow at TD
5.49 L/s
Peak Measured Flow
8.59 L/s
Peak I/I Flow 4
3.10 L/s
Peak I/I Rate 5
0.09 L/s/ha
Peak Measured Depth
66.25 mm
Total I/I Flow Volume during event
38,445.60 L
Volumetric Coefficient (Cv%) 6
0.48%
Total Measured Flow Volume during Event
672,310.00 L
Peak I/I Coefficient 7
0.0038
Hourly Wet-Weather Peaking Factor 8
1.30
Instantaneous Wet-Weather Peaking Factor 9
1.81
1
Time of Concentration (Tc): The estimated time for the flow to travel from the furthest point in the upstream area to the point of monitoring, assume flow is travelling at 1.00 m/s Peak Precipitation Intensity Over Tc: The peak rainfall intensity for the duration of the storm with the time interval defined by time of concentration 3 Return Period over Tc: The estimated time to elapse before a storm of equal or greater intensity will likely occur again, based on design storm criteria 4 Peak I/I Flow: The greatest difference captured between measured flow and estimated dry weather flow, Peak I/I Flow = Maximum (Measured Flow – Estimated Dry Weather Flow) 5 Peak I/I Rate: A normalized peak I/I flow based on catchment area size, Peak I/I Rate = Peak I/I Flow / Catchment Area 6 Volumetric Coefficient (Cv%): The ratio of total I/I volume and total rainfall volume, Cv% = Total I/I Flow Volume / Total Precipitation Volume * 100% 7 Peak I/ I Coefficient: The ratio of peak I/I flow and peak rainfall intensity, Peak I/ I Coefficient = Peak I/I Flow / (Peak Rainfall Intensity over Tc * Catchment Area) 8 Hourly Wet‐Weather Peaking Factor: The ratio of peak hourly wet‐weather measured flow and average dry‐weather flow, Wet‐Weather Peaking Factor = Peak Hourly Wet‐Weather Measured Flow / Average Dry-Weather Flow 9 Instantaneous Wet‐Weather Peaking Factor: The ratio of peak wet‐weather measured flow and average dry‐weather flow, Wet‐Weather Peaking Factor = Peak Wet‐Weather Measured Flow / Average Dry-Weather Flow 2
1480 Civica Infrastructure Inc. www.civi.ca
Civica Infrastructures Inc. Kawartha Lakes Flow Monitoring Report
Appendix - A June 03, 2024
I/I Analysis Graph Station: 6-7
1481 Civica Infrastructure Inc. www.civi.ca
Civica Infrastructures Inc. Kawartha Lakes Flow Monitoring Report
Appendix - A June 03, 2024
Infiltration/Inflow Event Analysis Station: 6-7 Sep 17, 2022 19:35 – Sep 19, 2022 01:10, Total Precipitation: 24.50 mm (8,991,500.00 L) Station Details
Storm Details
Catchment Area
36.70 ha
Total Precipitation
24.50 mm (8,991,500.00 L)
Duration of Storm
5.58 hr
Time of Concentration (Tc) 1
30 min
Peak Precipitation Intensity Over Tc 2
17.00 mm/hr
Return Period over Tc 3
< 2 Yr
Measured Flow
I/I Flow
Time of Peak Measured Flow
Sep 18, 2022 09:20
Time of Peak I/I Flow (TD)
Sep 18, 2022 09:20
Estimated Dry Weather Flow at TD
5.81 L/s
Peak Measured Flow
11.83 L/s
Peak I/I Flow 4
6.01 L/s
Peak I/I Rate 5
0.16 L/s/ha
Peak Measured Depth
75.86 mm
Total I/I Flow Volume during event
80,148.00 L
Volumetric Coefficient (Cv%) 6
0.89%
Total Measured Flow Volume during Event
385,937.40 L
Peak I/I Coefficient 7
0.0035
Hourly Wet-Weather Peaking Factor 8
1.83
Instantaneous Wet-Weather Peaking Factor 9
2.46
1
Time of Concentration (Tc): The estimated time for the flow to travel from the furthest point in the upstream area to the point of monitoring, assume flow is travelling at 1.00 m/s Peak Precipitation Intensity Over Tc: The peak rainfall intensity for the duration of the storm with the time interval defined by time of concentration 3 Return Period over Tc: The estimated time to elapse before a storm of equal or greater intensity will likely occur again, based on design storm criteria 4 Peak I/I Flow: The greatest difference captured between measured flow and estimated dry weather flow, Peak I/I Flow = Maximum (Measured Flow – Estimated Dry Weather Flow) 5 Peak I/I Rate: A normalized peak I/I flow based on catchment area size, Peak I/I Rate = Peak I/I Flow / Catchment Area 6 Volumetric Coefficient (Cv%): The ratio of total I/I volume and total rainfall volume, Cv% = Total I/I Flow Volume / Total Precipitation Volume * 100% 7 Peak I/ I Coefficient: The ratio of peak I/I flow and peak rainfall intensity, Peak I/ I Coefficient = Peak I/I Flow / (Peak Rainfall Intensity over Tc * Catchment Area) 8 Hourly Wet‐Weather Peaking Factor: The ratio of peak hourly wet‐weather measured flow and average dry‐weather flow, Wet‐Weather Peaking Factor = Peak Hourly Wet‐Weather Measured Flow / Average Dry-Weather Flow 9 Instantaneous Wet‐Weather Peaking Factor: The ratio of peak wet‐weather measured flow and average dry‐weather flow, Wet‐Weather Peaking Factor = Peak Wet‐Weather Measured Flow / Average Dry-Weather Flow 2
1482 Civica Infrastructure Inc. www.civi.ca
Civica Infrastructures Inc. Kawartha Lakes Flow Monitoring Report
Appendix - A June 03, 2024
I/I Analysis Graph Station: 6-7
1483 Civica Infrastructure Inc. www.civi.ca
Civica Infrastructures Inc. Kawartha Lakes Flow Monitoring Report
Appendix - A June 03, 2024
Infiltration/Inflow Event Analysis Station: 6-7 Oct 12, 2022 08:40 – Oct 13, 2022 23:55, Total Precipitation: 20.75 mm (7,615,250.00 L) Station Details
Storm Details
Catchment Area
36.70 ha
Total Precipitation
20.75 mm (7,615,250.00 L)
Duration of Storm
15.25 hr
Time of Concentration (Tc) 1
30 min
Peak Precipitation Intensity Over Tc 2
7.50 mm/hr
Return Period over Tc 3
< 2 Yr
Measured Flow
I/I Flow
Time of Peak Measured Flow
Oct 13, 2022 10:55
Time of Peak I/I Flow (TD)
Oct 13, 2022 12:10
Estimated Dry Weather Flow at TD
4.63 L/s
Peak Measured Flow
7.41 L/s
Peak I/I Flow 4
2.61 L/s
Peak I/I Rate 5
0.07 L/s/ha
Peak Measured Depth
61.92 mm
Total I/I Flow Volume during event
31,580.50 L
Volumetric Coefficient (Cv%) 6
0.42%
Total Measured Flow Volume during Event
444,348.10 L
Peak I/I Coefficient 7
0.0034
Hourly Wet-Weather Peaking Factor 8
1.35
Instantaneous Wet-Weather Peaking Factor 9
1.77
1
Time of Concentration (Tc): The estimated time for the flow to travel from the furthest point in the upstream area to the point of monitoring, assume flow is travelling at 1.00 m/s Peak Precipitation Intensity Over Tc: The peak rainfall intensity for the duration of the storm with the time interval defined by time of concentration 3 Return Period over Tc: The estimated time to elapse before a storm of equal or greater intensity will likely occur again, based on design storm criteria 4 Peak I/I Flow: The greatest difference captured between measured flow and estimated dry weather flow, Peak I/I Flow = Maximum (Measured Flow – Estimated Dry Weather Flow) 5 Peak I/I Rate: A normalized peak I/I flow based on catchment area size, Peak I/I Rate = Peak I/I Flow / Catchment Area 6 Volumetric Coefficient (Cv%): The ratio of total I/I volume and total rainfall volume, Cv% = Total I/I Flow Volume / Total Precipitation Volume * 100% 7 Peak I/ I Coefficient: The ratio of peak I/I flow and peak rainfall intensity, Peak I/ I Coefficient = Peak I/I Flow / (Peak Rainfall Intensity over Tc * Catchment Area) 8 Hourly Wet‐Weather Peaking Factor: The ratio of peak hourly wet‐weather measured flow and average dry‐weather flow, Wet‐Weather Peaking Factor = Peak Hourly Wet‐Weather Measured Flow / Average Dry-Weather Flow 9 Instantaneous Wet‐Weather Peaking Factor: The ratio of peak wet‐weather measured flow and average dry‐weather flow, Wet‐Weather Peaking Factor = Peak Wet‐Weather Measured Flow / Average Dry-Weather Flow 2
1484 Civica Infrastructure Inc. www.civi.ca
Civica Infrastructures Inc. Kawartha Lakes Flow Monitoring Report
Appendix - A June 03, 2024
Activity Log Station: 6-7 Date Time
Type
Purpose of Visit
Comment
Calibration Measurement
26-Nov-2021 11:10:00 AM
Installation Log
INSTALL
SAME MANHOLE AS 6-7
Yes
26-Nov-2021 11:10:00 AM
Installation Log
INSTALL
SAME MANHOLE AS 6-6
Yes
02-Dec-2021 12:40:00 PM
Maintenance Log
Calibration
08-Jun-2022 12:00:00 PM
Maintenance Log
Calibration
No telemetry sent, site calibrated
1485 Civica Infrastructure Inc. www.civi.ca
No
Civica Infrastructures Inc. Kawartha Lakes Flow Monitoring Report
Appendix - A June 03, 2024
Data Chart Station: Bobcaygeon Jan 01, 2023 – Jan 31, 2023
1486 Civica Infrastructure Inc. www.civi.ca
Civica Infrastructures Inc. Kawartha Lakes Flow Monitoring Report
Appendix - A June 03, 2024
Data Chart Station: Bobcaygeon Feb 01, 2023 – Feb 28, 2023
1487 Civica Infrastructure Inc. www.civi.ca
Civica Infrastructures Inc. Kawartha Lakes Flow Monitoring Report
Appendix - A June 03, 2024
Data Chart Station: Bobcaygeon Mar 01, 2023 – Mar 31, 2023
1488 Civica Infrastructure Inc. www.civi.ca
Civica Infrastructures Inc. Kawartha Lakes Flow Monitoring Report
Appendix - A June 03, 2024
Data Chart Station: Bobcaygeon Apr 01, 2023 – Apr 30, 2023
1489 Civica Infrastructure Inc. www.civi.ca
Civica Infrastructures Inc. Kawartha Lakes Flow Monitoring Report
Appendix - A June 03, 2024
Data Chart Station: Bobcaygeon May 01, 2023 – May 31, 2023
1490 Civica Infrastructure Inc. www.civi.ca
Civica Infrastructures Inc. Kawartha Lakes Flow Monitoring Report
Appendix - A June 03, 2024
Data Chart Station: Bobcaygeon Jun 01, 2023 – Jun 30, 2023
1491 Civica Infrastructure Inc. www.civi.ca
Civica Infrastructures Inc. Kawartha Lakes Flow Monitoring Report
Appendix - A June 03, 2024
Data Chart Station: Bobcaygeon Jul 01, 2023 – Jul 31, 2023
1492 Civica Infrastructure Inc. www.civi.ca
Civica Infrastructures Inc. Kawartha Lakes Flow Monitoring Report
Appendix - A June 03, 2024
Data Chart Station: Bobcaygeon Aug 01, 2023 – Aug 31, 2023
1493 Civica Infrastructure Inc. www.civi.ca
Civica Infrastructures Inc. Kawartha Lakes Flow Monitoring Report
Appendix - A June 03, 2024
Data Chart Station: Bobcaygeon Sep 01, 2023 – Sep 30, 2023
1494 Civica Infrastructure Inc. www.civi.ca
Civica Infrastructures Inc. Kawartha Lakes Flow Monitoring Report
Appendix - A June 03, 2024
Data Chart Station: Bobcaygeon Oct 01, 2023 – Oct 31, 2023
1495 Civica Infrastructure Inc. www.civi.ca
Civica Infrastructures Inc. Kawartha Lakes Flow Monitoring Report
Appendix - A June 03, 2024
Data Chart Station: Bobcaygeon Nov 01, 2023 – Nov 02, 2023
1496 Civica Infrastructure Inc. www.civi.ca
Civica Infrastructures Inc. Kawartha Lakes Flow Monitoring Report
Appendix - A June 03, 2024
Data Chart Station: Fenelon Falls Feb 21, 2023 – Feb 28, 2023
1497 Civica Infrastructure Inc. www.civi.ca
Civica Infrastructures Inc. Kawartha Lakes Flow Monitoring Report
Appendix - A June 03, 2024
Data Chart Station: Fenelon Falls Mar 01, 2023 – Mar 31, 2023
1498 Civica Infrastructure Inc. www.civi.ca
Civica Infrastructures Inc. Kawartha Lakes Flow Monitoring Report
Appendix - A June 03, 2024
Data Chart Station: Fenelon Falls Apr 01, 2023 – Apr 30, 2023
1499 Civica Infrastructure Inc. www.civi.ca
Civica Infrastructures Inc. Kawartha Lakes Flow Monitoring Report
Appendix - A June 03, 2024
Data Chart Station: Fenelon Falls May 01, 2023 – May 31, 2023
1500 Civica Infrastructure Inc. www.civi.ca
Civica Infrastructures Inc. Kawartha Lakes Flow Monitoring Report
Appendix - A June 03, 2024
Data Chart Station: Fenelon Falls Jun 01, 2023 – Jun 30, 2023
1501 Civica Infrastructure Inc. www.civi.ca
Civica Infrastructures Inc. Kawartha Lakes Flow Monitoring Report
Appendix - A June 03, 2024
Data Chart Station: Fenelon Falls Jul 01, 2023 – Jul 31, 2023
1502 Civica Infrastructure Inc. www.civi.ca
Civica Infrastructures Inc. Kawartha Lakes Flow Monitoring Report
Appendix - A June 03, 2024
Data Chart Station: Fenelon Falls Aug 01, 2023 – Aug 31, 2023
1503 Civica Infrastructure Inc. www.civi.ca
Civica Infrastructures Inc. Kawartha Lakes Flow Monitoring Report
Appendix - A June 03, 2024
Data Chart Station: Fenelon Falls Sep 01, 2023 – Sep 30, 2023
1504 Civica Infrastructure Inc. www.civi.ca
Civica Infrastructures Inc. Kawartha Lakes Flow Monitoring Report
Appendix - A June 03, 2024
Data Chart Station: Fenelon Falls Oct 01, 2023 – Oct 31, 2023
1505 Civica Infrastructure Inc. www.civi.ca
Civica Infrastructures Inc. Kawartha Lakes Flow Monitoring Report
Appendix - A June 03, 2024
Data Chart Station: Fenelon Falls Nov 01, 2023 – Nov 02, 2023
1506 Civica Infrastructure Inc. www.civi.ca
Civica Infrastructures Inc. Kawartha Lakes Flow Monitoring Report
Appendix - A June 03, 2024
Data Chart Station: Lindsay Jan 01, 2023 – Jan 31, 2023
1507 Civica Infrastructure Inc. www.civi.ca
Civica Infrastructures Inc. Kawartha Lakes Flow Monitoring Report
Appendix - A June 03, 2024
Data Chart Station: Lindsay Feb 01, 2023 – Feb 28, 2023
1508 Civica Infrastructure Inc. www.civi.ca
Civica Infrastructures Inc. Kawartha Lakes Flow Monitoring Report
Appendix - A June 03, 2024
Data Chart Station: Lindsay Mar 01, 2023 – Mar 31, 2023
1509 Civica Infrastructure Inc. www.civi.ca
Civica Infrastructures Inc. Kawartha Lakes Flow Monitoring Report
Appendix - A June 03, 2024
Data Chart Station: Lindsay Apr 01, 2023 – Apr 30, 2023
1510 Civica Infrastructure Inc. www.civi.ca
Civica Infrastructures Inc. Kawartha Lakes Flow Monitoring Report
Appendix - A June 03, 2024
Data Chart Station: Lindsay May 01, 2023 – May 31, 2023
1511 Civica Infrastructure Inc. www.civi.ca
Civica Infrastructures Inc. Kawartha Lakes Flow Monitoring Report
Appendix - A June 03, 2024
Data Chart Station: Lindsay Jun 01, 2023 – Jun 30, 2023
1512 Civica Infrastructure Inc. www.civi.ca
Civica Infrastructures Inc. Kawartha Lakes Flow Monitoring Report
Appendix - A June 03, 2024
Data Chart Station: Lindsay Jul 01, 2023 – Jul 31, 2023
1513 Civica Infrastructure Inc. www.civi.ca
Civica Infrastructures Inc. Kawartha Lakes Flow Monitoring Report
Appendix - A June 03, 2024
Data Chart Station: Lindsay Aug 01, 2023 – Aug 31, 2023
1514 Civica Infrastructure Inc. www.civi.ca
Civica Infrastructures Inc. Kawartha Lakes Flow Monitoring Report
Appendix - A June 03, 2024
Data Chart Station: Lindsay Sep 01, 2023 – Sep 30, 2023
1515 Civica Infrastructure Inc. www.civi.ca
Civica Infrastructures Inc. Kawartha Lakes Flow Monitoring Report
Appendix - A June 03, 2024
Data Chart Station: Lindsay Oct 01, 2023 – Oct 31, 2023
1516 Civica Infrastructure Inc. www.civi.ca
Civica Infrastructures Inc. Kawartha Lakes Flow Monitoring Report
Appendix - A June 03, 2024
Data Chart Station: Lindsay Nov 01, 2023 – Nov 01, 2023
1517 Civica Infrastructure Inc. www.civi.ca
Civica Infrastructures Inc. Kawartha Lakes Flow Monitoring Report
Appendix - A June 03, 2024
Data Chart Station: Lindsay - RG01 (2022) May 11, 2022 – May 31, 2022
1518 Civica Infrastructure Inc. www.civi.ca
Civica Infrastructures Inc. Kawartha Lakes Flow Monitoring Report
Appendix - A June 03, 2024
Data Chart Station: Lindsay - RG01 (2022) Jun 01, 2022 – Jun 30, 2022
1519 Civica Infrastructure Inc. www.civi.ca
Civica Infrastructures Inc. Kawartha Lakes Flow Monitoring Report
Appendix - A June 03, 2024
Data Chart Station: Lindsay - RG01 (2022) Jul 01, 2022 – Jul 31, 2022
1520 Civica Infrastructure Inc. www.civi.ca
Civica Infrastructures Inc. Kawartha Lakes Flow Monitoring Report
Appendix - A June 03, 2024
Data Chart Station: Lindsay - RG01 (2022) Aug 01, 2022 – Aug 31, 2022
1521 Civica Infrastructure Inc. www.civi.ca
Civica Infrastructures Inc. Kawartha Lakes Flow Monitoring Report
Appendix - A June 03, 2024
Data Chart Station: Lindsay - RG01 (2022) Sep 01, 2022 – Sep 30, 2022
1522 Civica Infrastructure Inc. www.civi.ca
Civica Infrastructures Inc. Kawartha Lakes Flow Monitoring Report
Appendix - A June 03, 2024
Data Chart Station: Lindsay - RG01 (2022) Oct 01, 2022 – Oct 31, 2022
1523 Civica Infrastructure Inc. www.civi.ca
Civica Infrastructures Inc. Kawartha Lakes Flow Monitoring Report
Appendix - A June 03, 2024
Data Chart Station: Lindsay - RG01 (2022) Nov 01, 2022 – Nov 30, 2022
1524 Civica Infrastructure Inc. www.civi.ca
Civica Infrastructures Inc. Kawartha Lakes Flow Monitoring Report
Appendix - A June 03, 2024
Data Chart Station: Lindsay - RG01 (2022) Dec 01, 2022 – Dec 31, 2022
1525 Civica Infrastructure Inc. www.civi.ca
Civica Infrastructures Inc. Kawartha Lakes Flow Monitoring Report
Appendix - A June 03, 2024
Data Chart Station: Lindsay - RG01 (2022) Jan 01, 2023 – Jan 31, 2023
1526 Civica Infrastructure Inc. www.civi.ca
Civica Infrastructures Inc. Kawartha Lakes Flow Monitoring Report
Appendix - A June 03, 2024
Data Chart Station: Lindsay - RG01 (2022) Feb 01, 2023 – Feb 20, 2023
1527 Civica Infrastructure Inc. www.civi.ca
Civica Infrastructures Inc. Kawartha Lakes Flow Monitoring Report
Appendix - A June 03, 2024
Data Chart Station: Lindsay - RG02 (2022) Oct 14, 2021 – Oct 31, 2021
1528 Civica Infrastructure Inc. www.civi.ca
Civica Infrastructures Inc. Kawartha Lakes Flow Monitoring Report
Appendix - A June 03, 2024
Data Chart Station: Lindsay - RG02 (2022) Nov 01, 2021 – Nov 30, 2021
1529 Civica Infrastructure Inc. www.civi.ca
Civica Infrastructures Inc. Kawartha Lakes Flow Monitoring Report
Appendix - A June 03, 2024
Data Chart Station: Lindsay - RG02 (2022) Dec 01, 2021 – Dec 31, 2021
1530 Civica Infrastructure Inc. www.civi.ca
Civica Infrastructures Inc. Kawartha Lakes Flow Monitoring Report
Appendix - A June 03, 2024
Data Chart Station: Lindsay - RG02 (2022) Jan 01, 2022 – Jan 31, 2022
1531 Civica Infrastructure Inc. www.civi.ca
Civica Infrastructures Inc. Kawartha Lakes Flow Monitoring Report
Appendix - A June 03, 2024
Data Chart Station: Lindsay - RG02 (2022) Feb 01, 2022 – Feb 28, 2022
1532 Civica Infrastructure Inc. www.civi.ca
Civica Infrastructures Inc. Kawartha Lakes Flow Monitoring Report
Appendix - A June 03, 2024
Data Chart Station: Lindsay - RG02 (2022) Mar 01, 2022 – Mar 31, 2022
1533 Civica Infrastructure Inc. www.civi.ca
Civica Infrastructures Inc. Kawartha Lakes Flow Monitoring Report
Appendix - A June 03, 2024
Data Chart Station: Lindsay - RG02 (2022) Apr 01, 2022 – Apr 30, 2022
1534 Civica Infrastructure Inc. www.civi.ca
Civica Infrastructures Inc. Kawartha Lakes Flow Monitoring Report
Appendix - A June 03, 2024
Data Chart Station: Lindsay - RG02 (2022) May 01, 2022 – May 31, 2022
1535 Civica Infrastructure Inc. www.civi.ca
Civica Infrastructures Inc. Kawartha Lakes Flow Monitoring Report
Appendix - A June 03, 2024
Data Chart Station: Lindsay - RG02 (2022) Jun 01, 2022 – Jun 30, 2022
1536 Civica Infrastructure Inc. www.civi.ca
Civica Infrastructures Inc. Kawartha Lakes Flow Monitoring Report
Appendix - A June 03, 2024
Data Chart Station: Lindsay - RG02 (2022) Jul 01, 2022 – Jul 31, 2022
1537 Civica Infrastructure Inc. www.civi.ca
Civica Infrastructures Inc. Kawartha Lakes Flow Monitoring Report
Appendix - A June 03, 2024
Data Chart Station: Lindsay - RG02 (2022) Aug 01, 2022 – Aug 31, 2022
1538 Civica Infrastructure Inc. www.civi.ca
Civica Infrastructures Inc. Kawartha Lakes Flow Monitoring Report
Appendix - A June 03, 2024
Data Chart Station: Lindsay - RG02 (2022) Sep 01, 2022 – Sep 30, 2022
1539 Civica Infrastructure Inc. www.civi.ca
Civica Infrastructures Inc. Kawartha Lakes Flow Monitoring Report
Appendix - A June 03, 2024
Data Chart Station: Lindsay - RG02 (2022) Oct 01, 2022 – Oct 31, 2022
1540 Civica Infrastructure Inc. www.civi.ca
Civica Infrastructures Inc. Kawartha Lakes Flow Monitoring Report
Appendix - A June 03, 2024
Data Chart Station: Lindsay - RG02 (2022) Nov 01, 2022 – Nov 30, 2022
1541 Civica Infrastructure Inc. www.civi.ca
Civica Infrastructures Inc. Kawartha Lakes Flow Monitoring Report
Appendix - A June 03, 2024
Data Chart Station: Lindsay - RG02 (2022) Dec 01, 2022 – Dec 31, 2022
1542 Civica Infrastructure Inc. www.civi.ca
Civica Infrastructures Inc. Kawartha Lakes Flow Monitoring Report
Appendix - A June 03, 2024
Data Chart Station: Lindsay - RG02 (2022) Jan 01, 2023 – Jan 31, 2023
1543 Civica Infrastructure Inc. www.civi.ca
Civica Infrastructures Inc. Kawartha Lakes Flow Monitoring Report
Appendix - A June 03, 2024
Data Chart Station: Lindsay - RG02 (2022) Feb 01, 2023 – Feb 22, 2023
1544 Civica Infrastructure Inc. www.civi.ca
APPENDIX B 25 Year I/I Projections
KAW22-0003 Flow Data Analysis for Kawartha Lakes 42.80 ha
TC:
Event
Total precipitation
Duration
Peak intensity over station's Tc
09-Feb-23 31-Mar-23 05-Apr-23 30-Apr-23 19-May-23 11-Jun-23 26-Jun-23 27-Jun-23 03-Aug-23 07-Sep-23
(mm) 40 19 18 16 32 35 18 24 41 22
(hr) 14 23 13 10 19 26 8 5 5 1
(mm/Tc) 8.1 5.8 9.9 4.8 8.2 7.2 15.4 10.6 54.2 31.2
Min. Storm Size Over Time = 15mm
RG3 - Lindsay
Projected Events 1 in 25-Year Storm
Intensity Over Timestamp = 35 min (mm/hr) 66.73
35 mins I/I Rate (L/s/ha) L/s 8.89 2.26 0.49 3.17 3.71 4.62 4.49 1.84 15.38 6.83
L/s/ha 0.21 0.05 0.01 0.07 0.09 0.11 0.10 0.04 0.36 0.16
L1
0 0.80
0.70 y = 0.0066x R² = 0.8475 0.60
0.50
I/I Rate (L/s/ha)
L1 Catchment Area:
1 in 25 Year Design I/I Rate= 0.44 L/s/ha 0.40
I/I Projection
0.30
L/s/ha 0.44
0.20
1 in 25 Year Storm
0.10
0.00
0.0
20.0
40.0
60.0
80.0
100.0
Peak Intensity Over Tc (mm/hr) Captured RDII Events
Civica Infrastructure Inc. www.civi.ca
Projected I/I Events
Linear (Captured RDII Events)
120.0
KAW22-0003 Flow Data Analysis for Kawartha Lakes 116.50 ha
TC:
Event
Total precipitation
Duration
Peak intensity over station's Tc
09-Feb-23 31-Mar-23 05-Apr-23 30-Apr-23 19-May-23 11-Jun-23 26-Jun-23 27-Jun-23 03-Aug-23 07-Sep-23
(mm) 40 19 18 16 32 35 18 24 41 22
(hr) 14 23 13 10 19 26 8 5 5 1
(mm/Tc) 6.2 4.8 5.5 4.1 6.6 5.4 8.3 6.8 29.4 20.1
Min. Storm Size Over Time = 15mm
RG3 - Lindsay
Projected Events 1 in 25-Year Storm
Intensity Over Timestamp = 65 min (mm/hr) 43.32
65 mins I/I Rate (L/s/ha) L/s 33.06 30.24 33.79 35.85 33.04 24.72 25.32 22.85 50.29 28.16
L/s/ha 0.28 0.26 0.29 0.31 0.28 0.21 0.22 0.20 0.43 0.24
L2 Total
0 1.40
1.20
y = 0.0189x R² = 0.7138
1.00
I/I Rate (L/s/ha)
L2 Total Catchment Area:
1 in 25 Year Design I/I Rate= 0.82 L/s/ha
0.80
1 in 25 Year Storm 0.60
I/I Projection 0.40
L/s/ha 0.82
0.20
0.00
0.0
10.0
20.0
30.0
40.0
50.0
60.0
Peak Intensity Over Tc (mm/hr) Captured RDII Events
Civica Infrastructure Inc. www.civi.ca
Projected I/I Events
Linear (Captured RDII Events)
70.0
KAW22-0003 Flow Data Analysis for Kawartha Lakes 143.40 ha
TC:
Event
Total precipitation
Duration
Peak intensity over station's Tc
09-Feb-23 31-Mar-23 05-Apr-23 30-Apr-23 19-May-23 11-Jun-23 26-Jun-23 27-Jun-23 03-Aug-23 07-Sep-23
(mm) 40 19 18 16 32 35 18 24 41 22
(hr) 14 23 13 10 19 26 8 5 5 1
(mm/Tc) 6.2 4.5 4.8 3.8 6.6 5.0 7.2 5.9 25.4 17.4
Min. Storm Size Over Time = 15mm
RG3 - Lindsay
Projected Events 1 in 25-Year Storm
Intensity Over Timestamp = 75 min (mm/hr) 38.93
75 mins I/I Rate (L/s/ha) L/s 55.00 20.64 32.19 36.45 43.07 22.74 24.94 32.09 55.31 34.24
L/s/ha 0.38 0.14 0.22 0.25 0.30 0.16 0.17 0.22 0.39 0.24
L3
0 1.40
y = 0.0203x R² = 0.7236
1.20
1.00
I/I Rate (L/s/ha)
L3 Catchment Area:
1 in 25 Year Design I/I Rate= 0.79 L/s/ha
0.80
1 in 25 Year Storm 0.60
I/I Projection 0.40
L/s/ha 0.79
0.20
0.00
0.0
10.0
20.0
30.0
40.0
50.0
60.0
Peak Intensity Over Tc (mm/hr) Captured RDII Events
Civica Infrastructure Inc. www.civi.ca
Projected I/I Events
Linear (Captured RDII Events)
70.0
KAW22-0003 Flow Data Analysis for Kawartha Lakes 5.70 ha
TC:
Event
Total precipitation
Duration
Peak intensity over station's Tc
09-Feb-23 31-Mar-23 05-Apr-23 30-Apr-23 19-May-23 11-Jun-23 26-Jun-23 27-Jun-23 03-Aug-23 07-Sep-23
(mm) 40 19 18 16 32 35 18 24 41 22
(hr) 14 23 13 10 19 26 8 5 5 1
(mm/Tc) 13.0 6.4 18.4 6.4 12.0 8.8 35.2 16.8 101.6 40.8
Min. Storm Size Over Time = 15mm
RG3 - Lindsay
Projected Events 1 in 25-Year Storm
Intensity Over Timestamp = 15 min (mm/hr) 108.59
15 mins I/I Rate (L/s/ha) L/s 0.50 0.12 0.60 0.93 0.47 2.38 1.97 1.08 6.48 1.08
L/s/ha 0.09 0.02 0.11 0.16 0.08 0.42 0.34 0.19 1.14 0.19
L4
0 1.80
1.60
y = 0.0103x R² = 0.8881
1.40
1.20
I/I Rate (L/s/ha)
L4 Catchment Area:
I/I Projection
1 in 25 Year Design I/I Rate= 1.12 L/s/ha
1.00
1 in 25 Year Storm
0.80
0.60
L/s/ha 1.12
0.40
0.20
0.00
0.0
20.0
40.0
60.0
80.0
100.0
120.0
140.0
160.0
Peak Intensity Over Tc (mm/hr) Captured RDII Events
Civica Infrastructure Inc. www.civi.ca
Projected I/I Events
Linear (Captured RDII Events)
180.0
KAW22-0003 Flow Data Analysis for Kawartha Lakes 27.80 ha
TC:
Event
Total precipitation
Duration
Peak intensity over station's Tc
16-Mar-23 31-Mar-23 05-Apr-23 16-Apr-23 30-Apr-23 19-May-23 11-Jun-23 23-Jun-23 27-Jun-23 13-Jul-23 15-Jul-23 20-Jul-23 03-Aug-23 17-Aug-23 07-Sep-23
(mm) 19 27 25 16 22 42 49 20 31 15 16 20 39 20 25
(hr) 13 18 11 5 11 19 25 32 6 4 19 2 11 22 1
(mm/Tc) 3.4 6.9 12.4 7.7 6.4 10.3 8.6 19.3 14.1 8.1 17.6 26.1 49.3 15.0 40.7
Min. Storm Size Over Time = 15mm
RG1 - Lindsay
Projected Events 1 in 25-Year Storm
Intensity Over Timestamp = 35 min (mm/hr) 66.73
35 mins I/I Rate (L/s/ha) L/s 1.44 6.44 2.32 1.10 2.60 1.59 2.78 0.76 4.35 2.31 0.00 1.32 4.13 2.10 0.10
L/s/ha 0.05 0.23 0.08 0.04 0.09 0.06 0.10 0.03 0.16 0.08 0.00 0.05 0.15 0.08 0.00
L5
0 0.30
0.25 y = 0.0029x R² = 0.3531 0.20
I/I Rate (L/s/ha)
L5 Catchment Area:
1 in 25 Year Design I/I Rate= 0.19 L/s/ha 1 in 25 Year Storm
0.15
0.10
I/I Projection L/s/ha 0.19
0.05
0.00
0.0
10.0
20.0
30.0
40.0
50.0
60.0
70.0
80.0
90.0
Peak Intensity Over Tc (mm/hr) Captured RDII Events
Civica Infrastructure Inc. www.civi.ca
Projected I/I Events
Linear (Captured RDII Events)
100.0
KAW22-0003 Flow Data Analysis for Kawartha Lakes 6.10 ha
TC:
Event
Total precipitation
Duration
16-Mar-23 31-Mar-23 05-Apr-23 16-Apr-23 30-Apr-23 19-May-23 11-Jun-23 23-Jun-23 27-Jun-23 13-Jul-23 15-Jul-23 20-Jul-23 03-Aug-23 17-Aug-23 07-Sep-23
(mm) 19 27 25 16 22 42 49 20 31 15 16 20 39 20 25
(hr) 13 18 11 5 11 19 25 32 6 4 19 2 11 22 1
Min. Storm Size Over Time = 15mm
RG1 - Lindsay
Projected Events 1 in 25-Year Storm
Intensity Over Timestamp = 25 min (mm/hr) 82.31
Peak intensity over station's Tc
25 mins I/I Rate (L/s/ha)
(mm/Tc) L/s 3.6 2.60 7.2 5.38 17.4 4.13 8.4 0.24 7.8 1.20 13.2 1.37 10.2 1.29 25.8 0.00 15.6 1.77 Logger malfunction 24.6 0.36 34.2 0.21 67.8 2.54 19.2 0.66 52.8 0.49
L/s/ha 0.43 0.88 0.68 0.04 0.20 0.22 0.21 0.00 0.29 0.06 0.03 0.42 0.11 0.08
L6
0 1.80
y = 0.0175x R² = 0.1914
1.60
1 in 25 Year Design I/I Rate= 1.44 L/s/ha 1.40 1 in 25 Year Storm 1.20
I/I Rate (L/s/ha)
L6 Catchment Area:
1.00
0.80
0.60
I/I Projection 0.40
L/s/ha 1.44
0.20
0.00
0.0
20.0
40.0
60.0
80.0
100.0
Peak Intensity Over Tc (mm/hr) Captured RDII Events
Civica Infrastructure Inc. www.civi.ca
Projected I/I Events
Linear (Captured RDII Events)
KAW22-0003 Flow Data Analysis for Kawartha Lakes 11.50 ha
TC:
Event
Total precipitation
Duration
Peak intensity over station's Tc
16-Mar-23 31-Mar-23 05-Apr-23 16-Apr-23 30-Apr-23 19-May-23 11-Jun-23 23-Jun-23 27-Jun-23 13-Jul-23 15-Jul-23 20-Jul-23 03-Aug-23 17-Aug-23 07-Sep-23
(mm) 19 27 25 16 22 42 49 20 31 15 16 20 39 20 25
(hr) 13 18 11 5 11 19 25 32 6 4 19 2 11 22 1
(mm/Tc) 3.8 7.5 21.8 9.0 8.3 15.0 10.5 30.0 16.5 10.5 30.7 38.3 83.3 21.0 57.0
Min. Storm Size Over Time = 15mm
RG1 - Lindsay
Projected Events 1 in 25-Year Storm
Intensity Over Timestamp = 20 min (mm/hr) 93.51
20 mins I/I Rate (L/s/ha) L/s 2.91 2.86 3.31 1.04 1.28 0.40 1.33 0.27 1.51 0.41 0.70 0.14 1.34 0.30 0.14
L/s/ha 0.25 0.25 0.29 0.09 0.11 0.03 0.12 0.02 0.13 0.04 0.06 0.01 0.12 0.03 0.01
L7
0 0.35
0.30
y = 0.0019x R² = 0.1965
0.25
I/I Rate (L/s/ha)
L7 Catchment Area:
0.20
1 in 25 Year Design I/I Rate= 0.18 L/s/ha 1 in 25 Year Storm
0.15
0.10
I/I Projection L/s/ha 0.18
0.05
0.00
0.0
20.0
40.0
60.0
80.0
100.0
120.0
Peak Intensity Over Tc (mm/hr) Captured RDII Events
Civica Infrastructure Inc. www.civi.ca
Projected I/I Events
Linear (Captured RDII Events)
140.0
KAW22-0003 Flow Data Analysis for Kawartha Lakes 155.60 ha
TC:
Event
Total precipitation
Duration
Peak intensity over station's Tc
09-Feb-23 16-Mar-23 31-Mar-23 05-Apr-23 16-Apr-23 28-Apr-23 19-May-23 11-Jun-23 26-Jun-23 27-Jun-23 13-Jul-23 20-Jul-23
(mm) 36 21 29 22 17 40 48 55 42 28 20 17
(hr) 22 20 16 16 4 51 19 25 8 6 4 2
(mm/Tc) 6.0 3.4 7.5 8.3 9.0 6.0 10.5 10.5 39.0 9.8 11.6 20.6
Min. Storm Size Over Time = 15mm
RG2 - Lindsay
Projected Events 1 in 25-Year Storm
Intensity Over Timestamp = 40 min (mm/hr) 61.07
40 mins I/I Rate (L/s/ha) L/s 13.10 9.03 23.96 9.61 9.44 12.72 23.21 18.36 27.66 22.70 13.77 12.34
L/s/ha 0.08 0.06 0.15 0.06 0.06 0.08 0.15 0.12 0.18 0.15 0.09 0.08
L8 Total
0 0.60
y = 0.0064x R² = 0.7298 0.50
0.40
I/I Rate (L/s/ha)
L8 Total Catchment Area:
1 in 25 Year Design I/I Rate= 0.39 L/s/ha
1 in 25 Year Storm
0.30
0.20
I/I Projection L/s/ha 0.39
0.10
0.00
0.0
10.0
20.0
30.0
40.0
50.0
60.0
70.0
80.0
90.0
Peak Intensity Over Tc (mm/hr) Captured RDII Events
Civica Infrastructure Inc. www.civi.ca
Projected I/I Events
Linear (Captured RDII Events)
100.0
KAW22-0003 Flow Data Analysis for Kawartha Lakes 71.30 ha
TC:
Event
Total precipitation
Duration
Peak intensity over station's Tc
09-Feb-23 16-Mar-23 31-Mar-23 05-Apr-23 16-Apr-23 28-Apr-23 19-May-23 11-Jun-23 26-Jun-23 27-Jun-23 13-Jul-23 20-Jul-23 03-Aug-23 17-Aug-23 07-Sep-23 12-Sep-23
(mm) 36 21 29 22 17 40 48 55 42 28 20 17 29 23 38 18
(hr) 22 20 16 16 4 51 19 25 8 6 4 2 5 22 1 8
(mm/Tc) 7.8 4.2 9.0 13.2 10.2 7.2 11.4 13.2 58.2 15.6 15.6 28.2 40.2 19.8 60.6 11.4
Min. Storm Size Over Time = 15mm
RG2 - Lindsay
Projected Events 1 in 25-Year Storm
Intensity Over Timestamp = 25 min (mm/hr) 82.31
25 mins I/I Rate (L/s/ha) L/s 5.05 1.54 4.90 6.85 0.73 4.47 10.19 5.78 10.30 3.98 5.34 5.84 6.47 3.57 9.28 2.47
L/s/ha 0.07 0.02 0.07 0.10 0.01 0.06 0.14 0.08 0.14 0.06 0.07 0.08 0.09 0.05 0.13 0.03
L9
0 0.35
y = 0.0028x R² = 0.7593
0.30
0.25
I/I Rate (L/s/ha)
L9 Catchment Area:
1 in 25 Year Design I/I Rate= 0.23 L/s/ha 1 in 25 Year Storm
0.20
0.15
0.10
I/I Projection L/s/ha 0.23
0.05
0.00
0.0
20.0
40.0
60.0
80.0
100.0
Peak Intensity Over Tc (mm/hr) Captured RDII Events
Civica Infrastructure Inc. www.civi.ca
Projected I/I Events
Linear (Captured RDII Events)
120.0
KAW22-0003 Flow Data Analysis for Kawartha Lakes 118.60 ha
TC:
Event
Total precipitation
Duration
Peak intensity over station's Tc
09-Feb-23 31-Mar-23 05-Apr-23 30-Apr-23 19-May-23 11-Jun-23 26-Jun-23 27-Jun-23 03-Aug-23 07-Sep-23
(mm) 40 19 18 16 32 35 18 24 41 22
(hr) 14 23 13 10 19 26 8 5 5 1
(mm/Tc) 6.2 4.8
Min. Storm Size Over Time = 15mm
RG3 - Lindsay
Projected Events 1 in 25-Year Storm
Intensity Over Timestamp = 65 min (mm/hr) 43.32
Ring dislodged
4.1 6.6 5.4 8.3 6.8 29.4 20.1
65 mins I/I Rate (L/s/ha) L/s 47.14 32.47
L/s/ha 0.40 0.27
34.31 48.32 31.73 27.73 24.13 50.77 37.71
0.29 0.41 0.27 0.23 0.20 0.43 0.32
L10
0 3.50
3.00 y = 0.0427x R² = 0.7322
2.50
I/I Rate (L/s/ha)
L10 Catchment Area:
2.00
1 in 25 Year Design I/I Rate= 1.85 L/s/ha 1 in 25 Year Storm
1.50
I/I Projection 1.00
L/s/ha 1.85
0.50
0.00
0.0
10.0
20.0
30.0
40.0
50.0
60.0
70.0
Peak Intensity Over Tc (mm/hr) Captured RDII Events
Civica Infrastructure Inc. www.civi.ca
Projected I/I Events
Linear (Captured RDII Events)
80.0
KAW22-0003 Flow Data Analysis for Kawartha Lakes 69.80 ha
TC:
Event
Total precipitation
Duration
Peak intensity over station's Tc
09-Feb-23 31-Mar-23 05-Apr-23 30-Apr-23 19-May-23 11-Jun-23 26-Jun-23 27-Jun-23 03-Aug-23 07-Sep-23
(mm) 40 19 18 16 32 35 18 24 41 22
(hr) 14 23 13 10 19 26 8 5 5 1
(mm/Tc) 6.7 5.3 7.7 4.5 8.0 6.4 12.0 9.9 42.4 27.7
Min. Storm Size Over Time = 15mm
RG3 - Lindsay
Projected Events 1 in 25-Year Storm
Intensity Over Timestamp = 45 min (mm/hr) 56.35
45 mins I/I Rate (L/s/ha) L/s 24.27 13.37 13.87 11.55 16.93 16.36 19.39 12.89 41.28 31.22
L/s/ha 0.35 0.19 0.20 0.17 0.24 0.23 0.28 0.18 0.59 0.45
L11
0 1.80
1.60
1.40
y = 0.0169x R² = 0.8723
1.20
I/I Rate (L/s/ha)
L11 Catchment Area:
I/I Projection
1 in 25 Year Design I/I Rate= 0.95 L/s/ha
1.00
1 in 25 Year Storm
0.80
0.60
L/s/ha 0.95
0.40
0.20
0.00
0.0
10.0
20.0
30.0
40.0
50.0
60.0
70.0
80.0
90.0
Peak Intensity Over Tc (mm/hr) Captured RDII Events
Civica Infrastructure Inc. www.civi.ca
Projected I/I Events
Linear (Captured RDII Events)
100.0
KAW22-0003 Flow Data Analysis for Kawartha Lakes 71.50 ha
TC:
Event
Total precipitation
Duration
Peak intensity over station's Tc
09-Feb-23 31-Mar-23 05-Apr-23 30-Apr-23 19-May-23 11-Jun-23 26-Jun-23 27-Jun-23 03-Aug-23 07-Sep-23
(mm) 40 19 18 16 32 35 18 24 41 22
(hr) 14 23 13 10 19 26 8 5 5 1
(mm/Tc) 6.3 5.0 7.2 4.3 7.4 6.2 10.8 8.9 38.2 25.9
Min. Storm Size Over Time = 15mm
Projected Events 1 in 25-Year Storm
RG3 - Lindsay Intensity Over Timestamp = 50 min (mm/hr) 52.35
50 mins I/I Rate (L/s/ha) L/s 36.78 19.39 25.43 22.23 28.15 17.75 14.48 13.49 13.64 14.21
L/s/ha 0.51 0.27 0.36 0.31 0.39 0.25 0.20 0.19 0.19 0.20
L12
0 1.20
1.00 y = 0.0115x R² = 0.36 0.80
I/I Rate (L/s/ha)
L12 Catchment Area:
I/I Projection
1 in 25 Year Design I/I Rate= 0.60 L/s/ha
0.60
1 in 25 Year Storm 0.40
L/s/ha 0.60 0.20
0.00
0.0
10.0
20.0
30.0
40.0
50.0
60.0
70.0
80.0
90.0
Peak Intensity Over Tc (mm/hr) Captured RDII Events
Civica Infrastructure Inc. www.civi.ca
Projected I/I Events
Linear (Captured RDII Events)
100.0
KAW22-0003 Flow Data Analysis for Kawartha Lakes 44.80 ha
TC:
Event
Total precipitation
Duration
16-Feb-22 13-Apr-22 26-May-22 06-Jun-22 11-Jun-22
(mm) 18 17 20 30 42
(hr) 13 29 28 32 25
Min. Storm Size Over Time = 15mm
RG2 - Lindsay
Projected Events 1 in 25-Year Storm
Intensity Over Timestamp = 20 min (mm/hr) 93.51
Peak intensity over station's Tc (mm/Tc) 3.8 10.5 17.3 11.3 32.3
I/I Projection L/s/ha 1.84
20 mins
1-1
I/I Rate (L/s/ha)
0
3.00
L/s L/s/ha 14.32 0.32 Event not recorded 2.82 0.06 8.94 0.20 34.19 0.76
2.50
2.00
I/I Rate (L/s/ha)
1-1 Catchment Area:
y = 0.0197x R² = 0.7889
1 in 25 Year Design I/I Rate= 1.84 L/s/ha
1 in 25 Year Storm
1.50
1.00
0.50
0.00
0.0
20.0
40.0
60.0
80.0
100.0
120.0
Peak Intensity Over Tc (mm/hr) Captured RDII Events
Civica Infrastructure Inc. www.civi.ca
Projected I/I Events
Linear (Captured RDII Events)
140.0
KAW22-0003 Flow Data Analysis for Kawartha Lakes 74.60 ha
TC:
Event
Total precipitation
Duration
Peak intensity over station's Tc
16-Feb-22 13-Apr-22 26-May-22 06-Jun-22 11-Jun-22 12-Jul-22 18-Jul-22 17-Aug-22 21-Aug-22 25-Aug-22 29-Aug-22 12-Sep-22 18-Sep-22 12-Oct-22
(mm) 18 17 20 30 42 16 22 18 18 16 29 22 25 21
(hr) 13 29 28 32 25 8 43 2 31 9 3 25 6 15
(mm/Tc) 3.6 10.2 14.4 30.0 27.0 25.8 1.2 35.4 12.0 25.8 41.4 9.6 18.0 8.4
Min. Storm Size Over Time = 15mm
RG2 - Lindsay
Projected Events 1 in 25-Year Storm
Intensity Over Timestamp = 25 min (mm/hr) 82.31
25 mins I/I Rate (L/s/ha) L/s 13.49 1.82 1.33 3.87 17.90 0.00 8.03 3.41 2.60 6.29 12.94 0.51 4.46 1.79
L/s/ha 0.18 0.02 0.02 0.05 0.24 0.00 0.11 0.05 0.03 0.08 0.17 0.01 0.06 0.02
1-2 Total
0 0.45
0.40 y = 0.0032x R² = 0.4706
0.35
0.30
1 in 25 Year Design I/I Rate= 0.26 L/s/ha I/I Rate (L/s/ha)
1-2 Total Catchment Area:
0.25 1 in 25 Year Storm 0.20
0.15
I/I Projection 0.10
L/s/ha 0.26
0.05
0.00
0.0
20.0
40.0
60.0
80.0
100.0
120.0
Peak Intensity Over Tc (mm/hr) Captured RDII Events
Civica Infrastructure Inc. www.civi.ca
Projected I/I Events
Linear (Captured RDII Events)
140.0
KAW22-0003 Flow Data Analysis for Kawartha Lakes 74.60 ha
TC:
Event
Total precipitation
Duration
Peak intensity over station's Tc
26-May-22 06-Jun-22 11-Jun-22 12-Jul-22 18-Jul-22 17-Aug-22 21-Aug-22 25-Aug-22 29-Aug-22 12-Sep-22 18-Sep-22 12-Oct-22
(mm) 20 30 42 16 22 18 18 16 29 22 25 21
(hr) 28 32 25 8 43 2 31 9 3 25 6 15
(mm/Tc) 12.0 9.0 24.0 22.5 1.0 29.5 10.5 24.0 39.5 8.0 17.0 7.5
Min. Storm Size Over Time = 15mm
RG2 - Lindsay
Projected Events 1 in 25-Year Storm
Intensity Over Timestamp = 30 min (mm/hr) 73.65
30 mins I/I Rate (L/s/ha) L/s 20.74 19.24 50.19 38.11 18.27 32.05 18.51 30.75 43.90 25.45 21.90 22.58
L/s/ha 0.28 0.26 0.67 0.51 0.24 0.43 0.25 0.41 0.59 0.34 0.29 0.30
2-1 Total
0 3.00
2.50
y = 0.019x R² = 0.886
2.00
I/I Rate (L/s/ha)
2-1 Total Catchment Area:
1.50
1 in 25 Year Design I/I Rate= 1.40 L/s/ha 1 in 25 Year Storm
1.00
I/I Projection L/s/ha 1.40
0.50
0.00
0.0
20.0
40.0
60.0
80.0
100.0
120.0
Peak Intensity Over Tc (mm/hr) Captured RDII Events
Civica Infrastructure Inc. www.civi.ca
Projected I/I Events
Linear (Captured RDII Events)
140.0
KAW22-0003 Flow Data Analysis for Kawartha Lakes 99.20 ha
TC:
35 mins
Event
Total precipitation
Duration
Peak intensity over station's Tc
I/I Rate (L/s/ha)
16-Feb-22 13-Apr-22 26-May-22 06-Jun-22 11-Jun-22 12-Jul-22 18-Jul-22 17-Aug-22 21-Aug-22 25-Aug-22 29-Aug-22 12-Sep-22 18-Sep-22 12-Oct-22
(mm) 18 17 20 30 42 16 22 18 18 16 29 22 25 21
(hr) 13 29 28 32 25 8 43 2 31 9 3 25 6 15
(mm/Tc) 3.0 10.3 10.7 8.6 23.6 19.7 1.3 25.3 9.4 22.3 35.6 7.3 15.4 6.9
L/s L/s/ha 43.19 0.44 Event not recorded 40.56 0.41 21.64 0.22 82.24 0.83 24.62 0.25 20.38 0.21 20.74 0.21 11.33 0.11 26.93 0.27 44.56 0.45 20.40 0.21 20.11 0.20 21.88 0.22
Min. Storm Size Over Time = 15mm
RG2 - Lindsay
Projected Events 1 in 25-Year Storm
Intensity Over Timestamp = 35 min (mm/hr) 66.73
2-2 Total
0 1.80
1.60 y = 0.0168x R² = 0.6769
1.40
1.20
I/I Rate (L/s/ha)
2-2 Total Catchment Area:
1 in 25 Year Design I/I Rate= 1.12 L/s/ha
1.00
1 in 25 Year Storm
0.80
0.60
I/I Projection 0.40
L/s/ha 1.12
0.20
0.00
0.0
20.0
40.0
60.0
80.0
100.0
Peak Intensity Over Tc (mm/hr) Captured RDII Events
Civica Infrastructure Inc. www.civi.ca
Projected I/I Events
Linear (Captured RDII Events)
120.0
KAW22-0003 Flow Data Analysis for Kawartha Lakes 24.30 ha
TC:
Event
Total precipitation
Duration
Peak intensity over station's Tc
16-Feb-22 13-Apr-22 26-May-22 06-Jun-22 11-Jun-22 12-Jul-22 18-Jul-22 17-Aug-22 21-Aug-22 25-Aug-22 29-Aug-22 12-Sep-22 18-Sep-22 12-Oct-22
(mm) 18 17 20 30 42 16 22 18 18 16 29 22 25 21
(hr) 13 29 28 32 25 8 43 2 31 9 3 25 6 15
(mm/Tc) 3.0 9.0 12.0 9.0 24.0 22.5 1.0 29.5 10.5 24.0 39.5 8.0 17.0 7.5
Min. Storm Size Over Time = 15mm
RG2 - Lindsay
Projected Events 1 in 25-Year Storm
Intensity Over Timestamp = 30 min (mm/hr) 73.65
30 mins I/I Rate (L/s/ha) L/s 11.69 1.07 1.95 5.69 13.54 2.26 7.29 1.64 2.49 5.52 8.65 2.18 7.32 1.95
L/s/ha 0.48 0.04 0.08 0.23 0.56 0.09 0.30 0.07 0.10 0.23 0.36 0.09 0.30 0.08
2-3
0 1.20
1.00
y = 0.0101x R² = 0.5001 0.80
I/I Rate (L/s/ha)
2-3 Catchment Area:
1 in 25 Year Design I/I Rate= 0.74 L/s/ha 1 in 25 Year Storm
0.60
0.40
I/I Projection L/s/ha 0.74
0.20
0.00
0.0
20.0
40.0
60.0
80.0
100.0
Peak Intensity Over Tc (mm/hr) Captured RDII Events
Civica Infrastructure Inc. www.civi.ca
Projected I/I Events
Linear (Captured RDII Events)
120.0
KAW22-0003 Flow Data Analysis for Kawartha Lakes 54.50 ha
TC:
Event
Total precipitation
Duration
Peak intensity over station's Tc
16-Feb-22 13-Apr-22 26-May-22 06-Jun-22 11-Jun-22 12-Jul-22 18-Jul-22 17-Aug-22 21-Aug-22 25-Aug-22 29-Aug-22 12-Sep-22 18-Sep-22 12-Oct-22
(mm) 18 17 20 30 42 16 22 18 18 16 29 22 25 21
(hr) 13 29 28 32 25 8 43 2 31 9 3 25 6 15
(mm/Tc) 18.0 7.5 9.8 7.9 22.5 17.6 1.1 22.1 9.0 20.3 31.5 7.9 16.1 6.4
Min. Storm Size Over Time = 15mm
RG2 - Lindsay
Projected Events 1 in 25-Year Storm
40 mins I/I Rate (L/s/ha) L/s 26.81 10.06 21.63 24.06 55.16 49.78 21.48 48.12 18.82 41.84 58.51 16.30 36.64 17.72
L/s/ha 0.49 0.18 0.40 0.44 1.01 0.91 0.39 0.88 0.35 0.77 1.07 0.30 0.67 0.33
4-1
0 4.00
3.50 y = 0.0391x R² = 0.9495
3.00
1 in 25 Year Design I/I Rate= 2.39 L/s/ha
2.50
I/I Rate (L/s/ha)
4-1 Catchment Area:
1 in 25 Year Storm
2.00
1.50
Intensity Over Timestamp = 40 min (mm/hr) 61.07
I/I Projection 1.00
L/s/ha 2.39 0.50
0.00
0.0
20.0
40.0
60.0
80.0
100.0
Peak Intensity Over Tc (mm/hr) Captured RDII Events
Civica Infrastructure Inc. www.civi.ca
Projected I/I Events
Linear (Captured RDII Events)
120.0
KAW22-0003 Flow Data Analysis for Kawartha Lakes 5.80 ha
TC:
Event
Total precipitation
Duration
Peak intensity over station's Tc
16-Feb-22 13-Apr-22 26-May-22 06-Jun-22 11-Jun-22 12-Jul-22 18-Jul-22 17-Aug-22 21-Aug-22 25-Aug-22 29-Aug-22 12-Sep-22 18-Sep-22 12-Oct-22
(mm) 18 17 20 30 42 16 22 18 18 16 29 22 25 21
(hr) 13 29 28 32 25 8 43 2 31 9 3 25 6 15
(mm/Tc) 3.6 10.2 14.4 30.0 27.0 25.8 1.2 35.4 12.0 25.8 41.4 9.6 18.0 8.4
Min. Storm Size Over Time = 15mm
RG2 - Lindsay
Projected Events 1 in 25-Year Storm
Intensity Over Timestamp = 25 min (mm/hr) 82.31
25 mins I/I Rate (L/s/ha) L/s 4.39 0.91 0.37 3.06 8.11 0.97 1.77 2.01 0.47 3.46 5.70 0.67 2.26 1.13
L/s/ha 0.76 0.16 0.06 0.53 1.40 0.17 0.31 0.35 0.08 0.60 0.98 0.12 0.39 0.19
5-1a
0 2.50
y = 0.0207x R² = 0.6408
2.00
1 in 25 Year Design I/I Rate= 1.70 L/s/ha
I/I Rate (L/s/ha)
5-1a Catchment Area:
1 in 25 Year Storm
1.50
1.00
I/I Projection L/s/ha 1.70
0.50
0.00
0.0
20.0
40.0
60.0
80.0
100.0
Peak Intensity Over Tc (mm/hr) Captured RDII Events
Civica Infrastructure Inc. www.civi.ca
Projected I/I Events
Linear (Captured RDII Events)
120.0
KAW22-0003 Flow Data Analysis for Kawartha Lakes 37.70 ha
TC:
35 mins
Event
Total precipitation
Duration
Peak intensity over station's Tc
I/I Rate (L/s/ha)
16-Feb-22 13-Apr-22 26-May-22 06-Jun-22 11-Jun-22 12-Jul-22 18-Jul-22 17-Aug-22 21-Aug-22 25-Aug-22 29-Aug-22 12-Sep-22 18-Sep-22 12-Oct-22
(mm) 18 17 20 30 42 16 22 18 18 16 29 22 25 21
(hr) 13 29 28 32 25 8 43 2 31 9 3 25 6 15
(mm/Tc) 3.0 10.3 10.7 8.6 23.6 19.7 1.3 25.3 9.4 22.3 35.6 7.3 15.4 6.9
L/s L/s/ha 15.76 0.42 Event not recorded 0.04 0.00 2.75 0.07 18.06 0.48 1.75 0.05 5.91 0.16 4.48 0.12 1.78 0.05 6.88 0.18 9.41 0.25 3.16 0.08 4.08 0.11 1.98 0.05
Min. Storm Size Over Time = 15mm
RG2 - Lindsay
Projected Events 1 in 25-Year Storm
Intensity Over Timestamp = 35 min (mm/hr) 66.73
5-2 Total
0 0.90
0.80
y = 0.0084x R² = 0.4915
0.70
0.60
I/I Rate (L/s/ha)
5-2 Total Catchment Area:
1 in 25 Year Design I/I Rate= 0.56 L/s/ha
0.50
1 in 25 Year Storm
0.40
0.30
I/I Projection 0.20
L/s/ha 0.56
0.10
0.00
0.0
20.0
40.0
60.0
80.0
100.0
Peak Intensity Over Tc (mm/hr) Captured RDII Events
Civica Infrastructure Inc. www.civi.ca
Projected I/I Events
Linear (Captured RDII Events)
120.0
KAW22-0003 Flow Data Analysis for Kawartha Lakes 6-1 Catchment Area:
12.50 ha
TC:
20 mins
Event
Total precipitation
Duration
Peak intensity over station's Tc
I/I Rate (L/s/ha)
16-Feb-22 13-Apr-22 26-May-22 06-Jun-22 11-Jun-22 12-Jul-22 18-Jul-22
(mm) 18 17 20 30 42 16 22
(hr) 13 29 28 32 25 8 43
(mm/Tc) 3.8 10.5 17.3 11.3 32.3 31.5 1.5
L/s L/s/ha 3.87 0.31 1.18 0.09 Event not recorded Event not recorded Event not recorded 7.66 0.61 1.62 0.13
Min. Storm Size Over Time = 15mm
RG2 - Lindsay
2.50
2.00
1 in 25-Year Storm
y = 0.0194x R² = 0.8438
1 in 25 Year Design I/I Rate= 1.81 L/s/ha
1 in 25 Year Storm
I/I Rate (L/s/ha)
Projected Events
6-1
0
Intensity Over Timestamp = 20 min (mm/hr) 93.51
1.50
1.00
I/I Projection L/s/ha 1.81
0.50
0.00
0.0
20.0
40.0
60.0
80.0
100.0
Peak Intensity Over Tc (mm/hr) Captured RDII Events
Civica Infrastructure Inc. www.civi.ca
Projected I/I Events
Linear (Captured RDII Events)
120.0
KAW22-0003 Flow Data Analysis for Kawartha Lakes 421.00 ha
TC:
100 mins
Event
Total precipitation
Duration
Peak intensity over station's Tc
I/I Rate (L/s/ha)
16-Feb-22 13-Apr-22 26-May-22 06-Jun-22 11-Jun-22 12-Jul-22 18-Jul-22 17-Aug-22 21-Aug-22 25-Aug-22 29-Aug-22 12-Sep-22 18-Sep-22 12-Oct-22
(mm) 18 17 20 30 42 16 22 18 18 16 29 22 25 21
(hr) 13 29 28 32 25 8 43 2 31 9 3 25 6 15
(mm/Tc) 2.7 4.2
L/s L/s/ha 99.25 0.24 17.67 0.04 Event not recorded Event not recorded Event not recorded 47.23 0.11 27.77 0.07 64.25 0.15 44.36 0.11 87.52 0.21 57.97 0.14 Event not recorded 59.86 0.14 22.93 0.05
Min. Storm Size Over Time = 15mm
RG2 - Lindsay
Projected Events 1 in 25-Year Storm
Intensity Over Timestamp = 100 min (mm/hr) 31.22
8.1 1.1 10.4 4.5 8.9 5.7 10.1 3.8
6-2 Total
0 1.00
0.90
y = 0.0181x R² = 0.7605
0.80
0.70
I/I Rate (L/s/ha)
6-2 Total Catchment Area:
0.60
1 in 25 Year Design I/I Rate= 0.57 L/s/ha
0.50
1 in 25 Year Storm
0.40
I/I Projection
0.30
L/s/ha 0.57
0.20
0.10
0.00
0.0
10.0
20.0
30.0
40.0
50.0
Peak Intensity Over Tc (mm/hr) Captured RDII Events
Civica Infrastructure Inc. www.civi.ca
Projected I/I Events
Linear (Captured RDII Events)
60.0
KAW22-0003 Flow Data Analysis for Kawartha Lakes 380.80 ha
TC:
Event
Total precipitation
Duration
Peak intensity over station's Tc
16-Feb-22 13-Apr-22 26-May-22 06-Jun-22 11-Jun-22 12-Jul-22 18-Jul-22 17-Aug-22 21-Aug-22 25-Aug-22 29-Aug-22 12-Sep-22 18-Sep-22 12-Oct-22
(mm) 18 17 20 30 42 16 22 18 18 16 29 22 25 21
(hr) 13 29 28 32 25 8 43 2 31 9 3 25 6 15
(mm/Tc) 2.8 4.9 6.8 5.4 15.4 9.8 1.1 12.6 5.4 10.9 16.1 6.2 11.8 4.3
Min. Storm Size Over Time = 15mm
RG2 - Lindsay
Projected Events 1 in 25-Year Storm
80 mins I/I Rate (L/s/ha) L/s 70.06 12.57 23.54 17.76 104.34 14.61 36.92 41.52 27.01 38.27 109.90 24.64 35.32 20.93
L/s/ha 0.18 0.03 0.06 0.05 0.27 0.04 0.10 0.11 0.07 0.10 0.29 0.06 0.09 0.05
6-3 Total
0 0.80
0.70 y = 0.0127x R² = 0.7668
0.60
0.50
I/I Rate (L/s/ha)
6-3 Total Catchment Area:
1 in 25 Year Design I/I Rate= 0.47 L/s/ha 1 in 25 Year Storm
0.40
0.30
Intensity Over Timestamp = 80 min (mm/hr) 37.07
I/I Projection 0.20
L/s/ha 0.47 0.10
0.00
0.0
10.0
20.0
30.0
40.0
50.0
Peak Intensity Over Tc (mm/hr) Captured RDII Events
Civica Infrastructure Inc. www.civi.ca
Projected I/I Events
Linear (Captured RDII Events)
60.0
KAW22-0003 Flow Data Analysis for Kawartha Lakes 342.90 ha
TC:
Event
Total precipitation
Duration
Peak intensity over station's Tc
16-Feb-22 13-Apr-22 26-May-22 06-Jun-22 11-Jun-22 12-Jul-22 18-Jul-22 17-Aug-22 21-Aug-22 25-Aug-22 29-Aug-22 12-Sep-22 18-Sep-22 12-Oct-22
(mm) 18 17 20 30 42 16 22 18 18 16 29 22 25 21
(hr) 13 29 28 32 25 8 43 2 31 9 3 25 6 15
(mm/Tc) 3.0 7.5 9.8 7.9 22.5 17.6 1.1 22.1 9.0 20.3 31.5 7.9 16.1 6.4
Min. Storm Size Over Time = 15mm
RG2 - Lindsay
Projected Events 1 in 25-Year Storm
40 mins I/I Rate (L/s/ha) L/s 24.35 7.05 11.62 10.89 23.88 41.36 7.22 26.99 10.31 21.49 39.02 7.19 23.99 13.70
L/s/ha 0.07 0.02 0.03 0.03 0.07 0.12 0.02 0.08 0.03 0.06 0.11 0.02 0.07 0.04
6-4 Total
0 0.40
0.35 y = 0.0039x R² = 0.8676
0.30
1 in 25 Year Design I/I Rate= 0.24 L/s/ha
0.25
I/I Rate (L/s/ha)
6-4 Total Catchment Area:
1 in 25 Year Storm
0.20
0.15
Intensity Over Timestamp = 40 min (mm/hr) 61.07
I/I Projection 0.10
L/s/ha 0.24 0.05
0.00
0.0
20.0
40.0
60.0
80.0
100.0
Peak Intensity Over Tc (mm/hr) Captured RDII Events
Civica Infrastructure Inc. www.civi.ca
Projected I/I Events
Linear (Captured RDII Events)
120.0
KAW22-0003 Flow Data Analysis for Kawartha Lakes 275.30 ha
TC:
Event
Total precipitation
Duration
Peak intensity over station's Tc
16-Feb-22 13-Apr-22 26-May-22 06-Jun-22 11-Jun-22 12-Jul-22 18-Jul-22 17-Aug-22 21-Aug-22 25-Aug-22 29-Aug-22 12-Sep-22 18-Sep-22 12-Oct-22
(mm) 18 17 20 30 42 16 22 18 18 16 29 22 25 21
(hr) 13 29 28 32 25 8 43 2 31 9 3 25 6 15
(mm/Tc) 3.0 5.8 8.0 6.5 19.5 12.3 1.0 14.8 7.0 14.3 21.0 6.3 14.0 5.0
Min. Storm Size Over Time = 15mm
RG2 - Lindsay
Projected Events 1 in 25-Year Storm
Intensity Over Timestamp = 60 min (mm/hr) 45.93
60 mins I/I Rate (L/s/ha) L/s 45.22 7.45 11.15 22.33 78.88 9.36 21.43 37.26 12.73 28.13 74.60 10.31 21.70 8.33
L/s/ha 0.16 0.03 0.04 0.08 0.29 0.03 0.08 0.14 0.05 0.10 0.27 0.04 0.08 0.03
6-5 Total
0 0.70
0.60 y = 0.01x R² = 0.7791 0.50
I/I Rate (L/s/ha)
6-5 Total Catchment Area:
I/I Projection
1 in 25 Year Design I/I Rate= 0.46 L/s/ha 1 in 25 Year Storm
0.40
0.30
0.20
L/s/ha 0.46
0.10
0.00
0.0
10.0
20.0
30.0
40.0
50.0
60.0
70.0
Peak Intensity Over Tc (mm/hr) Captured RDII Events
Civica Infrastructure Inc. www.civi.ca
Projected I/I Events
Linear (Captured RDII Events)
80.0
KAW22-0003 Flow Data Analysis for Kawartha Lakes 156.70 ha
TC:
Event
Total precipitation
Duration
Peak intensity over station's Tc
16-Feb-22 13-Apr-22 26-May-22 06-Jun-22 11-Jun-22 12-Jul-22 18-Jul-22 17-Aug-22 21-Aug-22 25-Aug-22 29-Aug-22 12-Sep-22 18-Sep-22 12-Oct-22
(mm) 18 17 20 30 42 16 22 18 18 16 29 22 25 21
(hr) 13 29 28 32 25 8 43 2 31 9 3 25 6 15
(mm/Tc) 3.0 10.3 10.7 8.6 23.6 19.7 1.3 25.3 9.4 22.3 35.6 7.3 15.4 6.9
Min. Storm Size Over Time = 15mm
RG2 - Lindsay
Projected Events 1 in 25-Year Storm
Intensity Over Timestamp = 35 min (mm/hr) 66.73
35 mins I/I Rate (L/s/ha) L/s 10.39 0.85 0.63 0.40 14.31 5.17 7.75 19.11 5.98 11.15 12.17 3.82 7.36 3.29
L/s/ha 0.07 0.01 0.00 0.00 0.09 0.03 0.05 0.12 0.04 0.07 0.08 0.02 0.05 0.02
6-6
0 0.30
y = 0.0029x R² = 0.7547
0.25
1 in 25 Year Design I/I Rate= 0.20 L/s/ha
0.20
I/I Rate (L/s/ha)
6-6 Catchment Area:
1 in 25 Year Storm 0.15
0.10
I/I Projection L/s/ha 0.20
0.05
0.00
0.0
20.0
40.0
60.0
80.0
100.0
Peak Intensity Over Tc (mm/hr) Captured RDII Events
Civica Infrastructure Inc. www.civi.ca
Projected I/I Events
Linear (Captured RDII Events)
120.0
KAW22-0003 Flow Data Analysis for Kawartha Lakes 36.70 ha
TC:
Event
Total precipitation
Duration
Peak intensity over station's Tc
16-Feb-22 13-Apr-22 26-May-22 06-Jun-22 11-Jun-22 12-Jul-22 18-Jul-22 17-Aug-22 21-Aug-22 25-Aug-22 29-Aug-22 12-Sep-22 18-Sep-22 12-Oct-22
(mm) 18 17 20 30 42 16 22 18 18 16 29 22 25 21
(hr) 13 29 28 32 25 8 43 2 31 9 3 25 6 15
(mm/Tc) 3.0 9.0 12.0 9.0 24.0 22.5 1.0 29.5 10.5 24.0 39.5 8.0 17.0 7.5
Min. Storm Size Over Time = 15mm
RG2 - Lindsay
Projected Events 1 in 25-Year Storm
Intensity Over Timestamp = 30 min (mm/hr) 73.65
30 mins I/I Rate (L/s/ha) L/s 8.04 2.67 1.36 4.27 7.56 2.39 3.70 9.00 1.50 4.14 8.17 2.08 6.01 1.62
L/s/ha 0.22 0.07 0.04 0.12 0.21 0.07 0.10 0.25 0.04 0.11 0.22 0.06 0.16 0.04
6-7
0 0.70
0.60
y = 0.0065x R² = 0.742
1 in 25 Year Design I/I Rate= 0.48 L/s/ha
0.50
1 in 25 Year Storm
I/I Rate (L/s/ha)
6-7 Catchment Area:
I/I Projection
0.40
0.30
0.20
L/s/ha 0.48
0.10
0.00
0.0
20.0
40.0
60.0
80.0
100.0
Peak Intensity Over Tc (mm/hr) Captured RDII Events
Civica Infrastructure Inc. www.civi.ca
Projected I/I Events
Linear (Captured RDII Events)
120.0
KAW22-0003 Flow Data Analysis for Kawartha Lakes 106.01 ha
Event 31-Mar-23 05-Apr-23 30-Apr-23 25-Jun-23 26-Jun-23 27-Jun-23 13-Jul-23 29-Jul-23 12-Aug-23 05-Oct-23 08-Oct-23 Min. Storm Size Over Time = 15mm
Projected Events
1 in 25-Year Storm
Total precipitation
TC: Duration
(mm) 22 34 25 18 20 15 19 19 23 23 30 RG2 - Fenelon Falls
Peak intensity over station's Tc
(hr) 18 11 8 1 9 8 4 3 11 24 34
(mm/Tc) 6.0 16.0 7.5 20.5 19.5 11.0 8.5 28.4 31.5 9.7 6.1
Intensity Over Timestamp = 30 min
I/I Projection
(mm/hr) 73.60
L/s/ha 0.55
30 mins I/I Rate (L/s/ha) L/s 23.97 44.58 22.25 7.41 13.51 12.84 6.97 14.40 11.21 9.67 14.82
L/s/ha 0.23 0.42 0.21 0.07 0.13 0.12 0.07 0.14 0.11 0.09 0.14
F1
0
0.70
0.60
y = 0.0075x R² = 0.492
1 in 25 Year Design I/I Rate= 0.55 L/s/ha 1 in 25 Year Storm
0.50
I/I Rate (L/s/ha)
F1 Catchment Area:
0.40
0.30
0.20
0.10
0.00
0.0
10.0
20.0
30.0
40.0
50.0
60.0
70.0
80.0
90.0
Peak Intensity Over Tc (mm/hr) Captured RDII Events
Civica Infrastructure Inc. www.civi.ca
Projected I/I Events
Linear (Captured RDII Events)
100.0
KAW22-0003 Flow Data Analysis for Kawartha Lakes 9.95 ha
Event 31-Mar-23 05-Apr-23 30-Apr-23 29-Jul-23 12-Aug-23 05-Oct-23 08-Oct-23 Min. Storm Size Over Time = 15mm
Total precipitation (mm) 22 34 25 18 24 23 30 RG1 - Fenelon Falls
Projected Events
1 in 25-Year Storm
TC: Duration (hr) 18 11 8 2 13 24 34
Peak intensity over station's Tc (mm/Tc) 6.6 17.4 7.8 28.8 28.8 11.0 6.1
Intensity Over Timestamp = 25 min
I/I Projection
(mm/hr) 82.31
L/s/ha 0.73
25 mins I/I Rate (L/s/ha) L/s 0.75 7.01 1.74 0.88 0.82 0.29 0.86
L/s/ha 0.07 0.70 0.17 0.09 0.08 0.03 0.09
F2
0
1.20
y = 0.0089x R² = 0.3205
1.00
0.80
I/I Rate (L/s/ha)
F2 Catchment Area:
1 in 25 Year Design I/I Rate= 0.73 L/s/ha 1 in 25 Year Storm
0.60
0.40
0.20
0.00
0.0
20.0
40.0
60.0
80.0
100.0
Peak Intensity Over Tc (mm/hr) Captured RDII Events
Civica Infrastructure Inc. www.civi.ca
Projected I/I Events
Linear (Captured RDII Events)
120.0
KAW22-0003 Flow Data Analysis for Kawartha Lakes 173.00 ha
TC:
Total precipitation
Duration
Peak intensity over station's Tc
31-Mar-23 05-Apr-23 30-Apr-23 25-Jun-23 26-Jun-23 27-Jun-23 13-Jul-23 29-Jul-23 12-Aug-23 05-Oct-23 08-Oct-23
(mm) 22 34 25 18 20 15 19 18 24 23 30
(hr) 18 11 8 1 9 8 4 2 13 24 34
(mm/Tc) 5.6 15.4 6.9 20.6 17.6 9.9 7.7 21.4 22.3 8.7 6.1
Min. Storm Size Over Time = 15mm
RG1 - Fenelon Falls
Event
Projected Events 1 in 25-Year Storm
Intensity Over Timestamp = 35 min (mm/hr) 66.73
35 mins I/I Rate (L/s/ha) L/s 14.91 47.32 10.78 5.10 6.67 10.39 5.93 6.81 9.72 5.41 12.75
L/s/ha 0.09 0.27 0.06 0.03 0.04 0.06 0.03 0.04 0.06 0.03 0.07
F3
0 0.40
y = 0.0044x R² = 0.4282
0.35
1 in 25 Year Design I/I Rate= 0.29 L/s/ha
0.30
0.25
I/I Rate (L/s/ha)
F3 Catchment Area:
1 in 25 Year Storm
0.20
0.15
I/I Projection L/s/ha 0.29
0.10
0.05
0.00
0.0
10.0
20.0
30.0
40.0
50.0
60.0
70.0
Peak Intensity Over Tc (mm/hr) Captured RDII Events
Civica Infrastructure Inc. www.civi.ca
Projected I/I Events
Linear (Captured RDII Events)
80.0
KAW22-0003 Flow Data Analysis for Kawartha Lakes 99.50 ha
TC:
Event
Total precipitation
Duration
Peak intensity over station's Tc
09-Feb-23 16-Mar-23 31-Mar-23 05-Apr-23 28-Apr-23 19-May-23 11-Jun-23 27-Jun-23 13-Jul-23 20-Jul-23 29-Jul-23 12-Aug-23 05-Oct-23 08-Oct-23
(mm) 40 20 22 29 34 35 51 15 16 18 17 15 36 29
(hr) 14 13 17 11 53 18 29 11 4 19 3 26 35 81
(mm/Tc) 9.0 3.0 7.0 17.5 8.5 7.0 10.5 8.5 7.0 8.5 13.0 22.5 16.5 3.5
Min. Storm Size Over Time = 15mm
RG1 - Bobcaygeon
Projected Events
1 in 25-Year Storm
30 mins I/I Rate (L/s/ha) L/s 14.91 6.47 7.60 15.78 4.83 9.56 7.87 4.87 6.14 6.05 8.19 17.40 8.41 7.19
L/s/ha 0.15 0.07 0.08 0.16 0.05 0.10 0.08 0.05 0.06 0.06 0.08 0.17 0.08 0.07
B2
0 1.00 0.90 0.80
y = 0.0081x R² = 0.8841
0.70
I/I Rate (L/s/ha)
B2 Catchment Area:
1 in 25 Year Design I/I Rate= 0.60 L/s/ha
0.60
1 in 25 Year Storm
0.50 0.40 0.30
Intensity Over Timestamp = 30 min
I/I Projection
0.20
(mm/hr) 73.60
L/s/ha 0.60
0.10 0.00
0.0
10.0
20.0
30.0
40.0
50.0
60.0
70.0
80.0
90.0
Peak Intensity Over Tc (mm/hr) Captured RDII Events
Civica Infrastructure Inc. www.civi.ca
Projected I/I Events
Linear (Captured RDII Events)
100.0
KAW22-0003 Flow Data Analysis for Kawartha Lakes 49.60 ha Total precipitation
Event 09-Feb-23 16-Mar-23 31-Mar-23 05-Apr-23 28-Apr-23 19-May-23 11-Jun-23 27-Jun-23 13-Jul-23 20-Jul-23 29-Jul-23 12-Aug-23 05-Oct-23 08-Oct-23 Min. Storm Size Over Time = 15mm
(mm) 40 20 22 29 34 35 51 15 16 18 17 15 36 29 RG1 - Bobcaygeon
Projected Events 1 in 25-Year Storm
TC: Duration
Peak intensity over station's Tc
(hr) 14 13 17 11 53 18 29 11 4 19 3 26 35 81
(mm/Tc) 9.0 3.0 7.0 17.5 8.5 7.0 10.5 8.5 7.0 8.5 13.0 22.5 16.5 3.5
Intensity Over Timestamp = 30 min (mm/hr) 73.60
30 mins I/I Rate (L/s/ha) L/s 2.06 0.80 0.46 1.57 0.86 0.68 0.81 0.71 0.23 0.51 1.85 1.44 1.11 2.38
L/s/ha 0.04 0.02 0.01 0.03 0.02 0.01 0.02 0.01 0.00 0.01 0.04 0.03 0.02 0.05
B4
0 0.20 0.18
y = 0.0018x R² = 0.6759
0.16
1 in 25 Year Design I/I Rate= 0.13 L/s/ha
0.14
I/I Rate (L/s/ha)
B4 Catchment Area:
0.12
1 in 25 Year Storm
0.10 0.08 0.06 0.04
I/I Projection
0.02
L/s/ha 0.13
0.00
0.0
10.0
20.0
30.0
40.0
50.0
60.0
70.0
80.0
90.0
Peak Intensity Over Tc (mm/hr) Captured RDII Events
Civica Infrastructure Inc. www.civi.ca
Projected I/I Events
Linear (Captured RDII Events)
100.0
KAW22-0003 Flow Data Analysis for Kawartha Lakes 225.00 ha
TC:
Total precipitation
Duration
Peak intensity over station's Tc
09-Feb-23 16-Mar-23 31-Mar-23 05-Apr-23 29-Apr-23 19-May-23 11-Jun-23 27-Jun-23 13-Jul-23 29-Jul-23 12-Aug-23 05-Oct-23 08-Oct-23
(mm) 40 19 23 33 23 36 48 16 17 21 17 36 29
(hr) 14 15 29 11 47 20 35 11 6 4 26 35 81
(mm/Tc) 8.1 3.0 9.0 16.7 6.4 7.3 8.6 6.0 7.3 14.1 24.4 15.0 3.4
Min. Storm Size Over Time = 15mm
RG2 - Bobcaygeon
Event
Projected Events 1 in 25-Year Storm
Intensity Over Timestamp = 35 min (mm/hr) 66.73
35 mins I/I Rate (L/s/ha) L/s 28.20 26.06 32.16 46.94 42.83 22.95 15.77 17.31 9.43 10.16 21.44 21.69 17.72
L/s/ha 0.13 0.12 0.14 0.21 0.19 0.10 0.07 0.08 0.04 0.05 0.10 0.10 0.08
B5
0 0.60
1 in 25 Year Design I/I Rate= 0.55 L/s/ha
y = 0.0082x R² = 0.6488
0.50 1 in 25 Year Storm 0.40
I/I Rate (L/s/ha)
B5 Catchment Area:
0.30
0.20
I/I Projection L/s/ha 0.55
0.10
0.00
0.0
10.0
20.0
30.0
40.0
50.0
60.0
70.0
Peak Intensity Over Tc (mm/hr) Captured RDII Events
Civica Infrastructure Inc. www.civi.ca
Projected I/I Events
Linear (Captured RDII Events)
80.0
KAW22-0003 Flow Data Analysis for Kawartha Lakes 76.00 ha
TC:
Total precipitation
Duration
Peak intensity over station's Tc
09-Feb-23 16-Mar-23 31-Mar-23 05-Apr-23 28-Apr-23 19-May-23 11-Jun-23 27-Jun-23 13-Jul-23 29-Jul-23 12-Aug-23 05-Oct-23 08-Oct-23
(mm) 40 20 22 29 34 35 51 15 16 17 15 36 29
(hr) 14 13 17 11 53 18 29 11 4 3 26 35 81
(mm/Tc) 11.3 3.0 7.5 26.3 9.0 7.5 10.5 12.0 8.3 18.0 33.0 22.5 3.8
Min. Storm Size Over Time = 15mm
RG1 - Bobcaygeon
Event
Projected Events 1 in 25-Year Storm
Intensity Over Timestamp = 20 min (mm/hr) 93.51
20 mins I/I Rate (L/s/ha) L/s 8.47 9.90 11.49 11.30 11.32 13.46 14.87 12.94 16.46 15.52 15.98 24.02 18.21
L/s/ha 0.11 0.13 0.15 0.15 0.15 0.18 0.20 0.17 0.22 0.20 0.21 0.32 0.24
B6
0
y = 0.0104x R² = 0.7149
1.20
1 in 25 Year Design I/I Rate= 0.97 L/s/ha
1.00
1 in 25 Year Storm 0.80
I/I Rate (L/s/ha)
B6 Catchment Area:
0.60
0.40
I/I Projection L/s/ha 0.97
0.20
0.00
0.0
20.0
40.0
60.0
80.0
100.0
Peak Intensity Over Tc (mm/hr) Captured RDII Events
Civica Infrastructure Inc. www.civi.ca
Projected I/I Events
Linear (Captured RDII Events)
120.0
KAW22-0003 Flow Data Analysis for Kawartha Lakes 40.00 ha
TC:
Event
Total precipitation
Duration
Peak intensity over station's Tc
16-Mar-23 31-Mar-23 05-Apr-23 28-Apr-23 19-May-23 11-Jun-23 27-Jun-23 13-Jul-23 20-Jul-23 29-Jul-23 12-Aug-23 05-Oct-23 08-Oct-23
(mm) 20 22 29 34 35 51 15 16 18 17 15 36 29
(hr) 13 17 11 53 18 29 11 4 19 3 26 35 81
(mm/Tc) 3.0 7.5 26.3 9.0 7.5 10.5 12.0 8.3 9.8 18.0 33.0 22.5 3.8
Min. Storm Size Over Time = 15mm RG1 - Bobcaygeon
Projected Events 1 in 25-Year Storm
Intensity Over Timestamp = 20 min (mm/hr) 93.51
20 mins I/I Rate (L/s/ha) L/s 1.87 0.71 0.20 1.20 2.52 2.23 0.56 0.51 1.35 0.55 2.25 1.24 1.58
L/s/ha 0.05 0.02 0.00 0.03 0.06 0.06 0.01 0.01 0.03 0.01 0.06 0.03 0.04
B8
0 0.30
0.25
y = 0.0016x R² = 0.4819
0.20
I/I Rate (L/s/ha)
B8 Catchment Area:
1 in 25 Year Design I/I Rate= 0.15 L/s/ha
0.15
1 in 25 Year Storm 0.10
I/I Projection L/s/ha 0.15
0.05
0.00
0.0
20.0
40.0
60.0
80.0
100.0
Peak Intensity Over Tc (mm/hr) Captured RDII Events
Civica Infrastructure Inc. www.civi.ca
Projected I/I Events
Linear (Captured RDII Events)
120.0
KAW22-0003 Flow Data Analysis for Kawartha Lakes 31.60 ha Event 09-Feb-23 16-Mar-23 31-Mar-23 05-Apr-23 28-Apr-23 19-May-23 11-Jun-23 27-Jun-23 13-Jul-23 29-Jul-23 12-Aug-23 05-Oct-23 08-Oct-23 Min. Storm Size Over Time = 15mm
Projected Events
1 in 25-Year Storm
TC:
Total precipitation
Duration
Peak intensity over station's Tc
(mm) 40 20 22 29 34 35 51 15 16 17 15 36 29 RG1 - Bobcaygeon
(hr) 14 13 17 11 53 18 29 11 4 3 26 35 81
(mm/Tc) 13.0 4.0 8.0 33.0 10.0 9.0 13.0 15.0 10.0 20.0 39.0 27.0 4.0
Intensity Over Timestamp = 15 min
I/I Projection
(mm/hr) 108.59
L/s/ha 0.12
15 mins I/I Rate (L/s/ha) L/s 1.33 1.36 1.20 0.97 0.59 0.28 1.42 0.81 1.17 0.56 0.58 0.16 1.29
L/s/ha 0.04 0.04 0.04 0.03 0.02 0.01 0.04 0.03 0.04 0.02 0.02 0.01 0.04
B9
0
y = 0.0011x R² = 0.4193 0.14
1 in 25 Year Design I/I Rate= 0.12 L/s/ha 0.12 1 in 25 Year Storm 0.10
I/I Rate (L/s/ha)
B9 Catchment Area:
0.08
0.06
0.04
0.02
0.00
0.0
20.0
40.0
60.0
80.0
100.0
120.0
Peak Intensity Over Tc (mm/hr) Captured RDII Events
Civica Infrastructure Inc. www.civi.ca
Projected I/I Events
Linear (Captured RDII Events)
140.0
KAW22-0003 Flow Data Analysis for Kawartha Lakes 27.50 ha
Event 09-Feb-23 16-Mar-23 31-Mar-23 05-Apr-23 29-Apr-23 19-May-23 11-Jun-23 27-Jun-23 13-Jul-23 29-Jul-23 12-Aug-23 05-Oct-23 08-Oct-23 Min. Storm Size Over Time = 15mm
TC:
Total precipitation
Duration
Peak intensity over station's Tc
(mm) 40 19 23 33 23 36 48 16 17 21 17 36 29 RG1 - Bobcaygeon
(hr) 14 15 29 11 47 20 35 11 6 4 26 35 81
(mm/Tc) 10.2 3.0 12.6 23.4 6.6 7.8 9.6 7.2 7.8 18.6 30.0 19.2 3.6
Projected Events
1 in 25-Year Storm
Intensity Over Timestamp = 25 min
I/I Projection
(mm/hr) 82.31
L/s/ha 0.17
25 mins I/I Rate (L/s/ha) L/s 1.73 0.53 0.76 0.29 1.18 1.45 1.10 3.10 2.04 0.15 1.20 0.72 0.83
L/s/ha 0.06 0.02 0.03 0.01 0.04 0.05 0.04 0.11 0.07 0.01 0.04 0.03 0.03
B10
0 0.25
y = 0.0021x R² = 0.3656
0.20
1 in 25 Year Design I/I Rate= 0.17 L/s/ha
I/I Rate (L/s/ha)
B10 Catchment Area:
1 in 25 Year Storm
0.15
0.10
0.05
0.00
0.0
20.0
40.0
60.0
80.0
100.0
Peak Intensity Over Tc (mm/hr) Captured RDII Events
Civica Infrastructure Inc. www.civi.ca
Projected I/I Events
Linear (Captured RDII Events)
120.0