Welcome to our comprehensive analysis of Intel’s financial journey over the past decade. This magazine is a collaborativeeffortby2N’s,agroupoffinanceandbanking studentsdedicatedtoexploringtheintersectionoffinancial dataandreal-worldeconomicimpact.
Intel has long been a leader in the technology industry, shaping innovation and driving progress in the global market. Through this project, we aim to uncover how its financial performance reflects broader trends in the global economy, including the rise of digitalization, green technologies,andshiftingsupplychains.
By analyzing Intel’s financial ratios, we dive deep into the company’s strengths, challenges, and opportunities. Our goal is to make complex financial data accessible and relevant, not only for professionals in finance and banking but also for anyone interested in understanding how numberstellthestoryofatechgiantlikeIntel
We hope this magazine inspires you to see financial statementsasmorethanjustnumbersbutasareflectionof strategy,resilience,andinnovation.
INTEL IN THE GLOBAL MARKET
Overthepastdecade,Intelhasexperiencedsignificant fluctuationsinitsfinancialperformance,reflectingboth global market challenges and its efforts to innovate
This section analyzes how Intel's revenue and net incomehaveevolved,sheddinglightonthecompany's performanceamidarapidlychangingtechlandscape
Intel'sFinancialEvolutionOvertheLast10Years
Intel’s trajectory has been shaped by various internal and external factors, ranging from competition in the semiconductor industry to shifting consumer demand
The table below demonstrates year-over-year changes inbothrevenueandnetincome,offeringaglimpseinto the company's resilience and its strategic response to marketforces
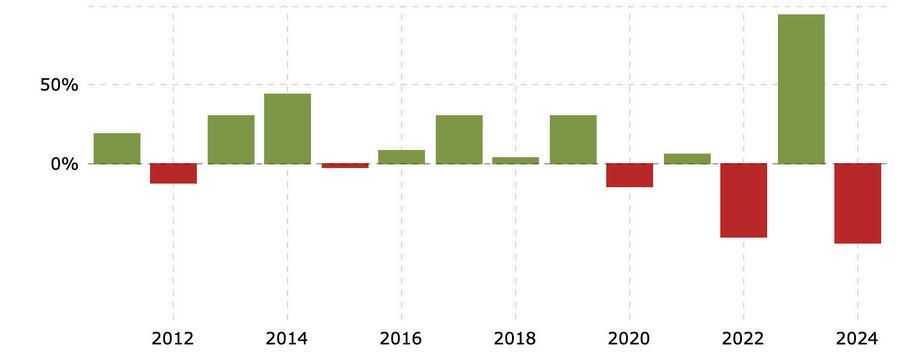
SignificantVolatility:
Intel's stock has seen substantial annual percentage changes, with peaks and troughs indicating periods of growth and challenge. For example, in 2023, Intel experiencedaremarkable94.64%increase,contrasting witha-50.58%dropin2024.Suchvolatilityisoftentied to shifts in the semiconductor industry, technological breakthroughs,orcompetitivepressures.
MarketLeadershipandCompetition:
Intelhaslongbeenaleaderinthesemiconductorindustry, a critical sector in the global tech market However, increasing competition from companies like AMD, Nvidia, and TSMC, alongside challenges in meeting demand for advancedprocessors,mayexplainperiodsofdeclinelikein 2024and2022
PandemicImpactandRecovery:
TheCOVID-19pandemicin2020reshapedglobalmarkets, impacting supply chains and semiconductor demand. Intel's -14.70% decrease in 2020 aligns with these challenges, while the subsequent recovery in 2021 and a sharprisein2023indicateadaptationandgrowth
InnovationandExpansion:
Intel's highs, such as 2023’s $5008 annual high, suggest successful product launches or expansion into emerging marketslikeAI,5G,anddatacenters.Conversely,lowslike 2024’s$18.89annuallowmightreflectsetbacksinproduct developmentormarketadaptation
Long-termGrowthPotential:
Despite periods of decline, Intel's stock shows resilience with significant upward trends, particularly in years like 2014and 2019, driven by innovation and strong market demandforprocessors.
CURRENT TRENDS AND CHALLENGES
Intelhasfacedsignificantchallengesandopportunities in recent years, navigating a rapidly evolving tech landscape.Asadominantplayerinthesemiconductor industry,Intelhasbeenunderincreasingpressurefrom competitors like AMD, Nvidia, and TSMC, especially as demand for more powerful and efficient processors surges. The company has grappled with delays in advancing its manufacturing processes, leading to supply chain constraints and performance setbacks However, Intel's recent focus on diversifying its portfolio,withinvestmentsinAI,5Ginfrastructure,and data center solutions, signals a strategic shift toward emerging technologies. The ongoing global chip shortage, coupled with geopolitical tensions, adds complexity to Intel’s ability to maintain its market leadership.Despitethesechallenges,Intelcontinuesto innovate and adapt, striving to meet the growing demands of an increasingly digital world while solidifyingitspositioninnext-generationcomputing.
In response to these challenges, Intel has been making strategicmovestoregainmomentum,includingexpanding itsmanufacturingcapabilitiesthroughits"IDM2.0"strategy and forming new partnerships to bolster its production capacity.Thecompanyisalsofocusingonnext-generation chip technologies, such as its upcoming quantum computing and artificial intelligence solutions, to stay ahead of the curve While the road ahead may remain challenging, Intel’s commitment to innovation and its ability to adapt to changing market dynamics position it wellforfuturegrowth.Astheglobaldemandforadvanced semiconductorscontinuestorise,Intel’sabilitytobalance innovation with operational efficiency will be key to its continuedrelevanceintheever-competitivetechindustry.
INTEL’S FINANCIAL OUTLOOK
SECTION2
KEY REVENUE AND PROFIT METRICS
Intel Corporation, one of the world’s largest semiconductor companies, continues to dominate the microprocessor market while expanding into datacentric industries like artificial intelligence (AI) and autonomous driving As a primary supplier of microprocessors and chipsets, Intel is positioning itself at the forefront of emerging technologies The company’s data-centric business model is driven by key segments, including the Data Center Group (DCG), Internet of Things Group (IOTG), Mobileye, Non-Volatile Memory Solutions Group (NSG), and the Programmable Solutions Group (PSG)
IDCG supports cloud and enterprise markets with servers and workstations, while IOTG focuses on high-performance computing for embedded applications PSG develops programmable semiconductors, including FPGAs and structured ASICs, and Mobileye is advancing autonomous driving with cutting-edge computer vision and machine learning technologies As Intel shifts towards these new opportunities, its financial performance is crucial to understanding its ongoing transformation and future growth potential
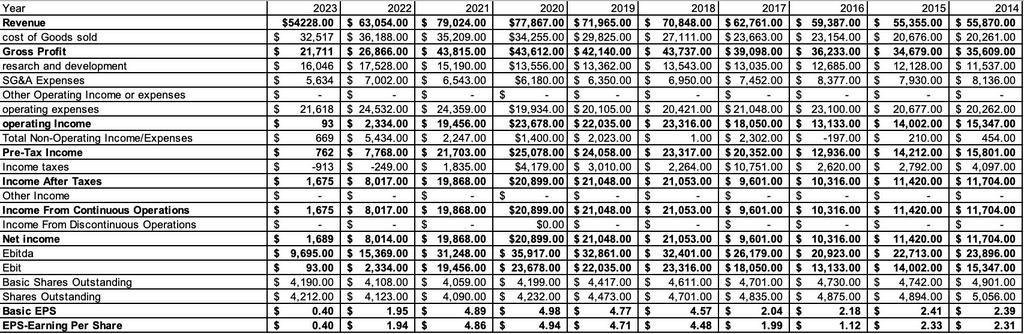
REVENUE
Revenue trend
In 2023, Intel reported annual revenue of $54.23 billion, reflecting a decrease from $63.05 billion in 2022 and $79.02 billion in 2021. This decline marks a significant shift following a period of strong growth, largely due to challenges in the semiconductor market, production delays, and increased competition. Despite this, Intel’s quarterly revenues remain robust, with Q3 2024 reaching $13.28 billion and Q2 at $12 83 billion, signaling consistent demand for its products across key segments The company ’ s annual revenue has fluctuated in recent years, from $77 87 billion in 2020 to $71.97
I billion in 2019, driven by both macroeconomic factors and shifts in demand for computing and data-center solutions. While 2021 was a high point, with $79 billion in revenue, Intel's focus on diversifying its business model into datacentric areas like AI and autonomous driving may drive future growth and help stabilize revenue trends moving forward.
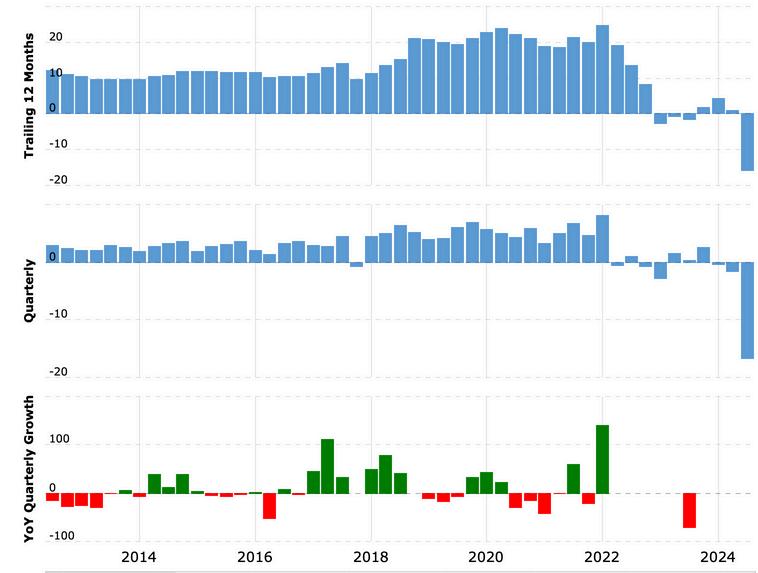
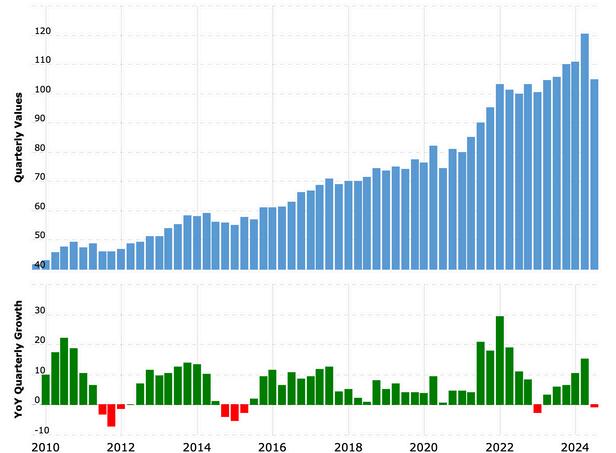
Trailing 12-Month Revenue Chart:
Intel’s revenue showed steady growth from around $50 billion in 2014, peaking near $80 billion by 2020-2021, before experiencing a decline to approximately $60 billion by 2023.
Quarterly Revenue Chart:
Intel's quarterly revenue fluctuated between $10 billion and $20 billion. The trend was upward from 2014 to 2018, with peak performances around 2018 and 2020, but post-2020, the revenue declined, with attempts at recovery that did not reach previous highs.
YoY Quarterly Growth Chart:
From 2014 to 2018, Intel enjoyed mostly positive YoY growth However, after 2019, fluctuations became more pronounced, with notable negative growth in 2022, signaling greater market volatility.
GROSSPROFIT
Gross Profit Trend
Gross profit is a crucial metric for assessing Intel’s operational efficiency, reflecting how well the company manages its production and sales processes It’s calculated by subtracting the variable costs associated with producing goods and services from total revenue From 2014 to 2024, Intel's gross profit showed consistent performance, but recent years have seen significant declines. For instance, the company reported a sharp 66 82% yearover-year drop for Q3 2024, with a total gross profit of $1 997 billion In 2023, the gross profit stood at $21 711 billion, marking a 19 19% decrease from 2022.
This trend reflects challenges in maintaining profitability amid market volatility and intensifying competition, making gross profit an essential indicator of Intel's financial health and operational effectiveness
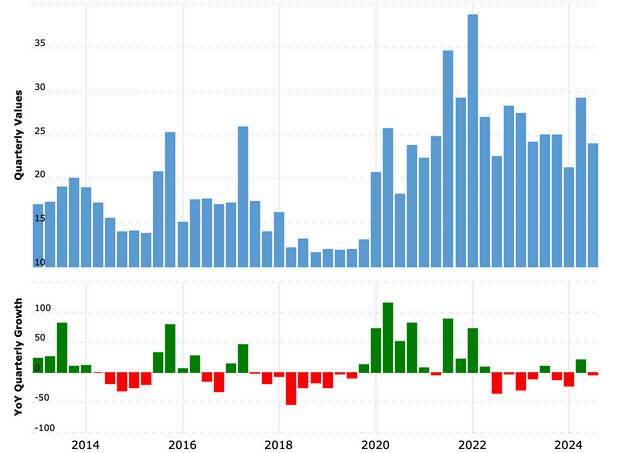
The charts provide a clear view of Intel’s financial trajectory from 2014 to 2024. The Trailing 12 Months chart shows a gradual rise in revenue from $30 billion in 2014, peaking at $45 billion in 2020, followed by a sharp decline to around $20 billion by 2024 The Quarterly Revenue chart mirrors this trend, with revenue starting at $5 billion in 2014, peaking at $12 billion in 2020, and decreasing to $5 billion by 2024. The YoY Quarterly Growth chart highlights fluctuations in growth, with periods of positive growth in 2016 and 2022, contrasted by significant declines in recent years, especially from 2020 to 2024 These charts underscore the challenges Intel faces, marked by volatility and a sharp downturn in recent years
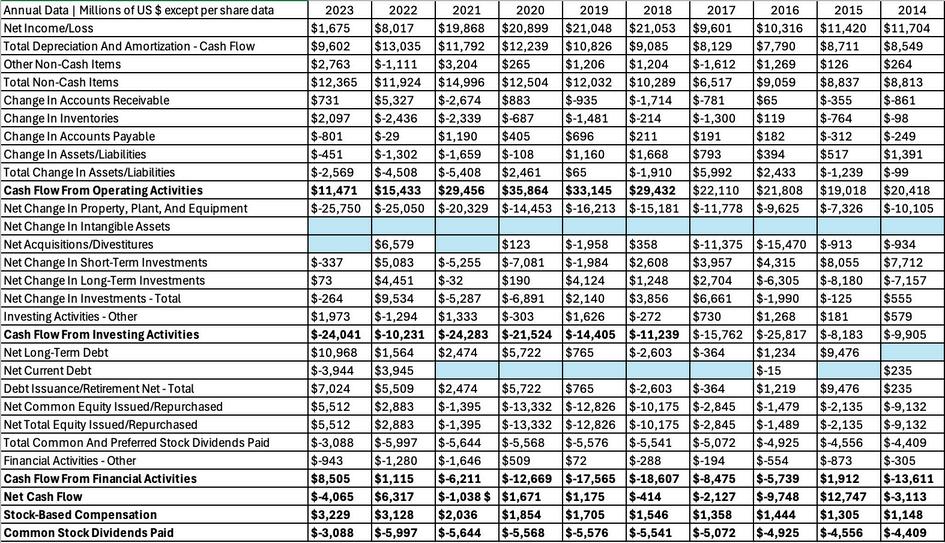
NETINCOME
Reflecting Profitability Challenges
Intel’s net income trajectory from 2010 to 2024 reveals a company grappling with increasing market volatility and operational hurdles. In Q3 2024, Intel experienced a staggering loss of $16 639 billion, marking a 5702 36% year-over-year decline The trailing 12-month net income ending September 2024 stood at a loss of $15 961 billion, an 870.86% surge in negative performance compared to the previous year. These numbers follow a broader trend: Intel’s annual net income for 2023 was $1 689 billion, down 78 92% from 2022, while 2022’s figure dropped 59 66% compared to 2021
This downward spiral began in earnest after 2021 when Intel’s net income peaked at $19.868 billion, representing only a slight decline from 2020's $20 899 billion The sharp losses highlight challenges such as escalating competition, rising operational costs, and potential inefficiencies in adapting to shifting market demands. The shift from profitability to substantial losses underlines Intel's need for strategic recalibration to navigate industry headwinds
Trailing 12 Months
: Intel's annual revenue steadily climbed from $50 billion in 2014 to a peak of $80 billion in 2020-2021
However, a clear decline followed, with revenue dropping to $60 billion by 2023, signaling a challenging phase for the company Quarterly
Revenue:
Quarterly revenue reflects similar trends. It rose consistently until 2020, peaking at $20 billion, but experienced a significant decline post-2020, settling near $5 billion by 2023.
YoY Quarterly Growth:
The growth rate chart reveals periods of robust performance from 2014 to 2018, marked by consistent positive growth. Post-2020, growth became more volatile, with significant negative growth spikes around 2023, reflecting operational and market challenges.
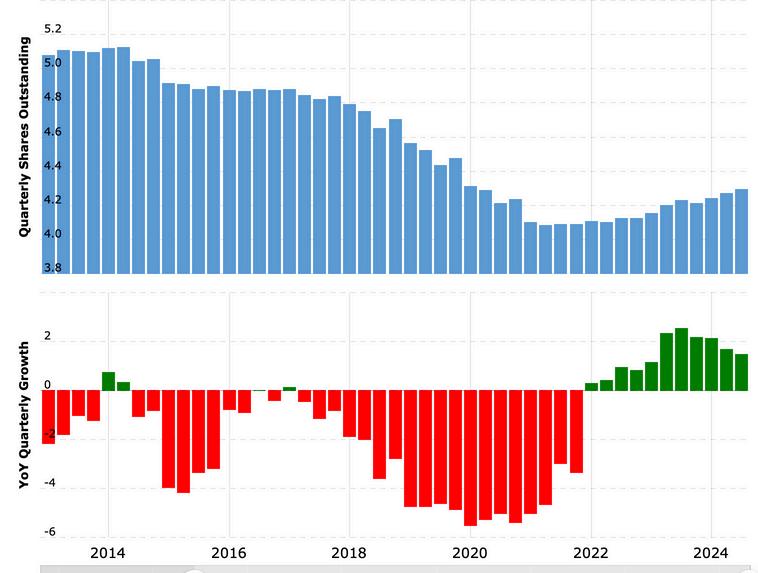
SHARESOUTSTANDING
Strategic Shifts Over a Decade
Intel's shares outstanding, the total shares held by investors excluding treasury stock, reveal the company ’ s evolving financial strategies Between 2014 and 2020, Intel steadily reduced its shares outstanding, dropping below 4.1 billion by 2020. This trend aligns with significant share buybacks aimed at enhancing shareholder value by concentrating earnings However, starting in 2021, Intel reversed course, gradually increasing its shares outstanding to 4 292 billion by Q3 2024, marking a 1.49% yearover-year growth.
These increases might indicate strategic moves, such as raising capital for innovation or funding acquisitions
However, starting in 2021, Intel reversed course, gradually increasing its shares outstanding to 4 292 billion by Q3 2024, marking a 1 49% yearover-year growth These increases might indicate strategic moves, such as raising capital for innovation or funding acquisitions. This shift from share reductions to expansions mirrors Intel's adaptation to shifting market demands and competitive pressures It reflects a careful balance between delivering immediate shareholder returns and ensuring long-term growth through resource allocation and strategic investments.
Quarterly Shares Outstanding:
Intel's shares outstanding gradually decreased from 2014 to 2020, reflecting potential share buybacks to enhance shareholder value. Starting in 2021, shares outstanding began to rise, possibly tied to capital-raising efforts, acquisitions, or issuing new shares. By Q3 2024, shares stood at 4 292 billion, a 1 49% yearover-year increase
YoY Quarterly Growth: Growth rates were predominantly negative through 2020, indicating declining shares or slower issuance. From 2021 onward, positive growth reflects recovery and expansion strategies, reversing the earlier downtrend.
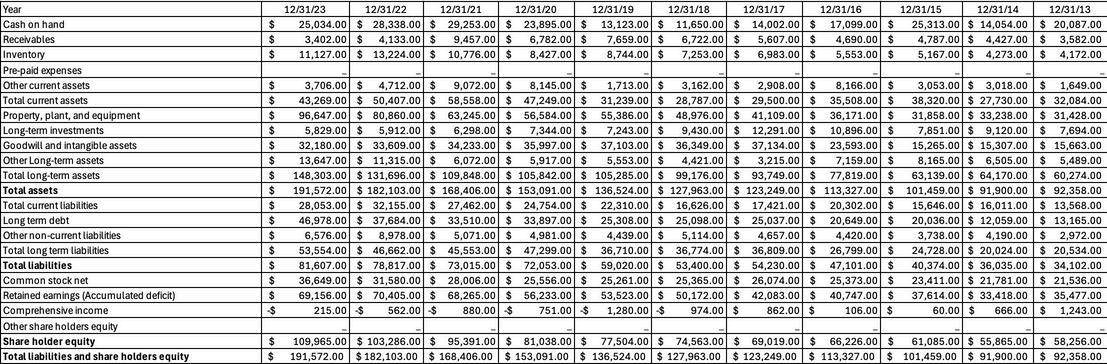
ASSETS AND LIABILITIES
Balancing Intel’s Financial Stability
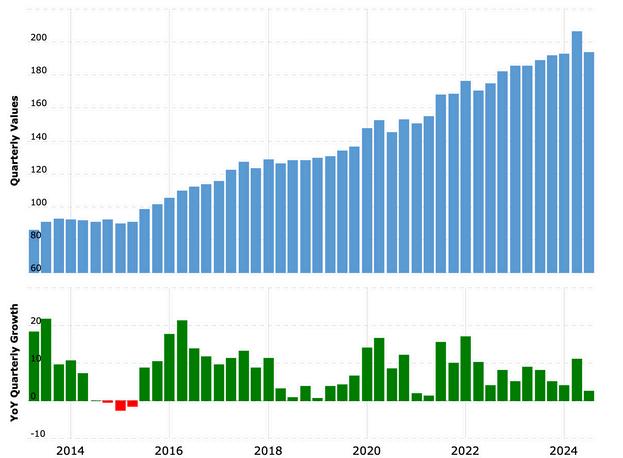
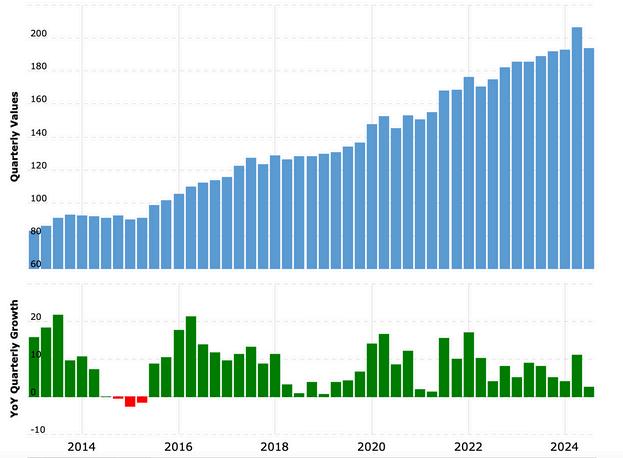
Growth in Total Assets
Intel's total assets from 2014 to 2024 exhibit consistent growth, underlining its financial strength and strategic investments. By September 30, 2024, total assets stood at $193.542 billion, reflecting a 2.49% year-over-year increase. The upward trend continued through $191.572 billion in 2023, representing a 5.2% rise from 2022. In 2021, total assets were $168.406 billion, up 10% from 2020. This trajectory demonstrates Intel's commitment to advancing its position in the semiconductor market while allocating resources for long-term innovation and global competitiveness
Intel's total assets have experienced consistent growth, reflecting strategic investments and operational expansion. Starting at $91.9 billion in 2014, assets steadily increased annually, reaching $191.57 billion by 2023, a 108% rise over the decade. Key jumps occurred from 2016 to 2021, fueled by robust semiconductor demand and technological innovation. Quarterly data highlights fluctuations, with a peak of $206.2 billion in June 2024, followed by a slight decrease to $193.5 billion by September 2024, indicating ongoing investments and market adaptations.
Intel's Total Liabilities
Examining Intel's financial obligations from 2014 to 2024 reveals a story of strategic growth and adaptation Intel's total liabilities have seen a consistent increase, reaching $88 678 billion for the quarter ending September 30, 2024, marking a 6 65% rise year-over-year This upward trajectory reflects ongoing investments and market dynamics
From 2022 to 2023, liabilities grew by 3 54%, totaling $81 607 billion In 2022, they stood at $78 817 billion, a 7 95% increase from the previous year Back in 2021, liabilities were $73 015 billion, up by 1 34% from 2020 This pattern indicates Intel's commitment to growth and expansion, balancing increased financial obligations with strategic initiatives to enhance its market position and technological capabilities These trends underscore Intel's ongoing efforts to navigate the competitive semiconductor industry, investing in new technologies and infrastructure while managing its financial responsibilities effectively.
Intel's Cash Reserves
Intel'scashonhand,reflectingitsliquidassets,showcases dynamic changes over the past decade, highlighting the company's financial strategies As of September 30, 2024, Intel reported $24086 billion in cash reserves, a 377% year-over-yeardecline In2023,cashreserveswere$25034 billion, an 1166% drop from 2022, which held $28338 billion Notably, 2021 saw a significant increase, reaching $29253billion a2242%surgefrom2020
These fluctuations emphasize Intel's ability to adapt its financial liquidity in response to operational needs and marketconditions
The equity figures also underline Intel's role as a financially stable entity capable of weathering market fluctuations and drivinglong-termshareholderreturns.Bymaintainingabalance between expansion and fiscal responsibility, the company has consistently enhanced its equity base, ensuring shareholder confidence. The overall growth narrative underscores Intel's adaptability and strong operational footing in a dynamic industrylandscape.
Intel's Shareholder Equity Growth
Intel's shareholder equity, a critical indicator of financial strength and corporate sustainability, has demonstratedconsistentgrowthoverthepastdecade, reflecting robust financial management and strategic reinvestment.AsofSeptember30,2024,equitystoodat $104.864billion,markingaslightyear-over-yeardecline of 0.78% compared to 2023. In 2023, equity reached $109.965 billion, representing a 6.47% increase from 2022, which itself recorded $103.286 billion, a healthy 8.28%growthover2021.
This upward trajectory highlights the company's capacity to reinvest profits while effectively managing its liabilities A standout year was 2021, when equity jumped 1771% to $95391 billion, showcasing Intel's resilience amid global uncertainties Over the decade, the equity growth trend reflects strategic decisions such as managing long-term debt, investing in innovation, and retaining earnings to bolster value for stakeholders
Intel's stock price and Price-toEarnings (P/E) ratio are critical tools for assessing the company's performance and market valuation Both indicators help investors gauge how the market perceives Intel's future potential and current profitability.
INTEL’S FINANCIAL RATIOS: A 10-YEAR PERSPECTIVE
SECTION 4
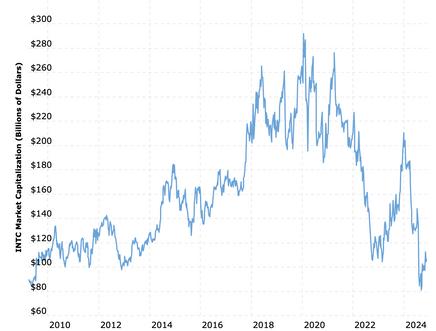
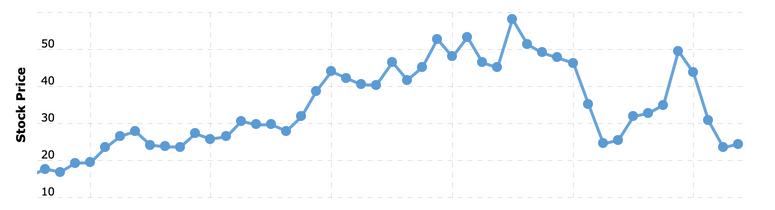
Stock Price: A Reflection of Market Sentiment
The stock price represents what investors are willing to pay for Intel's shares in real time. This price fluctuates due to factors like earnings performance, competition, technological advancements, and global economic conditions. Recently, Intel has faced competitive pressures from rivals and significant shifts in demand for its products. These challenges, coupled with periods of reduced profitability, have led to noticeable movements in its stock price.
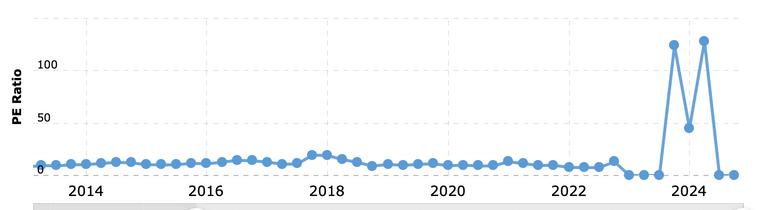
P/E Ratio: What It Reveals About Value
The P/E ratio compares a company's stock price to its earnings per share (EPS). This ratio is a powerful tool for understanding how investors value a company: A high P/E ratio indicates optimism, as investors are willing to pay more for expected future growth. A low P/E ratio might signal undervaluation or lower growth expectations.
In Intel's case, its P/E ratio has historically fluctuated based on its earnings trends However, 2024 marked a turning point: Intel's EPS turned negative due to declining profits, making the P/E ratio undefined This situation suggests that investors have become cautious, reflecting uncertainties around Intel's ability to regain its competitive edge in markets like AI, 5G, and advanced chip production
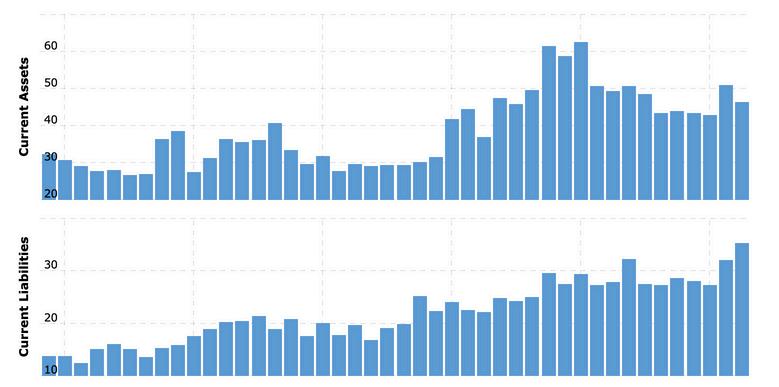
CurrentAssets
Intel’s Current Assets include cash, accounts receivable, and inventory, forming the basis for managing short-term obligations Growthincurrentassetsistypicallypositive,signalingfinancialhealthandoperationalefficiency However, disproportionate increases in certain components, like inventory, might indicate overstocking or inefficiencies, which could affect cash flow Conversely, higher cash reserves might reflect a strategic decision to bolster liquidity In the market, robust current assets relative to liabilities enhance confidence in Intel’s operational agility and its capacity to investininnovationorweathereconomicchallenges
CurrentLiabilities
The Current Liabilities metric represents Intel’s short-term obligations, including accounts payable, accrued expenses, andshort-termdebt.Changesincurrentliabilitiesoftenindicateshiftsinoperationalscaleorfinancialstrategies,suchas increasedborrowingordeferredexpenses.Arisingtrendcouldsuggesthigheroperationalactivity,potentiallyreflecting market expansion or investment in production. However, if liabilities outpace asset growth, it may signal liquidity challenges. For the market, growing liabilities must be assessed in context; they could either indicate strategic investmentsforfuturegrowthorposeriskstothecompany'sshort-termsolvency.
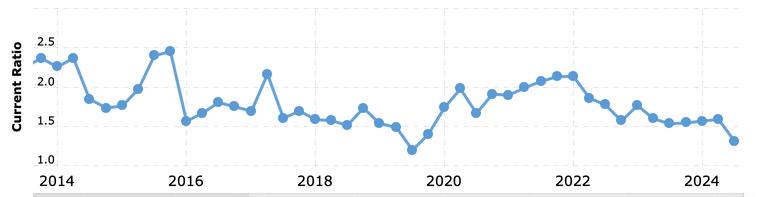
CurrentRatio
The Current Ratio measures Intel's ability to meet its short-term financial obligations with its short-term assets,calculatedascurrentassetsdividedbycurrentliabilities.Aratioabove1isgenerallyconsideredasign offinancialstability,indicatingthatthecompanyhasenoughliquidresourcestocoveritsimmediatedebts Intel’scurrentratiohasfluctuated,reflectingitsoperationalstrategiesandmarketconditions Variabilitycan signalshiftsinworkingcapitalmanagement,suchasadjustmentsininventorylevelsorcashreserves Inthe market, a strong and stable current ratio reassures investors about Intel's financial resilience, while significantdeclinescouldraiseconcernsaboutliquidityrisk.
RECOMMENDATIONS
CONCLUSION
Intel'sfinancialjourneyfrom2014to2024demonstrates significant growth and resilience in an evolving technological landscape. The steady rise in total assets over the decade reflects the company's strategic investments in innovation and market expansion. Liabilities, while increasing, have been carefully managed, maintaining Intel's operational stability. The variations in cash on hand reveal adaptability in responding to industry challenges and opportunities, ensuringliquiditywhenneeded Shareholderequityhas consistently grown, showcasing Intel's commitment to deliveringlong-termvaluetoitsinvestors
This decade of analysis highlights Intel's balance between innovation and financial discipline The company has effectively navigated economic uncertainties while capitalizing on opportunities within the competitive semiconductor industry These achievements affirm Intel's ability to adapt to technologicaladvancementsandmaintainitsstatusasa globalleader
In conclusion, Intel's financial performance over this period underscores its robust strategic framework and capacity to sustain growth, ensuring continued success inahighlycompetitivemarket