Monthly Market Monitor
April 2026
Theme in Focus Solar energy: The economics of light
On the whole, market participants are predominantly viewing the current oil price shock as merely a temporary disturbance.
Chart of the Month

April 2026
Theme in Focus Solar energy: The economics of light
On the whole, market participants are predominantly viewing the current oil price shock as merely a temporary disturbance.
Chart of the Month
An oil price shock with repercussions
The US president’s latest geopolitical adventure has once again revealed over the last few weeks that military supremacy alone is not enough to achieve (geo) strategic objectives. In the conflict with Iran, it’s Iran that holds the upper hand with its control over the Strait of Hormuz, one of the world’s most vital waterways. An effective blockade of that maritime chokepoint is already resulting in the worst oil crisis in history today in terms of the loss of supply on the world market. But the events of the past few weeks are bound to have repercussions beyond that.
Risk-off without a selloff
Equity markets around the world have reacted to the geopolitical events of the last few weeks in a classic risk-off fashion, but the drawdown in the MSCI World index has stayed within reasonable limits thus far with an intermittent decline of 7 %. On one hand, there have also been some beneficiaries of the spike in oil prices, such as energy stocks, and on the other hand, some sectors had already corrected beforehand in previous weeks. On the whole, market participants are predominantly viewing the current oil price shock as merely
a temporary disturbance. So, there is an accordingly enticing temptation to buy the dip. However, despite the encouraging statistics, a strategy of that kind is not entirely devoid of risk.
Solar energy: The economics of light Solar energy is past the point of needing to be explained or defended. Over 450 gigawatts of new photovoltaic capacity gets installed annually these days, accounting for around two-thirds of all newbuild power generation. A technology long considered to be a vision of the future has thus since become the industry standard. Growth, efficiency, and capital markets by now are telling a common story – one that is less euphoric than before, but which, in return, is all the more resilient.
The American public feels less than enthusiastic about the US government’s foreign-policy adventures. Unlike in previous conflicts during which US presidents’ public approval ratings usually benefited from geopolitical conflagrations, Donald Trump’s poll numbers have tumbled even farther into the cellar lately. He hasn’t kept his campaign promise to stay out of the world’s trouble spots. Instead, he has indirectly jacked up the price of filling up the gas tank of John Q. Public’s pickup truck. So, voters are also rating him negatively on the critical issue of the high cost of living. There is an increasing probability that the Democrats will hold a majority in both the Senate and the House of Representatives after the midterm elections this autumn. Prediction market odds of a lame-duck scenario and an impeachment during the second half of Trump’s term in office are thus surging. The policies emanating from the White House would arguably become even more unpredictable in that event. A well-thought-out plan is needed now to avert that scenario.
The US president’s latest geopolitical adventure has once again revealed over the last few weeks that military supremacy alone is not enough to achieve (geo) strategic objectives. In the conflict with Iran, it’s Iran that holds the upper hand with its control over the Strait of Hormuz, one of the world’s most vital waterways. An effective blockade of that maritime chokepoint is already resulting in the worst oil crisis in history today in terms of the loss of supply on the world market. But other natural resource and supply chains are also extremely strained and threaten to rupture, disrupting the availability of natural gas, petrochemicals, fertilizers, sulfur, and helium. In addition, the events of the past few weeks are bound to have repercussions that threaten to lastingly harm the Gulf States’ reputation as a safe haven. Last but not least, the USA’s relations with its allies up to now have suffered another blow that is likely to further intensify their quest for economic and military independence.
The first four weeks of the armed conflict in the Middle East already inflicted severe harm that is mostly irreversible. How much more damage it will cause depends on the question of when and for how long the slugfest can be resolved and when ships in the Persian Gulf and the Gulf of Oman and associated downstream processes will resume picking up steam. Since a notoriously erratic Donald Trump is confronted with a wounded Iranian regime whose actions are equally as hard to predict, economic observers have to think more in scenarios than ever before. For Europe, for example, the most favorable scenario for 2026 sees an additional 0.5-percentage-point boost to inflation and a big dent in economic growth of the same magnitude. Lastingly elevated oil prices above USD 120 per barrel (for Brent crude) would accordingly have more adverse consequences. The United States, as a self-sufficient oil producer, is likely to be comparatively less affected, also because the country is less dependent on foreign trade. However, the costly bill for the military mission will indirectly constrain the US administration’s fiscal leeway and hamper potential gifts to voters ahead of the autumn midterm elections.
Central banks remain faced with a challenge In February, financial markets were still anticipating two quarter-point interest rate cuts by the US Federal Reserve by the end of this year, but geopolitical developments have since flipped that picture almost 180 degrees. (Near-term) inflation expectations have risen so sharply that markets now no longer expect the Fed to further loosen the interest-rate screw until sometime next year. Meanwhile, the European Central Bank, which is confronted with twin oil and natural gas price shocks, is even coming under pressure to think about hiking interest rates. In the wake of the lessons learned from the last inflation rollercoaster ride from 2022 through 2024, the different camps among central-bank officials are likely engaged in intense discussions about whether they should react to the latest shock as soon as possible or should ignore it. The Swiss National Bank, in contrast, doesn’t have to wrack its brains about this. In fact, a mild pickup in inflation may even be a bit of a welcome development for the SNB. Currency interventions are now likely to be unnecessary for the time being.
In the wake of the lessons learned from the last inflation rollercoaster ride from 2022 through 2024, the different camps among central-bank officials are likely engaged in intense discussions about whether they should react to the latest shock as soon as possible or should ignore it.

Fixed Income
Sovereign bonds
Corporate bonds Europe
Microfinance
Inflation-linked bonds
High-yield bonds
Emerging-market bonds
Insurance-linked bonds
Convertible bonds
Duration
Currencies
US dollar
UK
USA
Japan
Emerging markets
Alternative Assets
Gold
Hedge funds
Structured products
Private equity
Swiss franc Private credit
Euro Infrastructure
British pound
Equities: Risk-off without a selloff
• Equity markets around the world have reacted to the geopolitical events of the last few weeks in a classic risk-off fashion, but the drawdown in the MSCI World index has stayed within reasonable limits thus far with an intermittent decline of 7 %.
That’s because, on one hand, there have also been some beneficiaries of the spike in oil prices – energy stocks have posted double-digit percent gains since the start of the Iran conflict. And on the other hand, some sectors – including, in no small part, the tech giants on the US equity market – had already corrected beforehand in previous weeks. They have even become a bit of a stabilizing element again lately. On the whole, market participants thus far have predominantly been viewing the current oil price shock as merely a temporary disturbance that will not have a massive impact on corporate earnings. After all, in the past, the S&P 500 index has historically risen after similar jumps (by 50 % or more) in the price of crude oil – by an average of 7 % after six months and by 14 % on average after twelve months. So, there is an accordingly enticing temptation right now to buy the dip. However, despite the encouraging statistics, a strategy of that kind is not entirely devoid of risk. The alternative scenario in which the price of oil stays above USD 150 per barrel for weeks and months on end and
Real estate
Monetary / fiscal policy
Corporate earnings
Valuation
Trend
Investor sentiment
rapidly stifles global economic growth seems more than a minimal residual risk. A full-blown selloff would be part and parcel of a scenario of that kind, and it would bring about much lower entry-point prices on equity markets than at present.
• Central banks, too, would play a role in the negative scenario if a pickup in inflation deemed persistent were to prompt their governing boards to raise interest rates. That could put an end to the current bull market, though it seems very unlikely to happen, especially since the US Federal Reserve is already under pressure as is to cut its policy rate. What’s more probable from today’s perspective is a kind of “muddling through” scenario in which the conflict in the Middle East continues to boil but at a lower intensity while the transport of goods and natural resources vital to the world economy gets up and running again through the Strait of Hormuz to a restricted degree.
Central banks, too, would play a role in the negative scenario if a pickup in inflation deemed persistent were to prompt their governing boards to raise interest rates.
The oil price shock caused near-term inflation expectations to rise sharply. It is now being anticipated that most of the G10 central banks (with the exception of the Fed and the SNB) will raise interest rates this year.
• In this scenario version, the current performance of the equity market would turn out to be a pause and a correction in the cyclical uptrend. A case exists for a continuation of the bull market: one of the main arguments is solidly growing corporate earnings in the USA, but by now also in Europe and emerging economies. Looking ahead, the valuations of the Magnificent Seven likewise no longer necessarily act as a brake – they recently were as cheap relative the S&P 500 index as they were ten years ago. Moreover, opportunities could arise in the weeks ahead among the purported losers of the AI revolution, such as the software sector. The market, which is prone to exaggeration, may have overshot to the downside here in recent months – in any case, it unjustifiably tossed all stocks into the same pot.
Fixed income: Yield spikes and their limits
• The war with Iran brought about a picture-perfect U-turn on fixed-income markets at the start of March. The oil price shock caused near-term inflation expectations to rise sharply. It is now being anticipated that most of the G10 central banks (with the exception of the Fed and the SNB) will raise interest rates this year. Volatility in government bonds has spiked, and long-term yields have surged. The yield on 10-year US Treasury notes climbed 50 basis points in March while the yield on 10-year German government bonds hit a new 15-year high north of 3.1 %. However, long-term inflation expectations were stable at last look. The nominal yield increase owes mainly to an expansion of the time risk premium and, in the case of the USA, is also due in no small part to a risk premium to compensate for the US administration’s costly geopolitical adventure, which will tend to further worsen federal finances.
• Gold in recent weeks has ranked among the losers of the crisis and hasn’t lived up to its status as a safe haven. There are a number of obvious explanatory narratives for that: the US dollar has appreciated, real interest rates have risen, and it is expected by now that most central banks will raise their policy rates going forward. However, those factors alone cannot fully explain the recent selloff, which drove the price of gold down by more than 20 % for a time in March. What is clear, though, is that investors in gold were sitting on large profits as result of the rally over the past year. They have been taking profits lately either by choice or because losses on other assets have forced them to do so to cover margin calls. Even some central banks have recently talked up selling gold as an option (Poland: to finance defense spending) or have already pressed the sell button (Turkey: to stabilize the lira). Meanwhile, the longterm outlook for gold hasn’t changed at all, so gold analysts at investment banks haven’t altered their generally bullish forecasts for the yellow precious metal thus far. In this sense, the recent price movements are above all a reminder that gold is a liquid asset, but also definitely a volatile one.
• Digital gold in the form of Bitcoin had already experienced its selloff between October and February. The cryptocurrency, though, has now outperformed stocks, bonds, and precious metals since the start of the Iran conflict. To fans of cryptocurrencies, this is evidence of their diversifying properties and proof of the added value that Bitcoin and the like provide in a portfolio context.
Currencies: The US dollar as a winner of the crisis
In the slightly more probable scenario of a deescalation in the next two to four weeks, the repricing of central banks’ interest-rate paths could turn out to have been too hasty.
• From a tactical perspective, US Treasurys are already attractive at their current yield level of around 4.5 %. In the slightly more probable scenario of a deescalation in the next two to four weeks, the repricing of central banks’ interest-rate paths could turn out to have been too hasty. The US Federal Reserve might then pivot from the inflation issue to the rapidly weakening employment market. In the worse alternative scenario of a further protracted surge in the price of petroleum, bond yields also would likely spike higher, but the jump would ultimately be self-limiting if the risk of a recession were to increase substantially.
• The US dollar showed itself to be a true safe haven in March. Its advances against other currencies got a special boost in no small part from the fact that many market participants had previously been bearish on the greenback and were accordingly underpositioned in the dollar. Now that this disequilibrium appears to have been largely rectified in the meantime, the longer-range outlook particularly depends on future geopolitical developments and is accordingly uncertain. The Swiss National Bank, in contrast, has gained certainty lately. A foreseeable pickup in inflation in the months ahead renders the SNB’s recently reiterated preparedness to intervene in the currency market hardly necessary, allowing it to keep potential negative interest rates in the back of the monetary-policy medicine chest. Moreover, the EUR / CHF exchange rate pulled significantly away from its new all-time low beneath 90 centimes in March and rose toward 92 centimes.
The stock prices of private market managers like Blackstone, KKR, and Apollo have been under massive downward pressure since the start of this year due to private credit. One manager after another recently has had to inform its investors in this asset class that redemption requests cannot all be honored in full and have to be gated. Gating usually goes into effect when more than 5 % of a fund’s shares outstanding are up for a cashout. The liquidity squeeze reveals a mismatch that was overlooked by many in the midst of the private credit boom. Managers extend long-term loans to businesses using capital from investors that is supposedly invested for the long run. But private and institutional investors evidently don’t actually have a lot of staying power when news and sentiment take a turn for the worse. However, the current panic is just as exaggerated as the private credit hype was two to three years ago. The current news flow makes no mention of another design flaw: US-style “semi-liquid” private credit funds in particular are not allowed to offset inflows against outflows. A net accounting, though, would render gating unnecessary for most managers.
When everybody heads for the exit at once… | …the stampede clogs the doorway Private-market manager stock prices, indexed

Recent figures show that over 450 gigawatts of new photovoltaic capacity gets installed annually around the world, more than any other form of power generation.
Solar energy is past the point of needing to be explained or defended. Over 450 gigawatts of new photovoltaic capacity gets installed annually these days, accounting for around two-thirds of all newbuild power generation. A technology long considered to be a vision of the future has thus since become the industry standard. Growth, efficiency, and capital markets by now are telling a common story – one that is less euphoric than before, but which, in return, is all the more resilient.
The evolution of solar energy can be read most clearly from the sheer size of its deployment. Recent figures show that over 450 gigawatts of new photovoltaic capacity gets installed annually around the world, more than any other form of power generation. Global installed solar power generating capacity by now exceeds 2.2 terawatts and continues to expand – a magnitude more or less matching the combined installed output of almost all nuclear power plants worldwide. Solar energy is thus no longer a supplement, but rather the dominant driver of new power generating capacity. The amount of solar power generation is strikingly noteworthy, but so is the economic logic behind it. In much of the world, solar energy is the cheapest form of new power generation today. In North America, the electricity production cost of modern solar photovoltaic plants amounts to around USD 58 per megawatt hour (MWh), compared to around USD 78 per MWh for new gas-fired power plants and around USD 122 per MWh for coal-fired power plants. This difference explains more than any political debate does about why
solar power continues to grow even if public support mechanisms are weakening or regulatory uncertainties are mounting.
Sturdiness in the face of headwinds
The USA arguably provides the most interesting stress test. Despite political polarization, altered energy policy priorities, and curtailed government funding programs, growth in renewable energy deployment has remained remarkably robust. More than 80 % of newly installed electricity generating capacity stems from renewable sources, with solar energy forming the backbone. The buildout of solar power is proving resilient, even in a less favorable political climate than before. The expansion dynamics are increasingly being driven by economic fundamentals rather than by regulatory stimulus. Long-term power purchase agreements, competitive electricity production costs, and rising electricity selling prices enable planning certainty. In addition, there’s a structural increase in demand for electricity. The power demands of data centers look set to account for up to 8 % of total US electricity consumption by 2030. This means that artificial intelligence, cloud computing infrastructure, and digital services are not only altering business models, but are also changing the load profiles of the energy system. Solar energy benefits from this structural demand because it is quickly scalable and increasingly systemically integrated. The market is becoming more and more self-sustaining. Political cycles create volatility, but do not alter the basic economic trajectory.
From module to system
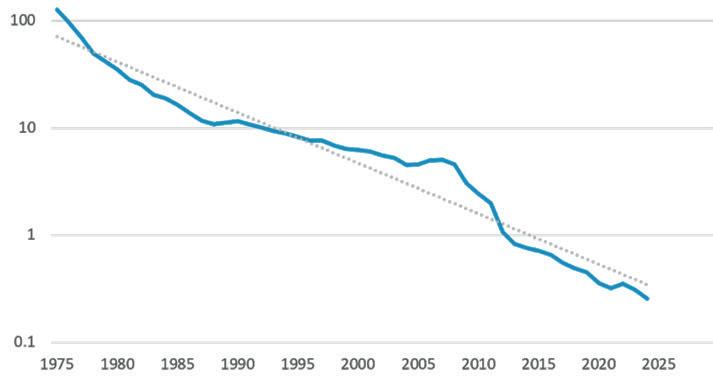
At the same time, the nature of the growth has changed. Costs for solar modules have fallen by around 90 % since the year 2000. Hardly any other energy technology has experienced a price decline of that magnitude. This cost revolution lays the foundation of today’s competitiveness. For many years, the continuous drop in the price of solar modules was the defining narra-
tive in the industry. But as the market increasingly matures, value creation is shifting from individual modules to entire systems. The speed of capacity expansion is no longer all that matters; so does the quality of the integration in an energy system that is becoming more complex. Efficiency gains, less degradation, improved grid connectivity, and falling financing expenses further lower overall costs even if solar module prices are now deceasing less sharply than before. This means that the role of solar technology is also shifting. Stability, planning predictability, and system compatibility are gaining importance. Solar power no longer has to grow spectacularly to be relevant; it just has to deliver electricity reliably.
This systemic change becomes evident mainly in the interplay between solar power and storage. Approximately 77 gigawatts of new battery storage capacity was installed around the world in 2024, an increase of 75 % compared to the previous year. Battery prices fell by around 20 % in the year 2024 alone and look set to decrease further. Solar energy in combination with battery storage devices is increasingly turning into a round-the-clock power plant. This development fundamentally changes the risk profile of solar energy. Electricity is no longer merely generated, but also gets actively managed, transforming solar from a production asset into a flexible energy component that cushions price fluctuations and opens up new sources of revenue. Solar power delivering electricity even at night is no longer a theoretical promise. Around 45 gigawatts of battery storage capacity was installed in the USA as of end-2025, and another 24 gigawatts are reportedly slated to be added in 2026. Stored solar power already covers a substantial percentage of nightly electricity demand today in some regions.
Industrial discipline
However, this maturity is not devoid of tensions. This can be seen especially clearly in China, the industrial epicenter of global solar production. China controls around 80 % of the world’s solar module manufacturing capacity and thus shapes the price level, investment cycles, and profit margins worldwide. In the first half of 2025, approximately 256 gigawatts of new solar power generating capacity was installed in China, more than twice as much as in the rest of the world combined. At the same time, Chinese factories further stepped up solar module production substantially. The resulting overcapacity put massive downward pressure on prices. The four largest solar module manufacturers in China recorded a combined half-year loss of around USD 1.5 billion, and the gross profit margins of some of them fell to around 3 %. This phase means retrenchment and consolidation for the industry, but it acts as a catalyst for the global buildout of solar power. Falling module prices reduce project costs, improve return profiles, and enhance competitiveness versus fossil fuel-based alternatives. Materials like silver, polysilicon,
Structural rotation | The transformation of electricity production
Projected change in US electric power generation in 2027 compared to 2025, in %
Source: Ember
After a time of considerable uncertainty, a period dubbed the “solar winter,” the share prices of solar companies rebounded sharply in 2025, with stocks like Nextpower, Sunrun, First Solar, and SolarEdge posting gains ranging from around 50 % to more than 130 %.
and copper remain core cost drivers, but are being utilized more efficiently than before. Competition is shifting from volume to productivity. The price implosion affects manufacturers, but doesn’t alter the structural demand. While industrial value creation is undergoing a correction, the economic attractiveness of solar technology is solidifying at the project level.
This shift is particularly visible in capital markets. After a time of considerable uncertainty, a period dubbed the “solar winter,” the share prices of solar companies rebounded sharply in 2025, with stocks like Nextpower, Sunrun, First Solar, and SolarEdge posting gains ranging from around 50 % to more than 130 %. The rally was triggered less by technological breakthroughs than by a re-rating of the risk premium. Political interventions turned out milder than expected, rising electricity pric es improved profitability, and the structurally increas ing demand for electricity lent the sector additional
stability. The market began to view fundamental earning power separately from political uncertainty. At the same time, though, the environment remains challenging. After key tax-abated construction deadlines expire in 2026, prospects look set to become more uneven, particularly for suppliers in the large-scale solar installation business. The stock market reacts sensitively to debt, profit margin performance, and project pipelines. The phase of across-the-board valuation expansion is thus transitioning into a phase of selective differentiation. Growth alone is no longer enough. What’s needed is capital discipline, robust business models, and resilience across cycles. Precisely this differentiation is a sign of normalization.
Solar energy is not a magic bullet. It remains weatherdependent, capital-intensive, and embedded in complex grids. Global growth rates are slowing, political framework conditions are wavering, and industrial overcapacity is causing tensions. And yet, the sector has achieved something that remains elusive to many technologies: it has gained economic credibility. Not as a vision, but as a substantiated, tangibly reliable experience. Solar power supplies electricity at competitive costs, is getting increasingly integrated into energy systems, and is holding its ground even in the face of difficult conditions. For long-term-minded investors, that’s exactly where the importance of solar power lies – not in the promise of limitless growth, but in the plannable revenue and earnings structure of a technology that has arrived in the unshuttered light of everyday life.

1.18% 7.01% 8.60% Bloomberg US Corporate High Yield Index (USD)
High Yield -1.50% -2.41% 2.73% 7.30% Bloomberg Pan-European High Yield Index (EUR) Others
3.42% - 6.18% 22.63% 14.15% FTSE 100 Total Return Index (GBP)
-2.11% -7.37% 6.16% 7.03% Swiss Performance Index (CHF)
3.64% -10.33% 34.65%
Gold Spot (US Dollar / Ounce) Bitcoin -22.20% 2.20% -17.26% 33.92% XBTUSD Spot Exchange Rate Real estate USA 2.80% - 6.77% - 0.66% 2.61% S&P US All Equity REIT Index (USD) Real estate Switzerland - 4.25% -5.26% 3.93% 9.52% SXI Real Estate Funds Total Return Index (CHF)
Hedge Funds 3.55% 0.96% 17.11% 10.96% Bloomberg All Hedge Fund Index (USD) Private Equity -16.75% -7.67% - 9.76% 7.47% Global Listed Private Equity Index (USD) Currencies EUR/USD -1.64% -2.19% 6.81% 2.15% EURUSD Spot Exchange Rate EUR/CHF - 0.76% 1.67% -3.42% -2.36% EURCHF Spot Exchange Rate GBP/USD -1.84% -1.89% 2.39% 2.35% GBPUSD Spot Exchange Rate
This document constitutes neither a financial analysis nor an advertisement. It is intended solely for informational purposes. None of the information contained herein constitutes a solicitation or recommendation by Kaiser Partner Financial Advisors Ltd. to purchase or sell a financial instrument or to take any other actions regarding any financial instruments. Furthermore, the information contained herein does not constitute investment advice. Any references in this document to past performance are no guarantee of a positive future performance. Kaiser Partner Financial Advisors Ltd. assumes no liability for the completeness, correctness or currentness of the information contained herein or for any losses or damages arising from any actions taken on the basis of the information in this document. All contents of this document are protected by intellectual property law, particularly by copyright law. The reprinting or reproduction of all or any parts of this document in any way or form for public or commercial purposes is expressly prohibited unless prior written consent has been explicitly granted by Kaiser Partner Financial Advisors Ltd.
Publisher: Kaiser Partner Financial Advisors Ltd.
Freigutstrasse 16 8002 Zurich, Switzerland
T: +41 44 752 51 11
E: financial.advisors@kaiserpartner.com
Design & Print: 21iLAB AG, Vaduz, Liechtenstein