Theano Iliopoulou, PhD, and Demetris Koutsoyiannis, PhD
Have Rainfall Patterns Changed? A Global Analysis of Long-Term Rainfall Records and Re-Analysis Data
Theano Iliopoulou, PhD, and Demetris Koutsoyiannis, PhD
About the Authors
Theano Iliopoulou, PhD, is a member of the Laboratory Teaching Staff at the Department of Water Resources and Environmental Engineering of the National Technical University of Athens.
Demetris Koutsoyiannis, PhD, is Professor Emeritus of Hydrology and Analysis of Hydrosystems at the National Technical University of Athens.
The authors thank Heritage Foundation Economic Policy Analyst Miles Pollard and Heritage Visiting Fellow Roy Spencer for their constructive reviews and Heritage Chief Statistician Kevin D. Dayaratna, PhD, for leading the project.
This paper, in its entirety, can be found at https://report.heritage.org/sr306 The Heritage Foundation | 214 Massachusetts avenue, nE | Washington, DC 20002 | (202) 546-4400 | heritage.org Nothing written here is to be construed as necessarily reflecting the views of The Heritage Foundation or as an attempt to aid or hinder the passage of any bill before Congress.
Have Rainfall Patterns Changed? A Global Analysis of Long-Term Rainfall Records and Re-Analysis Data
Theano Iliopoulou, PhD, and Demetris Koutsoyiannis, PhD
Amid concerns of intensified water cycle during global warming, the scientific attention on rainfall dynamics and its extremes is increasing. Global trends in rainfall totals and extremes are investigated using long-term rainfall station data—spanning more than 150 years for rainfall maxima and more than 200 years for total annual totals, as well as rainfall re-analysis products—covering the entire globe. Rainfall exhibits significant interannual and multi-decadal variability, greater than that of a purely random process, yet with no systematic pattern. Regional differences are pronounced, with some regions showing increased rainfall variability and notable changes, while other regions are characterized by stability. The findings suggest that global rainfall trends and extremes do not align with a global systematic change that could be attributed to a single driver, such as rising carbon-dioxide emissions. This emphasizes the need for stochastic models rather than deterministic projections for future hydroclimatic predictions.
1. Introduction
Human societies have traditionally struggled to explain the dynamics of rainfall variability, as documented in global mythology, literature, and history of science and civilization.1 Although science and technology have provided means to mitigate risk from rainfall variability, resulting in a significant decrease in deaths related to floods and droughts in recent decades,2 rainfall’s inherent unpredictability continues to pose challenges to societal well-being. Naturally, science and technology are constantly evolving to respond to societies’ increasing needs and vulnerabilities.
Water-related scientific challenges have been increasingly prominent in recent decades. The mainstream scientific premise suggests that an
intensification of the water cycle, with more extreme events, is currently underway due to global warming.3 As a result, it is often assumed that water-related risk is systematically increasing, and thus, that conventional methodologies should be abandoned. These concerns on intensification of extremes have been further exacerbated by the worldwide, near-realtime media coverage of disasters increasing the availability of examples of catastrophic hydrological events.
At the same time, the modern global climate monitoring capabilities are improving as well, providing various gridded rainfall products that have accelerated research on rainfall’s spatial dynamics.4 Still, most products’ potential for understanding temporal variability is somewhat limited from the short data length available (fewer than 100 years), and sometimes also further constrained by specific measurement uncertainties (such as shortcomings of satellite data in capturing extreme rainfall). Concurrently, information from conventional ground gauge stations, albeit spatially limited, has accumulated through time and constitutes the most reliable source of rainfall information available, often referred to as the “ground truth.” These observed series provide valuable insights on rainfall temporal dynamics and are a precious source of regional climate facts; not surprisingly, in some regions they have been considered a “national treasure.”5
In this Special Report, the authors briefly review the literature on global rainfall trends, and revisit common questions about rainfall changes by performing original analyses on both long-term rainfall stations spanning more than 150 years of data and global re-analysis products. By combining long-term point rainfall stations with short-term yet gridded rainfall products, insights on the nature of rainfall’s dynamics are sought with the aim to answer the title’s question, particularly with regard to recent changes in rainfall patterns.
2. A Brief Review of the Literature on Global Rainfall Trends
Identification of rainfall trends is one of the most active scientific research subjects, almost dominating the field of rainfall analyses in the past decade.6 Various studies deal with detecting trends in rainfall properties, typically in rainfall totals and frequency and magnitude of extreme rainfall. In contrast to temperature trends, where most studies report increasing trends,7 evidence for systematic trends in precipitation is weak and the search for global patterns of change remains inconclusive, as discussed below.
Seth Westra, Lisa Alexander, and Francis Zwiers8 first analyzed trends in annual maximum daily precipitation from 8,326 stations worldwide spanning from 1900 to 2009 and found that 8.6 percent of the stations had statistically significant increasing trends and 2.0 percent had statistically significant decreasing trends, with the rest showing no statistically significant trends. These results were confirmed by a later analysis by Qiaohong Sun and colleagues,9 who reported 9.1 percent of the stations with statistically significant increasing trends and 2.1 percent with statistically significant decreasing trends for 1950 to 2018. Simon Papalexiou and Alberto Montanari10 analyzed 8,730 stations for 1964 to 2013 and found that in the magnitude of extremes, 12.9 percent of the stations showed statistically significant increasing trends, and 9.8 percent showed statistically significant decreasing trends. Statistically significant increasing and decreasing trends in the frequency of extremes are found in 19.9 percent and 8.1 percent of the stations, respectively. With respect to gridded data, Demetris Koutsoyiannis11 integrated gauged, satellite, and re-analysis information over the land, the sea, and the globe and found pronounced precipitation fluctuations through the seasons and the years without any monotonic trend. The study also found marked differences among the various sources of information indicative of the substantial uncertainty in the measurement and estimation of spatial precipitation.
Although evidence on global systematic changes is still not clear, strong regional differences in rainfall changes are reported worldwide and may be relevant for water resources management on the operational scale. For instance, Demetris Koutsoyiannis and colleagues 12 found in a nationwide study of Greece no changes other than statistically expected in hydrological extremes, concluding that a “climate crisis” regime is not found. The findings were corroborated by re-analysis data, showing no change in extremes for the wider Mediterranean region, a result that agrees well with literature findings for the same region.13 On the contrary, Northern Europe is reported to exhibit the greatest worldwide ratio of stations with increasing trends compared to those with decreasing.14 This suggests a strong divergence from the rainfall behavior in Southern Europe that might be explainable by the current North Atlantic Oscillation phase.
The reported number of statistically significant trends is an important point to pay attention to when dealing with the respective literature, as trends alone are expected due to pure chance (that is 50 percent increasing and 50 percent decreasing), and thus, do not constitute a finding calling attention to the existence of a global deterministic signal. This point was highlighted by Timothy Alston Cohn and Harry Lins,15 who
showed that natural processes exhibit “trendy” behavior all the time. In this respect, the assumptions on which the estimation of statistical significance is based exert a major control on the results and are not trivial to make per se.
The standard assumption in the literature is to compare observed changes against the ones expected from a purely random process that is a white noise process, whereas some procedures exist for correcting for potential autocorrelation (see, for example, Khaled Hamed 16), albeit not being free from flaws themselves.17 It has been shown, however, that it is often necessary to account for long-range dependence, otherwise known as persistence or Hurst–Kolmogorov (HK) dynamics, a stochastic feature of geophysical processes associated with enhanced temporal change patterns and variability.18 In this case, the number of statistically significant trends drops significantly depending on the strength of the dependence structure (see, for example, Timothy Alston Cohn and Harry Lins19 and Demetris Koutsoyiannis and Alberto Montanari20). This fact is often overlooked in the literature of trend analyses, which is to some extent attributable to the fact that dependence is difficult to infer, given the short record lengths available, let alone series of extremes.21 In any case, considering the longrange dependence dynamics of the rainfall process,22 as well as the spatial dependencies present in instrumental datasets, the number of statistically significant trends is expected to be even lower. A detailed presentation of the historical background of the HK dynamics and its implications for climate science is given in Demetris Koutsoyiannis and Theano Iliopoulou.23
In “3. Insights from Long-Term Rainfall Stations Worldwide,” rainfall changes as recorded by the longest rainfall stations existing worldwide are examined. Although global analyses may provide evidence into the existence, or not, of signals of global change, the analyses are constrained by the average length of the stations, usually allowing identification of changes only in recent time windows. However, the thorough study of long rainfall stations allows insights into the long-term dynamics of rainfall, which are essential to understanding the nature of recent changes and quantifying their importance both from an empirical and statistical perspective. In particular, this Special Report explores whether recent changes are empirically unprecedented in the long stations and how likely they are based on the stochastic properties of the parent rainfall process.
In “4. Revisiting Rainfall Variability from Global Re-Analysis Products,” the same questions are revisited employing gridded re-analysis data. Gridded data cover the whole globe, unlike instrumental datasets that are missing in Africa, South America, and large parts of Asia. These gridded data,
therefore, provide a less biased view of recent global changes than the ones obtained from instrumental stations. In addition, changes in climatically homogenous global subdivisions, which are minimally cross-corelated to each other, are explored to minimize the impact of spatial dependence on the results.
3. Insights from Long-Term Rainfall Stations Worldwide
As already emphasized, record length is the most critical factor in determining rainfall’s temporal variability, and the one that constitutes the main limitation in the relevant literature. In an attempt to mitigate this issue, a rainfall series is gathered spanning at least 200 years of monthly data, resulting in a set of 22 stations, and the annual maxima dataset collected by Iliopoulou and Koutsoyiannis24 comprising 60 stations worldwide with daily data spanning 150 years is employed.
The changes in the magnitude and occurrences of annual rainfall indices (maxima and minima of rainfall totals and daily maxima) are quantified, and the plausibility thereof is explored using statistical reasoning. The long-term variability of rainfall (long-range dependence) is also quantified in stochastic terms, using the HK dynamics.2 Below, these investigations are presented separately for the set of stations with time series of annual totals over 200 years and the ones of annual maxima spanning at least 150 years.
3.1 Annual Totals over 200 Years
This set of ground stations has a monthly resolution and is publicly available through the KNMI Climate Explorer tool.25 The stations’ geographic distribution is shown in Map 1 while stations’ information (such as country, start and end year, and period) is detailed in Appendix Table 1. The monthly data is aggregated into the annual scale allowing only one month to be missing. An exception is made for the Bombay station in India, because the wet-season totals (June to October) are not affected by missing values and span uninterruptedly across 200 years.
To allow an initial inspection of the rainfall long-term dynamics, the annual values are plotted along with the climatic averages and the all-time average, as well as the linear trend spanning the whole period, for selected stations worldwide. (See Chart 1.)
As a first note, the rainfall amounts are observed to fluctuate significantly over the years, and some degree of variation is also evident on larger time
Geographic Distribution of the 22 Stations with at Least 200 Years of Records of Annual Precipitation Totals
Appendix A.
scales, such as the 30-year scale. The magnitude of these fluctuations also differs among stations; for instance, decadal fluctuations are more pronounced in Boston than in Kew Gardens. This magnitude may be quantified in stochastic terms using the Hurst parameter, which is an index of the HK dynamics, or else persistence.26 This parameter (H, taking on values between 0 and 1) helps to understand patterns and predictability in data, especially how past events might influence future ones. In a purely random process, H = 1/2. In a process characterized by persistence (H > 1/2), there is increased likelihood of clustering of events of similar types combined with increased likelihood of long-term changes in the system’s dynamics. Therefore, such a process is likely to show pronounced fluctuations at different
SR306 A heritage.org
SOURCE:
temporal scales (for example, wet years succeeded by droughts) followed by persisting long-term patterns (for example, droughts persisting over several years). An opposite behavior, known as antipersistent, is seen for H < 1/2.
In this respect, the logarithmic plot of the variance of the time-averaged process vs. the scale of averaging, which has been termed the climacogram, is a useful tool to characterize both the associated change and uncertainty.27 If the time series xi represented a purely random process, the climacogram would be a straight line with slope = –1, as implied by the classical statistical law:
However, in real-world processes, the slope is different from –1, designated as 2H – 2 and describes the scaling law:
Equation (2) defines the HK process. The parameter H is a measure of entropy production, which is closely related to change.28 It can be seen that if H = 1/2, then equation (2) switches to (1), signifying a purely random process. In most natural processes, the Hurst parameter is in the interval 1/2 < H < 1, signifying a persistent process. The fitting of the H parameter is made by also considering the estimation bias, which is equal to –γ(n), where n is the length of the time series.29 Thus, the fitting error is estimated as that between the empirical climacogram and the theoretical model plus bias (marked as “HK adapted for bias”). An example of the empirical climacogram and the model fitting also accounting for the estimation bias is shown in Chart 2.
The complete set of the Hurst parameters for all stations, along with other indices characterizing change, are shown in Table 1. An average H value of 0.63 is found, which is in accordance with values reported in the literature and indicates a moderate degree of persistence.30 This means that there is a moderate tendency for long-term changes and patterns to continue over time in a series of annual precipitation totals, still greater, however, than the one that would occur in a purely random process.
(1)
(2)
SOURCE: Appendix A CHART 1
Annual Total Precipitation in Madras,
Marseille, Boston, and Kew Gardens
MADRAS/MINAMBAKKAM (INDIA)
PRECIPITATION TOTAL (MILLIMETERS PER YEAR)
Trend: 30.5 mm/year/30 years
BOSTON (U.S.)
PRECIPITATION TOTAL (MILLIMETERS PER YEAR)
MARSEILLE MARIGNANGE (FRANCE)
PRECIPITATION TOTAL (MILLIMETERS PER YEAR) Annual value
Trend: –9.62 mm/year/30 years
PRECIPITATION TOTAL (MILLIMETERS PER YEAR)
Trend: –0.51 mm/year/30 years
KEW GARDENS (U.K.)
Trend: –1.68 mm/year/30 years
SR306 A heritage.org
Another depiction of past climatic events can be provided by plotting the all-time records, high or low, of the annual totals for all 22 stations and identifying when these records occurred. This is shown in Chart 3. The upper panel shows the record highs at all stations, where it is observed that the highest record (relative to the station’s mean value) was recorded in 1787 in Seoul (Korea) and the second highest in 1872 in Marseille (France). The lower panel shows the number of record occurrences per decade along with the 95 percent confidence limits computed using a binomial distribution assuming independence and identical distribution for the record (high or low) occurrence process. The number of station-years is also shown to explain the variation of the confidence interval limits. (That is, a higher
CHART 2
Annual Total Precipitation for Boston and Marseille
Empirical HK, theoretical HK, adapted for bias Purely random
BOSTON (U.S.)
VARIANCE, γ(k) (mm/year)2
SOURCE: Appendix A
MARSEILLE (FRANCE)
VARIANCE, γ(k) (mm/year)2
SR306 A heritage.org
number of extreme events is statistically expected in decades with higher number of years for all stations.)
A significant number of high records is observed for the decade from 1870 to 1879 and a significant number of low records is observed for the decade from 1920 to 1929. Recent decades are marked by a return to “average” conditions. When examining the 95 percent confidence limits, however, it is expected that an upper 2.5 percent and a lower 2.5 percent of records lies outside these limits. Therefore, from a statistical perspective, these few deviations are not particularly remarkable. One may think that, since more records were broken in the past, the threshold of breaking new records is higher. However, this perception stems from a common misunderstanding of probability. It confuses the time distance from the previous record, which on average increases in time, with the probability of occurrence of a record. The correct result is that the probability of having a record value in any year is the same for all years, equal to the inverse of the number of years.31 It is worth mentioning, however, that the clustering of dry years (occurrence of droughts) is more pronounced than the clustering of wet years. This means that droughts often occur in back-to-back years, while wet years tend to be more spread out.
Fitted Hurst parameter, H=0.77
Fitted Hurst parameter, H=0.60
CHART 3
Record Highs and Lows of Annual Total Precipitation
RECORD VALUE STANDARDIZED BY MEAN
Record high Record low
Record highs and lows of annual total precipitation depth per year, standardized by the mean (upper panel), and number thereof per decade for the 22 stations (lower panel). The upper and lower 95 percent confidence limits are calculated from the binomial distribution assuming independence and identical distribution. The number of station-years per decade (red dotted line) is plotted on the secondary y-axis.
SOURCE: Appendix A
SR306 A heritage.org
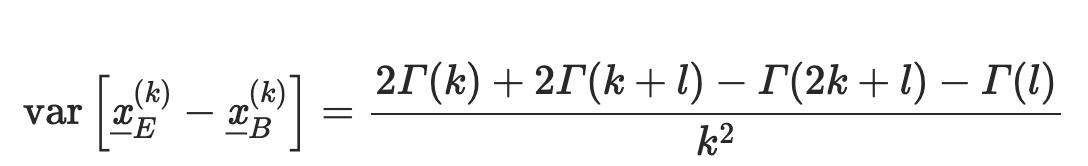
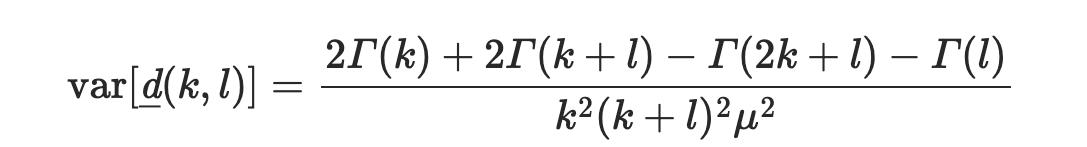
As indices of change in the rainfall amounts, this Special Report studies the climatic difference, estimated as the difference of averages between separate climatic periods, and the linear trend slope spanning the entire period, as defined by the start of the earlier period and the end of the later period (including all the intermediate years). To make the two comparable the climatic difference is standardized as follows. The standardized climatic difference (SCD) is defined as:
where xB(k) and xE(k) are the climatic values at the beginning and the end of the period covered by a time series, taken as time averages at a time scale k, l is the length of the intermediate period between these two periods, and μ is the mean of the examined process. (Note the use of the Dutch convention to underline stochastic variables to distinguish them from the non-underlined common variables.) Apparently, the mean of the variable d(k,l) is 0, while for the variance it can be shown that:
where Γ( ) is the cumulative climacogram of the process, that is, the climacogram of the cumulative process X(t) ≔∫0t x (u)du, obtained as:
Hence,
(6)
Further, the variable is assumed to have a normal distribution.
(3)
(4)
(5)
Here, the above method is applied on the annual time series assuming two climatic time scales k 1 = 30 and k2 = 60 (years). The annual averages are calculated if only less than 15 percent of the annual values are missing in a given period, which may result in a slightly different number of stations per examined case. Three climatic periods are selected aiming to maximize the number of stations with sufficient data in them, and in order to be representative of (a) a past climatic regime, with its start in the late 19th century; (b) a transitional climatic period, with its start in the early 20th century, and its end being prior to the recent global warming intensification period (before 1970); and (c) a recent climatic period, spanning the latest decades possible, respectively.
To be able to compare the temporal evolution of changes, the former period is defined as the “base period’” in the past, here chosen as 1870 to 1899 for the 30-year time scale and 1840 to 1899 for the 60-year time scale. It is assumed as a benchmark against which the later periods are compared. For example, in Chart 4, the periods 1930 to 1959 and 1970 to 1999 are separately compared to the earlier base period. The intermediate periods have lengths l 1 =30 and l2 = 70 years, respectively.
The climatic averages are computed after standardizing the time series by their mean. Further, the standardized variables xij/μj, with i = 1,…,n and j = 1,…,N, are assumed to have the same variance for all N time series, where N is the number of stations for each investigation (potentially differing due to missing values) and n is the time series length. Hence, to estimate the cumulative climacograms (Γ(k), and so on), an HK model is assumed with variance at scale 1 equal to the variance of xij/μj of all the N time series taken together. The theoretical curves in Chart 4 are constructed assuming normal distribution of the climatic difference and a Hurst parameter equal to the average over all stations (H=0.63). For comparison, the case of a purely random climate (H=0.5) is also shown.
The same procedure is followed for the investigation at the 60-year time scale, shown in Chart 5. In this case, the transitional and recent period are selected to be from 1900 to 1959 and from 1940 to 1999, thus ending at the same year as the 30-year periods but spanning 30 years earlier. As the base period is 1840 to 1899, the intermediate periods have lengths l 1 = 0 (which corresponds to consecutive periods) and l2 = 40 years, respectively.
Investigations on both time scales reveal an overall compliance with statistical expectations, with the only notable divergence being the dominance of negative percentage changes per decade from the 1930 to 1959 period which is also in agreement with the increased number of low records found for the same period, as seen in Chart 3. Yet, the recent period (1970
CHART 4
Probabilistic Indices of Change in Annual Total Precipitation, 30–Year Timescale
Linear trend, empirical
Climatic di erence, empirical Climatic di erence, H=0.63
PERCENT CHANGE (%/DECADE)
30–Year Timescale
1st: 1870–1899
2nd: 1930–1959
PERCENT CHANGE (%/DECADE)
30–Year Timescale
1st: 1870–1899
2nd: 1970–1999
Climatic di erence, white noise
Probability distribution of the indices of change in annual total precipitation, as percentages of the all-time averages, for the 22 stations (upper panel) and the 17 stations (lower panel), for the 30-year timescale. The theoretical curves are constructed assuming normal distribution of the climatic di erence and a Hurst parameter equal to the average over all stations (H=0.63). For comparison, the case of a purely random climate (H=0.5) is also shown.
SOURCE: Appendix A
SR306 A heritage.org
CHART 5
Probabilistic Indices of Change in Annual Total Precipitation, 60–Year Timescale
Linear trend, empirical
Climatic di erence, empirical Climatic di erence, H=0.63
PERCENT CHANGE (%/DECADE)
60–Year Timescale
1st: 1840–1899
2nd: 1900–1959
PERCENT CHANGE (%/DECADE)
60–Year Timescale
1st: 1840–1899
2nd: 1940–1999
Climatic di erence, white noise
Probability distribution of the indices of change in annual total precipitation, as percentages of the all-time averages, for the 22 stations (upper panel) and the 19 stations (lower panel), for the 60-year timescale. The theoretical curves are constructed assuming normal distribution of the climatic di erence and a Hurst parameter equal to the average over all stations (H=0.63). For comparison, the case of a purely random climate (H=0.5) is also shown.
SOURCE: Appendix A
SR306 A heritage.org
Characteristics of Change for Records of Annual Precipitation Totals
SOURCE: Appendix A. TABLE 1
1870–1899
Characteristics of change, that is, trend slope (% per decade), standardized climatic difference (% per decade), and Hurst parameter (H) per station, for different periods at timescales 30 and 60 years. Empty cells correspond to stations affected by missing values in the respective periods.
Geographic Distribution of the 60 Stations with at Least 150 Years of Records of Annual Daily Precipitation Maxima
SOURCE: Appendix A.
to 1999) exhibits a return to “expected” change metrics. It is evident that the divergence of the 1930 to 1959 period is also less pronounced on the greater time scale of 1900 to 1959, shown in the upper panel of Chart 5. The comparison of the base period to an even more recent climatic period,
CHART 6
Maximum Daily Precipitaion in Bologna, New York, Chukwookee, and De Kooy
Annual value Climatic value (30–year average) All-time average Fitted linear trend
BOLOGNA (ITALY) NEW YORK (U.S.)
MAXIMUM DAILY PRECIPITATION (MILLIMETERS PER DAY)
Trend: 0.31 mm/d/30 years
DAILY PRECIPITATION (MILLIMETERS PER DAY)
Trend: 1.73 mm/d/30 years
CHUKWOOKEE-SEOUL (KOREA) DE KOOY (NETHERLANDS)
MAXIMUM DAILY PRECIPITATION (MILLIMETERS PER DAY)
Trend: 4.62 mm/d/30 years
MAXIMUM DAILY PRECIPITATION (MILLIMETERS PER DAY)
Trend: 0.16 mm/d/30 years
SOURCE: Appendix A.
SR306 A heritage.org
spanning the years from 1958 to 2017 agrees with the results obtained for the period 1940 to 1999, but is not shown due to the number of stations being much lower (10).
3.2 Annual Maxima over 150 Years
Similar investigations are carried out for the set of 60 stations spanning more than 150 years of annual daily maxima, collected and analyzed by Iliopoulou and Koutsoyiannis. 32 The spatial distribution of the stations is shown in Map 2, while details on their properties are given in Appendix Table 2.
CHART 7
Record Highs of Annual Daily Maximum Precipitation
Record highs of annual daily maximum precipitation depth, standardized by the mean (upper panel), and number thereof per decade for the 60 stations (lower panel). The upper and lower 95 percent confidence limits are calculated from the binomial distribution assuming independence and identical distribution. The number of station-years per decade (red dots) is plotted on the secondary y-axis.
SOURCE: Appendix A.
A first visualization of the rainfall long-term variability for selected stations is provided in Chart 6. It is seen that annual maxima exhibit significant annual and interannual fluctuations as well. Yet, the over-decadal fluctuations, as captured by the climatic averages, are less pronounced than in the case of annual totals, which is in accordance with the dependence properties of rainfall maxima, in general.33
As before, the year of occurrence of the record-high per station and the number of record highs per decade is examined; however, the analysis of the record lows is skipped since they are less relevant when studying rainfall maxima. Results are shown in Chart 7.
It is observed that for this dataset, the record high (relative to the station’s mean value) occurred in 1945 in Vaexjoe (Sweden), followed by that in Mantova (Italy) in 1879. Occurrences per decade conform with statistical expectations, except for the decade from 2000 to 2009, which shows a larger number of record-high events. Upon further investigation, it is found that for this decade, six of nine of record occurrences were observed in the Netherlands, a region that is reported to have experienced increases in precipitation;34 thus, this divergence reflects a local signal. Since this dataset comprises many stations from Northern Europe and, in particular, the Netherlands (Map 2), the independence-and-identical-distribution assumption used to compute the confidence limits is also violated to some extent. The recent decade, however, exhibits an insignificant number of record-high events.
Investigation of the distribution of the indices of changes, that is, the standardized climatic differences and the linear slopes, is also performed assuming two climatic time scales k 1 = 30 and k2 = 50 (years). Considering that the minimum record length for this dataset is 150 years, the time scale of 50 years (instead of 60 in the previous analysis) is selected to allow exploration of three least-overlapping climatic periods, which are selected following the same rationale as in the case of annual totals. The “base period” in the past here is chosen as 1870 to 1899 for the 30-year scale and 1870 to 1919 for the 50-year scale. Then, the later periods, from 1930 to 1959 and from 1970 to 1999, are separately compared to the earlier base period, as seen in Chart 8. The intermediate periods have lengths l 1 = 30 and l2 = 70 years, respectively. The same procedure is followed for the investigation at the 60-year time scale, shown in Chart 9. In this case, the later periods are selected to be from 1920 to 1969 and 1960 to 2009; therefore, the intermediate periods have lengths of l 1 = 0 and l2 = 40 years, respectively. As before, the theoretical curves in the respective charts are constructed assuming normal distribution of the climatic difference. For comparison, the case
CHART 8
Probabilistic Indices of Change in Annual Maximum Daily Precipitation, 30–Year Timescale
Linear trend, empirical Climatic di erence, empirical Climatic di erence, H=0.6
PERCENT CHANGE (%/DECADE)
30–Year Timescale
1st: 1870–1899
2nd: 1930–1959 NON-EXCEEDANCE PROBABILITY
PERCENT CHANGE (%/DECADE)
30–Year Timescale
1st: 1870–1899
2nd: 1970–1999
Climatic di erence, white noise
NON-EXCEEDANCE PROBABILITY
Probability distribution of the indices of change in annual maximum daily precipitation, as percentages of the all-time averages, for the 58 stations (upper panel) and the 57 stations (lower panel), for the 30–year timescale. The theoretical curves are constructed assuming normal distribution of the climatic di erence. For comparison, the case of a Hurst parameter equal to H=0.6 and a purely random climate (H=0.5) is also shown.
SOURCE: Appendix A.
SR306 A heritage.org
Probabilistic Indices of Change in Annual Maximum Daily Precipitation, 50–Year Timescale
Linear trend, empirical Climatic di erence, empirical Climatic di erence, H=0.6
PERCENT CHANGE (%/DECADE)
50–Year Timescale
1st: 1870–1919
2nd: 1920–1969
PERCENT CHANGE (%/DECADE)
SOURCE: Appendix A. CHART 9
50–Year Timescale
1st: 1870–1919
2nd: 1960–2009
PROBABILITY
Climatic di erence, white noise
Probability distribution of the indices of change in annual maximum daily precipitation, as percentages of the all-time averages, for the 57 stations (upper panel) and the 55 stations (lower panel), for the 50–year timescale. The theoretical curves are constructed assuming normal distribution of the climatic di erence. For comparison, the case of a Hurst parameter equal to H=0.6 and a purely random climate (H=0.5) is also shown.
SR306 A heritage.org
of a Hurst parameter equal to H=0.6 and a purely random climate (H=0.5) is also shown.
Results suggest that compared to the late 19th century, the later climatic periods experienced mostly increases in the amount of maximum daily rainfall, a behavior that emerged even from the first half of the 20th century, as shown by the upper panels of both Charts 8 and 9. The recent climatic period does not show pronounced increases, yet there are fewer decreases than expected under the assumed stochastic models (H = 0.6, 0.5).
4. Revisiting Rainfall Variability from Global Re-Analysis Products
To circumvent the limitation of unsatisfactory spatial coverage of the long rainfall stations, non-conventional data were also examined; the most useful are those of the ERA5 re-analysis.35 This is the fifth-generation atmospheric re-analysis of the European Centre for Medium-Range Weather Forecasts (ECMWF), where the name ERA refers to ECMWF ReAnalysis. The observation period spans from 1940 onward, with daily updates continuing forward in time. It has been produced as an operational service, and its fields compare well with the ECMWF operational analyses. ERA5 provides hourly estimates of a large number of atmospheric, land, and oceanic climate variables. ERA5 combines vast amounts of historical observations into global estimates using advanced modeling and data assimilation techniques. The data were retrieved and spatially aggregated through the ClimExp platform,36 where they are available from 1950 to the present at daily temporal resolution and a spatial resolution of 0.5° for the globe.
Other gridded global data sets were also examined but were not found to be reliable enough. As an example, the Arctic region (see Map 3) in the Climate Prediction Center’s unified gauge-based data set (0.5°, global, 1979 to present) included a daily value of 820 millimeters (mm) per day (on December 30, 2022). On the other hand, the data set of the Global Precipitation Climatology Centre (1°, 1988 to present) included a daily value of 178 mm per day (on January 6, 2015), with the two sources disagreeing with each other. Neither of these values are plausible for this region of the globe. The E-OBS dataset37 (0.25°, Europe, 1920 to present) included a daily value of 2670 mm (on February 8, 1921) for Northern Europe and other too-high values, all of which are also implausible. Finally, the re-analysis data set jointly produced by the National Center for Environmental Prediction and the National Center for Atmospheric Research (1.88°, 1948 to present),38 gives too-low values for maximum daily precipitation. For
Annual Average Daily Precipitation Over the Globe
Annual value Climatic value (10–year average)
AVERAGE DAILY STANDARDIZED PRECIPITATION CHART 10
average: 2.26 mm/d Linear trend: 0.005 mm/d/decade
AVERAGE DAILY PRECIPITATION, IN MILLIMETERS PER DAY
Plot of the time series of annual average daily precipitation over the globe (upper panel) in both natural values (mm/day) and (lower panel) after standardization with the all-time average precipitation of each of the 31 subdivisions, before taking the average. All-time maximum 1.05 (1988) All-time maximum 2.4 mm (1973) All-time minimum 2.07 mm (1965) All-time minimum 0.93 (1966)
Annual value Climatic value (10–year average)
All-time average: 1 Linear trend: 0/decade
SOURCE: Appendix A.
SR306 A heritage.org
Delineation of Regions Examined with ERA5 Reanalysis Dataset for Rainfall
SOURCE: Appendix A.
example, according to this data set, the maximum value for the entire period is only 70 mm for the Mediterranean and 172 mm for Southeastern Asia.
For these reasons, a global analysis is made using only the ERA5 dataset, as it is deemed the most reliable of all the datasets examined. Chart 10 shows the time series of annual average daily precipitation over the globe. It is seen that global average daily precipitation fluctuates significantly at the 10-year scale yet without exhibiting a systematic pattern.
In addition to the global level, the precipitation is examined at 31 subdivisions. Of these, 26 are the so-called SREX regions, defined by the Intergovernmental Panel on Climate Change (IPCC)39 in its Special Report for Managing the Risks of Extreme Events and Disasters to Advance Climate Change Adaptation (commonly abbreviated as SREX). The remaining five subdivisions were added to cover the entire Earth, based on the IPCC40 (the Fifth Assessment Report, abbreviated as AR5). All subdivisions are shown in Map 3 and clarified in Table 2. The numbers from 01 to 26 are the same as in the SREX report, while numbers 00 and 27–30 are assigned to in this Special Report
Analogously to Chart 10, which is for the global rainfall, Chart 11 shows the time series and characteristics, thereof, related to climate for four of the subdivisions. These are:
A heritage.org
SOURCE: Appendix A. TABLE 2
Explanation of Symbols for the Geographical Regions
Number/Symbol Description
Number/Symbol Description
00arC arctic 16EaF East africa
01aLa alaska/n.W. Canada 17SaF Southern africa
02CGI Canada/Greenland/Iceland 18naS north asia
03Wna West north america 19WaS West asia
04Cna Central north america 20CaS Central asia
05Ena East north america 21TIB Tibetan Plateau
06CaM Central america/Mexico 22EaS East asia
07aMZ amazon 23SaS South asia
08nEB north-East Brazil 24SEa Southeast asia
09WSa West Coast South america 25nau north australia
10SSa Southeastern South america 26Sau South australia/new Zealand
11nEu north Europe 27Car Caribbean
12CEu Central Europe 28nTP north Tropical Pacific
13MED South Europe/Mediterranean 29STP South Tropical Pacific
14SaH Sahara 30anT antarctica
15WaF West africa
List of regions examined with the Era5 reanalysis dataset and their description. numbers 01 to 26 are the same as in the SrEX report, while numbers 00 and 27–30 have been assigned here.
Sr306 A heritage.org
1. 13MED (Southern Europe/Mediterranean), which according to the IPCC29 and numerous publications of the climate literature is one of the most prominent and vulnerable climate change hotspots.
2. 16EAF (East Africa), which exhibits one of the most intense declines in the precipitation total.
3. 23SAS (South Asia), which has one of those regions with intense longterm persistence, as quantified by the Hurst parameter.
4. 24SEA (Southeast Asia), which exhibits one of the most intense growths in the precipitation total but is also exhibiting a decline in intense precipitation.
CHART 11
Annual Average Daily Precipitation Over SREX Regions (Page 1 of 2)
Annual value Climatic value (10–year average) All-time average Linear trend
13MED (Mediterranean)
23SAS (South Asia)
-0.009 mm/d/decade
1.35 mm/d
minimum 3.06 mm (1979)
Time series of annual average daily precipitation for the indicated areas, also showing the high and low records, the climatic values (10-year averages), and the fitted linear trends for four areas.
SOURCE: Appendix A.
Annual
Average Daily Precipitation Over SREX Regions (Page 2 of 2)
16EAF (East Africa)
maximum 4.68 mm (1953) Linear trend: -0.151 mm/d/decade Average: 2.93 mm/d
Linear trend: 0.126 mm/d/decade Average: 7.61 mm/d All-time maximum 8.95 mm (2017)
24SEA (Southeast Asia)
CHART 12
Average Daily Rainfall at Global Scale and for Region 16EAF
Empirical HK, theoretical HK, adapted for bias Purely random
GLOBAL SCALE
Fitted Hurst parameter, H=0.93
REGION 16EAF
Fitted Hurst parameter, H=0.95
TIME SCALE, k (years)
SOURCE: Appendix A.
TIME SCALE, k (years)
SR306 A heritage.org
One of the most prominent patterns seen in Chart 11 is the existence of fluctuations on multiyear time scales. These are quantified by the Hurst parameter, which is estimated through the climacogram as demonstrated in Chart 12. The complete set of the Hurst parameters for all regions, along with other indices characterizing change, are shown in Table 3. Notably, regional estimates show larger fluctuations than what is revealed by the stations’ investigation. This fact is also in agreement with recent literature.41
Another finding is the strong regional differences, as exemplified by the increase in Southeast Asia and the concurrent decrease in East Africa.
For this analysis, the all-time records, high or low, of annual daily rainfall from all 31 regions are plotted, identifying when these records occurred (See Chart 13). The upper panel shows the record highs and lows at all regions, where it is observed that the highest of all occurred in 1950. The lower panel shows the number of record-breaking occurrences per decade. As explained, statistically “unexpected” occurrences of these records would be identified in the case that several of them surpassed the confidence limits. The upper and lower 95 percent confidence limits, calculated from the binomial distribution assuming independence and identical distribution, are 8 and 1,
VARIANCE, γ(k) (mm/d)2
VARIANCE, γ(k) (mm/d)2
SOURCE: Appendix A. TABLE 3
Characteristics of Change per Region According to the ERA5 Reanalysis Dataset
CHART 13
Record Highs and Lows of Average Daily Precipitation
Record highs and lows of average daily precipitation depth per year, standardized by the mean (upper panel; with marking of those being higher than 2 or lower than 0.5) and number thereof per decade (lower panel) for the 31 regions of the globe. The upper and lower 95 percent confidence limits, calculated from the binomial distribution assuming independence and identical distribution, are 8 and 1, respectively, for a decade, and 4 and 1, respectively, for the three-year period 2020–2022; thus, only the record lows from 1960 to 1969 are too many, exceeding the upper confidence limit.
SOURCE: Appendix A.
14SAH
CHART 14
Probabilistic Indices of Change in Annual Average Daily Precipitation
Linear trend, empirical
Climatic di erence, empirical
PERCENT CHANGE (%/DECADE)
Climatic di erence, theoretical, H=0.76
Climatic di erence, theoretical, H=0.5
NON-EXCEEDENCE PROBABILITY
Probability distribution of the indices of change in annual average daily precipitation (as percentages of the all-time averages) for the 31 regions of the globe. The theoretical curves are constructed assuming normal distribution of the climatic di erence and a Hurst parameter equal to the average over all regions (H=0.76). For comparison, the case of a purely random climate (H=0.5) is also shown. The two cases di ering substantially from theoretical expectations are marked with the area codes they refer to.
SOURCE: Appendix A.
SR306 A heritage.org
respectively, for a decade and 4 and 1, respectively, for the three-year period from 2020 to 2022; thus, only the record lows from 1960 to 1969 are too many, exceeding the upper confidence limit.
Here, the standardized climatic difference method is applied on the annual time series assuming a climatic time scale k = 30 (years). As the available time series has length n = 73 (years) in this case, this model examines only two periods. The earlier period is selected to span from 1950 to 1979, and the later period to cover the years 1993 to 2022, thus the intermediate period has a length of l = 13. For each of the 31 time series, the mean as the
14SAH
16EAF
CHART 15
Annual Maximum Daily Precipitation for Four Areas (Page 1 of 2)
MAXIMUM DAILY PRECIPITATION (mm/d) 13MED (MEDITERRANEAN) 16EAF (EAST AFRICA)
MAXIMUM DAILY PRECIPITATION (mm/d)
(1957)
SOURCE: Appendix A.
(1951)
mm/d
(1968)
15
Annual Maximum Daily Precipitation for Four Areas (Page 2 of 2)
mm/d
(mm/d)
mm/d
23SAS (SOUTH ASIA)
24SEA (SOUTHEAST ASIA)
CHART 16
Maximum Daily Rainfall for Regions 16EAF and 24SEA
Theoretical, adapted for bias Purely random
REGION 16EAF
REGION 24SEA
TIMESCALE, k (years)
SOURCE: Appendix A.
TIMESCALE, k (years)
SR306 A heritage.org
time average of the entire time series is estimated. Furthermore, the standardized variables xij/μj, with i= 1,…,73 and j = 1,…,31, are assumed to have the same variance for all 31 time series. Hence, to estimate the cumulative climacograms (Γ(k), etc.), an HK model is assumed with variance at scale 1 equal to the variance of of all 31 time series taken together. The theoretical curves in Chart 14 are constructed assuming normal distribution of the climatic difference and a Hurst parameter equal to the average over all regions (H=0.76). For comparison, the case of a purely random climate (H=0.5) is also shown. The two cases differing substantially from theoretical expectations are marked with the area codes they refer to.
Chart 14 shows a compliance with statistical expectation with no remarkable pattern emerging other than the strong decrease of average daily precipitation in the Sahara and East Africa regions.
The same set of investigations is carried out for the annual maxima, starting by evaluating the plots of the maximum daily precipitation for the same regions as above (see Chart 15), 13MED (Mediterranean), 16EAF (East Africa), 23SAS (South Asia), and 24SEA (Southeast Asia). Fluctuations are
VARIANCE γ(k), (mm/d)2
VARIANCE γ(k), (mm/d)2
Fitted Hurst parameter, H=0.67
Fitted Hurst parameter, H=0.50
CHART 17
Annual Maximum Daily Precipitation Over the 31 Subdivisions
MAXIMUM DAILY STANDARDIZED PRECIPITATION
maximum: 3.25 (1963)
of maxima: 1.23 (1996)
Plot of the time series of annual maximum daily precipitation over the 31 subdivisions covering the globe, after standardization with the all-time average of annual maximum precipitation of each of the subdivisions, also showing the high and low records, the climatic values (10-year averages), and the fitted linear trends.
SOURCE: Appendix A.
SR306 A heritage.org
evident again, as these are quantified by the respective H parameters, and shown for the regions of EAF and SEA in Chart 16. As previously discussed, long-term fluctuations are less pronounced for series of maxima compared to averages of rainfall, and this is also evident from comparing the respective H parameters.
The time series of annual maximum daily precipitation, standardized by each subdivision mean and extracted at the same year concurrently from all the 31 subdivisions, is also shown in Chart 17. This again does not concur with an intensification claim.
The highest record value (with respect to the regional mean) was recorded in region 27CAR (the Caribbean) in 1963, followed by the 26SAU (South Australia/New Zealand) in 1974 (see Chart 18). The upper and lower 95 percent confidence limits, calculated from the binomial
CHART 18
Record Highs of Maximum Daily Precipitation
RECORD VALUE STANDARDIZATION BY MEAN
NUMBER OF RECORDS PER DECADE
Record highs of maximum daily precipitation depth per year, standardized by the mean (upper panel; with marking of those being higher than 2) and number thereof per decade (lower panel) for the 31 regions of the globe. The upper and lower 95 percent confidence limits, calculated from the binomial distribution assuming independence and identical distribution, are 8 and 1, respectively, for a decade, and 4 and 1, respectively, for the three-year period 2020–2022; thus, there are no record highs outside the confidence band.
SOURCE: Appendix A.
SR306 A heritage.org
CHART 19
Probabilistic Indices of Change in Annual Maximum Daily Precipitation
Linear trend, empirical Climatic di erence, empirical Climatic di erence, theoretical
SOURCE: Appendix A. PERCENT CHANGE (% PER DECADE)
NON-EXCEEDANCE PROBABILITY
Probability distribution of the indices of change in annual maximum daily precipitation as percentages of the all-time averages for the 31 regions of the globe. The theoretical curves are constructed assuming normal distribution of the climatic di erence and a Hurst parameter equal to the average over all regions (H=0.56).
SR306 A heritage.org
distribution assuming independence and identical distribution, are 8 and 1, respectively, for a decade and 4 and 1, respectively, for the three-year period from 2020 to 2022; thus, there are no record high occurrences, shown in Chart 18 (lower panel), out of the confidence band. The globally highest number of occurrences is observed from 1960 to 1969, although the actual number lies within the estimated confidence bounds. It is also worth noting that the decade of 2000 to 2009, when examined on the global scale, does not exhibit a statistically significant number of high events, as the one observed in the investigation of the instrumental stations in the previous section.
Finally, as shown in Chart 19, the probability distribution of the indices of change agrees with the one expected based on the estimated H parameter (H=0.56; average over all regions), yet it shows more negative changes (decreases of extremes) in the recent period (1993 to 2022) than in the earlier one (1950 to 1979). Again, this is contrary to the intensification claim.
5. Discussion and Conclusions
Amid widespread concerns on intensification of the water cycle during a global warming period, rainfall dynamics and its extremes are receiving increased scientific attention. In this Special Report , the authors complement the literature on global rainfall trends by investigating and combining the advantages of two valuable sources of rainfall information: rainfall stations with length over 150 years and rainfall re-analysis products covering the entire globe. Long-term rainfall stations enable inspection of past climatic regimes and insights into climate dynamics that are not possible to gain via analysis of usually available time series lengths; here, such information goes back to 1697. Rainfall re-analysis products having a homogenous spatial resolution allow robust investigation of recent changes over the globe. The latter is vital, particularly in the search for global signals of change, since instrumental records, albeit longer in length, do not have sufficient global coverage (for example, typically Africa, South America, and large parts of Asia are not covered). Spatial correlation present in instrumental datasets also perplexes the search for significant trends. Here, to mitigate the issue of spatial correlation, the 31 climatically homogeneous regions for rainfall extremes as delineated by the IPCC are also studied separately, aside from the investigation of globally averaged precipitation.
From the above investigations, this Special Report finds that rainfall exhibits substantial interannual variability, with climatic values fluctuating over the years and decades in no systematic manner. The strength of this dynamics exhibits regional differences, being higher in some stations and regions, and weaker in others, but diverges on average from that of a pure random process. This long-term variability is magnified when one investigates rainfall aggregated on larger spatial scales as in re-analysis products. This is consistent with recent literature,42 showing that persistence increases with the spatial scale of averaging, as it is linked to large-scale modes of fluctuation in the climate system. Yet in all cases, these fluctuating dynamics do not support an association of precipitation changes with a single driver, such as rising carbon-dioxide emissions.43 Strong statistical
evidence of flood magnitudes increasing with increasing global mean carbon-dioxide concentration has not been found in the U.S., either.44
A collection of long rainfall stations, mostly distributed in the European region, suggests that the 20th-century annual total rainfall regime differed from that of the late 19th century in its first period, being drier, and returned to “expected” and wetter conditions in the recent decades. In terms of the extremes, the 20th-century rainfall regime differs from that of the 19th century, showing increases in the amount of annual daily maximum precipitation, both in its first period (prior to the 1970s) and continued to differ in the latter years. Yet, as the geographic distribution of the observed series is dominated by stations in Europe, these findings mostly reflect regional signals of change, which are not apparent worldwide.
Indeed, the investigation of ERA5 re-analysis confirms the existence of strong regional differences, with average daily rainfall exhibiting concurrent decreases in East Africa and increases in Southeast Asia. On the other hand, the Mediterranean region, considered a climate change “hotspot,” shows an impressive rainfall climatic stability, which is also in line with literature findings for the same region.45 Occurrences of extremes show irregular spatiotemporal dynamics as well, yet these are less pronounced than the ones observed for rainfall averages. The reported intensification of extreme events in Northern Europe (see also “2. A Brief Review of the Literature on Global Rainfall Trends”) is confirmed by the re-analysis investigation, although inspection of the long series revealed that these increases have been occurring since the early 20th century.
Intense drought periods are also found to be more likely than wet periods; a fact well known in the water resources sector since antiquity.46 Overall, these changes are found to be consistent with statistical expectations. Moreover, the re-analysis data of average daily rainfall do not show a pattern of systematic change when aggregated globally. Globally, the average change metric in the extremes for the recent period (1993 to 2022) as compared to the earlier one (1950 to 1979) is negative (that is, it deviates toward decreases in the extremes). In addition, the past two decades exhibit a lower number of record highs than the previous ones, and, overall, no decade shows a statistically significant number when examined on a global scale.
Rainfall linear trends, which are herein also adopted as an exploratory index of change, have poor predictive capacity, even inferior to the one attained by climatic extrapolation of simpler local mean models.47 This is because long-term rainfall data show fluctuations on all time scales, with little evidence of trending behavior over hundreds of years. Trends computed on shorter time scales than, say, 100 years, are prone to high
prediction errors as they may abruptly shift in magnitude and sign in the future. Of course, adopting a stochastic description of future climate, informed by history, is a far more reliable way to design for the future than extrapolating trends, let alone applying projections of climate models, which underestimate natural variability.48 Thus, the reliance on rainfall trends attributed to global warming neglects the large role of natural variability, and evidence for such monotonic trends predicted by climate models, as shown above, is weak to non-existent.
Hence, this Special Report concludes that rainfall rises and falls irregularly, exhibiting pronounced temporal fluctuations and even more pronounced regional differences. As this dynamics is inherently unpredictable, it is better modeled with stochastic approaches. Notwithstanding the importance of local and regional changes for the operational water resources management and risk preparedness, such changes do not currently concur with the speculative hypothesis of a global systematic change in rainfall, nor with a worldwide intensification of its extremes that could be attributed to a single driver, such as anthropogenic greenhouse gas emissions.
APPENDIX TABLE 1
Properties of the 22 Stations with at Least 200 Years of Records Retrieved from the European Climate Assessment & Dataset
SOURCE: European Climate Assessment & Dataset, http://www.ecad.eu (accessed September 27, 2024).
APPENDIX TABLE 2
Properties of the 60 Longest Stations Used in the Analysis (Page 1 of 3)
Name (Country)
aalsmeer (nL)
anna Paulowna (nL)
armagh (uK)
athens (Gr) national Observatory of athens
Bologna (IT)
Deniliquin Wilkinson St (aS)
(nL)
Island Lighthouse (aS)
GHCnD:ITE00100550 and Dext3r of arPa Emilia romagna, rete di monitoraggio rIrEr (http:// www.smr.arpa.emr.it/ dext3r/)
and Moon
Korea Meteorological
APPENDIX TABLE 2
Properties of the 60 Longest Stations Used in the Analysis (Page 2 of 3)
Jena Sternwarte GM (DE)
Properties of the 60 Longest Stations Used in the Analysis (Page 3
a J. G. Jhun and B. K. Moon, “Restorations and Analyses of Rainfall Amount Observed by Chukwookee,” Journal of Korean Meteorological Society, Vol. 33 (1997), pp. 691–707.
b H. Kutiel and R. M. Trigo, “The Rainfall Regime in Lisbon in the Last 150 Years,” Theoretical and Applied Climatology, Vol. 118 (2014), pp. 387–403.
c M. Marani and S. Zanetti, “Long-Term Oscillations in Rainfall Extremes in a 268 Year Daily Time Series,” Water Resources Research, Vol. 51, No. 1 (2015), pp. 639–647.
d T. P. Burt and N. J. K. Howden, “A Homogenous Daily Rainfall Record for the Radcliffe Observatory, Oxford, from the 1820s,” Water Resources Research, Vol. 47, No. 9 (2011). APPENDIX TABLE 2
Sr306 A heritage.org
Appendix B
Sources for Data Graphics
Sources for all data graphics:
• Royal Netherlands Meteorological Institute (KNMI) “European Climate Assessment & Dataset Project,” updated August 31, 2024, https://www.ecad.eu/ (accessed October 3, 2024).
• Royal Netherlands Meteorological Institute (KNMI), “Climate Explorer,” updated September 30, 2024, https://climexp.knmi.nl/ (accessed October 3, 2024).
• European Climate Assessment & Dataset (Stations Location Dataset), https://knmi-ecad-assets-prd.s3.amazonaws.com/download/stations.txt (accessed October 3, 2024).
• Royal Netherlands Meteorological Institute (KNMI), “Climate Explorer,” updated September 30, 2024, ERA5 Field Dataset, https://climexp.knmi.nl/ select.cgi?era5_tp (accessed October 3, 2024).
• Royal Netherlands Meteorological Institute (KNMI), “Climate Explorer,” updated September 30, 2024, SREX Regions, https://climexp.knmi.nl/download_ masks.cgi?id=22e6401644676bc62a88f1180873b38b&field=nprate_daily&set=SREX (accessed October 3, 2024).
• Theano Iliopoulou and Demetris Koutsoyiannis, “Projecting the Future of Rainfall Extremes: Better Classic than Trendy,” Journal of Hydrology, Vol. 588 (September 2020), p. 125005, https://www.sciencedirect.com/science/article/pii/S0022169420304650#s0010 (accessed October 3, 2024).
Additional sources for specific data
graphics:
Appendix Table 1: Metadata of monthly timeseries from European Climate Assessment & Dataset, https://www.ecad.eu (accessed December 4, 2024), and the KNMI Climate Explorer tool at Climate Explorer, “Starting Point,” https://climexp.knmi.nl/ (accessed December 4, 2024).
Appendix Table 2: Metadata collected from Iliopoulou and Koutsoyiannis (2020).
Charts 1–5: Authors’ calculations based on monthly timeseries from European Climate Assessment & Datatset and the KNMI Climate Explorer tool.
Charts 6–9: Authors’ calculations based on daily timeseries collected from Iliopoulou and Koutsoyiannis (2020) with individual sources listed in Appendix Table 2.
Charts 10–19: Authors’ calculations based on the ERA5 dataset available from European Climate Assessment & Datatset and the KNMI Climate Explorer tool.
Table 1: Authors’ calculations based on monthly time series data from European Climate Assessment & Datatset and the KNMI Climate Explorer tool.
Table 2: Authors’ calculations based on daily timeseries collected from Iliopoulou and Koutsoyiannis (2020) with individual sources listed in Appendix Table 2.
Table 3: SREX regions as defined in Intergovernmental Panel on Climate Change, Managing the Risks of Extreme Events and Disasters to Advance Climate Change Adaptation: Special Report of the Intergovernmental Panel on Climate Change (Cambridge: Cambridge University Press, 2012), https:// www.ipcc.ch/report/managing-the-risks-of-extreme-events-and-disasters-to-advance-climate-change-adaptation/ (accessed December 4, 2024, and Intergovernmental Panel on Climate Change, Climate Change 2013: The Physical Science Basis, (Cambridge: Cambridge University Press, 2013), https:// www.ipcc.ch/report/ar5/wg1/ (accessed December 4, 2024).
Map 1: Authors’ compilations based on monthly timeseries from European Climate Assessment & Datatset and the KNMI Climate Explorer tool.
Map 2: Authors’ compilations based on daily timeseries collected from Iliopoulou and Koutsoyiannis (2020) with individual sources listed in Appendix Table 2.
Map 3: SREX regions as defined in Intergovernmental Panel on Climate Change, Managing the Risks of Extreme Events and Disasters to Advance Climate Change Adaptation, and Intergovernmental Panel on Climate Change, Climate Change 2013: The Physical Science Basis. Coordinates are also available at the KNMI Climate Explorer tool.
Endnotes
1. Demetris Koutsoyiannis and Nikos Mamassis, “From Mythology to Science: The Development of Scientific Hydrological Concepts in Greek Antiquity and its Relevance to Modern Hydrology,” Hydrology and Earth System Sciences, Vol. 25, No. 5 (2021), pp. 2419–2444, https://hess.copernicus.org/ articles/25/2419/2021/ (accessed August 20, 2024).
2. Demetris Koutsoyiannis, Stochastics of Hydroclimatic Extremes: A Cool Look at Risk, 3rd ed. (Athens: Kallipos Open Academic Editions, 2023), https:// doi.org/10.57713/kallipos-1 (accessed August 20, 2024).
3. Intergovernmental Panel on Climate Change, Climate Change 2021: The Physical Science Basis, Contribution of Working Group I to the Sixth Assessment Report of the Intergovernmental Panel on Climate Change (Cambridge: Cambridge University Press, 2021), https://doi. org/10.1017/9781009157896 (accessed August 20, 2024).
4. Demetris Koutsoyiannis, “Revisiting the Global Hydrological Cycle: Is It Intensifying?” Hydrology and Earth System Sciences, Vol. 24, No. 8 (2020), pp. 3899–3932, https://hess.copernicus.org/articles/24/3899/2020/ (accessed August 20, 2024).
5. Bin Wang, Qinghua Ding, and Jong-Ghap Jhun, “Trends in Seoul (1778–2004) Summer Precipitation,” Geophysical Research Letters, Vol. 33, No. 15 (2006).
6. Theano Iliopoulou and Demetris Koutsoyiannis, “Projecting the Future of Rainfall Extremes: Better Classic than Trendy,” Journal of Hydrology, Vol. 588 (September 2020), p. 125005, https://www.sciencedirect.com/science/article/abs/pii/S0022169420304650 (accessed August 20, 2024).
7. K. G. Glynis et al., “Stochastic Investigation of Daily Air Temperature Extremes from a Global Ground Station Network,” Stochastic Environmental Research and Risk Assessment, Vol. 35 (2021), pp. 1585–1603.
8. Seth Westra, Lisa V. Alexander, and Francis W. Zwiers, “Global Increasing Trends in Annual Maximum Daily Precipitation,” Journal of Climate, Vol. 26, No. 11 (2013), pp. 3904–3918, https://journals.ametsoc.org/view/journals/clim/26/11/jcli-d-12-00502.1.xml (accessed August 21, 2024).
9. Qiaohong Sun et al., “A Global, Continental, and Regional Analysis of Changes in Extreme Precipitation,” Journal of Climate, Vol. 34, No. 1 (2021), pp. 243–258, https://journals.ametsoc.org/view/journals/clim/34/1/jcliD190892.xml (accessed August 21, 2024).
10. Simon Michael Papalexiou and Alberto Montanari, “Global and Regional Increase of Precipitation Extremes Under Global Warming,” Water Resources Research, Vol. 55, No. 6 (2019), pp. 4901–4914.
11. Koutsoyiannis, “Revisiting the Global Hydrological Cycle: Is It Intensifying?”
12. Demetris Koutsoyiannis et al., “In Search of Climate Crisis in Greece Using Hydrological Data: 404 Not Found,” Water, Vol. 15, No. 9 (2023), p. 1711, https://www.mdpi.com/2073-4441/15/9/1711 (accessed August 21, 2024).
13. Sun et al., “A Global, Continental, and Regional Analysis of Changes in Extreme Precipitation,” and Andrea Libertino, Daniele Ganora, and Pierluigi Claps, “Evidence for Increasing Rainfall Extremes Remains Elusive at Large Spatial Scales: The Case of Italy,” Geophysical Research Letters, Vol. 46, No. 13 (2019), pp. 7437–7446.
14. Sun et al., “A Global, Continental, and Regional Analysis of Changes in Extreme Precipitation.”
15. Timothy Alston Cohn and Harry F. Lins, “Nature’s Style: Naturally Trendy Supplementary Materials,” Geophysical Research Letters, Vol. 32, No. 23 (January 2005).
16. Khaled H. Hamed, “Trend Detection in Hydrologic Data: The Mann–Kendall Trend Test under the Scaling Hypothesis,” Journal of Hydrology, Vol. 349, Nos. 3–4 (2008), pp. 350–363, https://www.sciencedirect.com/science/article/abs/pii/S0022169407006865 (accessed August 21, 2024).
17. Francesco Serinaldi, Chris G. Kilsby, and Federico Lombardo, “Untenable Nonstationarity: An Assessment of the Fitness for Purpose of Trend Tests in Hydrology,” Advances in Water Resources, Vol. 111 (2018), pp. 132–155, https://www.sciencedirect.com/science/article/pii/S0309170817305845 (accessed August 21, 2024).
18. Demetris Koutsoyiannis, “Climate Change, the Hurst Phenomenon, and Hydrological Statistics,” Hydrological Sciences Journal, Vol. 48, No. 1 (2003), pp. 3–24, and Panayiotis Dimitriadis et al., “A Global-Scale Investigation of Stochastic Similarities in Marginal Distribution and Dependence Structure of Key Hydrological-Cycle Processes,” Hydrology, Vol. 8, No. 2 (2021), p. 59.
19. Cohn and Lins, “Nature’s Style.”
20. Demetris Koutsoyiannis and Alberto Montanari, “Statistical Analysis of Hydroclimatic Time Series: Uncertainty and Insights,” Water Resources Research, Vol. 43, No. 5 (2007).
21. Theano Iliopoulou and Demetris Koutsoyiannis, “Revealing Hidden Persistence in Maximum Rainfall Records,” Hydrological Sciences Journal, Vol. 64, No. 14 (2019), pp. 1673–1689.
22. Theano Iliopoulou et al., “Revisiting Long-Range Dependence in Annual Precipitation,” Journal of Hydrology, Vol. 556 (2018), pp. 891–900, and Dimitriadis et al., “A Global-Scale Investigation of Stochastic Similarities in Marginal Distribution and Dependence Structure of Key Hydrological-Cycle Processes.”
23. Demetris Koutsoyiannis and Theano Iliopoulou, “Understanding Climate: Gifts from the Nile,” Heritage Foundation Special Report No. 301, December 3, 2024, https://www.heritage.org/environment/report/understanding-climate-gifts-the-nile
24. Iliopoulou and Koutsoyiannis, “Projecting the Future of Rainfall Extremes.”
SPECIAL REPORT | n o. 306 heritage.org
25. Dutch Royal Netherlands Meteorological Institute, “Climate Explorer,” https://climexp.knmi.nl/ (accessed August 21, 2024).
26. Also see Koutsoyiannis and Iliopoulou, “Understanding Climate: Gifts from the Nile.”
January 10, 2025 | 47
27. Panayiotis Dimitriadis and Demetris Koutsoyiannis, “Climacogram Versus Autocovariance and Power Spectrum in Stochastic Modelling for Markovian and Hurst–Kolmogorov Processes,” Stochastic Environmental Research and Risk Assessment, Vol. 29 (2015), pp. 1649–1669.
28. Koutsoyiannis, Stochastics of Hydroclimatic Extremes
29. Ibid.
30. Iliopoulou et al., “Revisiting Long-Range Dependence in Annual Precipitation,” and Dimitriadis et al., “A Global-Scale Investigation of Stochastic Similarities.”
31. Mahabanoo N. Tata, “On Outstanding Values in a Sequence of Random Variables,” Zeitschrift für Wahrscheinlichkeitstheorie und verwandte Gebiete (Journal of Probability Theory and Related Fields), Vol. 12, No. 1 (March 1969), pp. 9–20; Ned Glick, “Breaking Records and Breaking Boards,” American Mathematical Monthly, Vol. 85, No. 2 (1978), pp. 2–26; F. G. Foster and A. Stuart, “Distribution-Free Tests in Time-Series Based on the Breaking of Records,” Journal of the Royal Statistical Society Series B, Vol. 26, No. 1 (1954), pp. 1–22; and E. Anagnostopoulou et al., “Record Breaking Properties for Typical Autocorrelation Structures,” presented at the European Geosciences Union General Assembly 2013, Geophysical Research Abstracts, Vol. 15, Vienna, EGU2013-4520 (2013), https://www.itia.ntua.gr/1331/ (accessed August 21, 2024).
32. Iliopoulou and Koutsoyiannis, “Projecting the Future of Rainfall Extremes,” and Iliopoulou and Koutsoyiannis, “Revealing Hidden Persistence in Maximum Rainfall Records.”
33. Iliopoulou and Koutsoyiannis, “Revealing Hidden Persistence in Maximum Rainfall Records.”
34. Sun et al., “A Global, Continental, and Regional Analysis of Changes in Extreme Precipitation,” pp. 243–258.
35. ECMWF Confluence, “ERA5: Data Documentation—Copernicus Knowledge Base,” https://confluence.ecmwf.int/display/CKB/ERA5%3A+data+documen tation#heading-Relatedarticles (accessed September 9, 2024).
36. Dutch Royal Netherlands Meteorological Institute, “Climate Explorer.”
37. E-OBS is the daily gridded land-only observational dataset over Europe. From the EU-FP6 project “Uncertainties in Ensembles of Regional ReAnalyses,” http://www.uerra.eu (accessed August 21, 2024), and the data providers in the European Climate Assessment & Dataset, https://www.ecad.eu/ (accessed August 21, 2024).
38. E. Kalnay et al., “The NCEP/NCAR 40-Year Reanalysis Project,” Bulletin of the American Meteorological Society, Vol. 77, No. 3 (1996), pp. 437–470, https://journals.ametsoc.org/view/journals/bams/77/3/1520-0477_1996_077_0437_tnyrp_2_0_co_2.xml (accessed September 8, 2024).
39. Intergovernmental Panel on Climate Change, Managing the Risks of Extreme Events and Disasters to Advance Climate Change Adaptation
40. Intergovernmental Panel on Climate Change, Climate Change 2013: The Physical Science Basis, Contribution of Working Group I to the Fifth Assessment Report of the Intergovernmental Panel on Climate Change (Cambridge: Cambridge University Press, 2013), http://www.climatechange2013. org/report/ (accessed August 21, 2024).
41. Enda O’Connell, Greg O’Donnell, and Demeris Koutsoyiannis, “On the Spatial Scale Dependence of Long-Term Persistence in Global Annual Precipitation Data and the Hurst Phenomenon,” Water Resources Research, Vol. 59, No. 4 (2023), p. e2022WR033133, https://agupubs.onlinelibrary. wiley.com/doi/full/10.1029/2022WR033133 (accessed August 21, 2024).
42. O’Connell, O’Donnell, and Koutsoyiannis, “On the Spatial Scale Dependence of Long-Term Persistence in Global Annual Precipitation Data and the Hurst Phenomenon.”
43. Hannah Ritchie, Pablo Rosado, and Max Roser, “CO2 and Greenhouse Gas Emissions,” Our World in Data, undated, https://ourworldindata.org/co2and-greenhouse-gas-emissions (accessed August 21, 2024).
44. Robert M. Hirsch and K. R. Ryberg, “Has the Magnitude of Floods Across the USA Changed with Global CO2 Levels?” Hydrological Sciences Journal, Vol. 57, No. 1 (2012), pp. 1–9.
45. Koutsoyiannis et al., “In Search of Climate Crisis in Greece Using Hydrological Data.”
46. Koutsoyiannis and Iliopoulou, “Understanding Climate: Gifts from the Nile.”
47. Iliopoulou and Koutsoyiannis, “Projecting the Future of Rainfall Extremes.”
48. Koutsoyiannis et al., “In Search of Climate Crisis in Greece Using Hydrological Data”; Demetris Koutsoyiannis, Andreas Efstratiadis, and Konstantine Georgakakos, “Uncertainty Assessment of Future Hydroclimatic Predictions: A Comparison of Probabilistic and Scenario-based Approaches,” Journal of Hydrometeorology, Vol. 8, No. 3 (2007), pp. 261–281; Grigorios G. Anagnostopoulos et al., “A Comparison of Local and Aggregated Climate Model Outputs with Observed Data,” Hydrological Sciences Journal, No. 55, No. 7 (2010), pp. 1094–1110; and Rui Guo and Alberto Montanari, “Historical Rainfall Data in Northern Italy Predict Larger Meteorological Drought Hazard than Climate Projections,” Hydrology and Earth System Sciences, Vol. 27, No. 15 (2023), pp. 2847–2863.