The Administrative Human-Caused Climate Change
Erik Bye and Ole Humlum
June 14, 2025, and February 29, 2020
Why are historical temperature measurements still being altered to this day? Ole Humlum has identified a definitive example of human-caused climate change.
New:
This article is based on an article by Ole Humlum in Norwegian:
https://www.skypat.no/tviler/administrativt-menneskeskapt-klimaendring -ole-humlum-professor-emeritus-hvorfor-blir-historiske-temperaturmaling er-fortsatt-endret-den-dag-i-dag-fra-geoforskning-no/
Why are historical temperature measurements still being altered to this day? This is identified and described here as a definitive example of human-caused climate change.
In newspapers, on TV, and in blogs, we currently see serious reports (such as the crisis) side by side with the so-called “temperature pause ” . This is to be expected as there will be a climate conference in Paris (COP21/CMP11) in a couple of months.
By “temperature pause, ” we understand the fact that the global temperature has largely not changed in the last 15 – 18 years.
Until recently, there was much debate about where the missing heat (in relation to the climate models’ predictions) had disappeared to. It could possibly be hiding in the deep ocean or in those parts of the Arctic where there are no meteorological stations. There were many explanations.
Recently, however, this debate has been replaced by innlegg posts arguing that there has not been a “temperature pause ” at all, but that recently adjusted data series show a continued slight increase in temperature.
Even these recently adjusted temperature series show a significantly smaller temperature increase after the year 2000 than predicted by the climate models, which should be the most interesting thing about this case.
In January 2008, I (OH) was one of the first to point out the lack of temperature increase and have since followed the development with interest, also on the database side.
What I note today is that the databases that are now being drawn into the climate debate as an argument for a continued weak temperature increase are all based on ground measurements (see link below). The gold standard of global temperature measurements, namely the satellite-based measurement series, is not mentioned.
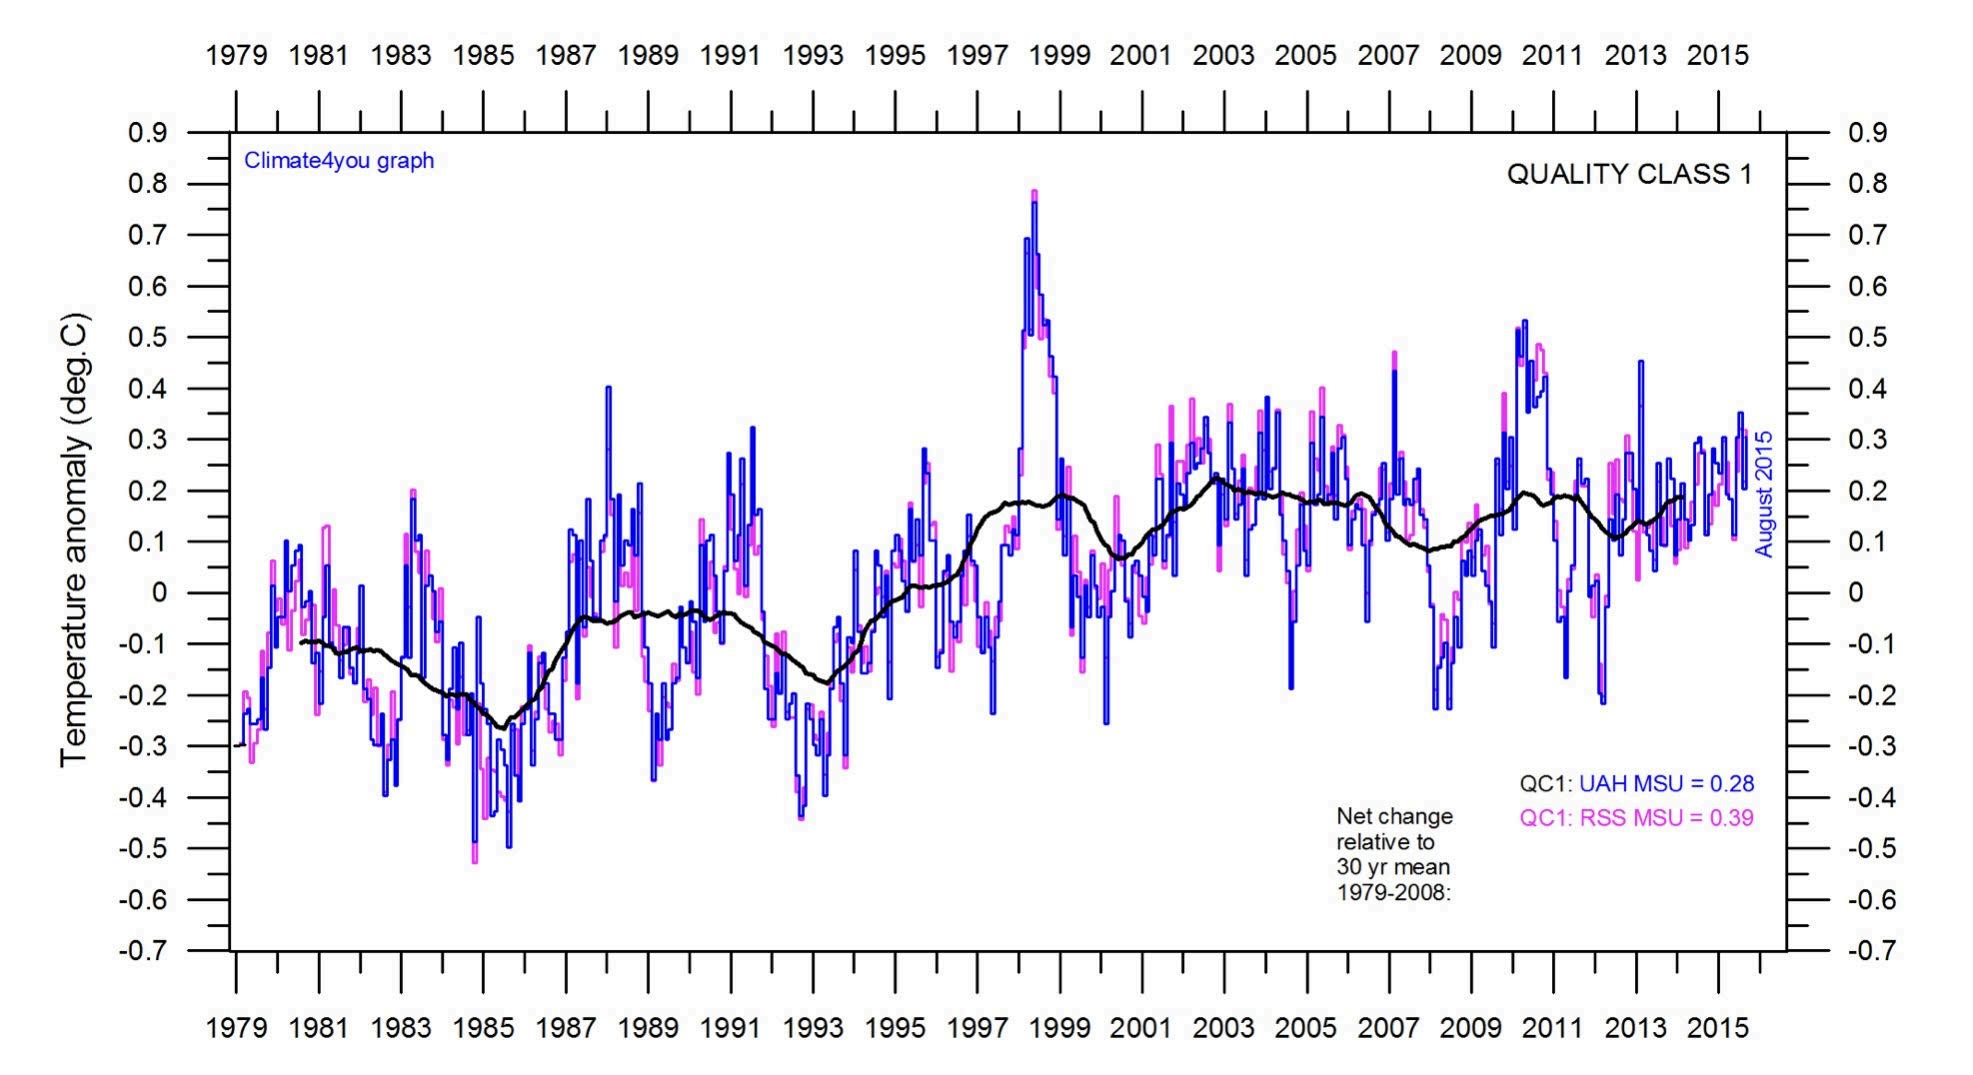
The two existing satellite measurement series for global temperature (see link below) are, however, consistent with a continued temperature pause (Figure 1, below).
Figure 1. Global monthly average according to satellite measurements. The thick line is the simple running 37-month average.
So why do the ground-based temperature series show more temperature increase than the satellite-based ones?
Adjusted far back in time
Part of the explanation lies in the constant administrative adjustments made to the ground temperature databases.
It can be expected that adjustments to the official global temperature of the month may occur up to 3-4 months after the end of the month, as delayed temperature measurements may be received. But for months that lie far back in time, this naturally does not happen.
However, ground temperatures far back in time are also constantly adjusted.
So if, for example, one asked in May 2015 what the global temperature was in January 1970 based on one of the ground temperature databases, the answer would probably be different if one asked again two months later, in July 2015.
Imagine if Statistics Norway similarly continuously adjusted the official population count in Norway back in time? Even months that lie more than 125 years back in time undergo such continuous temperature changes, which certainly have nothing to do with the reporting of delayed data.
Only a few are aware that such changes are constantly being made in global ground temperatures, which, among other things, form the basis for the work of the UN's Intergovernmental Panel on Climate Change (IPCC) and are often cited in the Norwegian climate debate.
To my knowledge, there is no good documentation for the reason for and details of these constant adjustments to global ground temperatures.
So one might ask whether these adjustments are anything more than purely cosmetic. Yes, they are quite significant.
I first became aware that the adjustments took place in the spring of 2008. At first, I assumed that it was a mistake and a one-off event, but I quickly realized that it is an ongoing process.
Therefore, since then I have achieved all new monthly series from the various databases month by month, in order to then analyze what the adjustments actually mean in a longer time perspective.
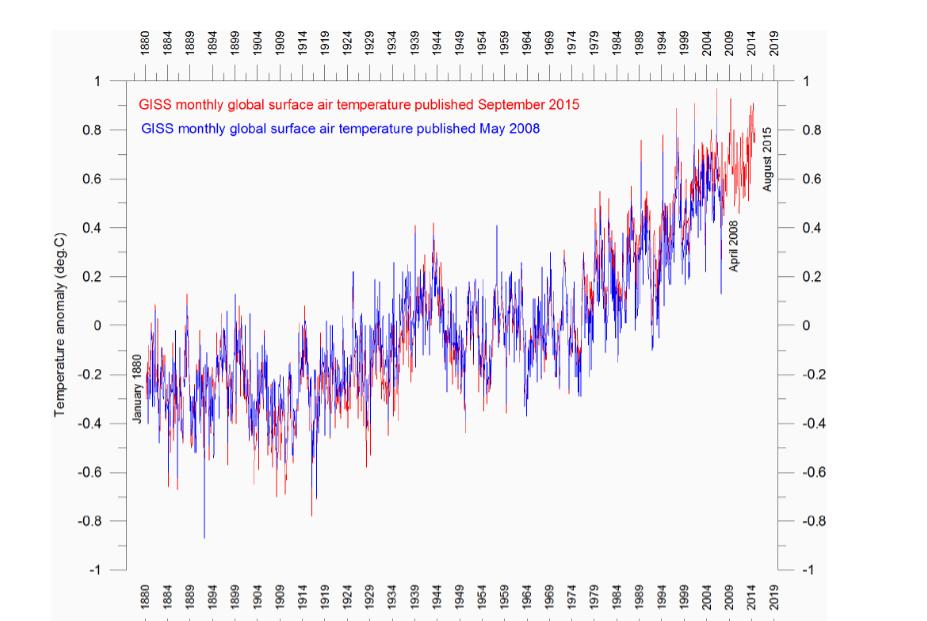
The diagram in Figure 2 (below) shows the total adjustment made since May 2008 of the global ground temperature according to NASA/GISS, up to and including September 2015, that is, over a period of just under 7.5 years.
Figure 2. Global surface temperature (NASA/GISS) published in May 2008 (blue) and September 2015 (red), respectively. The bottom chart shows the
monthly net change since January 1880, taken between May 2008 and September 2015.
We see here that the administrative changes since May 2008 can be as large as plus or minus 0.2 degrees Celsius.
We also see that negative net changes dominate before 1940, and that positive changes are completely dominant after 1980.
The total temperature increase according to NASA/GISS since the end of the Little Ice Age around 1900 and up to the year 2000 is thus at least 0.2 degrees greater in September 2015 than it was in May 2008.
This is not an insignificant administrative change over only 7.5 years, since we usually talk about a total temperature increase of about 0.8 degrees Celsius since the end of the Little Ice Age.
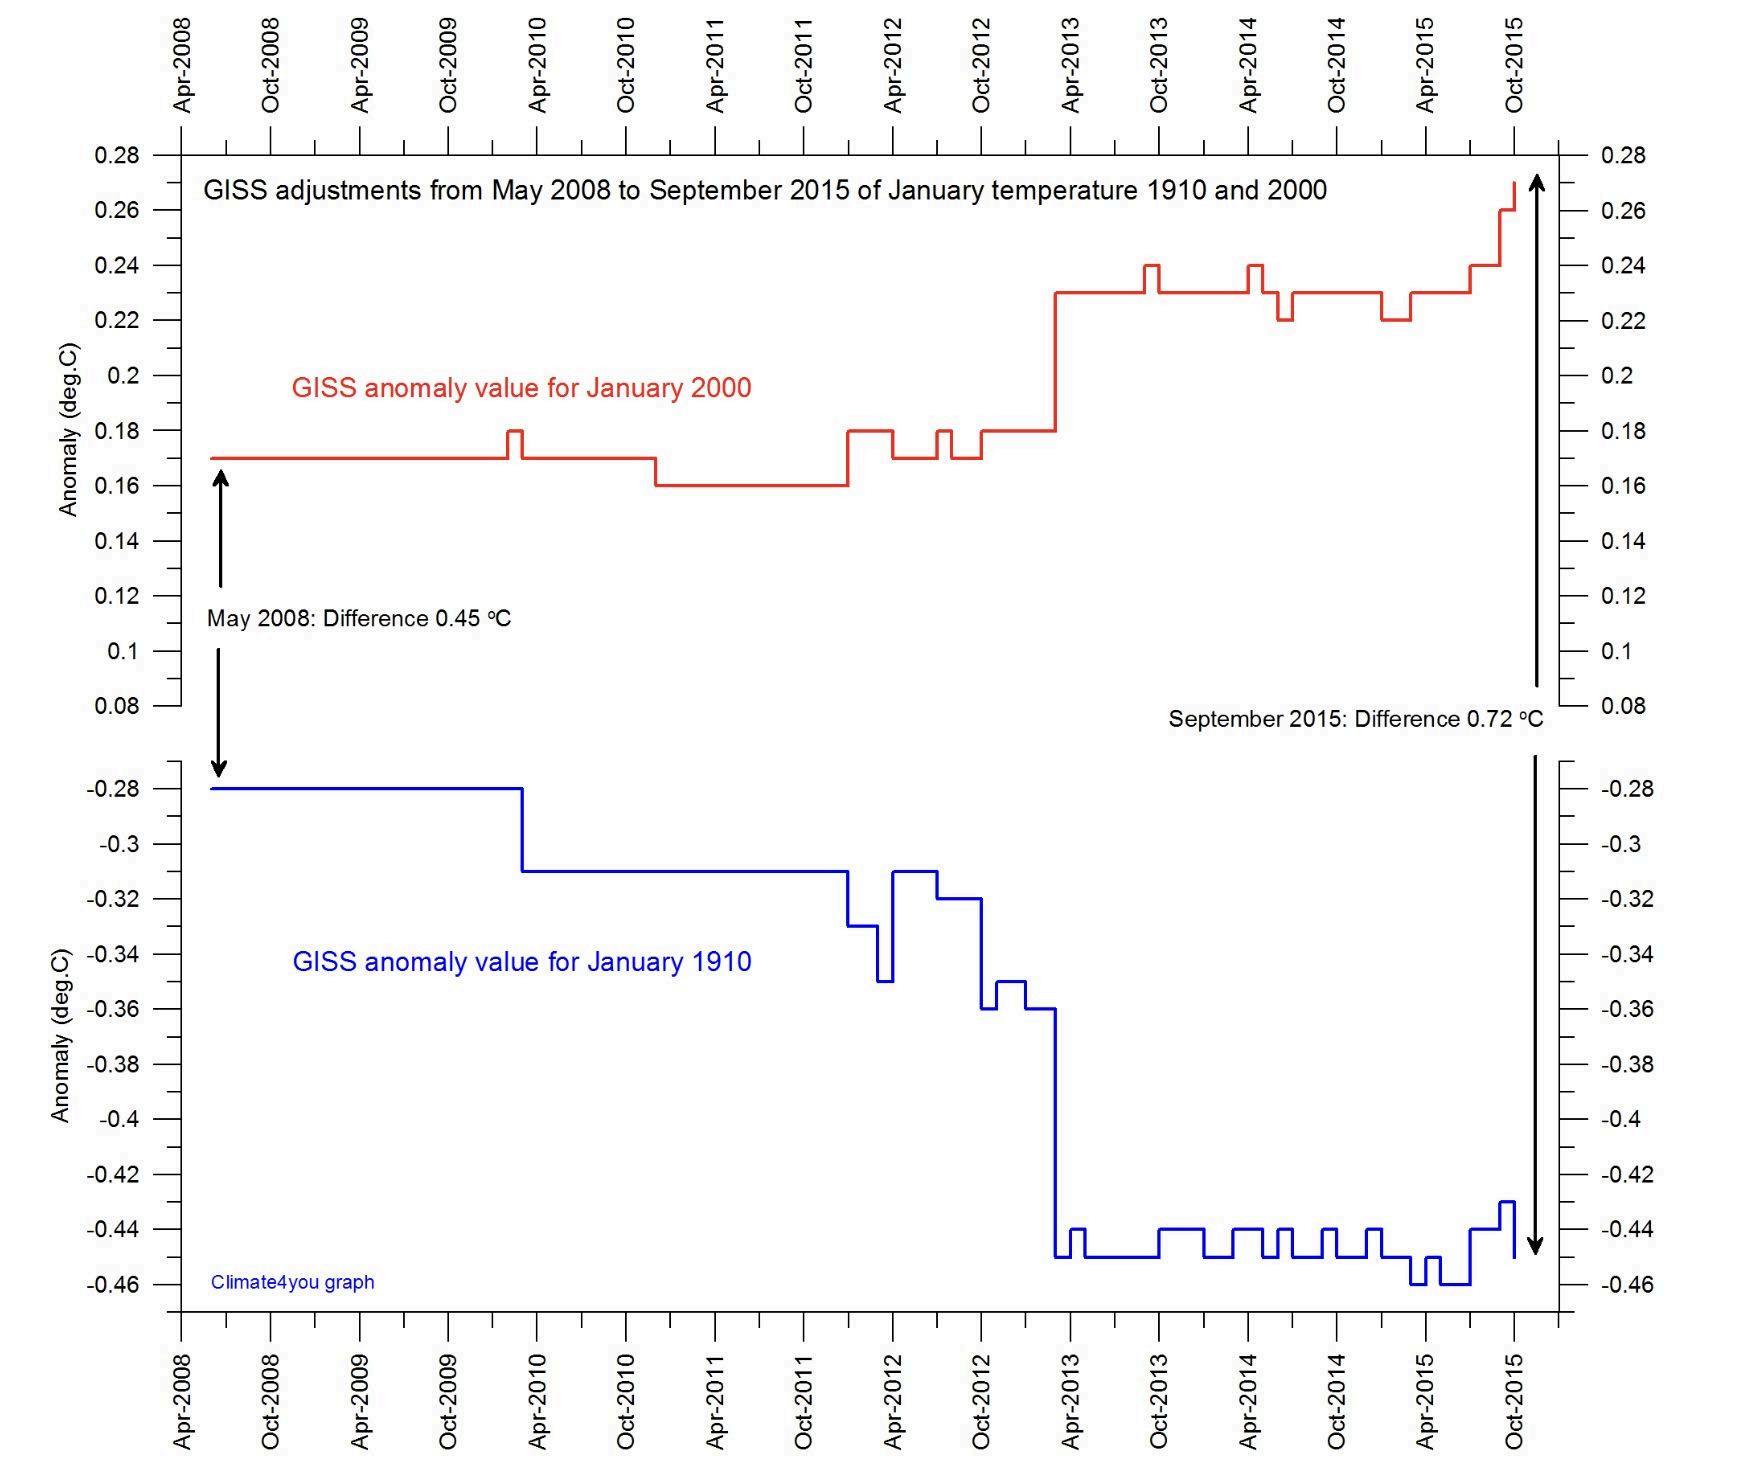
Figure 3 (below) illustrates the problem with the administrative temperature changes in a different way.
Here are two graphs showing how the temperature for January 1910 and January 2000 from NASA/GISS has changed month by month between May 2008 and September 2015.
Figure 3. Diagram showing how temperatures for January 1910 and January 2000 have changed since May 2008, according to NASA/GISS.
In May 2008, the database reported that January 2000 was 0.45 degrees Celsius warmer than January 1910.
If you ask the same database in September 2015, the temperature increase is now 0.72 degrees Celsius. In other words, the administrative changes to the NASA/GISS database now account for almost 40 percent of the last published temperature difference between the two months of January 1910 and January 2000.
It is certainly not a negligible contribution, and accounts for no less than 60 percent of the original temperature difference published in May 2008.
Of course, I cannot comment on what changes may have been made before May 2008, but I can safely conclude that the detection of these administrative temperature changes has identified a very definite example of anthropogenic climate change.
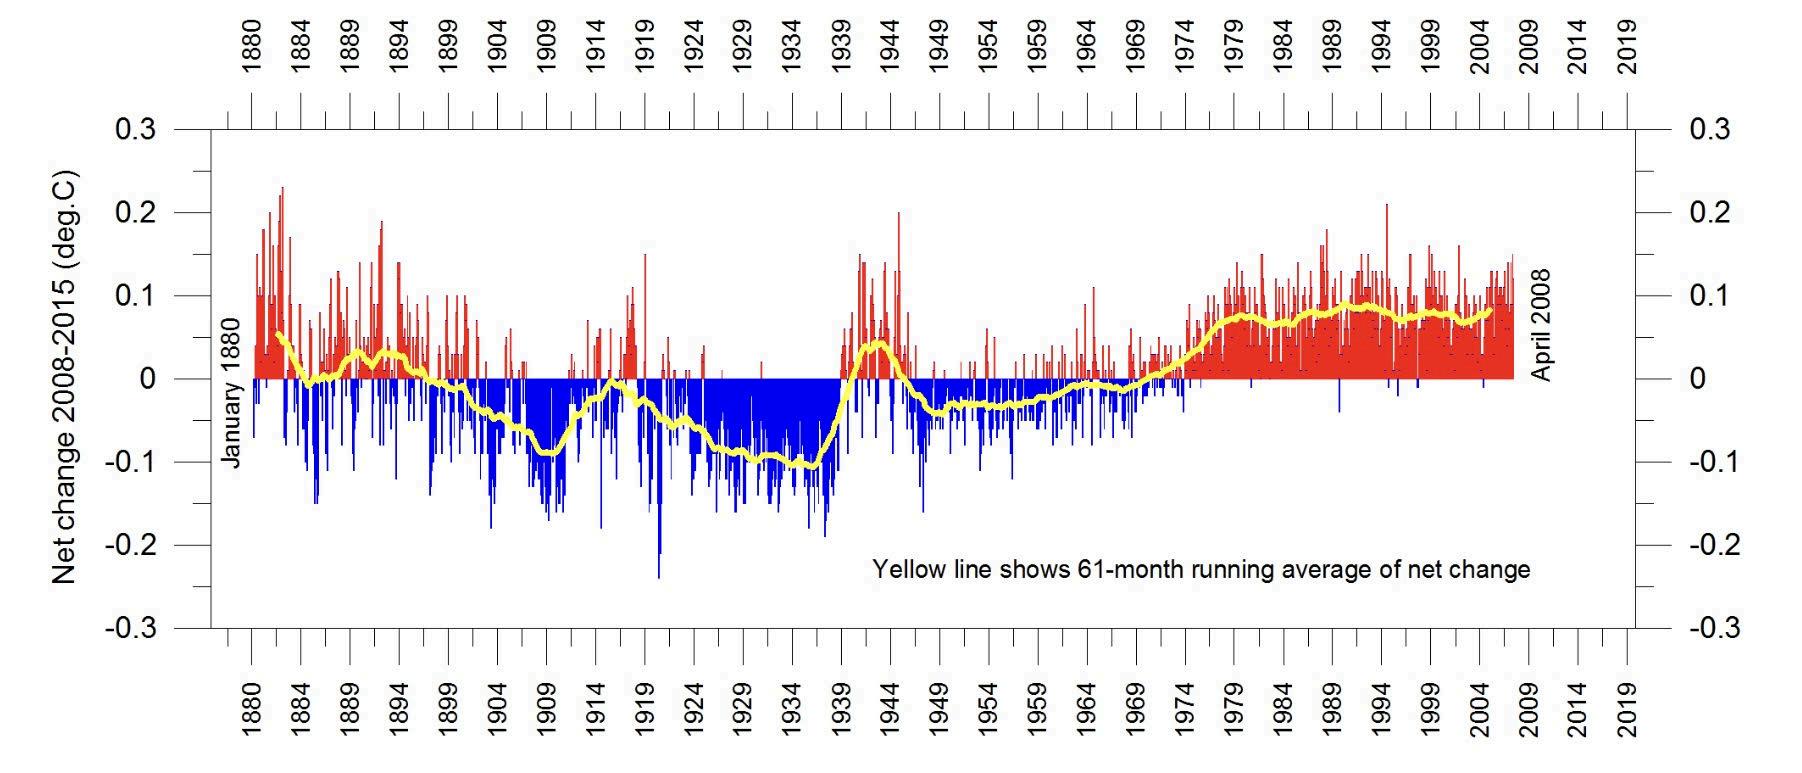
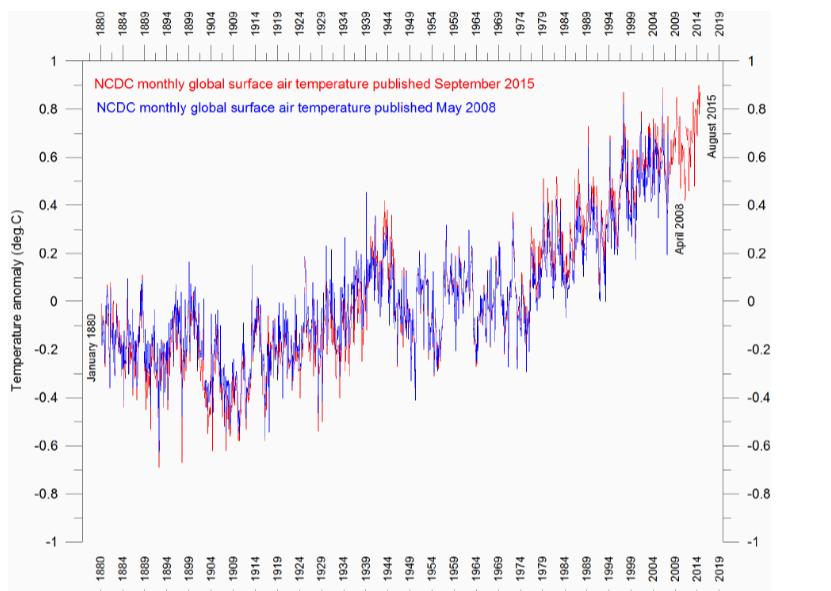
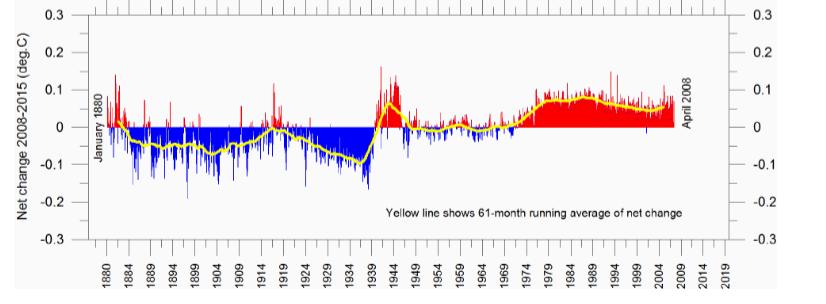
Figure 4 shows the extent of similar changes for another frequently cited global temperature database, NOAA/NCDC. The picture is largely the same. The total temperature increase since the end of the Little Ice Age is administratively made larger and larger as time goes by, month by month.
Figure 4. Global surface temperature (NOAA/NCDC) published in May 2008 (blue) and September 2015 (red), respectively. The bottom chart shows the monthly net change since January 1880, taken between May 2008 and September 2015.
As mentioned, only a few are aware of this, although it can be useful to know when assessing details of global temperature dynamics, for example, whether one or another month is more or less record-breaking.
It is clear that databases constantly change the temperature of the past cannot be correct.
A correct database will, by its very nature, be stable. At the same time, it should be recognized that there is a great deal of dedicated work behind the establishment and operation of all global temperature databases, something for which we should all be grateful.
But in any case, I wonder why precisely the two databases (NASA/GISS and NOOA/NCDC) for ground temperature shown here are most often the ones that news media in Norway bring up when the debate is about climate. They do not represent the very highest standard for global temperature databases.
The task of putting together the many different ground and sea surface temperatures into a credible global temperature is almost insoluble.
Instrumentation, procedures, and station locations have changed over time for most stations. If you are interested in the best possible information about global temperature, use satellite measurements instead; we have them anyway.