
CME Soybeans
Next Day Probabilities
July 21, 2025
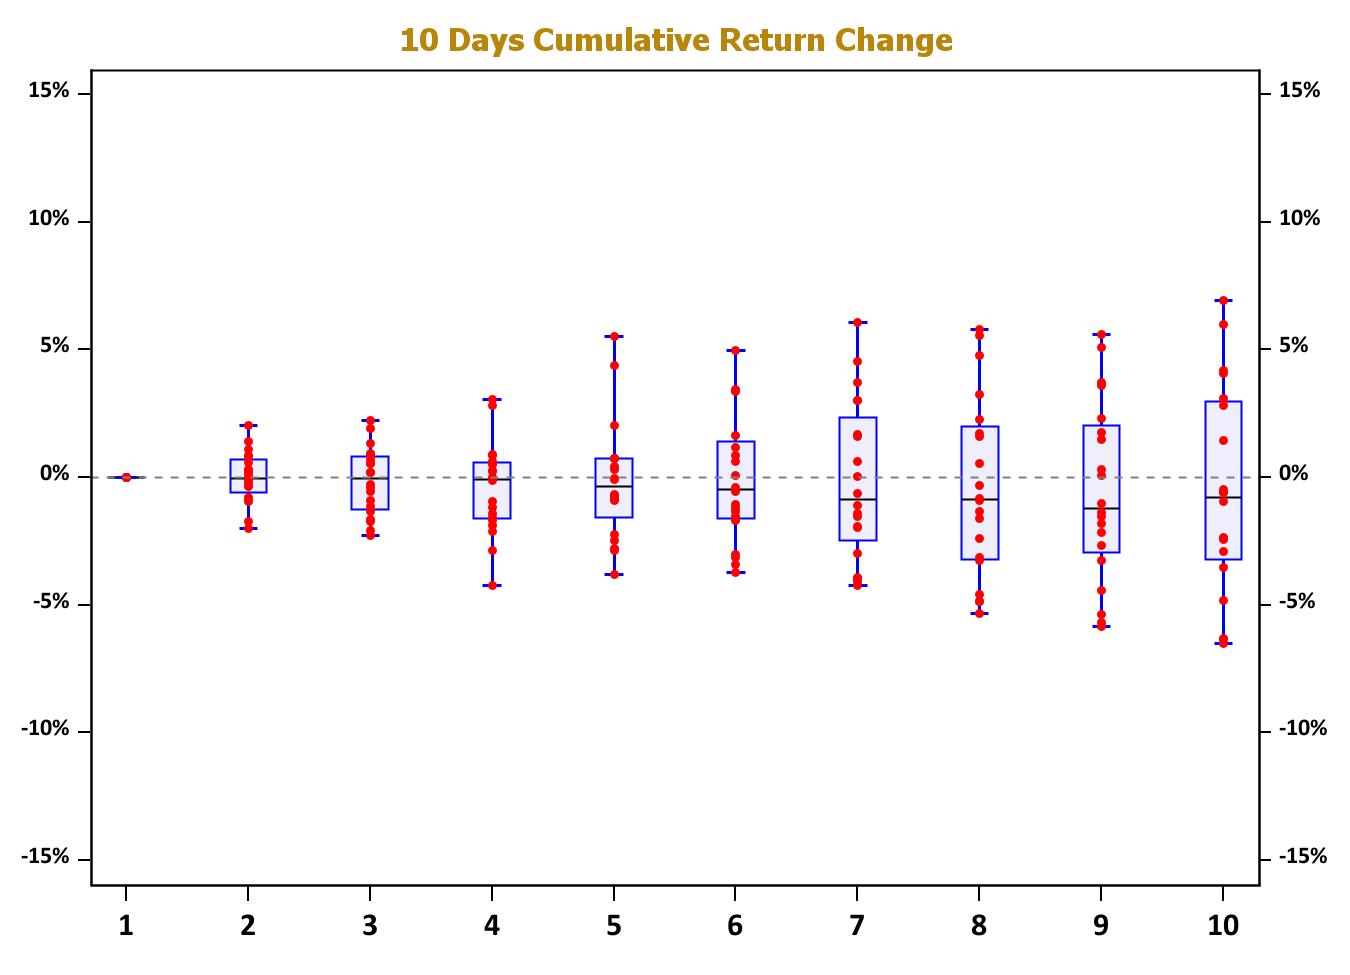
Summary Cumulative Percent Change in Soybeans Price Statistics
By Day For the Next 10 Trading Days
Case 1 of 20: Starting at Aug 22, 2023
1,275 1,300 1,325 1,350 1,375 1,400
22Aug23 29Aug23 05Sep23 12Sep23 1,275
1,275 1,300 1,325 1,350 1,375 1,400 1,425
1,275 1,300 1,325 1,350 1,375 1,400 1,425
31Aug23 07Sep23 14Sep23 21Sep23
1,275 1,300 1,325 1,350 1,375 1,400 1,425
1,275 1,300 1,325 1,350 1,375 1,400 1,425
05Sep23 12Sep23 19Sep23 26Sep23
1,350 1,400
1,300
07Sep23 14Sep23 21Sep23 28Sep23
1,120 1,140 1,160 1,180 1,200 1,220
1,140 1,160 1,180 1,200 1,220
1,125 1,150 1,175 1,200 1,225 1,250
1,125 1,150 1,175 1,200 1,225 1,250 1,275
1,000 1,025 1,050 1,075
1,000 1,025 1,050 1,075
1,000 1,025 1,050 1,075
1,000 1,025 1,050 1,075
1,000 1,025 1,050 1,075
Case 18 of 20: Starting at Dec 13, 2024
25JAN25
26JAN25
1,050
1,000
Summary Cumulative Percent Change