
CME Soybeans
Next Day Probabilities
July 25, 2025
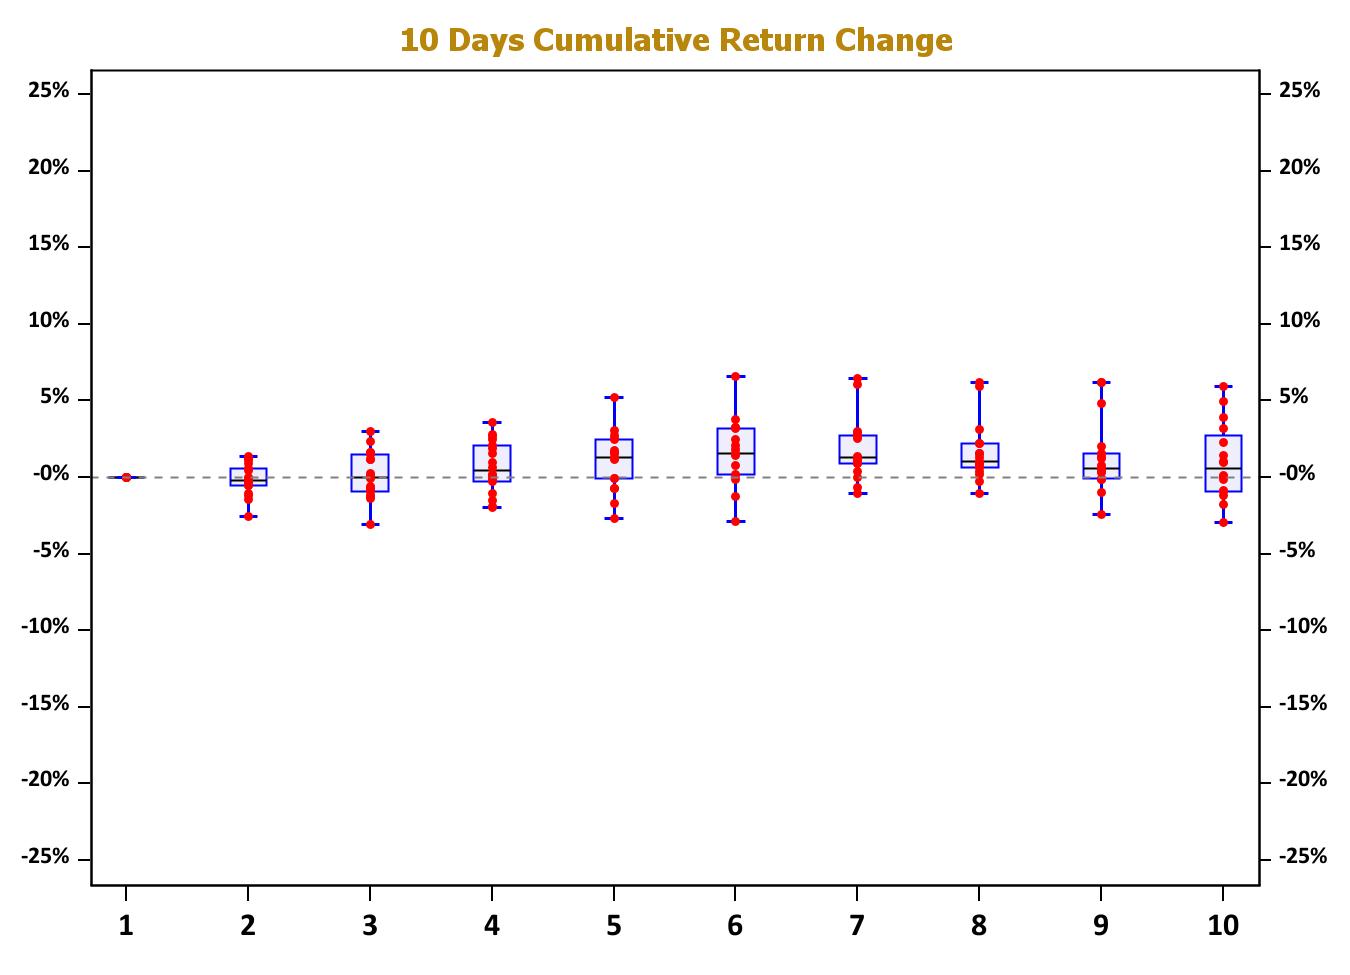
Summary Cumulative Percent Change in Beans Price Statistics
By Day For the Next 10 Trading Days
1,050 1,100
1,000 1,050 1,100
1,000 1,050 1,100
Case 3 of 20: Starting at Dec 19, 2024
1,000 1,050 1,100
Case 4 of 20: Starting at Jan 6, 2025 With Latest Beans Price Conditions
1,000 1,050 1,100
Case 5 of 20: Starting at Mar 4, 2025
1,000 1,025 1,050 1,075
1,000 1,025 1,050 1,075
Case 6 of 20: Starting at Mar 5, 2025
1,000 1,025 1,050 1,075
Case 7 of 20: Starting at Mar 11, 2025
1,000 1,025 1,050 1,075
Case 8 of 20: Starting at Mar 12, 2025
1,000 1,025 1,050 1,075
1,000 1,025 1,050 1,075
Case 9 of 20: Starting at Mar 13, 2025
1,000 1,025 1,050 1,075
1,000 1,025 1,050 1,075
1,000 1,025 1,050 1,075
1,000 1,025 1,050 1,075
Case 12 of 20: Starting at Apr 7, 2025
2 StDev Above and Below 20 Day MA Case 12 : Starting at Apr 7, 2025
1,000 1,025 1,050 1,075 Upper and Lower Third
07Apr25 21Apr25 05May25 19May25 02Jun25 16Jun25 30Jun25 14Jul25
Case 13 of 20: Starting at Jun 26, 2025
1,000 1,020 1,040 1,060 1,080
Case 14 of 20: Starting at Jun 27, 2025
1,000 1,020 1,040 1,060 1,080
Case 15 of 20: Starting at Jul 9, 2025
1,000 1,020 1,040 1,060 1,080
Case 16 of 20: Starting at Jul 10, 2025
1,000 1,020 1,040 1,060 1,080
Case 17 of 20: Starting at Jul 15, 2025 With Latest Beans Price Conditions
1,000 1,020 1,040 1,060 1,080
15Jul25
22Jul25
15Jul25 22Jul25
Case 18 of 20: Starting at Jul 22, 2025 With Latest Beans Price Conditions
Case 19 of 20: Starting at Jul 23, 2025 With Latest Beans Price Conditions
Case 20 of 20: Starting at Jul 25, 2025 With Latest Beans Price Conditions
1,040
1,000 1,020
Summary Cumulative Percent Change