
MARKET REPORT
Q2 2026 • JACKSON HOLE
MARKET REPORT
Q2 2026 • THE JACKSON HOLE MARKET
Q2 2026 marked an active but increasingly segmented period for the Jackson Hole real estate market. Total sales increased 9% year over year, rising from 148 to 161 transactions, while pending listings increased 5% to 63. Active inventory remained relatively stable, increasing 2% to 354 listings, and average days on market declined 14%, from 167 to 143 days. Total dollar volume increased 49% to approximately $1.04 billion, although the first half of 2026 pricing figures were heavily influenced by a $350 million transaction. Because the market includes homes, condominiums, land, commercial properties, and other specialized assets, each segment provides a clearer picture than a single blended average.
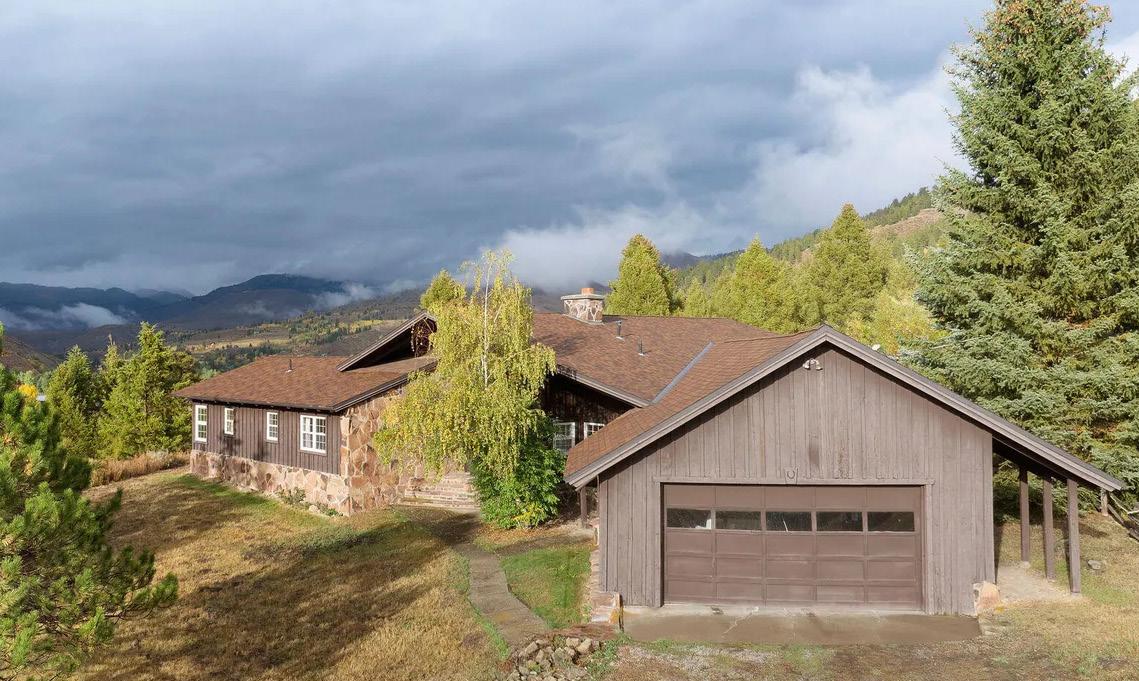
Single-family homes remained the largest component of the market, accounting for 78 sales, or approximately 48% of all Q2 transactions. Sales increased 24% from 63 one year earlier, although total dollar volume declined 14% to $319.5 million.
The average sale price fell 30% to approximately $4.10 million, while the median declined 15% to $2.85 million, indicating that the increase in activity was concentrated below the prior year’s highest price points. Demand remained strongest above $2 million, with 39 sales between $2 million and $5 million and 23 sales above $5 million. Active listings declined 5% to 143, pending transactions fell 4% to 27, and average market time increased 11% to 158 days.
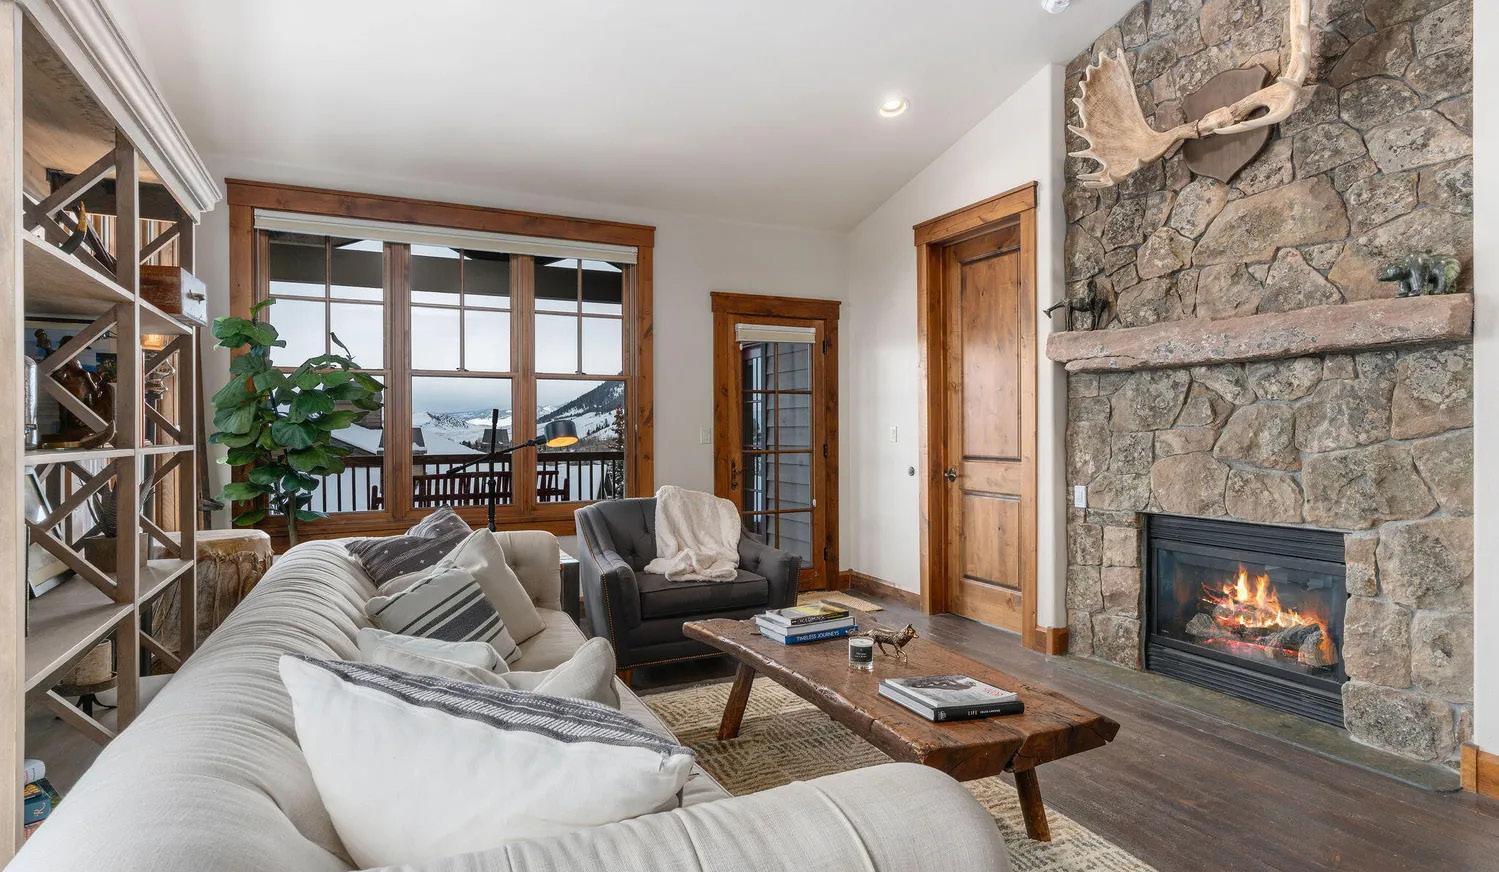
Condominium and townhome activity declined 18%, from 51 to 42 transactions, but the segment experienced significant pricing growth. Total dollar volume increased 20% to $102.7 million, while the average sale price rose 46% to approximately $2.44 million and the median increased 25% to $1.53 million. This increase was driven by stronger activity at the upper end of the attached housing market. Sales above $2 million doubled from 8 to 16, including 8 transactions above $5 million. At the same time, sales below $2 million declined from 43 to 26. Active inventory decreased 10% to 60 listings, pending transactions more than doubled to 19, and average days on market declined 27% to 102 days.
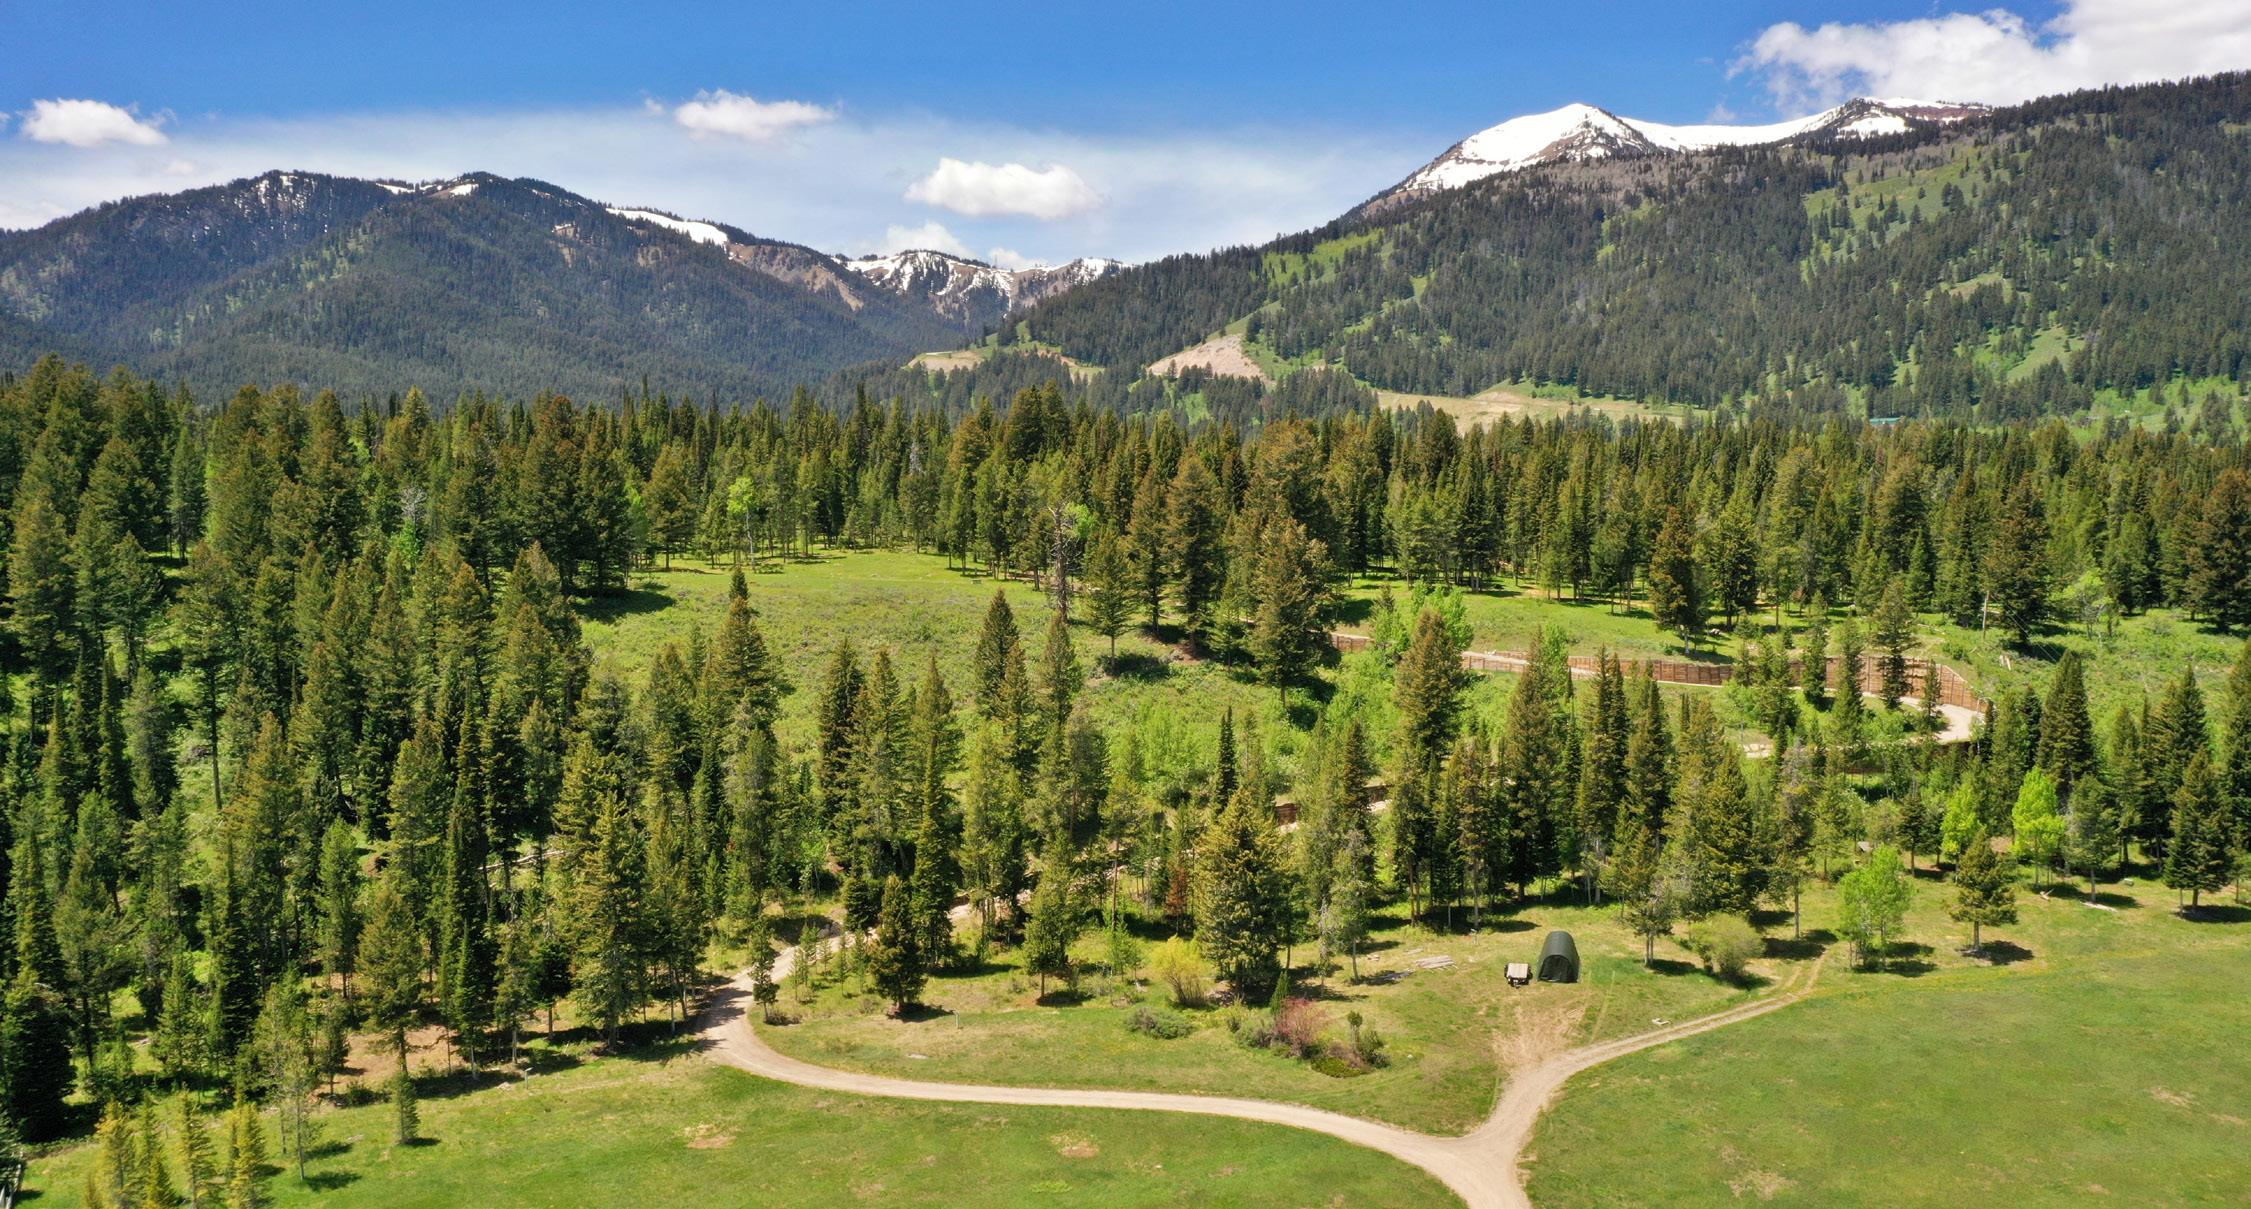
Vacant land recorded the strongest increase in transaction activity, with sales rising 40% from 20 to 28. Total dollar volume increased 18% to approximately $128.7 million, even as the average sale price declined 16% to $4.60 million and the median decreased 8% to $3.10 million. Activity remained concentrated at higher price points, with 12 sales between $2 million and $5 million and 10 sales above $5 million. Land availability expanded considerably, with active listings increasing from 14 to 72 and pending transactions rising from 2 to 8. Despite the larger inventory, average market time improved 25%, declining from 254 to 191 days. Commercial sales increased modestly from 9 to 10 transactions, while four additional sales were recorded across other property categories. The commercial median increased 102% to $3.75 million, but the segment’s average and dollar volume were heavily influenced by the quarter’s $350 million sale, compared with an $85 million high sale one year earlier. Active commercial inventory increased from 3 to 8 listings, pending activity doubled to 2 transactions, and average days on market declined 65% to 91 days. Cash purchases continued to represent 59% of overall sales, while conventional financing increased slightly to 24%. Non-MLS transactions rose 16% to 51 sales and represented approximately 32% of total activity.
Overall, Q2 2026 reflected a healthy but highly segmented Jackson Hole market. Single-family activity strengthened despite lower average and median pricing, condominium and townhome sales became increasingly concentrated in premium price ranges, and vacant land recorded strong transaction growth alongside a substantial increase in availability. Commercial activity was shaped by one exceptional transaction that significantly affected the quarter’s blended pricing and volume figures. Successful outcomes continued to depend on property type, location, condition, and accurate pricing rather than uniform appreciation across the market.
With many sales occurring outside of the MLS (Multiple-List Service), it is important to manually track ALL Teton County real estate sales. Typically, it is the higher-end sales that go unreported, vastly skewing the accuracy of MLS data alone. Our market report accounts for all sales, providing a comprehensive overview and deeper insight into the market. TOTAL DOLLAR VOLUME 49% INCREASE YOY $1.04B AVG SFH SALES PRICE 30% DECREASE YOY $4.1M MEDIAN SFH SALES PRICE
TOTAL TRANSACTIONS 9% INCREASE YOY
354
162 ACTIVE LISTINGS 2% INCREASE YOY
TRANSACTION DISTRIBUTION BY LOCATION
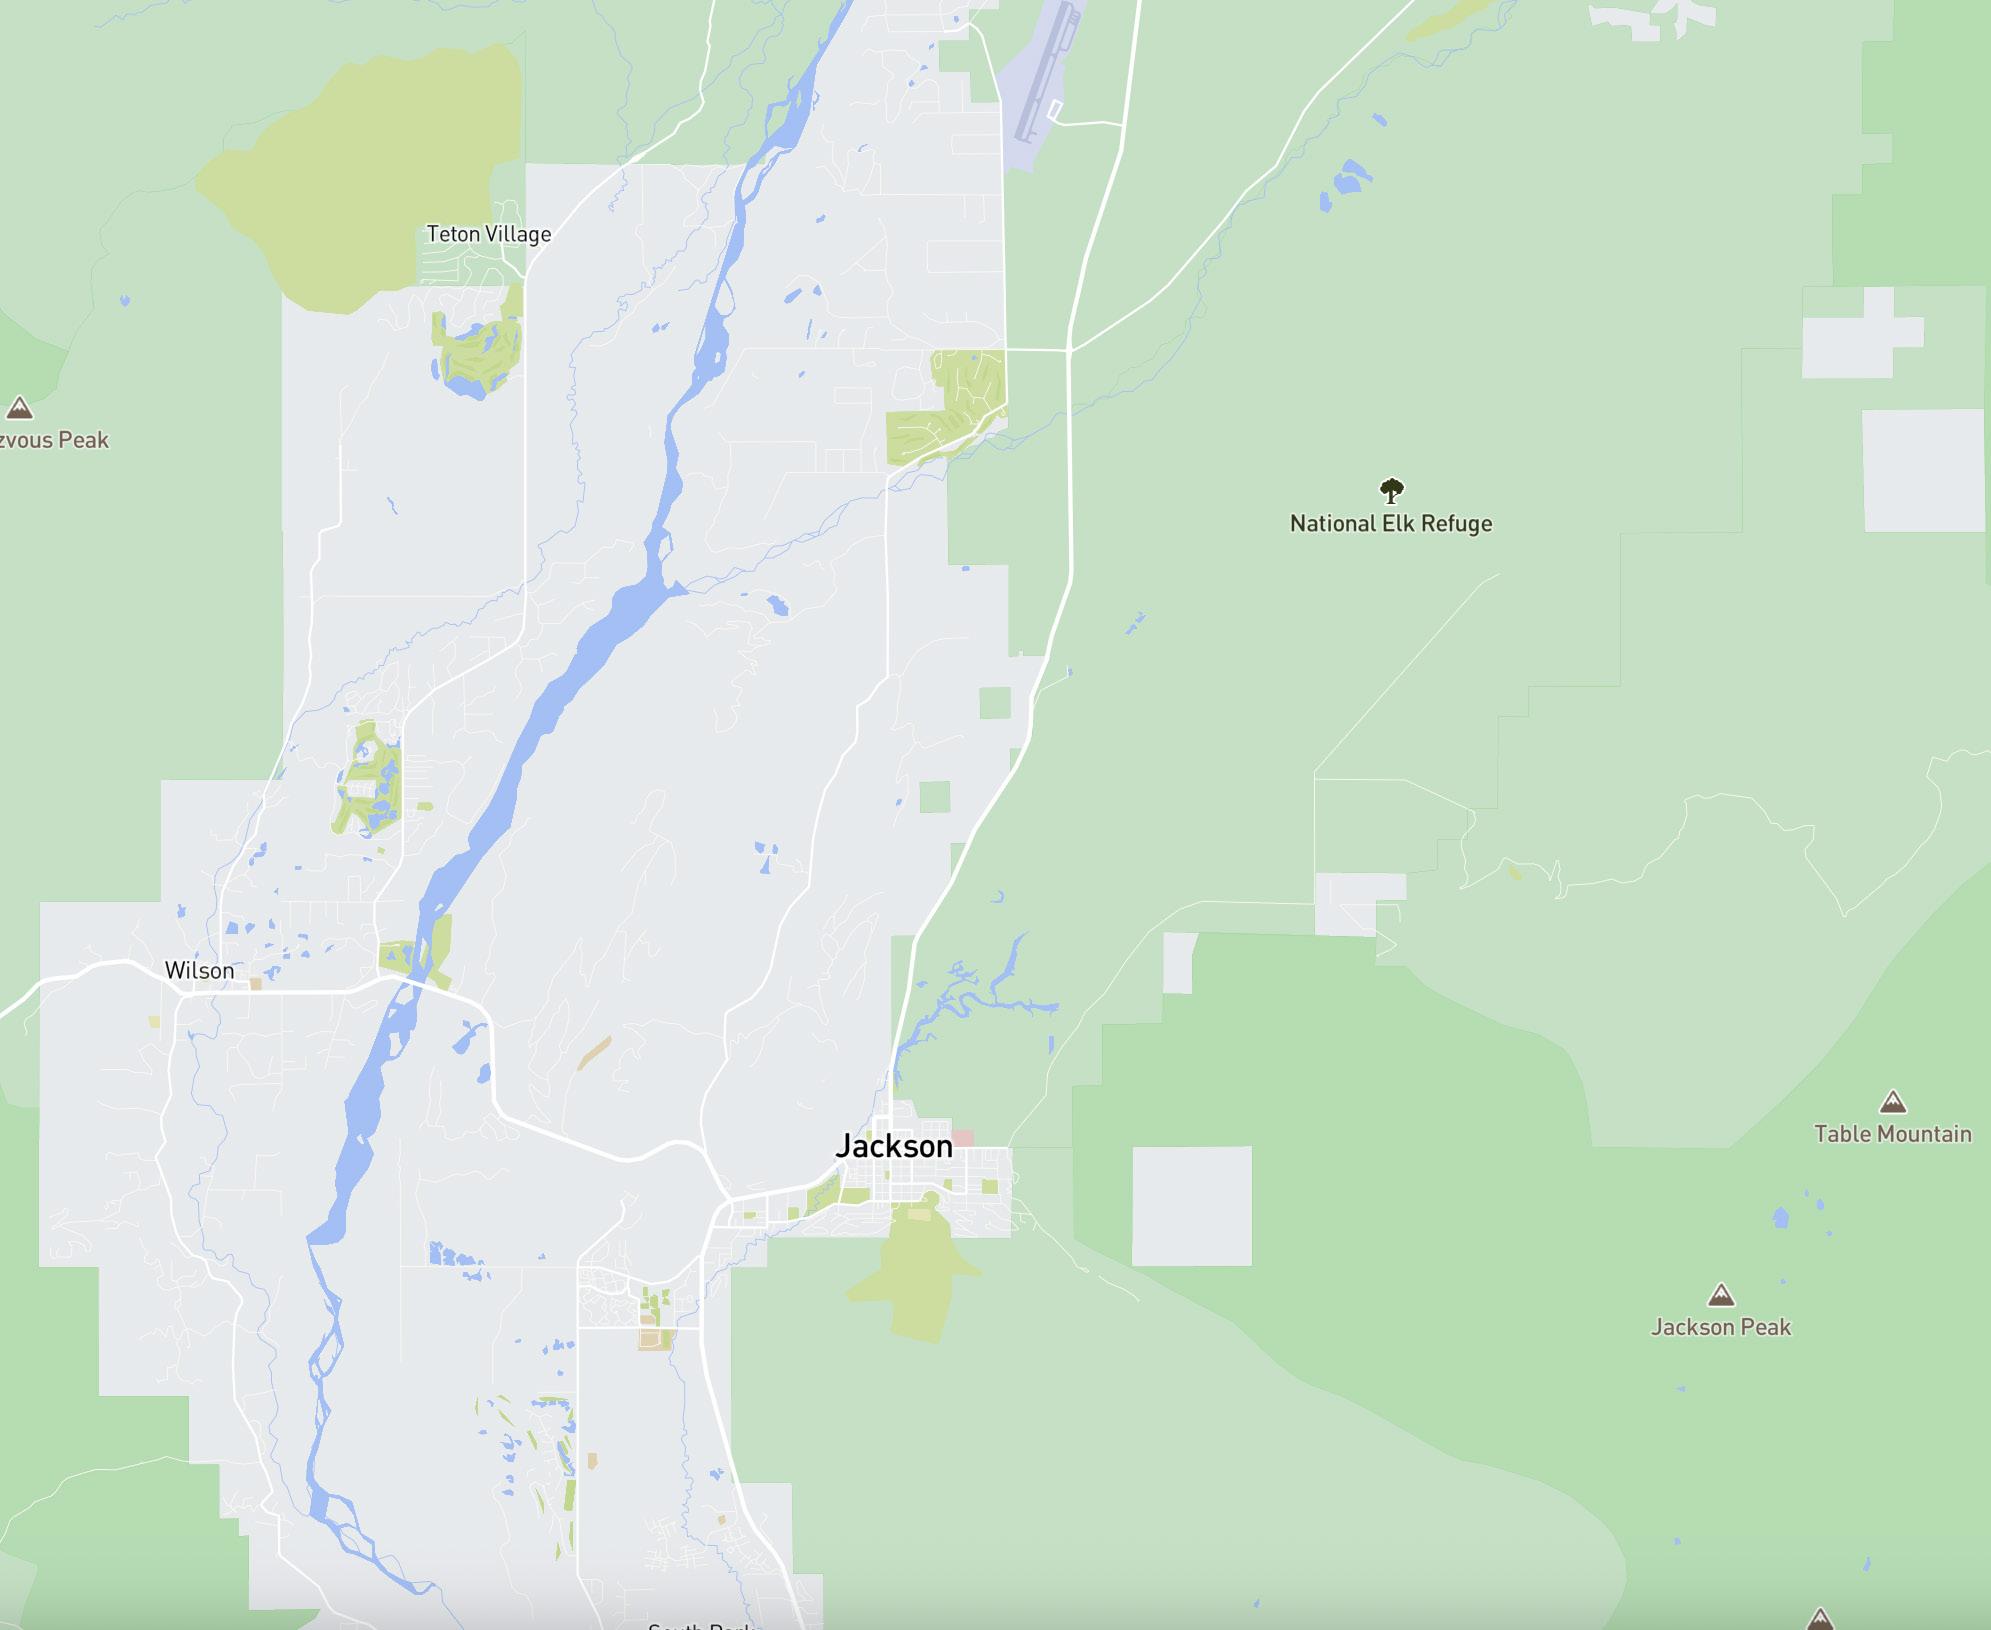
TETON VILLAGE (16) - MLS AREA 1
TETON PINES (13) - MLS AREA 2
NORTH OF WILSON (10) - MLS AREA 3
SOUTH OF WILSON (7) - MLS AREA 4
SKYLINE RANCH TO SAGEBRUSH DRIVE (11) - MLS AREA 5
EAST GROS VENTRE BUTTE (4) - MLS AREA 6
NORTH OF GROS VENTRE JUNCTION (11) - MLS AREA 7
TOWN OF JACKSON (51) - MLS AREA 8
SOUTH OF JACKSON TO SNAKE RIVER BRIDGE (24) - MLS AREA 9
SOUTH OF JACKSON TO COUNTY LINE (14) - MLS AREA 10
SINGLE FAMILY HOMES
SOLD · LISTED AT $2,495,000 · HOBACK JUNCTION REPRESENTED BY RYAN BLOCK
Single-family homes saw increased transaction activity in Q2 2026, with sales rising 24% year over year to 78 closings compared to 63 in Q2 2025. Buyer engagement remained strong across a wider range of properties, even as pricing conditions became more moderate. Despite the higher number of sales, total dollar volume declined 14%, largely due to fewer ultrahigh-value transactions compared to the previous year.
Average and median prices fell 30% and 15%, respectively, driven more by a shift in the types of homes sold than by widespread price declines. Nearly 80% of transactions still exceeded $2 million, including a notable 50% increase in sales between $2 million and $5 million, along with continued activity above $5 million. This trend highlights ongoing demand for
luxury properties while also reflecting a growing focus among buyers on value, condition, and long-term quality.
Market conditions remained balanced overall, with active inventory down 5% and pending sales holding steady, indicating that supply continued to be absorbed at a steady pace. Average days on market rose 11%, suggesting longer decision-making periods and more selective negotiations. Well-presented homes in desirable locations continued to attract strong interest, while properties needing updates or priced aggressively required more time and flexibility to sell. Overall, the quarter reflected a stable yet more value-driven market heading into the second half of the year.
CONDOS/TOWNHOMES
The Jackson Hole condo and townhome market in Q2 2026 reflected fewer transactions but a shift toward higher-value sales. Transactions declined 18% year over year to 42 sales, while total dollar volume increased 20% to $102.7 million, signaling activity became concentrated in premium properties.
The average sale price rose 46% to $2.44 million, and the median sale price increased 25% to $1.53 million. The $1M–$2M range remained the largest segment, accounting for 40% of sales, although transactions in this category declined 41%. Activity below $1 million softened, while sales above $2 million doubled from eight to 16.
Higher-end demand was the quarter’s defining trend. Sales between $2 million and $5 million increased
33%, while transactions above $5 million rose from two to eight. Cash purchases represented 57% of sales, reinforcing the segment’s appeal among wellcapitalized buyers.
Overall, Q2 2026 reflected a more selective condo and townhome market, with lower transaction volume offset by stronger pricing and increased luxury activity. The quarter’s gains were driven primarily by sales mix rather than broad-based appreciation.
SOLD · LISTED AT $3,250,000 · TOWN OF JACKSON REPRESENTED BY CHRISTY AND GARTH GILLESPIE
VACANT LAND
SOLD LISTED AT $10,380,000 WILSON REPRESENTED BY BREEZY WOODFIN
The Jackson Hole vacant land market in Q2 2026 recorded a meaningful increase in activity, supported by stronger demand across several price ranges. Total transactions increased 40% year over year to 28 sales, while total dollar volume rose 18% to $128.7 million, demonstrating continued interest in premium and development-ready parcels.
The average sale price declined 16% to $4.60 million, while the median sale price decreased 8% to $3.10 million, indicating that higher transaction volume did not produce broad price appreciation. Sales between $2 million and $5 million increased 33% to 12, while transactions above $5 million rose 43% to 10. Together, these categories represented nearly four out of five sales.
Available inventory expanded sharply, with active listings rising 414% to 72, giving buyers substantially more choice. Pending listings increased 300% to eight, suggesting stronger forward momentum, while
average days on market declined 25% to 191 days. The quarter’s highest sale reached $19 million, up 15%, while the lowest sale declined to $750,000.
Overall, Q2 2026 reflected a more active but increasingly competitive Jackson Hole land market. Demand remained strongest for well-located, buildready parcels, while expanded inventory placed greater emphasis on realistic pricing, infrastructure access, and clearly defined development potential among sellers.
LUXURY
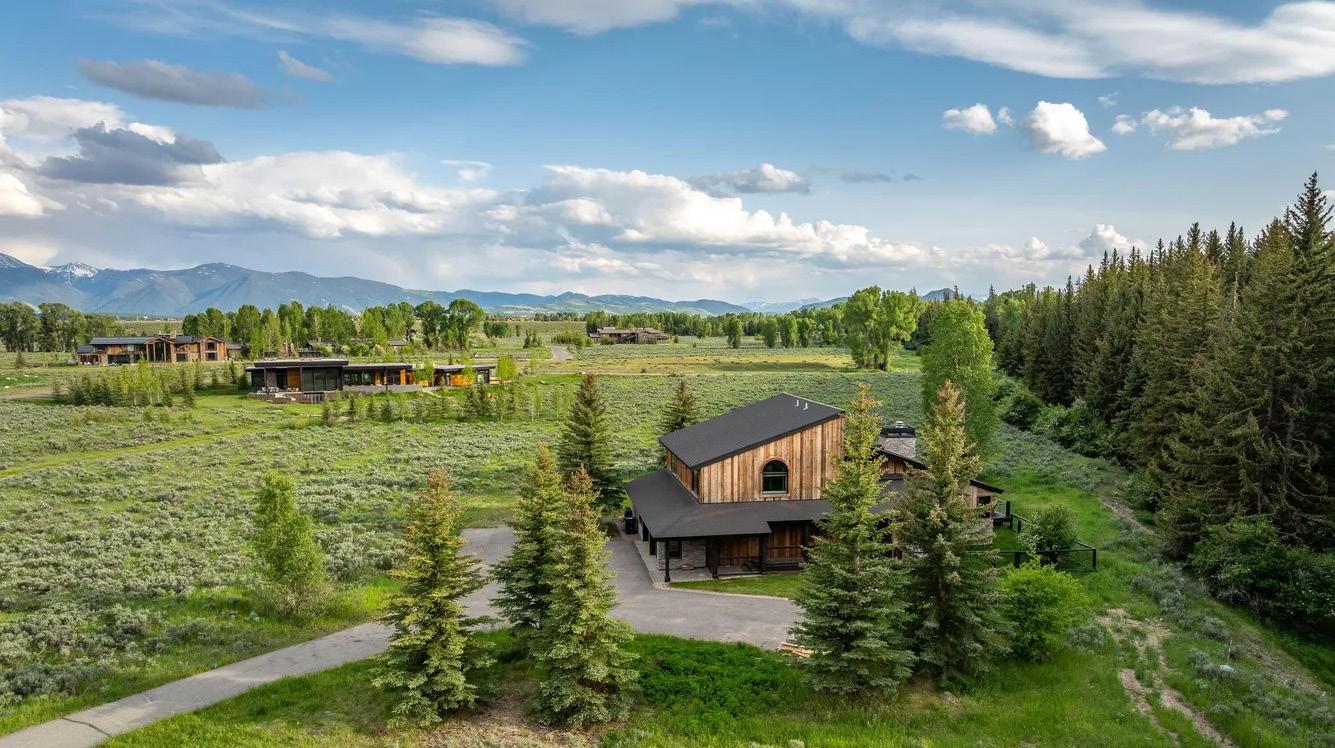
The luxury segment of the Jackson Hole market in Q2 2026 remained active, but results reflected greater value sensitivity and a shift toward lower-priced transactions. Total sales increased 4% year over year to 28, while total dollar volume declined 24% to $237.9 million, indicating buyer participation despite fewer exceptionally high-value closings.
The average sale price decreased 26% to $8.50 million, while the median fell 29% to $7.05 million. This moderation was driven by the composition of sales rather than a broad retreat from the luxury market. MLS Area 1 led the quarter with seven transactions and $66.8 million in volume, while Areas 4 and 8 also recorded sales activity. Area 5 produced the quarter’s highest closing at $19 million.
Active listings increased 13% to 107, giving luxury buyers more choice, while pending listings rose 27% to
14, signaling a stronger pipeline entering the second half of the year. Average days on market increased 9% to 173 days, reflecting a more deliberate sales environment. Cash purchases represented 68% of transactions, while conventional financing increased to 29%.
Overall, Q2 2026 reinforced Jackson Hole’s position as a premier luxury destination, while demonstrating that buyers remain selective and focused on property quality, location, pricing, and long-term value.
Estate