
Committee (FOMC) meeting, during which Fed Chair Jay Powell presented a dovish forecast, signaling three interest rate cuts in 2024 Our portfolio not only outperformed the market over the week but also secured a positive gain. For a more comprehensive analysis, refer to the Market Recap and Portfolio Review sections.
To kick things off, we'll delve into the strategy behind the Bull Diagonal Call Spread
M A R C H 2 0 2 4 | I S S U E 4 M A R K E T R E C A P E C O N O M I C D A T A P R E V I E W
Bull Diagonal Call Spread

Last week, we discussed a basic call spread option strategy.
This week, we ' re going to delve into another strategy we ' ve utilized in our portfolio: the diagonal call spread The key distinction here is that the expiration dates of the long and short call options differ Like the call spread, this strategy is based on the expectation of a market uptrend It involves initiating a long call position at a lower strike price while also entering a short call position at a higher strike price, but with the two positions having different expiration dates.
Let's illustrate this with an example from one of our trade recommendations:
We go long on a 15MAR24 525C
And go short on a 17MAY25 560C
Just like with a call spread, the purpose of the short leg is to offset the cost of the premium for the long leg By shorting an option that's closer to its expiration date, we capitalize on a higher rate of time decay (Theta) Alternatively, shorting an option with a longer duration would leverage a larger Vega but a smaller Theta. We plan to delve into these Greek terms in more depth in upcoming issues
The selection of our strike prices is determined by our proprietary time series model, which considers market movements and volatility Given that the expiration date of the short call is on March 15th, we ' ve chosen to depict the payoff diagram for this particular date. A caution: the forthcoming explanation may be somewhat complex It's tailored for subscribers who desire to closely examine the exact calculations
It's fundamentally important to have an approximate understanding of the diagonal call spread's payoff dynamics. Essentially, this approach is about combining the effects of both the long and short positions
P A G E 0 2
With the cautions addressed, let's begin by checkout out the following payoff diagram:
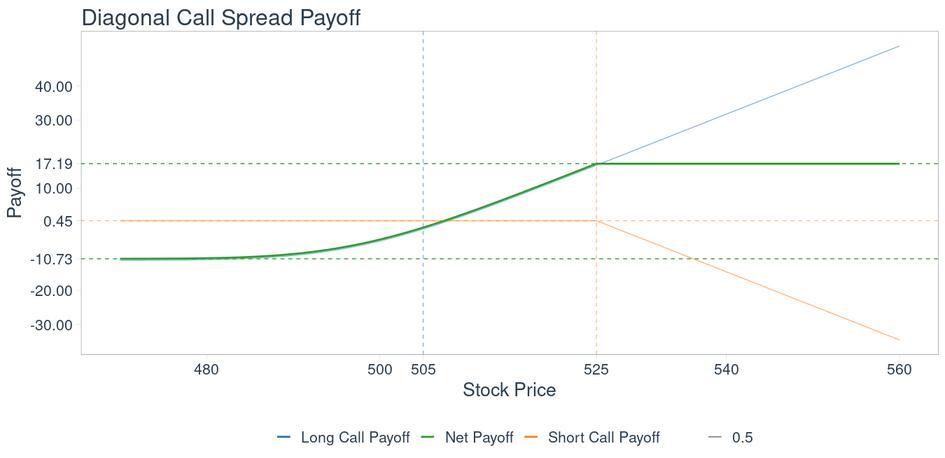
1The payoff diagram illustrates that, upon initiating the trade on February 27th and at the expiration of the short "SPY 15MAR24 525 C" contract on March 15th, assuming a certain implied volatility (IV) for the long option on that date, the maximum loss for this spread is $1,114 (calculated as -$11 14 x 100), and the maximum gain is $1,719 (calculated as $17 19 x 100)
We will now detail the process of calculating these figures.
P A G E 0 3
To begin, let's revisit the initial premiums paid, as documented in the trade statement at the start:
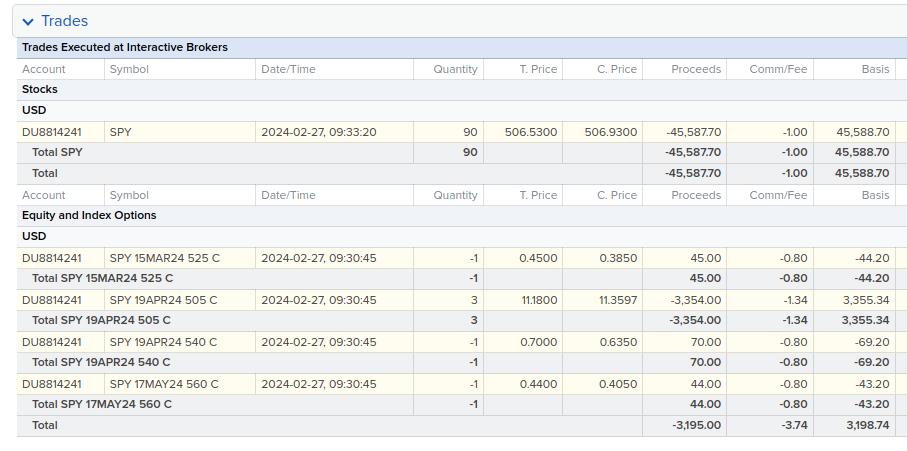
Analyzing the cost of the premiums for the "SPY 19APR24 505 C", priced at $11 18, and the "SPY 15MAR24 525 C", quoted at -$0 45, and considering the standard 100 multiplier for SPY options, we arrive at a net premium outlay of $1,135.
1) This is calculated by subtracting $45 (-$0 45 x 100) from $1,180 ($11 18 x 100)
2) Therefore, the maximum loss is $1,180 - $45 = $1,073, equivalent to the initial net premium paid
3) Given that the long call has not expired, the value of the long call at the short call's expiration will vary based on market conditions at the time
4) By examining the closing price of the long option on the short call expiration date, we can back calculate the IV.
5) With the IV, we can then calculate the payoff diagram for the long call by calculating the value for the different strike prices
P A G E 0 4
2
Next, we examine the trade statement on the 15th March to check "SPY 19APR24 505 C" closing price:
The "SPY 15MAR24 525 C" contract will expire out-of-the-money (OTM), whereas the "SPY 19APR24 505 C" contract has a closing price of $12 62, reflecting an implied volatility (IV) of 16%
Applying this IV in the Black-Scholes model for a strike price of 525 yields a value of $27 92
Subtracting the initial net premium of $11.18 - $0.45 = $11.63 gives us a final value of $27.92 - $11.63 = $16.29.
P A G E 0 5
3
We can also graph the payoff for another diagonal spread in our portfolio, which includes a short position in "SPY 17MAY24 560 C" and a long position in "SPY 19APR24 505 C" In this scenario, the call with the later expiration date is the short position
As of the 15th of March, neither leg of the spread has reached its expiration. By deducing the implied volatility (IV) from the option prices noted in the trade statements from March 15th, we present the following payoff diagram:
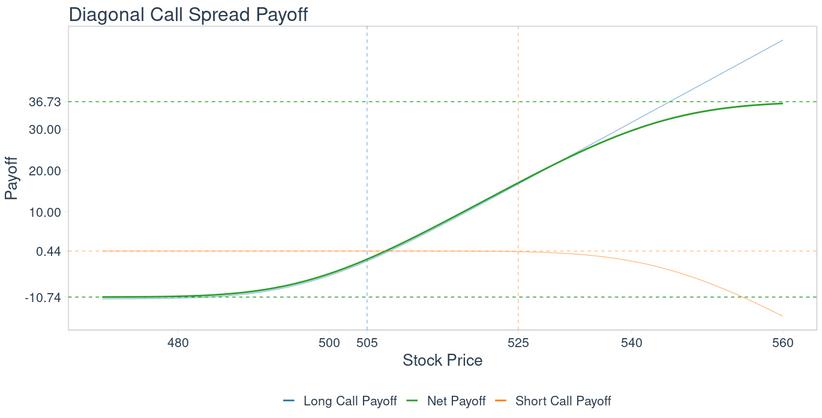
The maximum loss can be calculated from the premium paid for the long call minus the premium received for the short call, $11 18 - $0 44 = $10 74
For the maximum payoff at SPY 560, the value is derived using the Black-Scholes formula, as implied by the IV from the option's market price, since the options have not yet expired
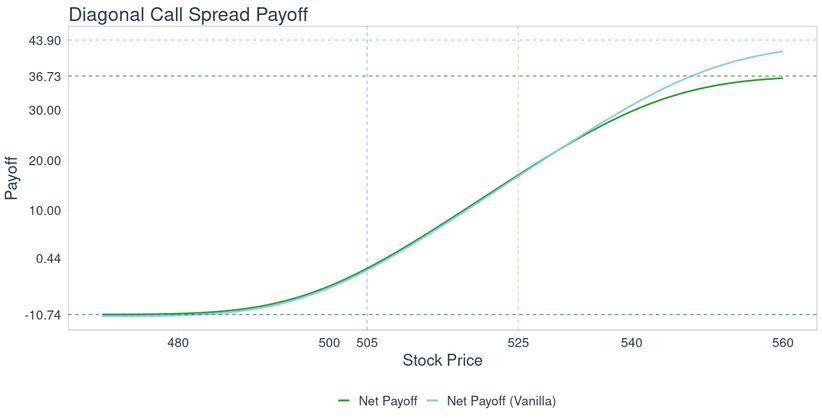
Additionally, we observe that the payoff curve resembles that of a vanilla call spread prior to expiration. Let's compare this by overlaying a normal vanilla call spread, where the short option expires on 19th April, just like the long option, against the diagonal call spread, where the short option expires on 17th May:
P A G E 0 6
For the vanilla call spread, we can calculate the maximum profit using a simple formula since both legs share the same expiration date:
560 – 505 – $11 18 - $0 079 = $43 90
Here, $0 079 represents the premium received from the 560 call option
By moving the maturity date closer, the premium for the same strike price is lower than that of the May 17th call, which was $0.45.
P A G E 0 7
Trade Notifications

No trade notifications this week.
P A G E 0 8
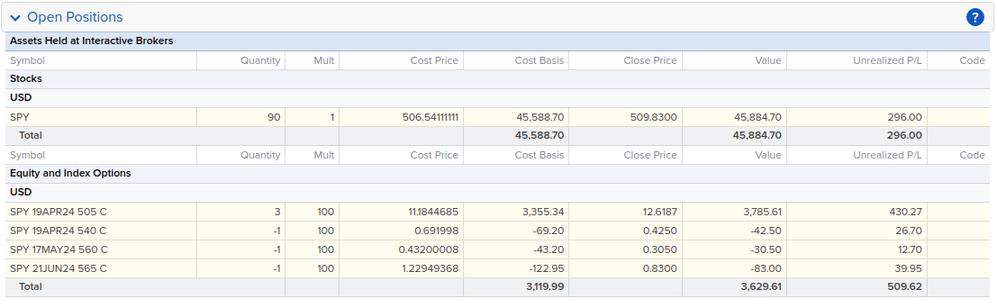
Portfolio Review

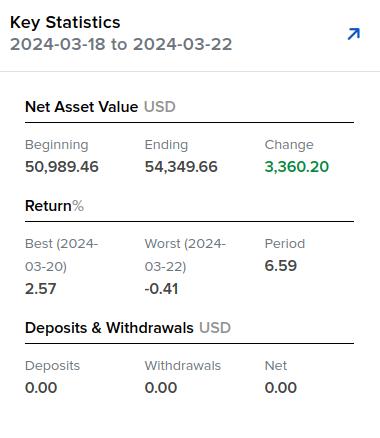
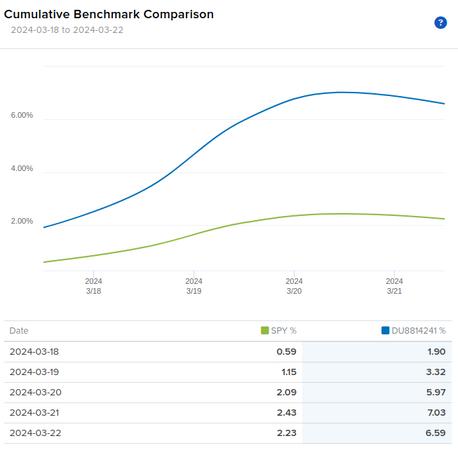
After experiencing losses for two consecutive weeks, both our portfolio and the market have seen significant profits this week. Our portfolio generated a profit of $3,360 for the week, achieving a 6.59% return compared to the SPY's 2.23% return in the same period.
While this is positive news, we should remain cautious about the large spread between the portfolio's performance and the market's due to the additional risk involved
In this instance, however, the risk is deemed acceptable.
P A G E 0 9
The strong performance of our portfolio can be attributed to the Federal Reserve's dovish stance revealed during the FOMC meeting on Wednesday.
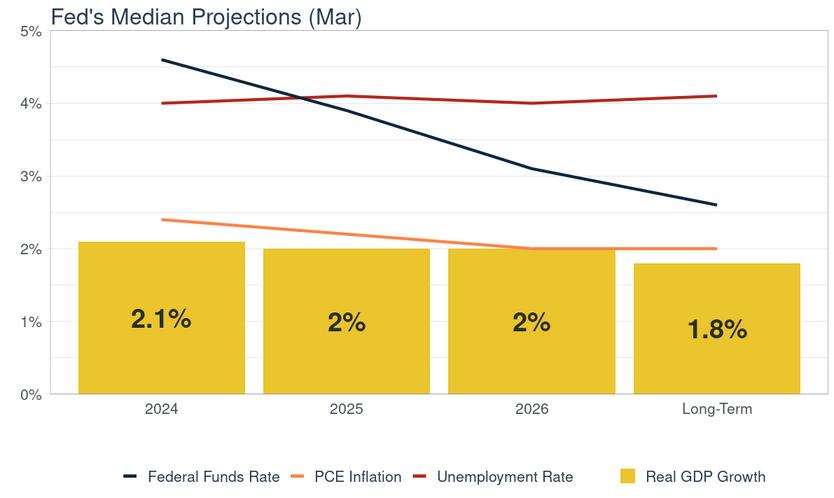
Despite receiving a hot CPI and PPI reports for January and February, the FOMC committee members still proposed three rate cuts this year in their Summary of Economic Projections (SEP), a move considered dovish
Furthermore, the FOMC anticipates the federal funds rate to gradually decrease to around 3.1% by 2026, suggesting that this year may mark the beginning of a multiyear cycle of rate reductions.
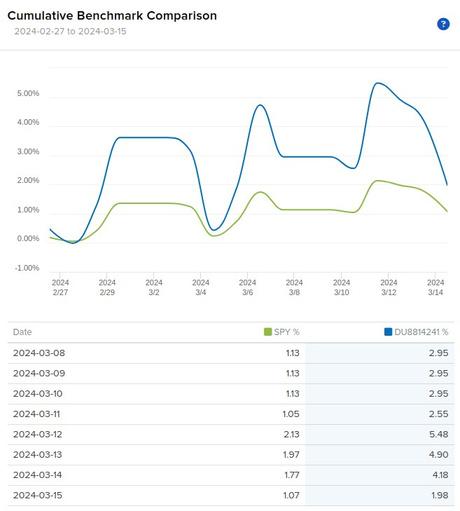
Since the inception of our portfolio, it has garnered an 8 70% return compared to the market's 3 33%, achieving a 5 37% outperformance
We will keep a close eye on the portfolio's risk levels and make necessary adjustments to our strategies, especially as the April 19th expiration date approaches.
Since Inception:

Current Week:
P A G E 1 0

Market Recap
On Monday, the stock market saw a positive close, with the Nasdaq leading gains across major indices, driven by investor enthusiasm in technology and artificial intelligence (AI) sectors.
There are rumors about Apple discussing a collaboration with Google’s Gemini platform to integrate an AI engine into the iPhone Additionally, NVIDIA began its annual GTC conference for AI developers on Monday evening
P A G E 1 1
Image Credit: Reuters/Apple
On Tuesday, the markets recovered from early losses, with the S&P 500 achieving a gain of 0 6% for the day Meanwhile, Treasury yields saw a decrease, with the 10year yield dropping to approximately 4.3% and the 2year yield ending at around 4.7%. The day also brought positive news from the U S housing market, as February saw both housing starts and building permits surpass expected figures Housing starts reached a seasonally adjusted annual rate of 1 52 million, up nearly 11% from January's 1 37 million and about 6% higher than the 1 44 million reported in February last year. Building permits, an early indicator of future construction, also reached a seasonally adjusted annual rate of 1.52 million in February, marking a 2 4% increase from the previous year Despite the challenges posed by rising interest rates, the construction sector has shown resilience, partly because of the shortage of available existing homes for sale. With many homeowners having secured lower mortgage rates before 2022, the current average mortgage rates just below 7% have made homeowners wary of selling homes financed at lower rates
For the first time in 17 years, the Bank of Japan (BoJ) increased its interest rates, moving away from the globe's sole negative interest-rate policy. The central bank lifted its policy rates to a range between 0% and 0 1%, up from -0 1%, a rate it has maintained since 2016 This decision was influenced by significant wage increases reported by some of Japan's biggest labor unions, boosting the confidence of policymakers in achieving and sustaining a 2% inflation rate
The S&P 500 reached a new record high on Wednesday, with the U S stock market showing a growth of over 9% for the year There was a slight reduction in interest rates, as the 10-year Treasury yield fell below 4 3% This follows a period of rising rates due to unexpectedly high inflation figures, which had reshaped market predictions regarding the Federal Reserve's interest rate cuts for the year.
The bond market's response suggests a sense of relief among investors, interpreting that the Federal Reserve's policy may not become more restrictive moving forward The primary focus, instead, centered on the latest Summary of Economic Projections (SEP) from the committee members.
The SEP showed an upgrade to the Fed's expectations for economic growth while also maintaining the projection for 0 75% worth of total rate cuts in 2024 Federal Reserve members also project that the real GDP will grow by 2% in both 2025 and 2026, with their long-term growth forecast remaining at 1.8%. They anticipate inflation to rise more this year than previously estimated, a shift attributed to inflation rates coming in hotter than expected in recent months The forecast for core personal consumption expenditures, which omits the fluctuating costs of food and energy, is to finish the year at 2 6%, an increase from the 2 4% prediction made in December.
The overall inflation prediction for the year ' s end, as indicated by the PCE index, remains at 2 4%, consistent with December's forecast The outlook for the unemployment rate over the next year has been marginally reduced to 4% from 4 1% In February, the unemployment rate was reported at 3 9% The forecast for the long-term unemployment rate continues to be 4.1%, unchanged since December.
Regarding the Fed's balance sheet, Powell noted that the Fed is contemplating a slowdown in its tapering efforts, contributing to a more dovish tone in the Fed's communication this week
P A G E 1 2
P A G E 1 3
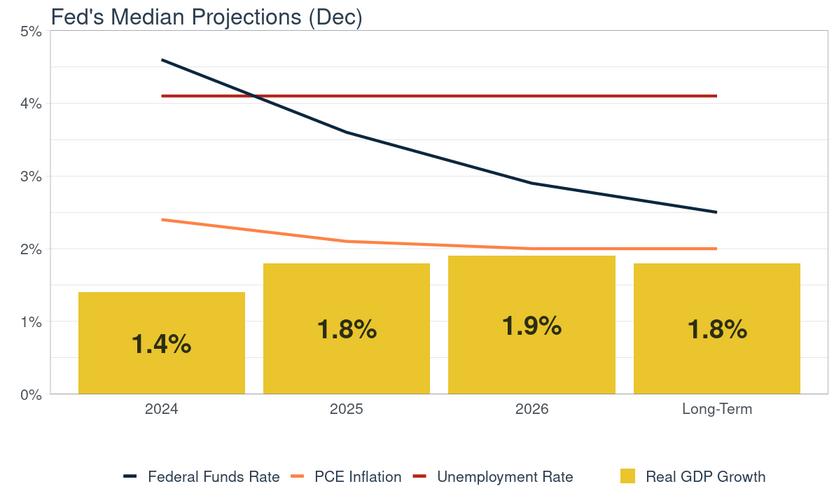
Below is the summary chart for March and previous FOMC December projections:
The dot plot in the Summary of Economic Projections (SEP) is a visual representation used by the Federal Reserve to convey its officials' expectations for the federal funds rate over the medium term Each dot represents an individual member's view on the appropriate target range or midpoint for the federal funds rate at the end of each calendar year covered by the SEP and in the longer run The plot includes projections for the current year and the next few years, as well as for the longer term:

Stock markets ended higher on Thursday, continuing the momentum from Wednesday's surge following the announcement of the U.S. Federal Reserve's interest rate decision and Fed Chair Jerome Powell's press briefing Small-cap and mid-cap stocks surpassed the performance of both the Nasdaq and the wider S&P 500
This week, cyclical sectors such as industrials and financials also exceeded expectations, suggesting a diversification in market leadership Following the Fed's hint that the cycle of rate cuts might still commence in 2024, Treasury yields decreased, with the 10-year Treasury yield dropping to about 4 27% after beginning the week higher than 4 3%
On Friday, the stock market paused its recent rally, with the Dow and the Russell 2000 experiencing declines. Meanwhile, the Nasdaq achieved its fifth straight day of gains, buoyed by large technology companies
Despite the day's mixed performance, the market concluded the week with significant overall gains, fueled by recent dovish moves from central banks Additionally, government bond yields decreased, while the dollar reached a one-month peak against major global currencies
P A G E 1 4
Economic Data Preview
Following the recent FOMC meeting, attention is shifting towards the forthcoming GDP and PCE report due next week. These reports are set to be unveiled on Good Friday, a day when the market will be closed.
Expectations are set for a 3 2% growth in GDP, with forecasts predicting a monthover-month increase of 0.3% for core PCE and 0.4% for PCE, respectively.
P A G E 1 5
Image credit: Getty Images


P A G E 1 6
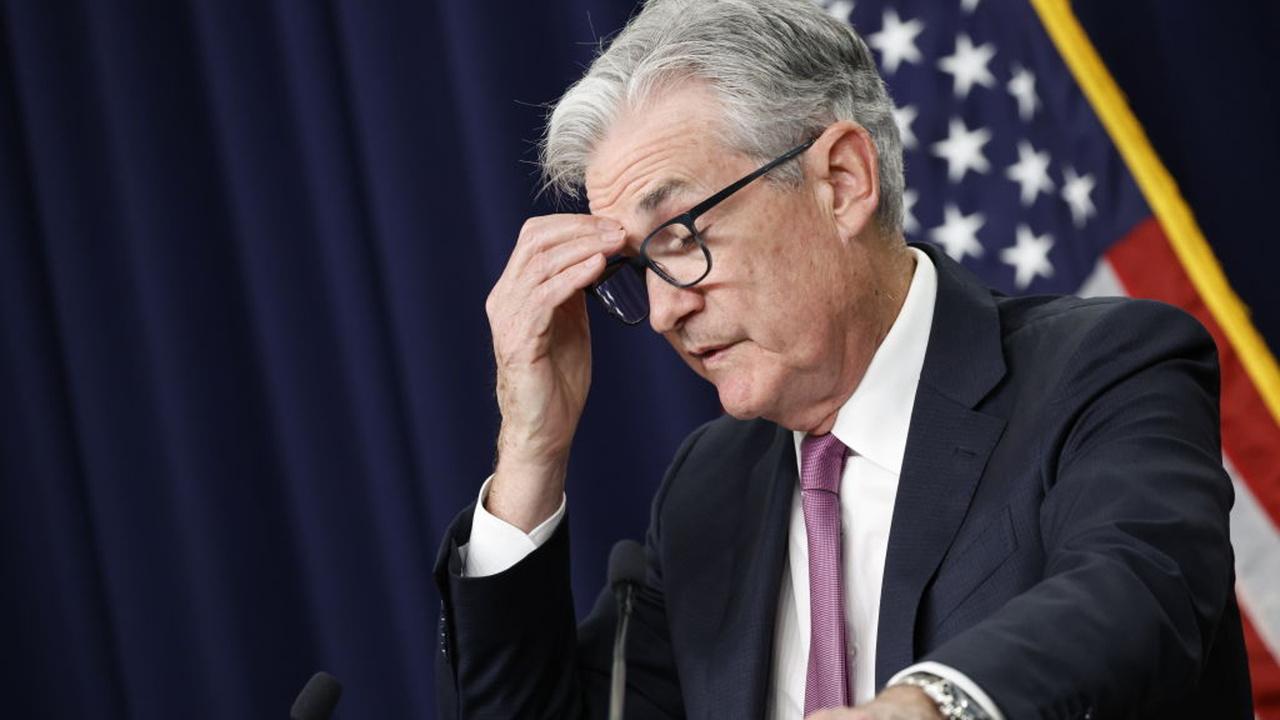
Federal Open Markets Committee Meeting. Source: Federal Reserve.
Image credit: Getty Images
Key Takeaways:
Monday's Market Optimism: The stock market closed on a positive note, led by the Nasdaq, thanks to strong interest in technology and AI. Rumors surfaced about a potential Apple and Google's Gemini platform partnership for an AI engine in the iPhone
Tuesday's Recovery and Housing Market Strength: The market bounced back from early losses, with the S&P 500 up by 0.6%. Decreased Treasury yields and strong February data for housing starts and building permits showcased the construction sector's resilience.
Bank of Japan's Interest Rate Hike: For the first time in 17 years, Japan increased interest rates, moving away from negative rates The hike aims to support a 2% inflation target, prompted by significant wage increases
Wednesday's Record High and Interest Rate Impact: The S&P 500 reached a record high; U.S. stocks up over 9% for the year. A slight decrease in interest rates followed unexpected inflation data, hinting at less restrictive Federal Reserve policies ahead
Federal Reserve's Economic Outlook: Updated economic projections show higher growth and inflation expectations, with a reduced unemployment forecast Plans to slow balance sheet tapering add a dovish tone to Federal communications.
Thursday's Market Leadership Expansion:
Continued market growth, with small and mid-cap stocks leading. Industrials and financials sectors performed well, and Treasury yields dropped, hinting at potential rate cuts in 2024
Friday's Slight Pause in Momentum: Minor declines in the Dow and Russell 2000, but the Nasdaq extended its gain streak to five days, driven by tech giants.
Week's Conclusion: The stock market achieved notable gains, fueled by dovish central bank policies, falling government bond yields, and the dollar's rise to a onemonth high.
Next week, we'll delve into the world of option Greeks, which each highlight various dimensions of risk or patterns in the movement of an option's price. We'll demonstrate how to aggregate these risk elements, interpreting their meanings and how they evolve with the market. This exploration will enable us to predict the impact of shifts in the underlying SPY on our portfolio Remember, options exhibit non-linear behavior, meaning the adjustments in our portfolio won't follow a straight line. Keep an eye out for more!
Best regards, JasonInvesting.com
P A G E 1 7
Team

Investment Newsletter Disclaimer This newsletter provides trade recommendations based on our analysis and is intended for informational purposes only It is important to understand that investing in financial markets involves risks, and there is always the possibility of losing money The content of this newsletter does not constitute financial advice, and it should not be taken as such We do not guarantee the accuracy, completeness, or timeliness of the information provided, nor do we guarantee any results from using this information Subscribers are responsible for their own investment decisions We strongly recommend conducting your own research and due diligence before making any investment based on our recommendations Consider seeking advice from a qualified financial advisor who understands your financial situation and investment objectives The publisher of this newsletter, including its writers and staff, will not be liable for any losses or damages arising from the use of the information contained herein By subscribing to and using this newsletter, you acknowledge and agree that you bear responsibility for your own investment research and decisions and that you will not hold the newsletter liable for any decisions or outcomes resulting from the use of information provided Investing in financial markets is speculative and not suitable for all investors Please be aware of the risks and be prepared to accept them in order to trade or invest in these markets @JasonInvesting wwwJasonInvestingcom Hello@JasonInvestingcom