Research On The Private Benefits of Personal Motorised Transport and Mobility
RESEARCH ON THE PRIVATE BENEFITS OF PERSONAL MOTORISED TRANSPORT AND MOBILITY FINAL REPORT
/ MARS 2026 /
Date: 2 March 2026
Authors: Inge Mayeres, Bruno Van Zeebroeck
This report reflects the conclusions of the authors and does not represent an official position of the FIA.
Transport & Mobility Leuven
Diestsesteenweg 71
3010 Leuven
Belgium
http://www.tmleuven.be
2.1
2.2
2.2.1
2.2.2
2.2.5
2.2.6
LIST OF FIGURES
Figure 2.1 Different private transport benefits improving quality of life 11
Figure 2.2 Conceptual relationship between transport access, life opportunities and subjective wellbeing 12
Figure 2.3 Share of people that have access to different services and jobs within 15 minutes by public transport (above) or car (below), in rural areas (green) and urban areas (blue) 15
Figure 2.4 Spatiotemporal variation of travel time ratio (R) over the course of an average weekday 17
Figure 2.5 Accessibility of jobs by car (left) and public transport or bicycle (right) 19
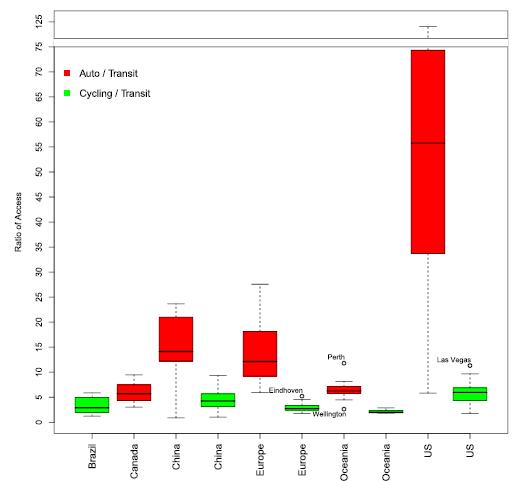
Figure 2.6 Ratio of automobile to public transport access (red), cycling to public transport access (green) 21
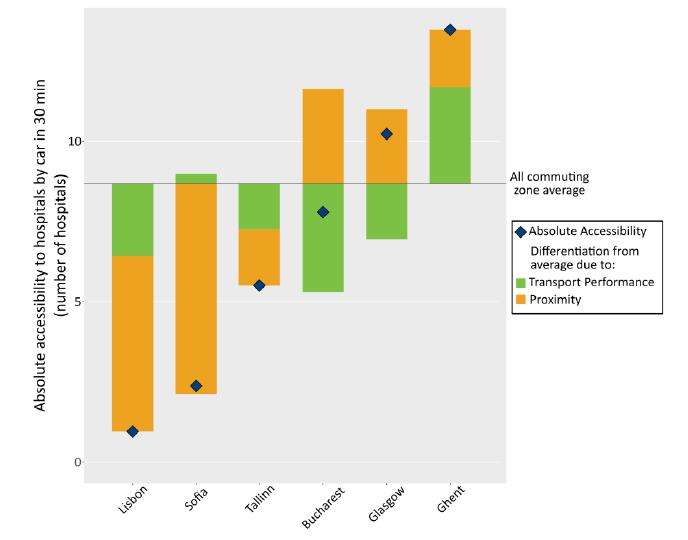
Figure 2.7 The absolute accessibility of hospitals by car in 30 min in 6 European cities decomposed in transport performance and proximity 24
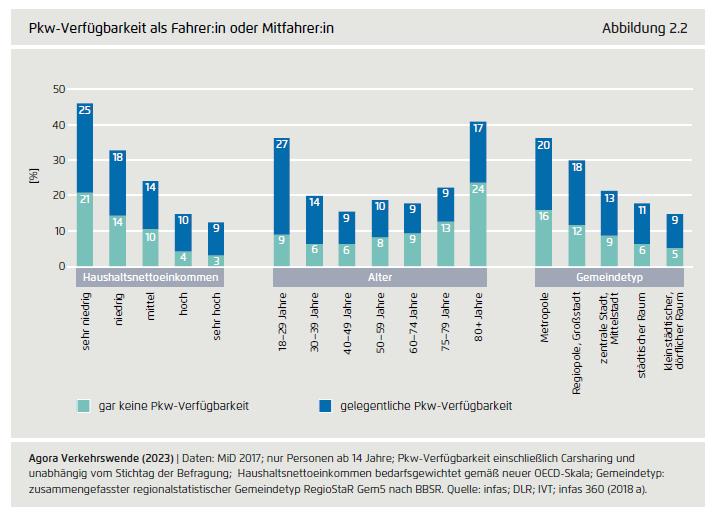
Figure 2.8 Car availability among Germans depending on household income, age and area of living 26
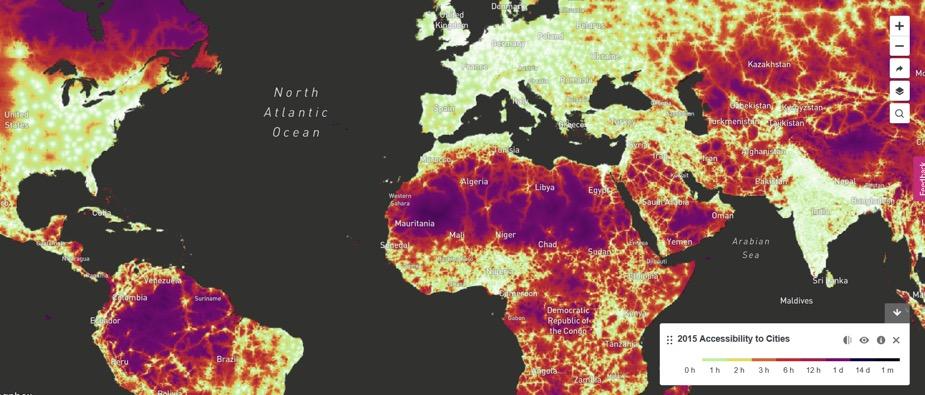
Figure 2.9 Global map of travel time to cities for 2015 (spatial resolution 1*1km –travel time to city with shortest journey) 28
Figure 2.10: R AI, rural accessibility index by country 2022-2023, share of population living within 2 km of a road 28
Figure 2.11 Correlation between distance -nearest road (to electric grid) and probability of working – share of low skilled workers. 30
Figure 3.1 M easuring the benefits of car travel 32
Figure 3.2 Consumer surplus from passenger transport in the UK, per mode of travel –1830-2010, as % of GDP 33
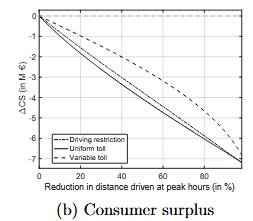
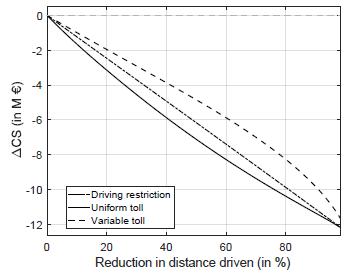
Figure 3.3 Loss in consumer surplus associated with reductions in distance driven at peak hours (left) and all day (right) – Paris metropolitan area, 3 types of policies 34
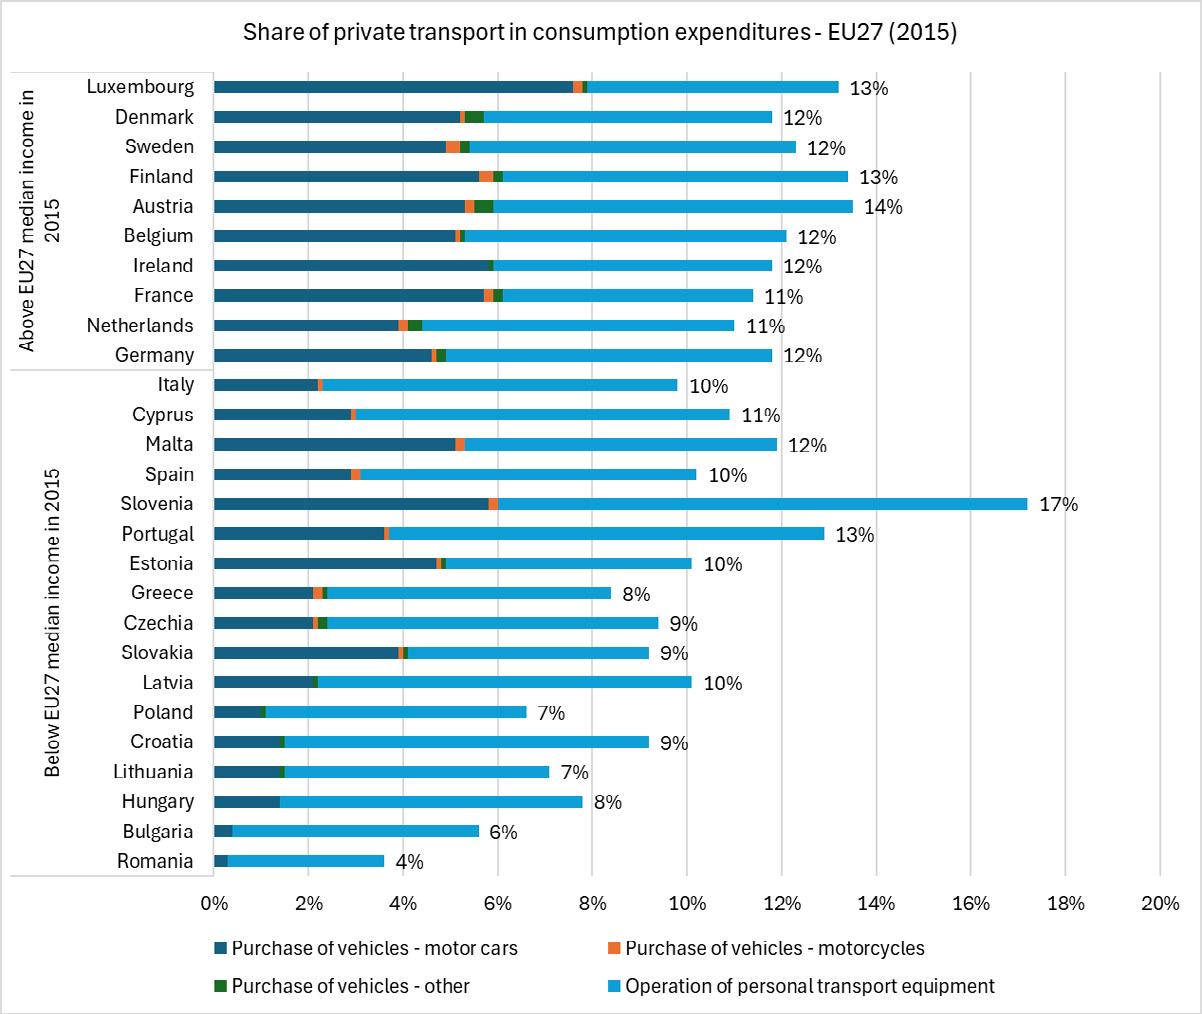
Figure 3.4 Share of private transport in consumption expenditures in EU27 Member States in 2015 36
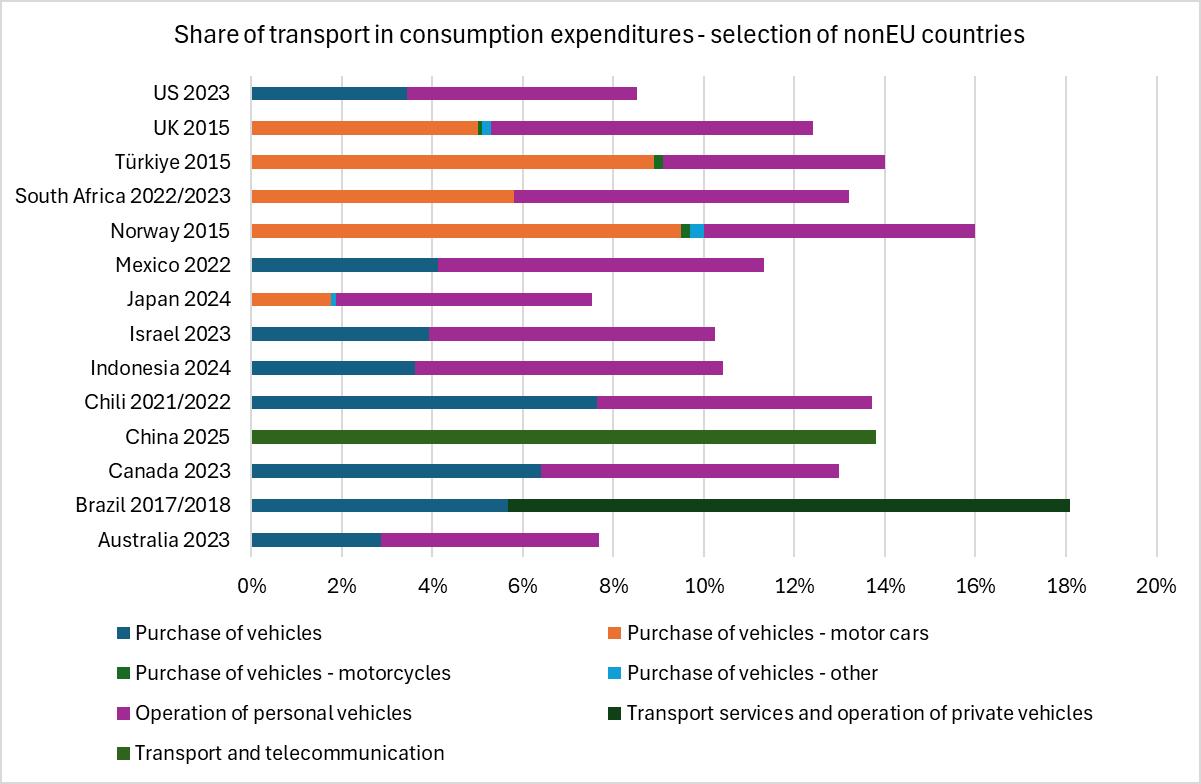
Figure 3.5 Share of transport in consumption expenditures – selection of nonEU countries (with indication of year) 37
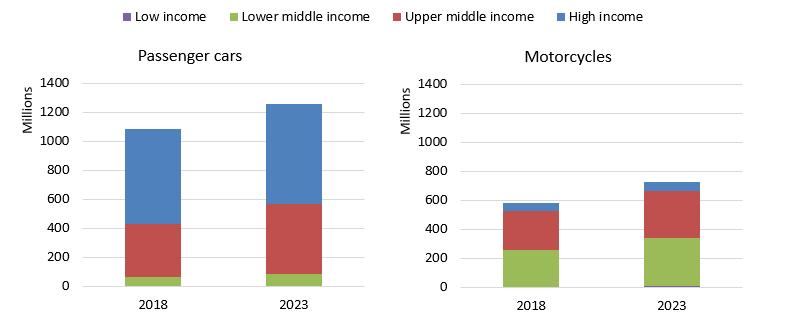
Figure 3.6 Number of passenger cars and motorcycles in use by income level –2018-2023 38
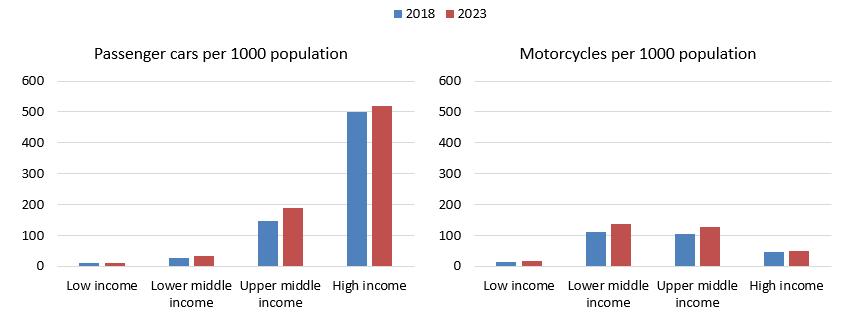
Figure 3.7 Passenger cars and motorcycles per 1000 population, by income level –2018-2023 39
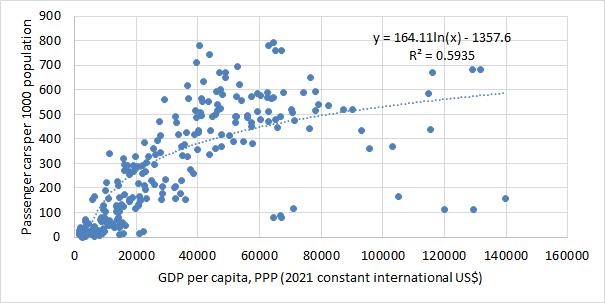
Figure 3.8 Number of passenger cars per 1000 population versus GDP per capita 40
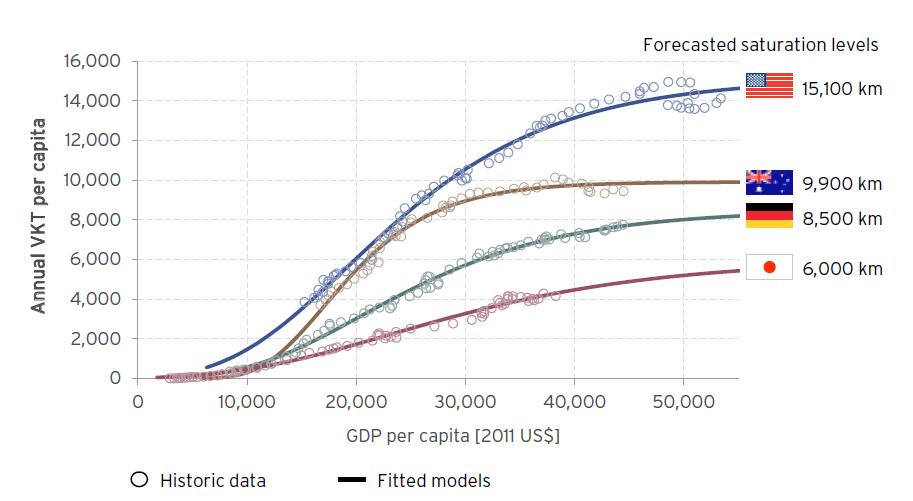
Figure 3.9 Vehicle kilometres travelled versus GDP per capita PPP – Australia, Germany, Japan, US – analysis by Seum et al. (2019) 41
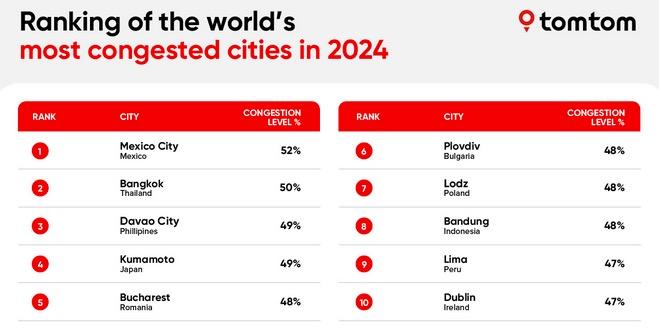
Figure 4.1 Ranking of the world’s most congested cities in 2024 according to TomTom 43
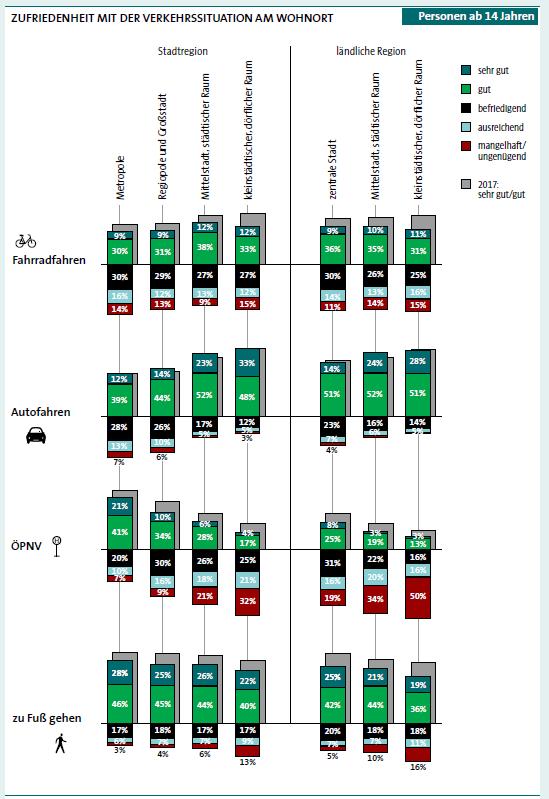
Figure A 1 Satisfaction with different traffic situations depending on geographical area in Germany 50
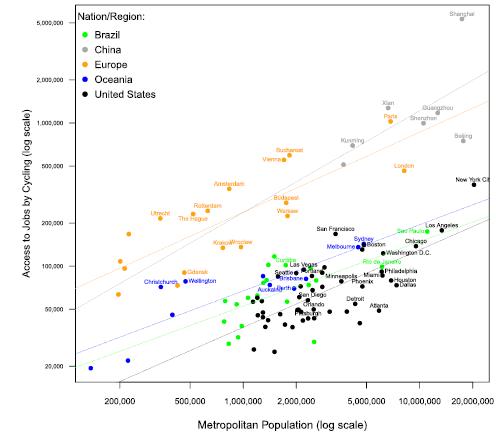
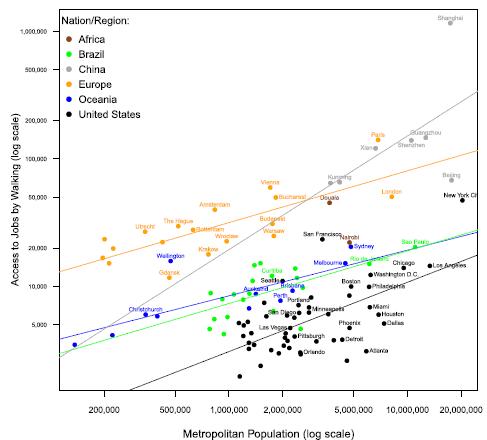
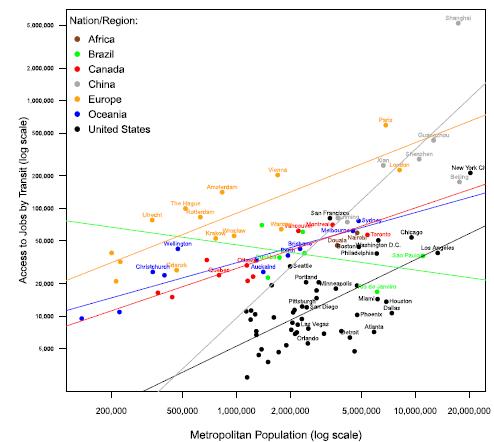
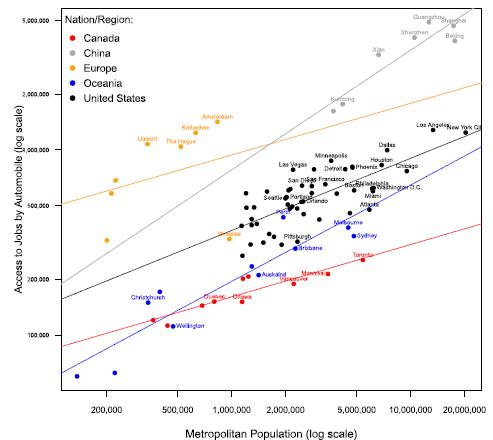
Figure A 2 Access to jobs by different modes 51
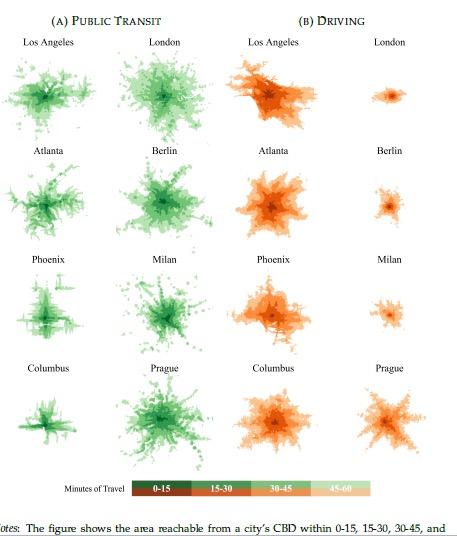
Figure A 3 Areas reachable within 0-15, 15-30 and 30-45 minutes by public transport or car in a selection of European and American cities
53
LIST OF TABLES
Table 2-1 Comparison of user attributes of motorised private and public transport 13
Table 2-2 Share of population that has access to a doctor or a supermarket within 15 min (the Netherlands) and within x min (Germany) in urban and rural areas for the Netherlands and Urban and very rural areas with bad economic conditions in Germany 16
Table 2-3 Accessibility indicator averages for 82 European cities with public transport data available (people one can reach on average within x minutes) 16
Table 2-4 The average number of available jobs within 15, 30, 45 and 60 min in the Netherlands by car, public transport and bicycle 20
Table 2-5 The average number of jobs accessible in 4 metropolitan areas in Europe and the US by different modes 22
Table 3-1 Change in the number of passenger cars and motorcycles by income level, 2018-2023 38
Table 3-2 Passenger cars and motorcycles per 1000 population, by income level – 2023, and % increase compared to 2018 39
LIST OF ACRONYMS AND ABBREVIATIONS
EU27 EU 27 Member States as from 2020
GDP Gross domestic product
PPS Purchasing power standard
PPP Purchasing power parity
VTTS Value of travel time savings
EXECUTIVE SUMMARY
FIA wishes to get a better understanding of the private benefits of mobility and personal transport. For this purpose, this study summarises findings from the existing literature on the private benefits of personal transport, with a focus on personal transport by private car and motorcycle. Given the scope of the study, the other societal costs and benefits, while highly relevant, are only briefly touched upon. In the literature search, the geographical scope was wide. However, with a limited availability of studies and data for emerging economies, many insights in this report are drawn from studies for high income countries.
In a first part the study provides facts on the attributes and benefits of private motorised transport. In a second part it explores further indicators that reveal the high preference for private motorised transport. In a last part, it looks into the future.
FACTS ON THE ATTRIBUTES AND BENEFITS OF PRIVATE MOTORISED TRANSPORT
Private transport benefits can be divided in use and non-use value. The provision of access to services and jobs provides the use value allowing full participation in society. The provision of autonomy, flexibility, expression of status and emotions provides the non-use value.
Private transport benefits associated with the use value can be provided by private transport and public transport. Within the current transport system, the attributes of private motorised transport, car and motorcycle, make it, generally, more attractive than public transport. The most attractive attributes of private motorised transport are comfort, convenience (no waiting times) and safety (low risk of in-vehicle aggression).
The qualitative and subjective superiority of private motorised modes is confirmed by objective accessibility figures for jobs and services on all continents.
• Doctors and food stores are reached within 15 min by car by 90% to 100% of the population in the Netherlands and England, but only by 40% and 75% by public transport in their respective rural areas 1
• 7.6 times more people can be reached by car than by public transport within 30 minutes on average for 82 European cities 2
• On average 50 times more jobs are accessible by car than by public transport in US metropolitan areas. The ratio is 15 in China, 10 in Europe, 5 in Canada and Australia 3
• The advantage in accessibility of car and motorcycle is largest in rural areas and smallest or non-existent in urban areas with a well-developed public transport network.
The literature observes nevertheless an accessibility paradox. While private motorised transport provides the best individual accessibility, best overall accessibility is provided in cities with dense land use, good public transport and room for active modes; in other words a balanced approach to transport modes. Better overall accessibility means also larger economic benefits. The explanation of the paradox is that a car-oriented development induces urban sprawl reducing proximity and lowering overall accessibility.
The importance of car access in the current transport system is furthermore made clear from the reduction in quality of life of people without (full) car access, especially in rural areas.
1.Bastiaanssen & Breedijk (2022); UK Department for Environment Food & Rural Affairs (2022)
2.International Transport Forum (2019)
3.Wu et al. (2021)
• In the Global North, between 15% and 40% of the population in high-income countries does not fully benefit from car access 4, which is correlated with lower mobility, fewer opportunities and reduced quality of life, especially in rural areas. Improved access to mobility and services will improve quality of life of these people. In the Global South, these shares are higher.
• In lower-income countries, improved transport infrastructure and access to private motorised transport are strongly linked to better job matching, productivity and economic development.
STRONG REVEALED PREFERENCE FOR PRIVATE MOTORISED TRANSPORT
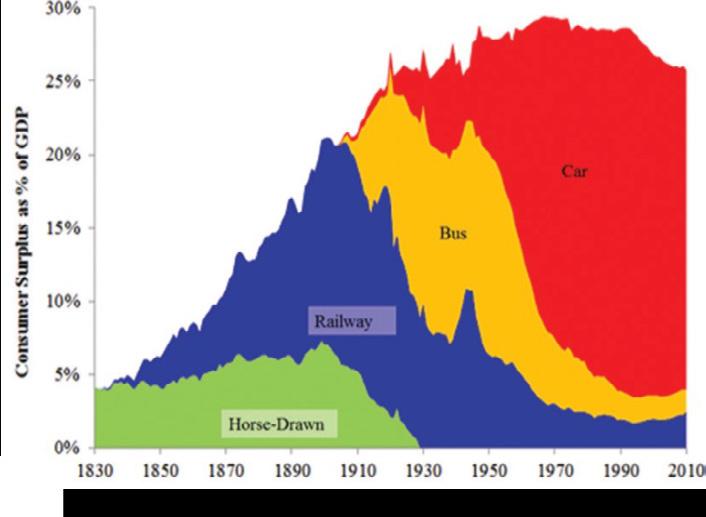
The benefits of car travel are at least as large as the total costs of car travel (monetary costs and travel time cost). Indeed, people would not be willing to bear these costs if the benefits of car travel do not at least equal the costs of obtaining those benefits. However, the full benefits are larger than this. The difference between the cost consumers actually pay for a good and the value to them of that good is known as the consumer surplus. The total benefit of car travel equals the sum of the travel costs and the consumer surplus. Where quantified, consumer-surplus-based estimates indicate that the benefits of private car use can be very large. For example, an estimate for the UK finds that in 2010, consumer surplus from passenger transport was equivalent to about 25% of GDP, with an equivalent of roughly 22% of GDP attributed to car transport 5
Such comprehensive estimates are however scarce, and one has to resort to indirect indicators of the benefits of car travel, more specifically regarding the preferences revealed by the choices made by people. A first such indicator is spending on private transport. For example, according to the 2015 household budget survey round for the EU27 Member States the share of private transport in consumption expenditures in the EU27 ranged between 4% and 17%. This can serve as a lower bound for the consumer value of private travel. It is only a lower bound for two reasons: the indicator only covers the monetary costs and not the time costs, and it does not give information on the consumer surplus.
Other observed market outcomes also underline continued attractiveness of private transport by car and motorcycle. Globally, the number of passenger cars grew strongly since 2000 and continued to expand after 2018 (approximately +15% for passenger cars and +23% for motorcycles between 2018 and 2023). In 2023, global averages reached 190 passenger cars per 1,000 people and 110 motorcycles per 1,000 (up from 170 and 91 in 2018), with the strongest motorisation-rate increases in the lower to upper middle-income countries. Ownership also varies sharply by income level: in 2023, high-income countries averaged 518 cars per 1,000 (vs 12 in low-income), while motorcycles are particularly prominent in lower-middle-income contexts (138 per 1,000).
Rising income is a major driver of motorisation (often described through an S-shaped relationship). Where incomes rise and constraints are modest, motorisation increases rapidly. In emerging economies, two-wheelers frequently serve as a transitional pathway, signalling strong demand for individual motorised mobility even where car ownership remains low.
The strength of the relationship between income and motorisation is however context dependent. Cross-country differences in motorisation and car use are related to differences in factors such as the socio-economic structure, land use, the presence of a domestic car industry and “car culture,” and transport-system features such as road infrastructure, quality of alternatives, relative costs, and policy 6
FUTURE EVOLUTIONS ARE LIKELY TO AFFECT THE PRIVATE USER BENEFITS OF CAR/MOTORCYCLE TRAVEL
The value of the mobility services provided by cars and motorcycles is likely to change in the future. New mobility services and technologies will offer travellers more choices – from ridesharing and micromobility today to autonomous vehicles in the longer run – which reduce car travel’s convenience relative to other means of transport. At the same time, increasing congestion can be expected to reduce the private benefits of private travel by car and motorcycle, and road transport is also causing environmental and traffic safety challenges. If policymakers respond to these societal costs by increasing the cost of private vehicle use through pricing mechanisms such that the societal costs are taken into account in their travel decisions, and by making alternative modes more attractive, these policy shifts, alongside smarter land use planning, mean that the advantage of being a driver would be affected relative to other options. Such changes would be gradual and would also vary by region of the world, between (sub)urban and rural regions, or between generations. The ultimate impact on the value of car and motorcycle services will be decided by how technology is harnessed and to what extent policies are enacted to address congestion and to reduce the environmental and accident costs of transport.
01 INTRODUCTION
FIA wishes to get a better understanding of the private benefits of mobility and personal transport. For this purpose, this study summarises findings from the existing literature on the benefits of personal transport, with a focus on personal transport by private car and motorcycle. Given the scope of the study, the other societal costs and benefits, while highly relevant, are only briefly touched upon 7. In the literature search, the geographical scope was wide. However, given the limited availability of studies and data for emerging economies, many insights in this report are drawn from studies for high income countries.
The structure of the report is as follows.
Chapter 2 points out the high economic, social and cultural relevance of the mobility services offered by cars/motorcycles, in terms of their use and non-use value.
• Use value:
- What are the relevant attributes of the two modes, and how do they compare to those of other modes of transport
- The excellent general accessibility provided by the two modes
- The excellent accessibility to jobs provided by the two modes
- The potential gains people with limited or no access to private transport can obtain
• Non-use value: Sense of control, emotive value, expression of status, being “normal”
For each of these different dimensions Chapter 2 will present a general discussion, and in addition evidence will be presented from a number of cases, which are drawn from different contexts.
Chapter 3 will discuss that the quality of the services offered by cars and motorcycles leads to a strong preference for these two modes. This is revealed in the actual choices that people make and is also projected to lead to a growing importance of these modes in emerging economies. The chapter also presents quantitative evidence on the user value of car and motorcycle travel.
Finally, Chapter 4 points out a number of future evolutions that are expected to affect the value of services offered by cars and motorcycles. These include new mobility services, the impact of congestion on the user value, and land use/ transport policies.
7. Readers interested in the external costs of transport may consult, among others, EC (2020), which gives an overview of these costs for the EU.
02 CARS AND MOTORCYCLES OFFER
MOBILITY SERVICES OF HIGH QUALITY
MAIN MESSAGES
• Private transport benefits can be divided in use and non-use value. The provision of access to services and jobs provides the use value. The provision of autonomy, of flexibility and the possibility of expression of status and emotions provide the non-use value.
• Private transport benefits associated with the use value can be provided by private transport and public transport. The attributes of private motorised transport, car and motorcycle, make it often more attractive than public transport. Private motorised transport means are often perceived as more comfortable, convenient (no waiting times), safer (low risk of in-vehicle aggression). In certain metropolitan areas, public transport and active modes can however be the preferred modes.
• The qualitative and subjective superiority of private motorised modes is confirmed by objective accessibility figures, within the context of the current transport system.
- Figures on the accessibility of services and jobs in Western-European countries, in metropolitan cities on the three continents confirm the superior accessibility of private transport. The advantage of car and motorcycle is largest in rural areas and smallest or non-inexistent in urban areas with a well-developed public transport network.
- Doctors and food stores are reached within 15 min car by 90% to 100% of the population in the Netherlands and England, but only by 40 and 75% by public transport in their respective rural areas.
- 7.6 times more opportunities are reached by car than by public transport within 30 minutes on average for 82 European cities.
- On average 50 (10) times more jobs are accessible by car than by public transport in US (European) metropolitan areas. The ratio is 15 in China, 5 in Canada and Australia
• The accessibility paradox is that cities with dense land use and good public transport provide best overall accessibility. A car only oriented development encourages urban sprawl reducing proximity and ultimately lowers overall accessibility. A balanced transport policy paying attention to density and a good mixture of active modes, public transport and private motorised transport will provide the largest accessibility and economic benefits.
• Within the current transport system, the importance of car access is also made clear from the reduction in quality of life of people without (full) car access.
- In the Global North, between 15% and 40% of the population in high-income countries does not fully benefit from car access, which is correlated with lower mobility, fewer opportunities and reduced quality of life, especially in rural areas. Improved access to mobility and services will improve quality of life of these people. In the Global South, these shares are higher.
- In lower-income countries, improved transport infrastructure and access to private motorised transport are strongly linked to better job matching, productivity and economic development.
Moody et al. (2021) calculated the monetary value of car ownership in the US. The estimated average value is US$11 200/year. The largest part of the value is the non-use value.
2.1 A BRIEF OVERVIEW OF PRIVATE BENEFITS OF TRANSPORT
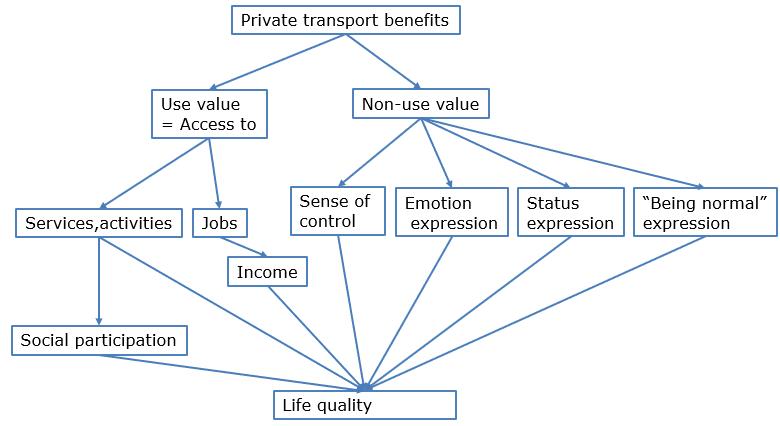
In this section we explain briefly the different private benefits of transport, leading finally to better quality of life. In the next sections of this chapter, we detail the different benefits. Figure 2 provides an overview of the different benefits. These are divided into use value and non-use value.
Figure 2.1: Different private transport benefits improving quality of life
The use value is the value derived from the use of private transport. The use value is derived from access to services and jobs, and participation in society. Also, the safety of transport can be an important characteristic that increases its use value. The use value can also come from the pleasure of using transport. People can just drive for fun.
The non-use value is only there thanks to the fact that people own a car or a motorcycle and know they can use it.
Private benefits of transport can be obtained from private as well as public transport. In this report we focus on the benefits of private transport, car and motorcycle. Where useful, we compare the accessibility performance of private transport with public transport.
Although accessibility data is quite scarce, in general, more and better-quality data and evidence is available from higher income economies. To the extent possible, we do also provide information from emerging economies where data is more limited.
2.2 DIFFERENT COMPONENTS OF THE USE VALUE
This section develops and details each of the messages below
• Access to services, activities and jobs enable participation in society
• Within the current transport system, attributes of cars and motorcycles make them in most situations the preferred means of transport and private motorised transport provides generally best accessibility for services and for jobs.
• Accessibility benefits are maximized by transport policies balancing active modes, public transport, private motorised transport and density.
• 15 to 40% of the population in the Global North does not fully benefit of private motorised transport (car) access and its currently superior accessibility characteristics. The consequent unmet travel needs are correlated with lower quality of life, especially in rural areas.
2.2.1 ACCESS TO SERVICES, ACTIVITIES AND JOBS ENABLE PARTICIPATION IN SOCIETY
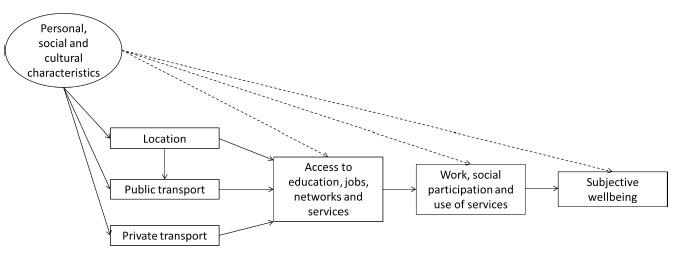
Figure 2.2 Conceptual relationship between transport access, life opportunities and subjective wellbeing
Source: Chatterjee et al. (2019)
Figure 2.2 illustrates that transport, public or private, provides access to education, jobs, networks and services. This access is important for full participation in society which leads in turn to subjective wellbeing. Stanley et al. (2022) calculated that an extra trip provides an increase in well-being of approximately €10.5 on average in Australian cities as it increases the opportunities for participation in society. The value is bigger for low-income people benefiting from lower general accessibility rates.
Ettema et al. (2025) illustrate for the Netherlands that transport adequacy correlates with life satisfaction. Transport adequacy means that one’s transport needs are met.
The figure illustrates that also other factors influence this wellbeing, like personal, social and cultural characteristics. Note that accessibility by public transport is influenced by the location which is not the case for private transport following the figure. In reality also private transport accessibility will be influenced by location, via proximity and/or congestion although to a much lower extent.
2.2.2 WITHIN THE CURRENT TRANSPORT SYSTEM, ATTRIBUTES OF CARS AND MOTORCYCLES MAKE THEM IN MOST SITUATIONS THE PREFERRED MODES OF TRANSPORT
QUALITATIVE ANALYSIS OF DIFFERENT ATTRIBUTES
When travellers compare modes, they generally weigh a combination of:
• Door-to-door travel time (and its components),
• Reliability (variation, predictability),
• Perceived vs real travel times,
• Monetary cost / out-of-pocket costs,
• Comfort, convenience, crowding, transfers
• Access/egress (walking, waiting)
• Risk / safety (perceived and real)
• Taking luggage, persons
• Customisation, flexibility
The table below compares those attributes for motorised private and public transport from the point of view of the user.
MOTORISED PRIVATE TRANSPORT
TRANSPORT
Door-to-door travel time
Reliability
Perceived vs real travel times -
Comfort, convenience, crowding, transfers
Provides most often best door to door travel times, except for dense (congested) areas (see also section 2.2.3).
Monetary cost/out of pocket costs
Access/egress (walking, waiting)
Safety
Room for luggage/persons
Customization, individual taste catering
Provides most often travel times worse than those of private motorised transport, except for dense (congested) areas (see also section 2.2.3). It requires access and egress mode.
Reliability is for a major part in the owner’s (user’s) hands. Good maintenance will provide reliability of the vehicle. Congestion or incidents can have a negative impact on reliability concerning travel time. There can be reasons public transport is not functioning properly, ill drivers, drivers on strike, lack of drivers, vehicles in bad shape. This is not in the user’s hands.
The perceived private transport environment (nice music, good seat, silence, etc.), and how someone likes driving, influences the perceived travel time. The more positive the elements mentioned above are, the shorter the perceived travel time will be.
The variable costs are relatively low (for Global North standards), while the fixed cost for owning a car (purchase and taxes) are often rather high. Societal costs are considerably higher than the variable driving costs, especially in urban areas.
Access and egress time is nonexistent, except for parking places that are not near trip origin or trip destination. On the other hand, the vehicle is waiting for its user. No further waiting time is necessary.
Car users feel relatively safe. Two wheeler’s road safety is generally worst of all modes of transport.
Possibility to carry luggage or other people (children) without influencing the cost. (Sierra Munoz et al., 2024)
Owners can customize their mobility means (except for congestion) as far as they have the necessary financial means
Public transport can allow to have other occupations, working, reading, …reducing perceived travel times. On the other hand, public transport can provide bad travel conditions, lack of seats, crowded standing place in bus or metro… which will lead to increased perceived travel times.
The user cost goes from extremely low to prices significantly higher than variable private motorised transport. The yearly user cost is lower than that of private transport as fixed costs for the user are zero. Societal cost is generally higher than the user cost because public transport is often subsidized by public authorities.
As stops are not at trip origin or trip destination, some time needs to be spent on egress or access, often by walking (or cycling). Furthermore, the vehicles are not waiting for you, but you need to wait for the vehicle to arrive, implying some waiting time.
In certain cities (Latin America) and/ or certain moments (late evening), public transport is felt as unsafe.
Carrying large amounts of luggage and children can be a struggle.
Users use the provided standard mobility
The qualitative analysis of the table illustrates already the multiple advantages of private motorised transport. It provides generally rather fast door-to-door transport in a comfortable, safe, reliable and customized way. Public transport can only seduce significant numbers of users as it can come close to the flexibility of private transport. Lunke et al. (2021)
show that public transport shares of over 30% are possible with a travel time ratio of 1.5 or lower, without transfers, short distances to stops/stations and high service frequency. If this is not possible, preference for public transport drops. Literature mentions following elements contributing to car dependence: large families with young kids, low proximity accessibility contexts and poor public transport (Sierra Munoz et al., 2024). These elements and contexts are illustrations of the characteristics/advantages of the car, reliability, room for luggage, convenience, travel times, etc.
A German survey on satisfaction with the traffic situation for different modes in different geographical areas see these elements translated. The car traffic situation is most appreciated in the rural and (peri) urban regions. In the metropolitan areas, the public transport situation is most appreciated. In the urban regions, the walking situation is also well appreciated. (Infas et al., 2025). Figure A 1 in the Annex illustrates this.
The total user cost of private motorised transport is the only drawback from the user viewpoint. This explains also why generally people buy private motorised transport as soon as they can afford it. Schwarz (2005) summarizes it as follows “Despite the costs of owning and operating an automobile, people choose automobiles the world over because no other form of transportation comes anywhere close to providing comparable speed, flexibility, privacy, and convenience.” This needs to be nuanced for dense urban areas where public transport and active modes can be good alternatives. We finally remark that the table does not adopt a general societal point of view, out of the study scope) and does not consider health, environmental impacts space requirements. It does furthermore not consider cycling. Cycling takes often a position in between private motorised transport and public transport. Often, it provides flexibility, reliability, door to door mobility, convenience, joy like other private transport modes, although speed is lower than other modes, except in dense urban areas and it is not appropriate for distances over 10 to 20 km. Travel satisfaction of active modes, cycling and walking, is generally high, at least in the Global North (Harms et al, 2007; Mouratadis, 2025).
CONSEQUENCES OF TRAVEL TIME SAVINGS
The characteristics of the different modes are also translated in the values of travel time savings (VTTS) for the different modes. People using bus value the VTTS lower than people using the car. For train, VTTS are similar or higher than those of car. This is the logic consequence of the speed and the characteristics of the people who choose the respective modes. People with a high VTTS will value more faster transport modes (and/or) modes that enable one to work.
VTTS also depend on the motive. Leisure trips get the lowest VTTS, commuting gets a higher value and business trips get the highest value.
The VTTS in the Netherlands is valued €10.8/h for car, €12.1/h for train and €7.6/h for bus, tram and metro, in the case of commuting trips (Knoope, 2023). Business trips in the UK are valued at €27.0/h for car, €13.1/h for bus and €36.5/h for train (Batley et al, 2020).
2.2.3 WITHIN THE CURRENT TRANSPORT SYSTEM, CARS AND MOTORCYCLES PROVIDE GENERALLY BEST ACCESS TO SERVICES AND ACTIVITIES
In the previous section, we exposed characteristics of cars (and motorcycles) in a qualitative way. We concluded that cars (and motorcycles) are generally a more flexible and convenient way to access destinations, services, goods and jobs than public transport. In this section we provide quantitative measures to evaluate access to destinations by private motorised transport and public transport. The accessibility measures we encounter in literature express average access times to destinations or shares of population that can reach a destination. Concerning public transport, some accessibility measures express the accessibility of a public transport stop. Such measures do, however, not show how long it takes and how easy it is to reach a destination by public transport. We focus therefore on accessibility measures of average travel times to destinations and shares of population reaching a destination within a certain time.
Although accessibility is the main objective of a transport system, it is very hard to find good data on accessibility performance of transport systems. Below we summarize the scarce information we found comparing private motorised transport. In this section we consider general access to services and goods, in the next section we consider access to jobs.
ENGLAND, UK: SUPERIOR ACCESSIBILITY BY CAR
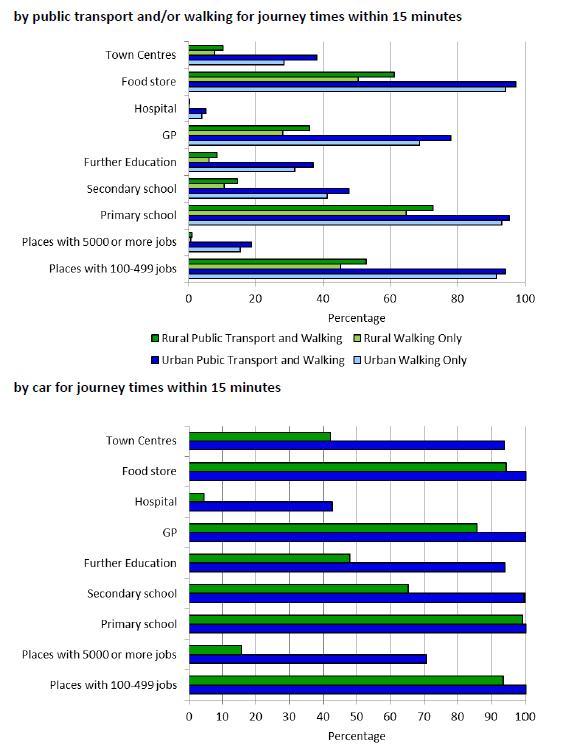
Figure 2.3 Share of people that have access to different services and jobs within 15 minutes by public transport (above) or car (below), in rural areas (green) and urban areas (blue)
Source: UK Department for Environment, Food and Rural Affairs (2022)
Figure 2.3 shows for England that car provides superior accessibility to services and jobs. We provide two examples from the figure to illustrate this:
• Around 60% of rural citizens reach a food store within 15 minutes by public transport (close to 100% in urban areas). The share is more than 90% by car (100 % in urban areas).
• Around 38% of rural citizens reach a general practitioner within 15 minutes by public transport, nearly 80% in urban area. By car, the figures are respectively 85% and 100%.
Also for the other services and places with a certain concentration of jobs, the situation is very similar. Car provides systematically the highest accessibility score, and this is particularly the case in rural areas. Chatterjee et al. (2019) point also to the importance of car access to guarantee access to services in rural areas.
GERMANY AND THE NETHERLANDS: DOCTOR AND FOOD STORES BEST ACCESSIBILITY BY CAR
The accessibility lessons for Germany and the Netherlands are similar as those for England (UK). Table 2 2 illustrates this. Table 2-2 Share of population that has access to a doctor or a supermarket within 15 min (the Netherlands) and within x min (Germany) in urban and rural areas for the Netherlands and Urban and very rural areas with bad economic conditions in Germany
Source: TML on the basis of Bastiaanssen & Breedijk (2022) and Bundesministerium Landwirtschaft, Ernährung und Heimat (n.d.)
The car provides significant better accessibility to doctors and supermarkets, especially in rural areas. For example, in rural areas in the Netherlands, 79% of the citizens reach a supermarket within 15 min, while this is 100% among people able to use a car. In Germany the difference is even more important. More than 98% of people having a car at their disposal reach a supermarket within less than 10 min, while only 22% of people counting on public transport can reach a supermarket within 35 min. Note that the definition of rural is different for the Netherlands and Germany. The very rural German regions concern 16% of the population (38% of the surface), the not rural region concerns 43% of the population (9% of the surface), while in the Netherlands, around 1/3 of the citizens live in rural areas and around 2/3 in urban areas. Concerning the Netherlands, we remark that the public transport accessibility figures concern lower income groups, and the car accessibility figures high income groups. As lower and higher income groups live in different areas, the general country wide average accessibility figures can be different from those in the table.
EUROPEAN CITIES
Table 2-3 Accessibility indicator averages for 82 European cities with public transport data available (people one can reach on average within x minutes)
Source: Extract from Table 5 in International Transport Forum (2019)
Table 2-3 provides the number of people one can reach on average within respectively 15, 30 and 45 minutes. In the 82 European cities studied, someone living in the city can reach on average 50 000 people within 15 minutes. With public transport this number is 33 000. The ratio between both is 1.5. This means that with a car someone from the city centre can reach 50% more people than someone using public transport. In the commuting zone, the wider area around the city, the advantage of the car increases. Someone using a car in the commuting zone of the city can reach
7.6 more people than someone using public transport. They reach respectively 266 000 using a car and 35 000 using public transport. Population is used as a proxy for available services.
Remark that in the cities within 15 minutes distance, the bicycle provides generally an accessibility twice as good as by car, 50 000 people reached by car on average, 107 000 reached by bicycle on average.
2.2.3.2 Superior accessibility by private motorised transport also in other parts of the world
As already mentioned, detailed accessibility figures on country scale, except for the above mentioned Western European countries, are scarce. Below we provide some figures on the accessibility advantages of (private) motorised transport. Most figures concern urban areas. We can reasonably assume that in rural areas the advantage of private motorised transport will be even bigger as already suggested by the accessibility figures in the section above.
METROPOLITAN AREAS ON THREE CONTINENTS; BEST ACCESSIBILITY BY CAR, SÃO PAULO, BRAZIL; STOCKHOLM, SWEDEN; SYDNEY, AUSTRALIA; AND AMSTERDAM, THE NETHERLANDS
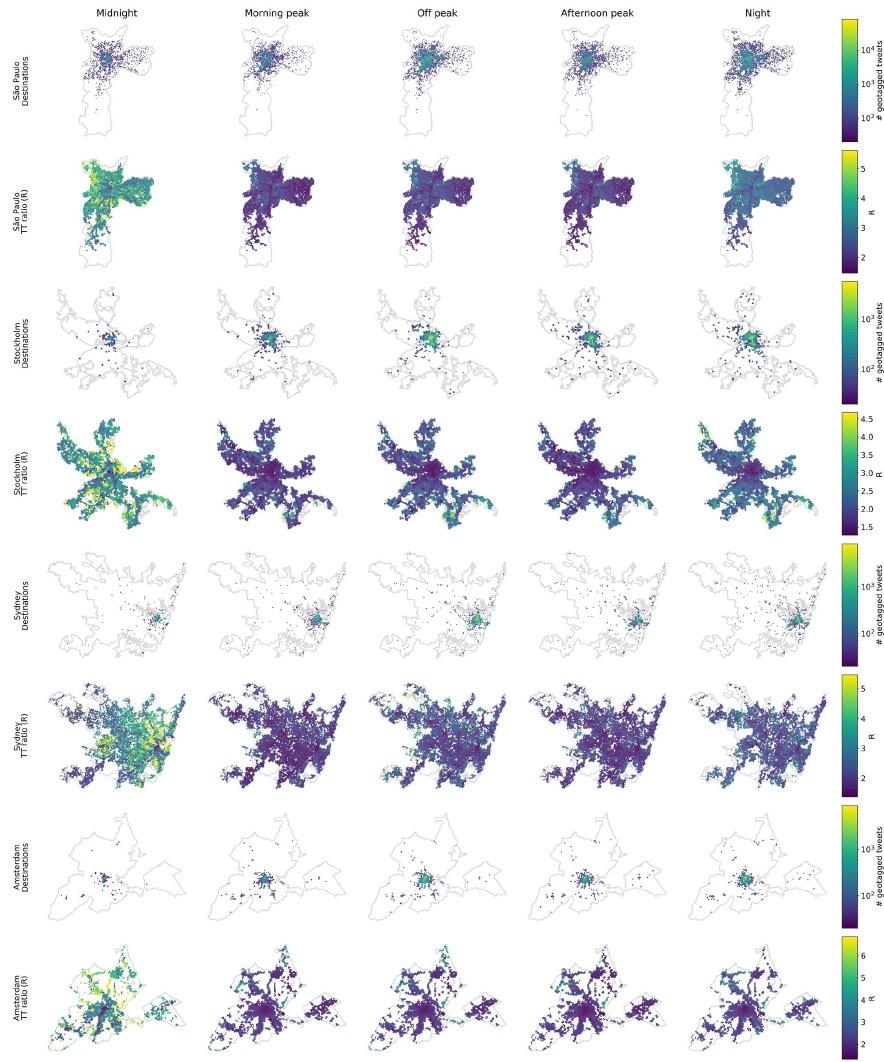
Figure 2.4 Spatiotemporal variation of travel time ratio (R) over the course of an average weekday
Notes: The travel time ratio R is the ratio of the average public transport travel time to the average car travel time. For each city, the upper row shows the visited locations weighted by their number of geotagged tweets, and the bottom row shows the weighted average travel time to those locations within each time interval. Midnight = 0:00–7:00, Morning peak = 7:00–10:00, Off peak = 10:00–16:00, Afternoon peak = 16:00–19:00, Night = 19:00–0:00. Maps presented with different spatial scales for the sake of clarity
Source: Liao et al. (2020) – shared under https://creativecommons.org/licenses/by/4.0/ – no changes made
Liao et al (2020) looked at travel times in cities on different continents and compared travel times between car and public transport. They derived destinations based on geotagged tweets. Travel times to these destinations were based on timetables and real travel times. Figure 2 illustrates the results for the different cities and different moments in time. The results are quite similar over the different continents. The car is the fastest mode except for very short distances, under 3 km. Public transport takes on average 1.4 to 2.6 times longer than driving a car. This is expressed by the travel time ratio R. The ratio is highest in São Paulo and Sidney, lowest in Stockholm and Amsterdam. The travel time disparity, as quantified by the travel time ratio R, is the public transport travel time divided by the car travel time. The ratio varies widely during an average weekday, by location and time of day. During the night, car has the largest advantage. During the peak, the car has the smallest advantage. In Stockholm and Amsterdam, public transport can outperform the car on average short-distance travel (<3km) in the rush hour.
BRAZIL; SUPERIOR ACCESS BY CAR AND A MISMATCH IN UNSAFE PUBLIC TRANSPORT
• Superior access by car in Curitiba, Brazil
De Almeida Correia et al. (2025) calculate the accessibility gap in Curitiba (Brazil) and provide them on a map. The accessibility gap is the ratio between access time by private transport and public transport.
The accessibility gap for different parts of the city is between 5 and 23. The maps illustrate that private vehicles have a systematic advantage over public transport, especially outside rush hours (congestion) and city centre (outskirts). During rush hours around the city centre, the ratio is less than 5.
These figures confirm the São Paulo figures above on the superior car accessibility.
• Mismatch of public transport and equalizing power of private transport modes in the short run (not in the long run)
Freitas et al. (2022) provide us the following qualitative description on the transport situation in Brazil. “The urban models including the mainly private financing of public transport make private modes generally faster and more comfortable. The public transport system provides generally poor services, with long journeys and waiting times, especially in the periphery and for leisure activities. Travel conditions are generally unsafe, and commutes are strenuous. All these facts confirm the idea in the mind of Brazilians that the car is more comfortable and convenient”.
Boisjoly et al. ((2020),(2021)) find that low income groups use more public transport to reach their jobs. At the same, their access to the public transport system is worse than that of high-income people. She uses data from São Paulo, Rio de Janeiro, Curitiba and Recife.
Saraiva et al. (2022) find that in Sao Paulo, higher income people have access to significantly more opportunities than lower class people. Transport mode inequalities reinforce this inequality as a consequence of the location patterns. Cars and motorbikes enable individuals to improve their own accessibility levels, with a positive effect on equity levels in the short run. The compensation of bad public transport by private transport is however unsustainable in the long run.
MIDSIZED INDIAN CITIES; POPULARITY OF MOTORCYCLES MOPEDS
Pai et al. (2014) illustrated in his report that motorised two wheelers are for India and Asia what are cars are in the global north, a convenient and ever more affordable transport mean. Compared to cars, they have the advantage of manoeuvrability and easy parking in congested areas. The inconvenience is that these are unsafe, causing lots of accidents and injuries.
Two motorised wheelers are getting popular in cities, a trend that is accelerated by the lack of adequate and good quality public transport and infrastructure for non-motorised transport in many cities. Aa a consequence, public transport loses modal shares. Pai et al. (2014) observed that high two- wheeler shares were typical for mid-sized cities like Pune and Ahmedabad. Part of the users of two wheelers were captive users who would prefer to use public transport, although in the absence of it, they used motorised two wheelers.
Cities with large metro shares like Delhi, Kolkata and Mumbai had higher public transport shares and lower two-wheeler shares.
HEALTHCARE ACCESS GLOBALLY BY MOTORISED TRANSPORT
Weiss et al. (2020) compare the accessibility of health care facilities by motorised transport and by foot. Their analysis is based on the available land transport network, rail, water and road, and the distances between these infrastructures and living places. The travel time by motorised transport considered is that of the fastest means of transport, at the maximum allowed speed on the respective networks. The fastest means of transport is generally the car or the motorcycle. The authors affirm implicitly the better accessibility by private motorised transport. “In reality the numbers of people will fall between these estimates (lowest travel time by car and highest travel time by foot) if, for example, their journeys combine walking and public transport.” And “the data do not consider delays in journeys incurred while waiting for public transportation”. The modelling result shows that under the condition of a generalized availability and use of motorised transport, 60% of the Earth population would live within 10 minutes of a healthcare facility, 82.6% within 30 minutes and 91% within 60 minutes. All this under the condition that the fastest travel times can be realized.
2.2.4 WITHIN THE CURRENT TRANSPORT SYSTEM, CARS AND MOTORCYCLES PROVIDE BEST ACCESS TO EMPLOYMENT
In this section we dig deeper into a particular form of accessibility, job accessibility from the perspective of the employees. Job accessibility is also important from a broader economic perspective. Good job accessibility allows an optimal allocation of production factors creating conditions for economic growth. This is important in the Global South where people are obliged to work at home due to a lack of transport possibilities.
2.2.4.1 Job accessibility in Europe
FLANDERS (BELGIUM)
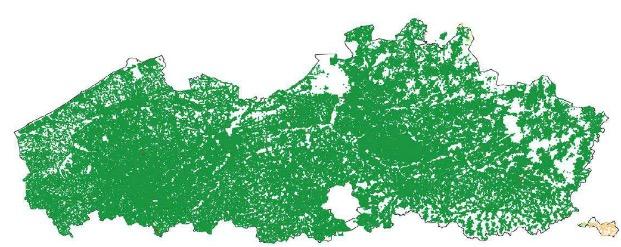
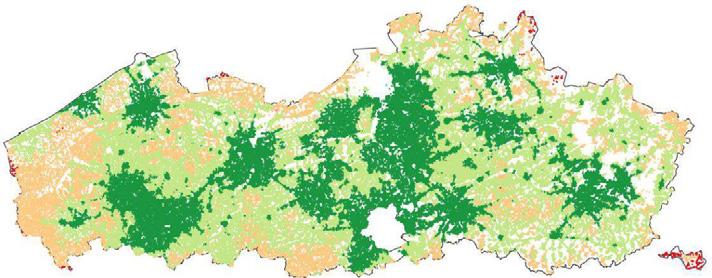
Hugaerts (2024) finds for Flanders (Belgium) that in Flanders, everyone using a car has access to more than 25 000 jobs. For people using public transport this is just over 50%, for people using a bicycle, this is also just over 50%. Figure 2 illustrates this. Note that accessibility figures at the borders are underestimated as data on employment abroad was not considered.
Figure 2.5 Accessibility of jobs by car (left) and public transport or bicycle (right)
Note: red: 0-1000 jobs, salmon: 1000-10 000 jobs, light green: 10 000 to 25 000 jobs, dark green: more than 25 000 jobs available
Source: Hugaerts (2024)
ENGLAND AND UK
Also in the UK, car provides superior job accessibility as Figure 2.3 illustrates. In rural English areas, 70% of people reach 5000 jobs by car, while only 20% reach a similar number of jobs by public transport.
Chatterjee et al. (2019) find correlation between employment and car access. People who have a car have 3.8 times more chances of being unemployed than people without a car. Unemployed people with car access are 2.2 times more likely to get a job within 2 years. The difference is smaller for women than for man and in metropolitan areas. This correlation is not necessarily a causal relationship.
THE NETHERLANDS
Table 2-4: The average number of available jobs within 15, 30, 45 and 60 min in the Netherlands by car, public transport and bicycle
Source: Bastiaanssen & Breedijk (2022)
The job accessibility figures for the Netherlands confirm the Belgian and English figures. Job accessibility is best by car. On average 61 131 jobs are available by car within 15 min, 7 552 by public transport and 18 544 by bicycle, respectively 1 761 358, 268 841 and 165 509 within 60 min as shown in Table 2 4.
2.2.4.2 Job accessibility on other continents
Wu et al. (2021) calculated job accessibility figures for metropolitan areas on different continents. Job accessibility is the average number of jobs accessible within 30 minutes for people living in the metropolitan area. They find that in metropolitan areas on different continents, job accessibility is systematically best by car, except for Shanghai (China).
Figure 2.6 Ratio of automobile to public transport access (red), cycling to public transport access (green)
Notes: Boxes span 25th to 75th percentile, whiskers extend to max/min of the values, excluding outliers (>1.5 away from box edges, which are shown as circles)
Source: Wu et al. (2021) – shared under https://creativecommons.org/licenses/by/4.0/ – no changes made
Figure 2 illustrates the job accessibility ratio for different transport modes. The red bar for the US illustrates that on average, the car reaches between 5 and more than 100 times the number of jobs reached by public transport. In half of the metropolitan areas, between 35 and 75 times more jobs are accessed within 30 min by car compared to public transport.
In Europe and China, the difference is smaller. Car access is between 5 and approximately 30 times better, with 50% of the metropolitan areas having a ratio between 10 and 17. The green boxes show that also cycling provides better access to jobs than public transport in the metropolitan areas, up to 10 times more jobs are accessed in China and the US with an average around 5.
We provide the graphs with job accessibility for the different modes in the Annex (Figure A 2).
These graphs provide an important lesson. Although the car provides superior accessibility compared to public transport as illustrated by Figure 2.6, too much focus on car as transport mode has negative consequences. The job accessibility by car and the overall job accessibility over all modes together is better in Europe and China compared to the US, or Oceania although the latter cities are more car oriented.
Table 2-5 illustrates this for a few cities. Amsterdam and Vienna have respectively 1 and 2 M inhabitants. Seattle and Orlando approximately 2M. The job accessibility is however quite different. The job accessibility by public transport is around 10 times better in the European cities. Also by car the accessibility seems better. We have to remain cautious here as the data points for job accessibility by car are limited for the European cities. The Chinese metropolitan areas offer nevertheless a few million extra jobs accessible by car compared to their US counterparts of similar size. Shangai has on average 4 to 5 times more jobs accessible by car compared to the best performing US city on accessibility, New York. It outperforms New York also on accessibility by public transport, bicycle and walking. (New York has a public transport performance similar to that of the worst Chinese city, Shanghai)
Table 2-5 The average number of jobs accessible in 4 metropolitan areas in Europe and the US by different modes
Source: TML based on Wu et al. (2021) – shared under https://creativecommons.org/licenses/by/4.0/ (combination of data from different tables)
Here seems to be a paradox, car provides systematically best job accessibility (except for Shanghai where bicycle provides best accessibility), although global accessibility is best in cities where other modes are well developed. We come back to it in Section 2.2.3 with another study comparing the European and American situation.
CORRELATION OR CAUSAL RELATIONSHIP BETWEEN CAR ACCESS AND EMPLOYMENT
The previous section made clear that a car provides generally better access to jobs than other means of transport. In this section, we investigate whether there is a causal relationship between access to a car and getting a job. In other words, does vehicle ownership increase one’s chances on the labour market independent of other factors.
In general, a high correlation can be seen between employment and car ownership (for example Chatterjee et al. (2019), discussed in section 2.2.4.1) However, correlation does not necessarily implies a causal relationship between car ownership and employment. Bastiaanssen et al. (2020) looked after the relationship based on an extensive literature review of studies having investigated the impact on employment of car access, public transport access, commuting time and job accessibility. Their meta-analysis included 93 studies.
Several studies were only in part useable for different reasons:
• Endogeneity of car access. This means it was unclear whether car access came before or after getting employed.
• Endogeneity of land use. Car use influences generally land use and leads to more dispersed land use, making a car more necessary. In that way car use can have a positive immediate impact on overall accessibility and a negative long-term impact.
• Concerning public transport access,
- For new public transport lines, it was not always clear to what extent the siting of new public transport lines was codetermined with linking economic activity. Clarity about it is, however, required to establish exogeneity.
- Improving public transport accessibility can lead to displacement of populations. Lower income population living in a neighbourhood with poor public transport is displaced by a higher income population when public transport quality is improved (endogeneity of land use).
- Improvements to the public transport service quality can take place at moments that are not appropriate for (low skilled) workers. Even if, for example, an improvement in the public transport service in the morning rush does not show an impact on employment in the neighbourhood, it can simply mean that low-skilled workers do rather need better transport possibilities in the evening.
- Most of the studies concerned US metropolitan areas
In spite of these difficulties, the authors state that there is most probably a positive association between transport access and employment probability. The relationship between employment probability and car access, public transport access and job accessibility is positive. The relationship with commuting time is negative. From their own meta regression model, the authors conclude that car ownership significantly increases individual employment probabilities, especially among welfare recipients. As most studies focused on US metropolitan areas, to establish a similar robust relationship in less car dependent areas, further research is needed. Today, it seems that the relationship will hold also for less car-dependent areas, but the number of studies is limited.
WIDER ECONOMIC BENEFITS
OF A GOOD FUNCTIONING TRANSPORT SYSTEM
A well-functioning personal transport system generates broad economic benefits by reducing travel costs and improving mobility. Enhanced connectivity facilitates trade and tourism, which are vital for economic growth (Amankwah-Amoah et al., 2025; Liu et al., 2022). Efficient transport also expands labour market catchments and flexibility – by allowing workers to reach more jobs and firms to access a larger talent pool – which improves job matching and productivity (Glaeser & Kohlhase, 2004). In general, transport improvements lower the cost of economic activities and enhance productivity, leading to higher overall GDP and national prosperity (Laird & Tveter, 2023). Better personal transport links support the concentration of economic activity in urban areas, creating agglomeration economies. By effectively bringing firms and workers closer together in time, improved transport intensifies co-location and yields productivity gains from knowledge sharing, specialized labour pools, and input-output linkages (Laird & Tveter, 2023). Empirical research shows that larger and better-connected cities are significantly more productive. These agglomeration benefits can substantially boost economic output (Swinney & Vera, 2023) However, in areas with chronic congestion, the advantages of agglomeration can be diminished. Increased traffic congestion raises travel times and effectively reduces the reachable economic mass, offsetting agglomeration gains. One study in Belgium found that while a 1% rise in effective density yields about a 0.06–0.07% productivity increase, a 1% increase in traffic congestion causes a 0.01–0.02% productivity loss – enough to neutralize or even outweigh the positive agglomeration spillovers in highly congested cities (Baert & Reynaerts, 2018).
An important note is that there is partial overlap between personal transport benefits and wider economic benefits. Many broader gains ultimately stem from the same improvements individuals enjoy (e.g. travel time savings and reliability), making these categories interrelated rather than wholly distinct (Laird & Tveter, 2023).
2.2.5
ACCESSIBILITY BENEFITS ARE MAXIMIZED BY TRANSPORT POLICIES BALANCING ACTIVE MODES, PUBLIC TRANSPORT, PRIVATE MOTORISED TRANSPORT AND DENSITY.
In the sections above, we described that cars (and motorcycles) provide generally superior accessibility compared to other modes. In section 2.2.4.2 we encountered the “car accessibility paradox”. Massive infrastructure and use of cars can reduce overall accessibility and even car accessibility.
The reason is that accessibility is a combination of proximity and the transport performance. Proximity, the number of opportunities within y km, is a consequence of land use. The transport performance provides the ratio of the number of people you can reach within x min over the number of people that live in an y km range. In the example below, y is 8 km.
Figure 2.7 The absolute accessibility of hospitals by car in 30 min in 6 European cities decomposed in transport performance and proximity
Source: International Transport Forum (2019)
Figure 2.7 illustrates this. It shows for 6 cities the number of hospitals accessible within 30 min by car by the blue diamond. It is for example 11 for Glasgow. The figure explains to what extent proximity (orange) and the transport performance (green) contribute to being that figure above or below the average for these cities. In Ghent for example, 13 hospitals can be reached, 4,4 more than the European-wide commuting zone average of 8.6, 3.9 more thanks to the transport system and 1.5 thanks to proximity.
Also Dutch research illustrates that accessibility is narrowly linked with land use. In a modelling exercise with different land use scenario’s, Geurs (2010) shows that accessibility can increase by privileging a more compact development. In such a scenario, total accessibility would increase, mainly thanks to better accessibility for slow modes. Accessibility by car would slightly deteriorate.
The results of this modelling exercise illustrating the important influence of land use on accessibility was already mentioned in section 2.2.4 where European (and Chinese) not car-oriented cities provide better accessibility overall and for car users.
Another study by Conwell et al. (2023) confirms the superior accessibility in European, less car oriented cities. The car catchment areas surface in the US cities is nearly triple that of European cities. Public transport catchment areas in European cities are double that of US cities. The population density in accessibility zones is however low in the US due to bad housing investment policy (land use).
As a consequence, the European transport system transports 4 times more European commuters with public transport to CBD (central business district), while the capacity for the car commuters is similar. As a result, accessibility to European CBD with less car facilitating policies provides better total access than that of the US with more car centred policies. Conwell et al. (2023) add that car oriented development also indirectly leads to less green space in city boundaries, worse air pollution, less physical activity, worse health, lower life expectancy.
In short, the reason for the worse overall accessibility in car-oriented societies is that car orientation encourages urban sprawl, a non-dense development. As a consequence, jobs (and services) lose in proximity. This can be compensated partly by large car infrastructure as in the US, although not completely. However, it is hard to develop good public transport in these non-dense areas (Wu et al., 2021).
2.2.6 UNMET TRAVEL NEEDS OR LIMITED CAR AND MOTORCYCLE ACCESS IS CORRELATED WITH LOWER QUALITY OF LIFE, ESPECIALLY IN RURAL AREAS
A different angle to stress the importance of private transport is to point to unmet travel needs. In the previous sections we illustrated that private transport provides high quality accessibility compared to the other modes and allows for participation in society. In some rural contexts, private transport is even the only credible way to get around.
In this section we illustrate how handicapped people are, when they have no access or limited access to a car (or transport in general) or how much better they could be off if they had access to (private) transport.
For the Global North, we pay attention to how people without or with limited access to private transport are impacted. For the Global South we pay attention to the provision of (transport) infrastructure as a condition for organizing (private) transport and economic development.
For the Global North, we illustrate how disadvantaged people become without access to a car. For the Global South, we illustrate how (private) transport and transport infrastructure can contribute to an improvement in living conditions.
2.2.6.1
No access to private transport in Global North
15 TO 40% OF THE POPULATION IN THE GLOBAL NORTH DOES NOT FULLY BENEFIT FROM PRIVATE MOTORISED TRANSPORT
The European SILC database reports that 5 to 10% of people cannot afford a personal car (Eurostat, 2025). Besides this group, another group cannot use a car for health reasons.
In Germany the latter group concerns around 4% of the population, another slightly smaller group do not own a car for other reasons (Aljets & Fischer, 2023). Figure 2.8 shows that 21% of low-income quintile Germans have nearly no car access, while 25% of that group has an occasional car access to car. This is respectively 3% and 9% for the highest income quintile. Also, among youngsters, elderly and people living in metropolitan areas, car access is relatively restricted. Over het whole German population, 10% has nearly no car access and another 15% an occasional car access.
Figure 2.8: Car availability among Germans depending on household income, age and area of living
Source: Aljets & Fischer (2023).
In the Netherlands, Bastiaanssen & Breedijk (2022) estimate that 40% of the population, the two lowest income quintiles, have no full access to a car.
In the US, 8.6% or 10.5million households/ 6.2% of the US population or 18.6 million people have no car access. 70 million people or 23% of the US population has a car deficit status. The latter means that in the household, there is less than one car per adult. Low income people experience the highest car access limitations (Public Use Microdata Sample -PUMS, 2019 reported in (Wang et al., 2025).
Murphy et al. (2025) find that transportation insecurity is the most experienced form of material hardship in the US. 19% of Americans experience it. Americans mention it more than food insecurity (16.4%), unmet medical need (13.2%) and housing insecurity (9%).
Note that in Europe, a non-negligible share of the population cannot afford public transport neither, 6% in 2014, with a higher share in Eastern Europe. (Eurostat, 2024b)
As a logic consequence of the lower car access for lower income people, we observe that lower income people travel less (by car). For example in the Netherlands, the highest income quartile households drives 3.6 times more km than the lowest income quartile (CBS, 2023). On a per head basis, the German richest income quartile travels nearly double the lowest income quartile (Aljets & Fischer, 2023). The difference in distances travelled comes nearly entirely from different car access.
Wang et al. (2025) paid attention to the impact of living without a car in rural areas in the US. They investigated the sort of carless rural people. They observed that
• Living without a car in the US is a burden. Living without a car in rural areas makes the burden even harder.
• Car-less rural people gain 64% less than rural people with a car and 40% than their urban counterparts.
• Real alternatives to car in rural areas are nearly non-existent. Rural households and residents meet their mobility needs and undergo the financial burden of car access or alleviate the financial burden of car ownership and suffer reduced mobility. Boisjoly et al. (2021) and Mattioli (2017) and Mattioli speak about forced car ownership with respect to this situation. It points again to the importance of a car to participate in society.
• Car-less households in California make fewer than half the trips and spend more time travelling than their counterparts with car access.
• In the US as a whole, more than 60% of trips of carless people in rural areas is done by car, 40% drive alone. The figures are respectively 92% and 85% for the fully equipped.. In other words, among the car-less, 60% counts on other modes than driving alone, while among the fully equipped, this is only 15%.
TRANSPORT INADEQUACY IS CORRELATED WITH LOWER LIFE SATISFACTION
Ettema et al. (2025) illustrate that travelling less is generally not a deliberate choice. He introduces the concept of transport adequacy. Transport adequacy indicates to what extent travel needs are met. Transport adequacy is lower for those with lower incomes, no car access and using mobility aids. At this stage the methodology has only been used in urban areas, but we can assume that in rural areas, car access will have an even greater impact. Ettema et al. (2025) see also that a good score on transport adequacy goes together with good scores on life satisfaction.
By evaluating urban transport projects in Australia, Stanley et al. (2022) observe the high importance of providing transport and mobility. This is particularly important for the lower income people as they have generally less transport opportunities. By calculating the impact on people’s wellbeing via a better social participation, they find that each trip can be valued at approximately €10. The value is higher for lower income people, as the contribution to their subjective wellbeing is more important and their subjective wellbeing is lower.
We also observe in general that people acquire a car as soon as they can as well in the Global North as South.
PROVIDING CARS FOR THE LOW-INCOME PEOPLE AND DISCOURAGE CAR USE BY THE AFFLUENT
Bastiaanssen et al. (2020) mention in their study on the correlation between employment and car access that to reach positive employment outcomes, targeted policy interventions are necessary, especially for people having no access to private vehicles. This can be via the provision of vehicles or cheap public transport access.
Manville et al. (2023) also observe that a car is crucial to be able to participate in (the US) society and that at the same time, the most vulnerable have no or limited access to a car They are offered public transport, a poor substitute for car use, while for electricity or heating fuels American states offer programs to help low income people to maintain access to these goods or services. We quote Manville and his colleague’s proposal “We offer no assistance with basic access but heavily subsidize use for those affluent enough to gain access on their own: Once you have a car, the roads are free, and the parking is abundant and cheap. As a result, we have a small group of people who need vehicles and lack them, and a large group who have vehicles and use them needlessly. A just and sustainable society would help the former drive more while nudging the latter to drive less. Instead, we discourage driving only by withholding it from the small group of people who would benefit from it most. This approach is neither fair nor effective; the costs it imposes are large, and the benefits it delivers small. It doesn’t reduce driving enough to help the environment, but denies low-income people increases in mobility that could be life-changing”.
2.2.6.2 Importance of transport infrastructure as first step in the Global South
For the Global North, we have demonstrated that a lack of car access puts a burden on life opportunities and that mainly lower income people are victims here. This is also the case for the Global South, although in the Global South, transport infrastructure, the condition to be able to use (private) transport is often still lacking. The situation and studies for the Global South illustrate that transport (infrastructure) is necessary for economic development and structural transformation.
BAD ACCESSIBILITY IN THE GLOBAL SOUTH, ESPECIALLY IN AFRICA, DUE TO LACK OF INFRASTRUCTURE AND (PRIVATE) TRANSPORT MEANS
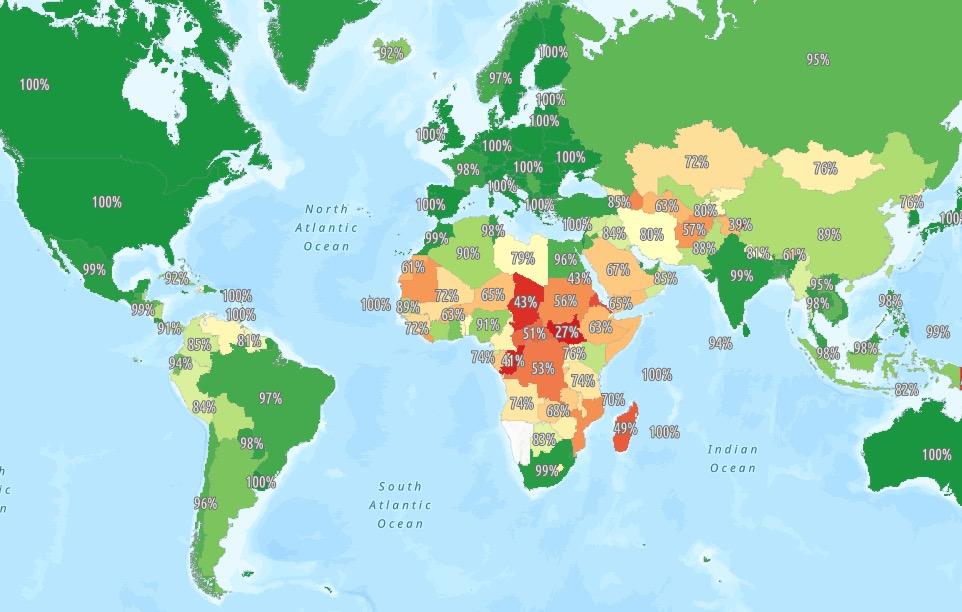
Weiss et al. (2018) assess travel times to cities and inequalities in these access times. From this exercise, they observe that 91% of people in high income countries live within one hour of a city. These are concentrated in North America and Europe. Only 51% of people in low-income countries live within one hour of a city. These are concentrated in SubSaharan Africa. Figure 2 illustrates this. The authors find a link between higher household wealth and greater accessibility to population centres.
Figure 2.9: Global map of travel time to cities for 2015 (spatial resolution 1*1km – travel time to city with shortest journey)
Source: Weiss et al. (2018) on resourcewatch.org – shared under https://creativecommons.org/licenses/by/4.0/ - no changes made
Figure 2.10: RAI, rural accessibility index by country 2022-2023, share of population living within 2 km of a road
Source: UN Sustainable Development Solutions Network (n.d.)
Before Weiss et al., Linard et al. (2012) already pointed to the importance of transport infrastructure and transport means to access cities, and the lack of it. Average travel distance to a settlement of more than 50 000 inhabitants is around 3.5 hours, they found. Central and East Africa displayed the longest distances. The Rural Access Indicator (RAI) developed by the World Bank (Transport & ICT, 2016) demonstrates the high correlation between poverty and low road accessibility.
The RAI measures the share of population living within 2 km of the nearest road in good condition. The RAI measure is illustrated in Figure 2.
In Sub-Saharan Africa, the rural accessibility index is worst and rural travel times are longest. Pedestrian travel dominates. In these areas, bicycles, motorcycles or (shared) cars, minibuses, buses can be an alternative to walking, although bicycles and motorcycles can still be too costly. With the arrival of cheap machines from China and India motorcycles are expanding rapidly in remote areas, once again illustrating how important people judge the possession and use of a private motorised mean of transport.
Motorcycles bring also employment opportunities for many young men in remote areas. They hire a motorcycle from an inhabitant from the city and offer transport services against payment. Adequate regulation is furthermore important in order to limit the casualties from accidents.(Porter, 2021)
The exploitation of (mini) buses will often not be profitable. Levels of wear and tear and accompanying costs are extremely high.
TRANSPORT (INFRASTRUCTURE), AN IMPORTANT ENGINE FOR ECONOMIC DEVELOPMENT
As already mentioned above Transport allows better (labour) market access. Improvements in access to the labour market are related to reduction in the share of agricultural workers and increases in the share of service sector workers in the global south.
Below we provide some examples of the importance of transport (infrastructure) in the Global South for economic development.
India
The Indian travel survey teaches us that people in richer states travel longer trips and use more automobiles. Although car modal shares are only significant in the richest states. Note that no travel to work (working from home), bicycle and foot as modes are highest in the rural areas, while motorised two and four wheelers are most frequent in urban areas (Tiwari & Nishant, 2018). The travel survey does not establish any causal link.
Vietnam
JungEun Oh (2022) illustrates how important infrastructure to provide market access to off-farm opportunities in lagging areas in Vietnam. It also provides higher wage participation by women. Thanks to expansion of the road network, access to major urban areas and international gateways have been improved. Consequently, domestic trade increased thanks to travel time reductions. Simulations on further development of rail and/or road infrastructure showed that national income would further rise.
Connectivity plays a significant role in improving job opportunities for the poorer and more remote localities in Vietnam, including through helping them overcome the disadvantages associated with low population density. To maximize the benefits of connectivity improvement, however, complementary policies on education, farming system, and health are needed to improve access to jobs for ethnic minorities
Mannava et al. (2020) illustrates from other studies that important investments in road infrastructure in Vietnam (1 trillion US$ annually) play an important role in crop diversification and a higher educational enrolment. Extra policies, beyond only infrastructure policies, are, however, necessary to address the gender bias.
Africa
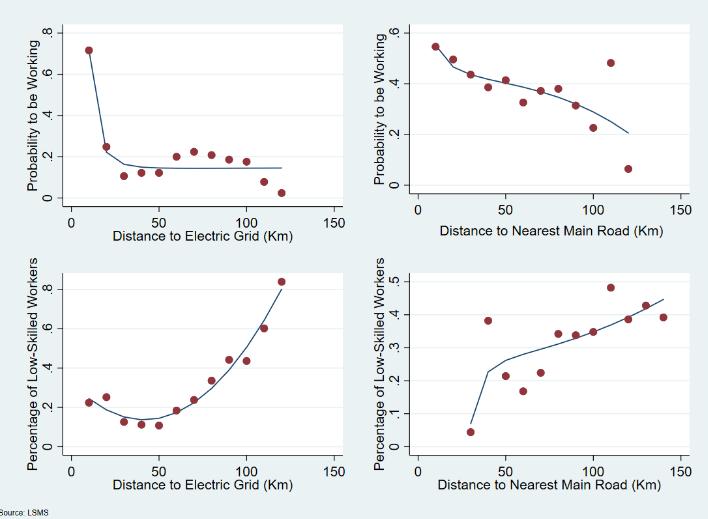
By coupling changes in Africa’s main roads (and electricity network) between 1971 and 2003 and employment, it can be seen that proximity to a main road increases the probability of working and reduces the share of non-skilled workers (Abbasi et al., 2022). Every km closer to a main road increases probability of having a job by 2.1 to 2.6 %. Roads provide extra access to markets for production, although exposes to more competition. Figure 2.11 illustrates this.
Figure 2.11: Correlation between distance -nearest road (to electric grid) and probability of working – share of low skilled workers.
Source: Abbasi et al. (2022)
Fiorini & Sanfilippo (2022) illustrate the positive impact on the economy of the building of road infrastructure in Ethiopia. Graham (2020) illustrates this for the building of road and rail infrastructure in Ghana. Most benefits come from the transport of goods, but also passenger transport provides benefits.
2.3 NON-USE VALUE
The non-use value of private transport refers to the fact that having a car/motorcycle provides value beyond the use value.
Different authors have been investigating the topic. We provide below the conclusions of Soza-Parra and Cats (2023) who analysed a selection of 54 papers on the topic.
Based on their review they find five subjective factors determining car ownership, that we reduce to four. These are:
• Instrumental motives & autonomy
This can be defined as the sense of control over one’s life, autonomy, freedom to use when desired, a higher comfort compared to other modes, safety, convenience like lack of access and waiting times
• Expression of emotions - Affective dimension
This factor concerns the emotions associated with driving. It is expressed by statements like, “driving is fun”, “I love my car”, etc. People using the car more are generally more positive on the affective dimension. It is also found that this dimension is passed or inherited from parents to children.
• Status expression
Social status has to do with the fact that people place themselves as successful individuals. The car is a symbol and image of progress and success. Men generally attach a higher value to it than women. For younger people, owing a car can be linked to ideas as adulthood, freedom and financial independence.
• Social norms expression – “being normal”
Social norms are habits people consider normal and generally accepted (or disapproved – not normal). The more normal someone considers buying a car, the higher the probability he does so. Often, a person not having a car is considered deprived. As a special social norm, we consider the environment, unlike the authors who consider it a fifth factor. They understand under the environmental factor a set of subjective variables linked with attention for the environment. This set replaces for some social groups more traditional social norms where car ownership is more normal. Car-free lifestyles are for example associated with people having an environmental value set.
Steg et al. (2001) and Steg (2005) point to the importance of non-instrumental motives for car use based on surveys in the Netherlands. Especially frequent drivers, people with a positive car attitude, male and young respondents value these non-instrumental motives for car use.
Moody et al. (2021) calculated the monetary value of car ownership in the US. The estimated average value is US$11 200/year. The largest part of the value is the non-use value. Control, reliability, certainty, flexibility procured by car ownership are the main dimensions of it. The fact of owning a car provides more value than using it, they find. She remarks that the value could be overestimated due to the endowment effect. The endowment effect is the effect by which people give a higher value to a similar object when they already have it than when they need to acquire it. They observed furthermore that car value was higher for rural residents, lower if alternatives were available. Car value was also systematically higher evaluated than car ownership alternatives like public transport or ride hailing. During the COVID-19 pandemic period the estimated car value more than tripled probably due to the uncertainty the period brought with it. They also observed that the car valuation is well above the average household spending on the car of US$ 9 300/year. In economic terms, we can say that people get, on average, more utility of their ownership, than the utility they pay for.
03 STRONG REVEALED PREFERENCE FOR PRIVATE CAR AND MOTORCYCLE TRANSPORT
MAIN MESSAGES
• Estimates of the total benefits from car travel are few, but they indicate that the benefits can be substantial.
• Household spending reveals high preference for private transport, even though this is only lower bound for consumer value.
• The continued growth of the global car/motorcycle stock underlines the attractiveness of these modes within the current transport system.
• The revealed preferences for car transport are strong. Where incomes rise and constraints are modest, people rapidly adopt cars, with motorcycles as a first step. However, the attractiveness of these modes is context dependent.
3.1 INTRODUCTION
What is the value of private transport for car/motorcycle users? Economic theory offers useful concepts for determining this value, as will be explained in Section 3.2. However, the number of studies that used this approach to quantify the total consumer value of private transport is very limited. Therefore, alternative measures will be presented, building on data from household surveys, and other observations on the choices made by people. For this we use publicly available data and findings from previous studies. In general, we note that data and studies for the middle- and low-income countries are more difficult to find, such that they can be covered only to some extent in this chapter.
3.2 USEFUL CONCEPTS FROM ECONOMIC THEORY
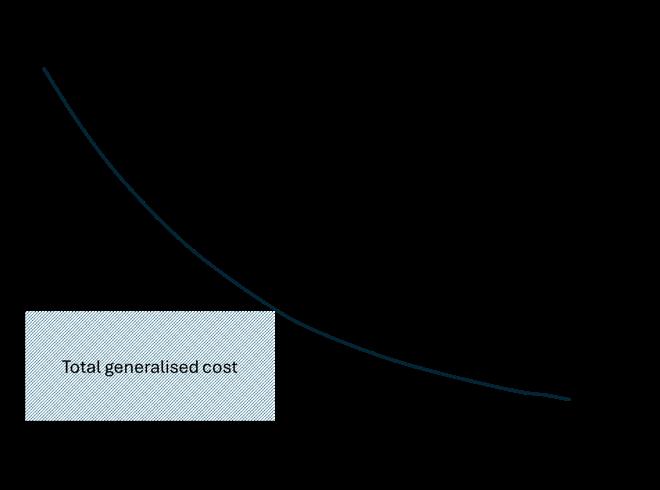
According to economic theory the benefits of car travel can be quantified by looking at how much people appear to value car travel in monetary terms. The following graph gives a schematic overview of how the benefits of car travel can be derived. The curved line is the demand curve. It represents how much people are willing to travel by car at any given cost per km (when read from the vertical axis to the horizontal axis). Alternatively, it can be seen to describe how much people value each additional car km, on top of the km they already travel (when read from the horizontal axis to the vertical axis). The demand curve slopes downward to the right, because each additional kilometre would be expected to be less valuable than the previous kilometres travelled. For example, in a world with no car travel, the ability to travel a few hundred kilometres per year would be highly valuable to most people. On the other hand, people already driving, for example, 20 000 kilometres per year, might not find a few more kilometres of driving particularly valuable. After all, they would have used their first 20 000 kilometres of travel to make trips that they considered more important than the trip they would make with the next few kilometres of travel.
Figure 3.1 Measuring the benefits of car travel
The shaded area in the graph represents what people spend on car travel, including purchase and maintenance of cars, fuel, tolls (if any), parking and taxes. It also includes their time costs. Hence, the term “generalized cost” is used. The total cost equals the cost per km multiplied by the total kilometres travelled and is represented by the shaded area
8. The concept of consumer surplus may seem abstract, but it represents real value that people derive from the goods and services they buy. Consider the following example for gasoline. Suppose a liter of gasoline normally costs €1.6. At a higher price, people would on average buy less fuel. Even so, many people would still buy gasoline at a price that is 25% higher. This means that per liter they can buy at €1.6 they realize consumer surplus of at least 40 €cents per liter, and their total consumer value from gasoline consumption is at least €2 per liter. Some people would also be willing to pay double the price or more (e.g. people who use their car for professional purposes, people with more financial means, …). This means that these people can realize consumer surplus of at least €1.6 per liter when gasoline is sold at €1.6 per liter, and the total value to this group is at least €3.2 per liter.
9.Value of £ 5800 in price level of 2000 (Fouquet, 2018) converted into £ in price level of 2025 based on Bank of England (n.d.)
in the graph. The benefits of car travel are at least as large as these total costs. Indeed, people would not be willing to bear these costs if the benefits of car travel do not at least equal the costs of obtaining those benefits.
However, the full benefits are larger than this. The difference between the cost consumers actually pay (in money and in time) for a good and the value to them of that good is known as the consumer surplus 8. The total benefit of car travel equals the sum of the costs paid and the consumer surplus (the total area under the demand curve up to the observed level of car travel). Moreover, it could represent a large part of the total benefits.
3.3 ESTIMATES OF CONSUMER VALUES BASED ON CONSUMER SURPLUS
ESTIMATES
OF THE TOTAL
BENEFITS FROM CAR TRAVEL ARE FEW, BUT THEY INDICATE THAT THE BENEFITS CAN BE SUBSTANTIAL
Estimates of the total benefits from car travel are not widely available. One notable exception is a study for the UK. Fouquet (2018) estimated the consumer surplus derived from passenger transport, alongside that from domestic heating and lighting, for the period 1800-2010, using an approach that also accounts for the high willingness-to-pay at low consumption levels. In this exercise he only took into account the monetary costs and not the time costs. The next graph gives his estimate of the evolution of the consumer surplus from passenger transport, as percentage of gross domestic product (GDP). In 2010, this was equivalent to somewhat more than 25% of GDP, with the main value (the equivalent of +/- 22% of GDP) generated by car transport. This is somewhat lower than the peak of 30% of GDP reached in the 1960s and 1970s. In 2010 the average consumer received the equivalent of £ 11 128 in net utility from transport 9. This means that the average consumer would be willing to spend this amount in addition to his/her consumer expenditure to keep his/her consumption of these services. According to Fouquet 80% of this consumer surplus would be the result of the first 10% of passenger travel (the first 1200 km). Car travel has made possible a further increase in the consumer surplus (as % of GDP) from personal travel, compared to the period prior to its more widespread use. This increase reflects the change in societies and lifestyles that car mobility made possible. However, after a peak in consumer surplus in the 1960s and 1970s it settled to somewhat more than 25% of GDP in 2010.
Figure 3.2 Consumer surplus from passenger transport in the UK, per mode of travel – 1830-2010, as % of GDP
Source: Part b of Figure 5 in Fouquet (2018) – shared under Creative Commons Attribution License (CC-BY) – no changes made
Other studies give insight in the consumer surplus for specific segments/aspects of private car travel.
• Cohen et al. (2016) calculated the consumer surplus for a particular segment of car travel, namely Uber trips in the US, based on detailed trip data for 2015. The demand function for this market segment was found to be quite inelastic, resulting in a large value of the consumer surplus. For each dollar spent on Uber travel, Uber customers realized on average 1.6 dollar of consumer surplus.
• Bronmann et al. (2025) consider the value accorded by German car owners to social car status, compared to the cars of one’s neighbours, friends, acquaintances, and colleagues. The willingness to pay for an increase in social car status compared to other people was found to be between €786 and €1479. According to the authors, the value consumers place on achieving a higher social standing via their car choice represents roughly 0.14–0.21% of the revenue carmakers receive from vehicle sales in Germany. If consumers were indifferent to their social rank, car manufacturers would need to reduce their prices.
• In an exercise to determine optimal toll levels for the Paris metropolitan area, Durrmeyer and Martínez (2024) take into account different impacts of the tolls, including the impact on consumer surplus of the car drivers, which is the focus of this section.
Figure 3.3 Loss in consumer surplus associated with reductions in distance driven at peak hours (left) and all day (right) – Paris metropolitan area, 3 types of policies
Source: Extract from Figure 3 and Figure 20 in Durrmeyer & Martínez (2024)
Logically, the estimated loss in consumer surplus increases with the percentage reduction in distance driven. If no traffic would be allowed anymore during the peak hours, the loss in consumer surplus would be somewhat more than €7 million per day. If no traffic would be allowed all day, the estimated loss in consumer surplus would be somewhat more than €12 million per day. For lower travel reductions the magnitude of the loss varies according to the type of policy instruments that is used. For policy instruments that allow no or little flexibility in the way one can respond (such as driving restrictions) or that need to be set very high to achieve the travel reduction (such as the uniform toll) the loss is higher than for the variable toll. Durrmeyer and Martínez (2024) use these estimates to see how welfare can be improved most by intervening in this market, considering also the other effects of the policies, for which they take into account the environmental benefits and toll revenues. They find the highest improvement in welfare with a variable toll that leads to a reduction in (peak) traffic by somewhat more than 20%.
IN MANY CASES, STUDIES DO NOT COMPUTE TOTAL CONSUMER SURPLUS FROM (CAR) TRANSPORT, BUT CHANGES IN CONSUMER SURPLUS RELATED TO A POLICY INTERVENTION SUCH AS AN INFRASTRUCTURE PROJECT, OR A CHANGE IN TRANSPORT TAXES/SUBSIDIES.
Examples include the following studies:
• For the region of Flanders in Belgium Heyndrickx et al. (2019) studied differentiated road pricing. With an increase in the generalized costs of car travel in the peak period by 18% in 2030 consumer surplus from car travel in the six hours of the peak would decrease by €2024 2.2 billion annually. An increase of the generalized costs by 8% in the off-peak would decrease consumer surplus by €2016 2.0 billion annually. This would correspond with approx. €2024315 and €2024290 per inhabitant.
• Sabal (2025) considers the impact on consumer surplus of car buyers of US trade policies. A 20% US production subsidy for US car brands is estimated to result in large minimum gains in consumer surplus throughout many countries,
with gains in consumer surplus of over 8% in the United States, Mexico, or Brazil, and minimum gains greater than 3% in India. Another policy studied in the same analysis is a 50% US consumption subsidy on products offered by US brands. This would result in a large minimum increase in consumer surplus in the United States of over 42%, while in other countries would only have small effects.
• In an overview of social cost-benefit analyses for infrastructure projects in the Netherlands and the region of Flanders in Belgium for the period 2010-2024, Bothof et al. (2025) find that the change in consumer surplus due to travel time savings and improved reliability on average accounts for 45% of the total monetized values in the reviewed cost-benefit analyses. According to the authors most transport investments in these two regions therefore do not specifically target sustainability issues but focus on travel time savings, or the social cost benefit analyses do not sufficiently reflect the sustainability considerations.
3.4 REVEALED PREFERENCES
Due to the unavailability of consumer surplus estimates for a wider range of countries/regions, we therefore need to resort to indirect measures, more specifically regarding the preferences revealed by the choices actually made by people.
HOUSEHOLD SPENDING REVEALS HIGH PREFERENCE FOR PRIVATE TRANSPORT, EVEN THOUGH THIS IS ONLY LOWER BOUND FOR CONSUMER VALUE
Data on spending on private transport are more generally available than studies on the full benefits of car travel. As discussed before, they can serve as a lower bound for the consumer value of private travel. Indeed, people would not be willing to spend this part of their income on car travel, if its benefits are not at least as high as these costs. It is however only a lower bound for two reasons: the indicator only covers the monetary costs and not the time costs, and it does not give information on the consumer surplus.
The following figures present information collected in household budget surveys on the share of car travel in household spending. For example, according to the household budget survey round of 2015 10 the share of private transport in consumption expenditures in the EU27 ranged between 4% and 17%, as presented in Figure 3.4. These are substantial shares, revealing the consumer value of private travel. The countries are ordered in terms of their median equivalised disposable income per capita, in purchasing power standard (PPS) in 2015 11, 12. In general, the share increases with the income level up to a certain level, a relationship that will be discussed further below.
10. Eurostat also presents data from household budget surveys carried out by EU Member States in the approximate period 2020. Given that household spending in that period is likely to be affected by the COVID-19 pandemic and that the next Eurostat reporting is only scheduled for 2026, it was chosen to report the data for 2015.
11. Eurostat explains this concept as follows: “To consider differences in household size and composition and thus enable comparisons of income levels across countries and population groups, the concept of equivalised disposable income is used. This measure is based on the total net (also referred to as disposable) household income divided by the number of ’equivalent adults’ in the household, using a standard (equivalence) scale. Eurostat employs the ’modified OECD scale’, which assigns a weight of 1.0 to the household head, 0.5 to each additional adult (aged 14 and over), and 0.3 to each child (aged under 14). The weights are summed to calculate an equivalised household size, which is then used to divide the total household income and determine the equivalised disposable income attributed to each household member.”
Regarding purchasing power parities: “PPP is the technical term used by Eurostat for the common currency in which national accounts aggregates are expressed when adjusted for price level differences using PPPs.”
Source: (Eurostat, n.d., 2024a)
12. In 2015 the median equivalised income per capita ranged between € 4357 PPS for Romania and € 29 285 PPS for Luxemburg, with the median value for the EU-27 at €15 641 PPS. Not corrected for the differences in the cost of living, these incomes are respectively € 2 315, € 35 270 and € 15 422.
Figure 3.4 Share of private transport in consumption expenditures in EU27 Member States in 2015
Note: The countries are ordered according to their median net equivalised income in PPS per capita in 2015. EU27 refers to the EU 27 Member States as from 2020.
Source: TML on the basis of Eurostat indicators ilc_di03 (median equivalised net income per capita in PPS, data for 2015) and hbs_str_211 (Structure of consumption expenditure by COICOP consumption purpose, data for 2015)
Figure 3 presents similar information for a number of non-EU countries, with an indication of the year for which the data are collected, and with varying levels of detail for the transport services covered. Also in these cases a non-negligible part of household spending is devoted to (private) transport services.
Figure 3.5 Share of transport in consumption expenditures – selection of nonEU countries (with indication of year)
Source: TML on the basis of Eurostat indicator hbs_str_211, OECD Data Explorer (Annual household final consumption expenditure by purpose (COICOP) (OECD, 2025)), Instituto Brasileiro de Geografia e Estatística - IBGE (2019), Instituto Nacional de Estadistica - Chile (n.d.), BPS-Statistics Indonesia (2025), Statistics bureau of Japan (2025), Instituto Nacional de Estadística y Geografía (2025), Statistics South Africa (2025), National Bureau of Statistics of China (2025), Statistics Canada (2025)
As indicated by Fouquet (2018), Hausman (1997) presents an approach to estimate the consumer surplus as a function of the share of consumer expenditure and the price elasticity of demand, with the following formula. CSg (pg.qg)/y y =0.5.
ε g p | |
It calculates consumer surplus for good g (CSg) as a share of spending ( y). pg and qg stand for the price and quantity of the good, and is the own price elasticity of good g. The latter parameter is an indicator of the price sensitivity of the good. For example, Fouquet (2018) assumes a price elasticity of – 0.5 for private transport. This indicates that an increase in the price of private transport by 10% leads to a reduction in demand by 5%.
For example, according to the Hausman formula, for a good with an own price elasticity of –0.5 and a 12% share in household spending (corresponding with, for example, the share of private transport in household spending in Germany), the consumer surplus would then correspond with 12 % of household spending, and the total benefit from consuming the good would be equivalent to 24 % of total household spending, or double the observed spending share. With a lower elasticity this estimate of total value would increase and with a higher elasticity it would decrease. However, this approach only gives a good approximation of the consumer surplus for cases where a linear demand function is appropriate. In the case of transport, the demand function displays more curvature. Using the Hausman approach also still underestimates the consumer surplus, as it does not capture the high willingness to pay for car travel at low demand level. It also does not consider the generalized costs of travel, but only the monetary costs.
THE CONTINUED GROWTH OF THE GLOBAL CAR/MOTORCYCLE STOCK UNDERLINES THE ATTRACTIVENESS OF THESE MODES
In the period between 2000 and 2018 there was a substantial increase in the fleet of passenger cars and motorcycles. In 2018 the number of passenger cars was 1.9 times larger than in 2000, and the number of motorcycles 2.9 times larger (Gorham et al., 2022). Since 2018 these numbers have grown further, as is shown in the following graph. The number of passenger cars increased further by approx. 15% in this period and the number of motorcycles by 23%.
Figure 3.6 Number of passenger cars and motorcycles in use by income level – 2018-2023
Note: The data cover the countries for which the data sources contain information on the passenger cars and motorcycles in use in 2018 and 2023. For countries for which the data for 2023 were missing, but those for 2022 were available, the vehicle stock in 2023 has been approximated by that of 2022. Depending on the year and vehicle type, the country set covers 81-83% of the world population .
Source: TML, based on Eurostat, OECD Data explorer, IRF World Road Statistics, ASEAN Statistics Web Portal and World Bank classification of countries by income group
In 2000-2018 the number of passenger cars grew especially in upper-middle income and lower middle-income countries. In 2018 the number of passenger cars in these countries was resp. 4 and 3.3 times larger than in 2000. For motorcycles the highest growth was recorded in low income countries, with a factor 6, followed by lower middle income countries, with a factor 4.8 (Gorham et al., 2022). Between 2018 and 2013 these trends continued, as can be seen in Table 3 1.
Table 3-1 Change in the number of passenger cars and motorcycles by income level, 2018-2023
Note: The data cover the countries for which the data sources contain information on the passenger cars and motorcycles in use in 2018 and 2023. For countries for which the data for 2023 were missing, but those for 2022 were available, the vehicle stock in 2023 has been approximated by that of 2022. Depending on the year and vehicle type, the country set covers 81-83% of the world population.
Source: TML, based on Eurostat, OECD Data explorer, IRF World Road Statistics, ASEAN Statistics Web Portal and World Bank Classification of countries by income group
13. For passenger cars the dataset contains in total 132 countries, of which 63 high income countries, 36 upper middle-income countries, 23 lower middleincome countries and 9 low-income countries. The dataset for motorcycles covers 128 countries, of which 62 high-income countries, 36 upper middle-income countries, 22 lower middle-income countries and 7 low-income countries. In general, the data coverage is more limited for the two lowest income groups.
These evolutions have resulted in an increase of the number of passenger cars and motorcycles per capita. In 2023 there were on average 190 passenger cars per 1000 people at global level, and 110 motorcycles per 1000 people, up from resp. 170 and 91 in 2018. The highest increase in the motorization rates took place in the lower to upper middle-income countries, as is shown in the table and graph below.
Figure 3.7 Passenger cars and motorcycles per 1000 population, by income level – 2018-2023
Note: The data cover the countries for which the data sources contain information on the passenger cars and motorcycles in use in 2018 and 2023. For countries for which the data for 2023 were missing, but those for 2022 were available, the vehicle stock in 2023 has been approximated by that of 2022. Depending on the year and vehicle type the country set covers 81-83% of the world population.
Source: TML, based on Eurostat, OECD Data explorer, IRF World Road Statistics, ASEAN Statistics Web Portal and World Bank Classification of countries by income group
Table 3-2 Passenger cars and motorcycles per 1000 population, by income level – 2023, and % increase compared to 2018
Note: The data cover the countries for which the data sources contain information on the passenger cars and motorcycles in use in 2018 and 2023. For countries for which the data for 2023 were missing, but those for 2022 were available, the vehicle stock in 2023 has been approximated by that of 2022. Depending on the year and vehicle type the country set includes 81-83% of the world population.
Source: TML, based on Eurostat, OECD Data explorer, IRF World Road Statistics, ASEAN Statistics Web Portal and World Bank classification of countries by income group
THE REVEALED PREFERENCES FOR CAR TRANSPORT ARE STRONG. WHERE INCOMES RISE AND CONSTRAINTS ARE MODEST, PEOPLE RAPIDLY ADOPT CARS, WITH MOTORCYCLES AS A FIRST STEP. HOWEVER, THE ATTRACTIVENESS OF THESE MODES IS CONTEXT DEPENDENT.
One of the factors affecting the motorization rate is income. The next graph, based on data for 120 countries in 2018
and 2023, confirms that GDP per capita shows a clear, moderately strong correlation with the number of passenger cars in use, as was also found by Gorham et al (2022) for the period 2000-2018. As people grow richer, therefore they are more likely to own a car, reflecting the attractiveness of the transport services that can be offered by that vehicle. In countries in the lower income group motorcycles also play a role in this motorization trend.
Figure 3.8 Number of passenger cars per 1000 population versus GDP per capita
Note: The data cover the countries for which the data sources contain information on the passenger cars and motorcycles in use in 2018 and 2023. For countries for which the data for 2023 were missing, but those for 2022 were available, the vehicle stock in 2023 has been approximated by that of 2022. Depending on the year and vehicle type the country set includes 81-83% of the world population.
GDP = Gross Domestic Product; PPP = purchasing power parities 14
Source: TML, based on Eurostat, OECD Data explorer, IRF World Road statistics, ASEAN Statistics Web Portal and World Bank, applying methodology of Gorham et al. (2022) to data for 2018-2023.
A number of studies use an S-shaped relation (Gompertz function) to describe the relationship between vehicle ownership/ car mobility and GDP per capita across countries and over time: very low at low incomes, a steep middle phase as countries pass through middle-income levels and saturation at high incomes. While it can be applied to model both the evolution of car ownership and car travel, Seum et al. (2019) point out that the relationship between vehicle km travelled and GDP per capita is generally stronger than that between motorization and GDP per capita. Early studies (e.g. Dargay et al. (2007)) considered the same saturation levels across countries, whereas more recent studies take into account that the saturation levels can differ depending on the context.
The following graph shows an example of the S-shaped relationship as fitted by Seum et al. (2019) for vehicle kilometres travelled in four developed economies based on data for the period 1900-2016/2017. The forecasted saturation levels differ across the four economies.
14.
Figure 3.9 Vehicle kilometres travelled versus GDP per capita PPP – Australia, Germany, Japan, US – analysis by Seum et al. (2019)
Source: Figure 1.1 in Seum et al. (2019) – reproduced with permission
To understand these differences, Seum et al. (2019) consider first of all general factors not specifically related to the transport system: the socio-economic characteristics of the population (age distribution, workforce participation), land use (share of urban population, population density in urban areas), the presence of a domestic car industry and the presence of a car culture. Next to this, they point to the role played by characteristics of the transport system: the quantity and quality of road infrastructure, the quality of alternative modes of transport (infrastructure, frequency, price, speed, etc.), the cost of driving relative to income, the presence of policies positively affecting car ownership and use (taxation, subsidies, etc.). In the period up to 2016/2017, in the US and Australia, they all supported a higher uptake of automobility, though to a different extent in the two countries. For Germany and Japan, the factors somewhat counteracted each other in this period, leading to lower forecast saturation levels. Similarly, De Silva et al. (2022) find that population density, the share of public transport, household size and the share of female drivers to have an impact on the saturation levels.
For a selection of BRICS countries, Seum et al. (2019) project the following saturation levels for vehicle km per capita, with differences in the period in which these saturation levels would be reached: 5700-6500 in India (mid 2060s), 6000-6700 in China (early 2030s), 9900-10200 in Brazil (late 2050s) and 12700 in South Africa (late 2050s). In India and China some of the factors mitigating the demand for automobility are estimated to be strong, while in South Africa most factors support a larger car use, and Brazil is in between.
To summarise this section, the indicators presented above show that the revealed preferences for car transport are strong. Where incomes rise and constraints are modest, people rapidly adopt cars. However, the attractiveness of cars is context dependent, depending on both general factors (socio-economic composition of the population, land use, presence of domestic car industry, pro car attitude) and characteristics of the transport system (presence of good substitutes for car transport, cost of car transport, transport policy). In emerging economies two-wheelers provide a more affordable private mobility pathway before more widespread car ownership. Their prevalence in emerging economies signals a high attractiveness of individual motorised travel even when car ownership metrics remain low.
04 FUTURE EVOLUTIONS ARE LIKELY TO AFFECT THE PRIVATE USER BENEFITS OF CAR/MOTORCYCLE TRAVEL
The previous chapters have highlighted the private benefits from motorised road transport by car and motorcycle. Looking ahead, several key evolutions could affect this value: the rise of new mobility services and technologies, the growing problem of congestion associated with widespread vehicle use, and changes in land use and transport policies that alter the costs and attractiveness of different travel modes.
NEW MOBILITY SERVICES AND TECHNOLOGICAL CHANGE
Innovative mobility options are emerging that could diminish the central role of privately owned cars and motorcycles. New mobility services – such as ride-hailing (e.g. Uber, Grab), carsharing, bike and e-scooter sharing, and Mobility-asa-Service platforms – offer travellers alternatives to owning a vehicle. So far, these services still serve a limited clientele. However, consumer attitudes could change. For example, in a global survey taken by McKinsey in 2022 (Heineke et al., 2023), almost one-third of respondents plan to increase use of micromobility (e-bikes, scooters) or shared mobility in the next decade, and nearly half are open to replacing their private vehicles with other transport modes. The desire for a more convenient and enjoyable travel experience and sustainability concerns are contributing factors for these responses.
Looking further ahead, autonomous vehicle technology may support the uptake of these new services. Self-driving cars and shuttles could enable on-demand robotaxis, autonomous minibuses, or “robo-shuttles” that provide door-to-door service without a human driver. If deployed in shared fleets, autonomous vehicles might dramatically improve mobility options while reducing the need to own a car or motorcycle (EEA, 2022). For example, shared autonomous shuttles could attract even car owners – Heineke et al. (2023) report that in the McKinsey survey 70% of people are willing to use a shared autonomous shuttle, and importantly, nearly half of such trips would otherwise have been taken with a private car. This suggests that a well-implemented autonomous vehicle service can draw travellers away from personal vehicles.
Crucially, public acceptance of these new services will rely on factors like trust, safety, and perceived usefulness. A metaanalysis by Adnan (2024) identifies determinants of autonomous vehicle adoption such as user trust in the technology, perceived benefits, social influence, and attitudes toward safety. If consumers lack confidence in autonomous or shared services, they will continue to value the control and familiarity of personal cars and motorcycles. Conversely, if new mobility options prove to be safe, reliable, and cost-effective, they stand to substantially diminish the benefit that owning a private vehicle now offers.
However, whether these technologies actually decrease private vehicle use (and thus reduce the “value” of owning a personal car) will depend heavily on implementation and policy. Galich & Stark (2021) find a paradox: automation could make private car ownership more attractive for many (by making driving easier and accessible to new groups, such as those unable to drive today), or it could enable new mobility business models that reduce ownership – it “depends heavily on the concrete implementation”. Their focus group research indicated that current car owners might be even more inclined to keep a car if it is self-driving, and new users might join them, unless convenient shared autonomous vehicle services become a viable alternative. In short, autonomous technologies alone will not automatically erode the value of private cars and could even reinforce car-centric habits. This will depend on the attractiveness of the mobility services offered as well as on policies.
CONGESTION LEADS TO DIMINISHING BENEFITS OF CAR AND MOTORCYCLE TRAVEL
A phenomenon that clearly affects the value proposition of private motorised travel is the intensifying problem of traffic congestion. The very success of cars and motorcycles – in terms of adoption – also leads to growing congestion problems, reducing speed and increasing time costs of personal vehicles compared to other modes. The extent of the problem is
illustrated, for example, by the Traffic Index published by TomTom for 501 cities worldwide, from which the following table presents the ten most congested cities in 2024.
Figure 4.1 Ranking of the world’s most congested cities in 2024 according to TomTom
Note: The TomTom congestion level indicator presents for all routes surveyed throughout the year on the entire road network, the average percentage increase in journey times compared to free-flow traffic
Source: TomTom (2025)
From a transport economics perspective, travel time has a high opportunity cost. Travelers typically value their travel time, since time spent traveling could be spent working or at leisure. For instance, the Dutch Knowledge Centre for Mobility reports for the Netherlands an average value of €10.42/h for car travel (Knoope, 2023). This means that if congestion causes a trip to take an extra hour, a typical car user perceives roughly an equivalent of €10.4 (in that context) of lost utility. When multiplied over all trips and hours, the loss in user benefits due to congestion can be large. Moreover, congestion does not just slow trips – it also leads to unpredictable arrival times, with travellers building in “buffer time” or risk being late. Thus, as congestion grows, this loss in reliability will erode the attractiveness of driving. Motorcycles have often been seen as a partial solution to congestion for individuals, since two-wheelers can filter between lanes and require less space. This agility is part of the value proposition of motorcycles. Yet on a large scale, if everyone turns to motorcycles, congestion still results. Therefore, as congestion worsens, the traditional advantage of both cars and motorcycles – getting you somewhere fast, whenever you choose – and the associated benefits that were discussed in the previous chapters, can be projected to diminish.
Future developments could alleviate or aggravate congestion, further influencing the value of private transport. On the one hand, technologies like vehicle connectivity, real-time navigation, and autonomous driving promise more efficient traffic flow (platooning, optimized routing) which could reduce congestion delays. A greater degree of vehicle autonomy may also reduce the value of time, as in-vehicle time could be experienced differently than in the case of conventional car trips (Huda et al., 2023). On the other hand, these same advancements might encourage more driving, leading to longer travel times – for example, with autonomous cars making car trips more attractive and broadening its use base.
FUTURE CHANGES IN LAND USE AND TRANSPORT POLICIES MAY ALTER THE COSTS AND ATTRACTIVENESS OF PRIVATE TRANSPORT MODES
The private benefits described in the previous chapters are the ones that are obtained in the current policy context. However, if policymakers would put in place more policies that make private transport less of a default choice and other modes more attractive, transport and land use policies can significantly alter the relative user value of the services private cars and motorcycles offer.
The transport sector is facing many challenges, in terms of infrastructure needs, congestion, the environmental costs of transport and the need for improved transport safety. Emerging technologies and mobility services offer new potential. Within this context, new policies or changes in the current policy framework are likely in the future. Such policies are also likely to affect the future private user benefits of cars and motorcycles. Policymakers have two broad transport policy levers: policies that affect the cost and convenience of private transport, and policies that improve the attractiveness of
alternative modes. Both levers are already being applied in many regions, aiming at a shift in the balance of personal mobility. In a longer-term perspective, transport policies that improve alternatives also intersect with emerging technologies. For example, cities might integrate autonomous shuttles or ride-pooling services into public transport networks (first/last mile solutions), further reducing the need to use a private car for a complete journey. Land use policy directly complements such transport measures. Decades of research in transport economics and urban planning underscore that land development patterns influence travel behaviour. Sprawling, low-density development virtually requires car use for most trips, enhancing the value of car ownership. Dense, mixed-use development with good public transport, by contrast, enables shorter trips and non-car travel, thereby reducing the necessity and value of a private vehicle.
To summarise this section, the value of the mobility services provided by cars and motorcycles is likely to change in the future. New mobility services and technologies will offer travellers more choices – from ridesharing and micromobility today to autonomous vehicles in the longer run – which reduce car travel’s convenience relative to other means of transport. At the same time, increasing congestion can be expected to reduce the private benefits of private travel by car and motorcycle, and road transport is also causing environmental and traffic safety challenges. If policymakers respond to these societal costs by increasing the cost of private vehicle use through pricing mechanisms such that the societal costs are taken into account in their travel decisions, and making alternative modes more attractive, these policy shifts, alongside smarter land use planning, mean that the advantage of being a driver would be affected relative to other options. Such changes would be gradual and would also vary by region of the world, between (sub)urban and rural regions, or between generations. The ultimate impact on the value of car and motorcycle services will be decided by how technology is harnessed and to what extent policies are enacted to address congestion and to reduce the environmental and accident costs of transport.
05 REFERENCES
Abbasi, M., Lebrand, M., Bluette Mongou, A., Pongou, R., & Zhang, F. (2022). The wider economic benefits of transport investments in Africa (Policy Research Working Paper No. 9976). World Bank Group. Infrastructure Chief Economist Office. https://documents1.worldbank.org/curated/en/970271647884335950/pdf/Roads-Electricity-and-Jobs-Evidenceof-Infrastructure-Complementarity-in-Sub-Saharan-Africa.pdf
Adnan, N. (2024). Exploring the future: A meta-analysis of autonomous vehicle adoption and its impact on urban life and the healthcare sector. Transportation Research Interdisciplinary Perspectives, 26, 101110. https://doi.org/10.1016/j. trip.2024.101110
Aljets, J., & Fischer, B. (2023). Mobilitätsarmut in Deutschland. Annäherung an ein unterschätztes Problem mit Lösungsperspektiven für mehr soziale Teilhabe und Klimaschutz. Agora Verkehrswende. https://www.agora-verkehrswende.de/fileadmin/ Projekte/2023/Mobilitaetsarmut_Diskussionspapier/105_Mobilitaetsarmut.pdf
Amankwah-Amoah, J., Bai, Y., Liu, L., Wang, S., & Zhang, H. (2025). Bridging the gap: How transport infrastructure reduces bilateral trade costs to fuel GDP growth. Journal of Chinese Economic and Business Studies, 23 (2), 295–320.
Baert, L., & Reynaerts, J. (2018). Agglomeration, Congestion and Plant Productivity (Vives Discussion Paper No. 67). VIVES Research Centre for Regional Economics.
Bank of England. (n.d.). Inflation calculator. Retrieved December 2, 2025, from https://www.bankofengland.co.uk/ monetary-policy/inflation/inflation-calculator
Bastiaanssen, J., & Breedijk, M. (2022). Toegang voor iedereen? Een analyse van de (on)bereikbaarheid van voorzieningen en banen in Nederland. https://www.pbl.nl/publicaties/toegang-voor-iedereen
Bastiaanssen, J., Johnson, D., & Lucas, K. (2020). Does transport help people to gain employment? A systematic review and meta-analysis of the empirical evidence. Transport Reviews, 40 (5), 607–628.
Batley et al. (2020). Worthwhile use of travel and time applications in the UK. International Transport Forum.
Boisjoly, G., El-Geneidi, A., & Serra, B. (2021). Avoiding public transport? Assessing the relationship between accessibility, income and commuting mode in Recife, Brazil. In M. Mladenovic, T. Torivonen, E. Willberg, & K. Geurs (Eds.), Transport in Human Scale Cities: NECTAR Series on Transportation and Communications Networks Research (pp. 40–52). Edward Elgar.
Boisjoly, G., Serra, B., Oliveira, G. T., & El-Geneidi, A. (2020). Inequity in transit: Evaluating public transport distribution through accessibility measurements in Sao Paulo, Rio de Janeiro, Curitiba and Recife, Brazil. Journal of Transport Geography, 82, 1–11.
Bothof, S., te Boveldt, G., & Boussauw, K. (2025). Identifying transport policy priorities through a meta-analysis of cost-benefit analysis in the Netherlands and Flanders. Transport Policy, 172, 103765. https://doi.org/10.1016/j.tranpol.2025.103765
BPS Statistics Indonesia. (2025). Consumption expenditure of population of Indonesia September 2024. BPS Statistics Indonesia. www.bps.go.id
Bronnmann, J., Requate, T., & Steinbrunner, P. (2025). Driving desire: Exploring willingness to pay for a higher social status in automobiles. Research in Transportation Economics, 112, 101580. https://doi.org/10.1016/j.retrec.2025.101580
Bundesministerium Landwirtschaft, Ernährung und Heimat. (n.d.). Der Thünen-Landatlas: Karten und Daten zu ländlichen Räumen Deutschlands. [Dataset]. Retrieved April 8, 2025, from https://karten.landatlas.de/
CBS. (2023). Voertuigbezit, kilometers, huishoudens en inkomen. Centraal Bureau voor de Statistiek. https://www.cbs. nl/nl-nl/maatwerk/2023/07/autobezit-en-kilometers-huishoudens-naar-inkomen-2019
Chatterjee, K., Clark, B., Nguyen, A., Wishart, R., Gallop, K., Smith, N., & Tipping, S. (2019). Access to Transport and Life Opportunities. UWE Bristol for Department for Transport.
Cohen, P., Hahn, R., Hall, J., Levitt, S., & Metcalfe, R. (2016). Using Big Data to Estimate Consumer Surplus. The Case of Uber (NBER Working Paper No. 22627). National Bureau of Economic Research.
Conwell, L., Eckert, F., & Mushfiq Mobarak, A. (2023). More roads or public transit? Insights from measuring city-center accessibility (NBER Working Paper No. 30877). NBER.
Dargay, J., Gately, D., & Sommer, M. (2007). Vehicle Ownership and Income Growth, Worldwide: 1960-2030. The Energy Journal, 28 (4), 143–170.
de Almeida Correia, P., Carpio-Pinedo, J., Moya-Gomez, B., & Condeço-Mehorado, A. (2025). Modal Accessibility Gap in Curitiba (Brazil). Dynamic Analysis Considering Time and Spatial Variations. Applied Spatial Analysis and Policy, 18–34.
De Silva, M. M., Kumarage, A. S., Dilini, K. P., & Amalan, T. (2022). Modelling gamma coefficient in the Gompertz curve to determine the variability of vehicle ownership saturation | Journal of South Asian Logistics and Transport. https://doi.org/10.4038/jsalt.v2i2.47
Department for Environment Food & Rural Affairs. (2022). Statistical Digest of Rural England
Durrmeyer, I., & Martínez, N. (2024). The Welfare Consequences of Urban Traffic Regulations (Working Paper No. 1378). Toulouse School of Economics.
EC. (2020). Handbook on the external costs of transport: Version 2019 – 1.1. Publications Office of the European Union. https://data.europa.eu/doi/10.2832/51388
EEA. (2022). Digitalisation in the mobility system: Challenges and opportunities. TERM 2022: Transport and Environment Reporting Mechanism (TERM) report (EEA Report No. 07/2022). European Environment Agency. https://www.eea. europa.eu/publications/transport-and-environment-report-2022/transport-and-environment-report/view
Ettema, D., van Lierop, D., Fu, X., van den Berg, P., & Geigenmüller, I. (2025). What is transport adequacy? Quantifying experienced transport poverty in the Netherlands. Travel Behavior and Society, 39, 100982.
Eurostat. (n.d.). Glossary: Purchasing power standard (PPS). Retrieved April 2, 2025, from https://ec.europa.eu/eurostat/ statistics-explained/index.php?title=Glossary:Purchasing_power_standard_(PPS)
Eurostat. (2024a). Living conditions in Europe—Income distribution and income inequality. https://ec.europa.eu/eurostat/ statistics-explained/index.php?title=Living_conditions_in_Europe_-_income_distribution_and_income_inequality
Eurostat. (2024b). Persons who cannot afford a regular use of public transport by age, sex and income group [Dataset]. https://ec.europa.eu/eurostat/databrowser/view/ilc_mdes13a/default/table?lang=en&category=livcon.ilc.ilc_md.ilc_mdes Eurostat. (2025). People at risk of poverty or social exclusion in 2024. https://ec.europa.eu/eurostat/web/productseurostat-news/w/ddn-20250430-2
Fiorini, M., & Sanfilippo, M. (2022). Roads and Jobs in Ethiopia. The World Bank Economic Review, 36, 999–1020. Fouquet, R. (2018). Consumer Surplus from Energy Transitions. The Energy Journal, 39 (3), 167–188. https://doi. org/10.5547/01956574.39.3.rfou
Freitas, L., Rodrigues, B., Nassar, A., & Veiga, L. (2022). Challenges to Equitable Urban Mobility Management in Brazil. ITDP. Galich, A., & Stark, K. (2021). How will the introduction of automated vehicles impact private car ownership? Case Studies on Transport Policy, 9 (2), 578–589. https://doi.org/10.1016/j.cstp.2021.02.012
Geurs, K., Zondag, B., de Jong, G., & de Bok, M. (2010). Accessibility appraisal of land-use/transport policy strategies: More than just adding up travel-time savings. Transportation Research Part D, 15, 382–393.
Glaeser, E. L., & Kohlhase, J. E. (2004). Cities, regions and the decline of transport costs*. Papers in Regional Science, 83 (1), 197–228. https://doi.org/10.1007/s10110-003-0183-x
Gorham, R., Bose, D., Cordeiro, M., Darido, G., Koupal, J., Krishnan, R., Neki, K., & Qiu, Y. (2022). Motorisation management for development. An integrated approach to improving vehicles for sustainable mobility [Mobility and Transport Connectivity Series]. World Bank Group, Korea Green Growth Trust Fund, GRSF, CITA.
Graham, M. (2020). Rural transport in Ghana. Cost-benefit analysis of road and rail interventions. Copenhagen Consensus Center. Harms et al. (2007). Beleving en beeldvorming van mobiliteit. Kennisinstituut voor Mobiliteit.
Hausman, J. A. (1997). Valuation of New Goods under Perfect and Imperfect Competition. In T. F. Bresnahan & R. J. Gordon (Eds.), The Economics of New Goods (pp. 207–248). University of Chicago Press. https://www.nber.org/ system/files/chapters/c6068/c6068.pdf
Heineke, K., Laverty, N., Möller, T., & Ziegler, F. (2023). The future of mobility in 2035 | McKinsey. Mobility Evolves. https://www.mckinsey.com/industries/automotive-and-assembly/our-insights/the-future-of-mobility-mobility-evolves Heyndrickx, C., Mayeres, I., Van den Bergh, G., & De Ceuster, G. (2019). Uitrol van een systeem van wegenheffing. WP4: Tarificatie. Studie voor Departement Mobiliteit en Openbare Werken. Motivity Consortium.
Huda, F. Y., Currie, G., & Kamruzzaman, Md. (2023). Understanding the value of autonomous vehicles – an empirical meta-synthesis. Transport Reviews, 43 (6), 1058–1082. https://doi.org/10.1080/01441647.2023.2189324
Hugaerts, B. (2024). Bereikbaarheidskaarten De Lijn. Transport & Mobility Leuven.
Infas, DLR, Forschung Mobilität Transport Verkehr, & Infas 360. (2025). Mobilität in Deutschland. Bundesministerium für Verkehr. https://www.mobilitaet-in-deutschland.de/
Instituto Brasileiro de Geografia e Estatística - IBGE. (2019). Pesquisa de Orçamentos familiares 2017-2018. Primeiros resultados. IBGE.
Instituto Nacional de Estadistica - Chile. (n.d.). Encuesta de Presupuestos Familiares. Retrieved November 17, 2025, from http://www.ine.gob.cl/estadisticas/sociales/ingresos-y-gastos/encuesta-de-presupuestos-familiares
Instituto Nacional de Estadística y Geografía. (2025). National Survey of Household Income and Expenditure (ENIGH) 2024. https://en.www.inegi.org.mx/programas/enigh/nc/2024/
International Transport Forum. (2019). Benchmarking accessibility in cities. Measuring the impact of proximity and transport performance (International Transport Forum Policy Papers). OECD/ITF.
JungEun Oh et al. (2022). Mobility and Development. World Bank.
Knoope, M. (2023). Nieuwe waarderingskengetallen voor reistijd, betrouwbaarheid en comfort. Kennisinstituut voor Mobiliteit. https://www.kimnet.nl/documenten/2023/12/04/nieuwe-waarderingskengetallen-voor-reistijd-betrouwbaarheid-en-comfort
Laird, J., & Tveter, E. (2023). Agglomeration and transport appraisal: New developments and research directions. Report for the UK Department for Transport. Peak Economics, Møreforsking.
Liao, Y., Gil, J., Pereira, R. H. M., Yeh, S., & Verendel, V. (2020). Disparities in travel times between car and transit: Spatiotemporal patterns in cities. Scientific Reports. Natureresearch, 10, 4056.
Linard, C., Gilbert, M., Snow, R. W., Noor, A. M., & Tatem, A. J. (2012). Population distribution, settlement, and accessibility across Africa in 2010. PLoS ONE, 7 (2), e31743. https://doi.org/10.1371/journal.pone.0031743
Liu, J., Yue, M., Yu, F., & Tong, Y. (2022). The contribution of tourism mobility to tourism economic growth in China. PLOS ONE, 17 (10), e0275605. https://doi.org/10.1371/journal.pone.0275605
Lunke, E. B., Fearnley, N., & Aarhaug, J. (2021). Public transport competitiveness vs. The car: Impact of relative journey time and service attributes. Research in Transportation Economics, 90, 101098. https://doi.org/10.1016/j.retrec.2021.101098
Mannava, A., Perova, E., & Thi Minh Tran, P. (2020). Who benefits from better roads and why? (Policy Research Working Paper No. 9216). World Bank Group.
Manville, M., Smart, M., & King, D. (2023). The necessity of cars. Transfers Magazine, 1–9.
Mattioli. (2017). “Forced car ownership” in the UK and Germany: Socio-spatial patterns and potential economic stress impacts. Social Inclusion, 5(4), 147–160.
Moody, J., Farr, E., Papagelis, M., & Keith, D. R. (2021). The value of car ownership and use in the United States. Nature Sustainability, 4, 769–774. https://doi.org/10.1038/s41893-021-00731-5
Mouratadis, K. (2025). Transport and quality of life, The car and its link to subjective well-being, health, and life domains. Transport Policy, 168, 101–111. https://doi.org/10.1016/j.tranpol.2025.04.014
Murphy et al. (2025). How does transportation insecurity compare and relate to other indicators of material hardship in the US? Social Indicators Research.
National Bureau of Statistics of China. (2025). Households’ Income and Consumption Expenditure in the First Half of 2025. https://www.stats.gov.cn/english/PressRelease/202507/t20250730_1960541.html
OECD. (2025). OECD Data Explorer • Annual GDP and components—Expenditure approach. https://data-explorer.oecd.org/
Pai et al. (2014). Motorized two-wheelers in Indian cities. Embarq India.
Porter. (2021). Transport Modes and Remote Areas. Durham University.
Sabal, A. (2025). Product Entry in the Global Automobile Industry. Princeton University.
Saraiva et al. (2022). Accessibility in Sao Paulo: An individual road to equity? Applied Geography, 144
Schwarz. (2005). The social benefits and costs of automobile. Heritage foundation. https://joelschwartz.com/pdfs/ Schwartz_Automobile.pdf
Seum, S., Schulz, A., & Phleps, P. (2019). The future of driving in the BRICS countries (Study update 2019). Institute for Mobility Research.
Sierra Munoz, J., Duboz, L., Pucci, P., & Ciuffo, B. (2024). Why do we rely on cars? Car dependence assessment and dimensions from a systematic literature review. European Transport Research Review, 16:17. https://doi.org/10.1186/ s12544-024-00639-z
Soza-Parra, J., & Cats, O. (2023). The role of personal motives in determining car ownership and use: A literature review. Transport Reviews, 44 (3), 591–611. https://doi.org/10.1080/01441647.2023.2278445
Stanley, J. K., Hensher, D. A., Wei, E., & Liu, W. (2022). Major urban transport expenditure initiatives: Where are the returns likely to be strongest and how significant is social exclusion in making the case. Research in Transportation Business & Management, 43, 100731. https://doi.org/10.1016/j.rtbm.2021.100731
Statistics Bureau of Japan. (2025). Statistics Bureau Home Page/Family Income and Expenditure Survey. https://www. stat.go.jp/english/data/kakei/index.html
Statistics Canada. (2025). Household spending by household income quintile, Canada, regions and provinces. https://www150.statcan.gc.ca/t1/tbl1/en/tv.action?pid=1110022301
Statistics South Africa. (2025). Income and Expenditure of Households 2022/2023 (Statistical Release No. P0100). Statistics South Africa. https://lib.uct.ac.za/government-publications/articles/2025-01-29-income-and-expenditurehouseholds-20222023
Steg, L. (2005). Car use: Lust and must. Instrumental, symbolic and affective motives for car use. Transportation Research Part A, 39, 147–162. https://doi.org/doi:10.1016/j.tra.2004.07.001
Steg, L., Vlek, C., & Slotegraaf, G. (2001). Instrumental-reasoned and symbolic-affective motives for using a motor car. Transportation Research Part F, 4, 151–169.
Swinney, P., & Vera, O. (2023). The impact of agglomeration on the economy. Centre for Cities. https://www.centreforcities. org/reader/office-politics/the-impact-of-agglomeration-on-the-economy/
Tiwari, G. & Nishant. (2018). Travel to Work in India: Current patterns and future concerns (TRIPP-PR Nos. 18–01; Transportation Research and Injury Prevention Programme (TRIPP)). Indian Institute of Technology Delhi.
TomTom. (2025). Annual TomTom Traffic Index: Unveiling data-driven insights from over 450 billion miles driven in 2024. TomTom | Newsroom. https://www.tomtom.com/newsroom/press-releases/general/605041959/tomtom-traffic-index2025/?source_app=b2b&source_product=traffic-index
Transport & ICT. (2016). Measuring rural access: Using new technologies. World Bank. https://documents1.worldbank. org/curated/en/367391472117815229/pdf/107996-REVISED-PUBLIC-MeasuringRuralAccessweb.pdf
UN Sustainable Development Solutions Network. (n.d.). Rural Access Index by Country (2022-2023). Retrieved https://www.arcgis.com/apps/mapviewer/index.html?layers=d386abdab7d946aa8b1a0cd11496d91f Wang, W., Espeland, S., Barajas, J. M., & Rowangould, D. (2025). Rural-nonrural divide in car access and unmet travel need in the United States. Transportation, 52, 507–536.
Weiss, D. J., Nelson, A., Gibson, H. S., Temperley, W., Peedell, S., Lieber, A., Hancher, M., Poyart, E., Belchior, S., Fullman, N., Mappin, B., Dalrymple, U., Rozier, J., Lucas, T. C. D., Howes, R. E., Tusting, L. S., Kang, S. Y., Cameron, E., Bisanzio, D., … Gething, P. W. (2018). A global map of travel time to cities to assess inequalities in accessibility in 2015. Nature, 553 (7688), 333–336. https://doi.org/10.1038/nature25181
Weiss, D. J., Nelson, A., Vargas-Ruiz, C. A., Gligorić, K., Bavadekar, S., Gabrilovich, E., Bertozzi-Villa, A., Rozier, J., Gibson, H. S., Shekel, T., Kamath, C., Lieber, A., Schulman, K., Shao, Y., Qarkaxhija, V., Nandi, A. K., Keddie, S. H., Rumisha, S., Amratia, P., … Gething, P. W. (2020). Global maps of travel time to healthcare facilities. Nature Medicine, 26 (12), 1835–1838. https://doi.org/10.1038/s41591-020-1059-1
Wu, H., Avner, P., Boisjoly, G., Braga, C. K. V., El-Geneidy, A., Huang, J., Kerzhner, T., Murphy, B., Niedzielski, M. A., Pereira, R. H. M., Pritchard, J. P., Stewart, A., Wang, J., & Levinson, D. (2021). Urban access across the globe: An international comparison of different transport modes. Urban Sustainability, 1(1), 16. https://doi.org/10.1038/s42949021-00020-2
6.1 SATISFACTION WITH TRAFFIC SITUATIONS FOR DIFFERENT MODESGERMANY
Figure A 1 Satisfaction with different traffic situations depending on geographical area in Germany
Notes: dark green: very high, green: high, black: satisfying, blue: sufficient red: insufficient, grey: very good and good score from the 2017 survey – Stadtregion: urban areas from metropolitan to village, Ländlichen Region: rural regions, from city to village
Source: Infas et al. (2025)
6.2 JOB ACCESSIBILITY BY DIFFERENT MODES IN METROPOLITAN AREAS ACROSS THE GLOBE
Figure A 2 Access to jobs by different modes
Source of all graphs: Wu et al. (2021) – shared under https://creativecommons.org/licenses/by/4.0/ – no changes made
6.3 ACCESSIBILITY AREAS BY PUBLIC TRANSPORT AND CAR IN US AND EUROPEAN CITIES
Figure A 3 Areas reachable within 0-15, 15-30 and 30-45 minutes by public transport or car in a selection of European and American cities