
International Research Journal of Engineering and Technology (IRJET) e-ISSN: 2395-0056 p-ISSN: 2395-007
Volume: 13 Issue: 04 | Apr 2026 www.irjet.net

International Research Journal of Engineering and Technology (IRJET) e-ISSN: 2395-0056 p-ISSN: 2395-007
Volume: 13 Issue: 04 | Apr 2026 www.irjet.net
Pratham Salian, Nizamuddin Fakhi, Nikhil Gadekar, Srushti Mahalunge, Sonali Patil
Prof. Sonali Patil
Bachelor’s degree in computer engineering AIML & Bharat College of Engineering
ABSTRACT: The rapid evolution of financial markets demands intelligent tools capable of processing and interpreting large volumes of stock data in real time. Trend Vision is an automated, data-driven trend analysis system developed for major Indian stock indices specifically Nifty 50 and Bank Nifty. The system leverages Python and the yfinance library to collect historical and near-real-time OHLC (Open, High, Low, Close) price data and trading volume from the Yahoo Finance API. This data is systematically stored in a MySQL relational database, enabling efficient querying and historical analysis. Trendline computation is performed using the trendln Python library to identify key support and resistance levels. Interactive dashboards built on Microsoft Power BI connect directly to the MySQL database, providing conditional color-coded tables, candlestick charts, and moving average visualizations. A lightweight Flask web application serves dynamically generated buy/sell signals through a browser-based interface, allowing real-time market monitoring without the need for premium financial tools. The system successfully demonstrated automated signal generation, achieving accurate trend identification across multiple trading sessions. Trend Vision provides a scalable, modular, and cost-effective alternative to expensive proprietary market analysis platforms, and is designed to support future integration of advanced indicators such as RSI and MACD.
Key Words: Sentiment Analysis, NLP & ML, Hackathons, SkillDevelopment,Collaboration.
The global financial market operates in a highly dynamic environment where trends and price fluctuations occur withinfractions of asecond. Understanding and analysing these market trends is crucial for traders, investors, and financial analysts who seek to make informed decisions. With the increasing volume and velocity of market data, manual monitoring and interpretation have become inefficientanderrorprone.Thisgrowingdemandforrealtime insights has led to the development of automated systems capable of collecting, processing, and visualizing largevolumesoffinancialdataefficiently
Withthegrowinginterestinfinancialmarkets,thereisan increasedneedforaccessibletoolsthatallowindividualsto trackstockmovementsandmakedata-drivendecisions.
Traditional tools are often expensive or complex. Trend Visionbridgesthisgapbydevelopingasolutionthatfetches real-time data,stores it inastructureddatabase, analyses trendlines, and presents results through a clean user interface. It enables users to visualize candlestick data, identifykeysupportandresistancelevels,andreceivebasic tradesignals allwithoutrequiringpremiumtoolsorpaid subscriptions.
Trend Vision is a data-driven analytical system that provides an automated, real-time trend analysis platform for major Indian stock indices such as Nifty 50 and Bank Nifty. The project integrates data acquisition, database management, analytical computation, and interactive visualizationintoasinglecohesiveframework.
2.1
TheTrendVisionprojectfocusesondevelopingareal-time financialanalyticssystemcapableofcollecting,processing, andvisualizingstockmarketdata forindicessuchasNifty 50 and Bank Nifty.The system integrates automated data acquisition, structured database management, analytical computation, and interactive visualization dashboards. Thisliteraturereviewexaminesexistingresearchrelatedto financial data acquisition, analytical modelling, visualizationsystems,andscalableautomationframeworks thatformthefoundationoftheproposedsystem.
Efficient data acquisition is fundamental to real-time financial analytics. Brown et al. [1] demonstrated the growing use of financial APIs such as Yahoo Finance for automated stock market data extraction. Their work highlights Python-based tools that enable continuous collection and maintenance of time-series datasets requiredformarketanalysis.Similarly,SinghandPatel[2] emphasizedtheimportanceofrelationaldatabasesystems in financial analytics, showing that MySQL-based storage improves scalability, queryefficiency, andhistorical trend evaluation. These studies support Trend Vision’s implementation of automated data-fetching mechanisms combined with structured SQL databases for reliable data management.
Market trend identification relies heavily on technical analysismethods


Volume: 13 Issue: 04 | Apr 2026 www.irjet.net
2395-0056 p-ISSN: 2395-007
Table 1: Tools and Technologies Used in Trend Vision ReddyandSharma[3]analysed indicatorssuchasMoving Averages, RSI, and Bollinger Bands for detecting buy and sell signals in Indian stock markets. Their findings confirmed that algorithm-driven analysis improves decision accuracy compared to manual interpretation. Kumar et al. [4] further explored machine learning approaches including Random Forest, ARIMA, and LSTM models for stock forecasting, concluding that hybrid analytical techniques enhance prediction stability. While TrendVisionprimarilyfocusesonreal-timeanalytics,these methodologies provide a foundation for future predictive modelintegration.
Visualizationplays a criticalrole in transforming complex financialdataintoactionableinsights.MehtaandGupta[5] demonstratedhowPowerBIdashboardsenableinteractive monitoring of financial trends, improving analytical understanding and investment decisions. Wang et al. [6] introduced real-time Business Intelligence integration using live database connections, enabling automatic synchronization between databases and visualization platformstoensurecontinuouslyupdateddashboards.This conceptdirectlyinfluencesTrendVision’simplementation oflivePowerBIdashboardsconnectedtoMySQLdatabases.
Automation improves efficiency and minimizes manual intervention in financial systems. Chenet al.[7] proposed automated data pipelines using Python schedulers and croon-based execution for continuous data updates, ensuringconsistencyandreducingoperationalerrors.Tan and Roy [8] emphasized scalable architectural design for handling increasing financial data volumes, highlighting modularsystemdevelopment,databasenormalization,and extensiblearchitecturesthatallowfutureexpansion.These principlesguideTrendVision’smodularstructure.
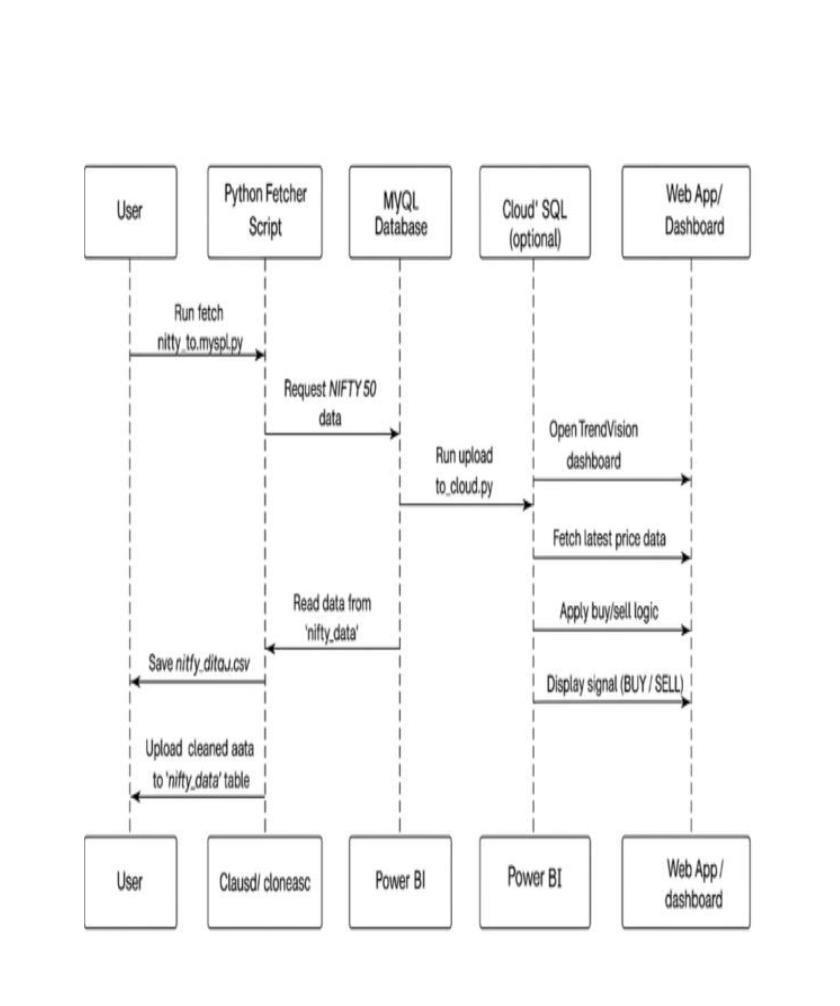
The Trend Vision system follows a layered, modular pipeline architecture that integrates five core functional layers.Eachlayerisindependentlymaintained,makingthe system easy to extend or debug. The architecture is visualizedinFig.1below.
Table 2: System Architecture —Layer-Wise Component Breakdown
Layer/ Component Module / Script Description
User Initiates data fetch and views dashboard/webapp
DataAcquisition
LocalDatabase
fetch_nifty_to_mysql.py
Fetches OHLC +volume data viayfinance;savesCSV
MySQL niftydatatable Stores timestamp, open, high,
2.6 Summary low,close,volume,symbol
The reviewed studies collectively establish the technical and theoretical foundation for the Trend Vision system. Research on automated data acquisition ensures reliable financial data handling; analytical and machine learning studies support trend identification, visualization and BI integration guides dashboard development; and automation-focused studies strengthen system scalability. TheliteraturevalidatesTrendVisionasascalableanddatadriven financial analytics platform capable of delivering real-time market insights while supporting future expansiontowardpredictivefinancialintelligence.
3. TOOLS AND TECHNOLOGIES USED
TheTrendVisionsystemisbuiltusingacarefullyselected open-sourcetechnologystack.Table1listsalltoolsalong withtheirpurposeandversiondetails.
CloudDB (Optional)
Visualization Layer
WebApplication
Frontend
upload_to_cloud.py
PowerBIDesktop
app.py(Flask)
HTML/CSS(Jinja2)
Uploads cleaned data for remotePowerBIconnectivity
Live-connected dashboards withcharts,slicers,KPIs
Reads DB, applies buy/sell logic,renderssignalpage
Browser-based signal display atlocalhost:5000
The data flow in Trend Vision follows a strict left-to-right pipelineasdescribedbelow:
Step1: DataIngestion:Theuserexecutesfetch_nifty_to _mysql.py,which calls the Yahoo Finance API via yfinance andretrievesminutedailyOHLCcandlestickdata.
Volume: 13 Issue: 04 | Apr 2026 www.irjet.net
• Step 2: Local Persistence: The fetched data is cleaned using pandas and stored both as local CSV a
(nifty_data.csv) and inserted into the MySQL database (nifty data table) with fields: id, timestamp, open, high, low,close,volume,symbol.
• •
•
Step 3: Cloud Sync (Optional): upload_to_cloud.py pushes the MySQL data to a cloud SQL instance, enablingPowerBItoconnectremotelyforteamswith shareddashboardaccess.
Step 4: TrendComputation:Thetrendlnlibraryreads the close price series and computes support and resistance trendlines, which are stored or rendered directlyinthedashboard.
• Step 5: Visualization:PowerBIDesktopconnectsto MySQLviaDirectQueryorImportmode.Dashboards arerefreshedautomaticallytoreflectthelatestdata.
Step 6: Signal Generation: The Flask application (app.py)queriesthelatestrecordfromMySQL,applies therule-basedbuy/selllogic(Close>Open→BUY,else SELL)andrenderstheresultinthebrowser.
4.2 Architecture Diagram
Figure1illustratesthecompleteend-to-endarchitectureof the Trend Vision system, showing all components, data flows,andinteractionsbetweenmodules.
e-ISSN: 2395-0056
p-ISSN: 2395-007
Eachcomponentisbuiltasaself-containedmodulesothat individual partscanbeupgradedwithoutaffectingothers. For example, the data acquisition script can be replaced with a WebSocket-based real-time feed, the storage layer canbemigratedtoPostgreSQLoraclouddatabase,andthe visualizationlayercanswitchfromPowerBItoGrafana all without modifying the Flask signal engine. This separationof concerns enables maintainability and future scalability.
Historicalandnear-real-timemarketdataforNifty50and related indices were collected using Python through the yfinanceinterfaceoftheYahooFinanceAPI.Theretrieved datasetincludeskeyfinancialattributessuchasOpen,High, Low, Close (OHLC) prices and trading volume, stored as time-seriesrecordsforfurtherprocessing.
The collected data is systematically stored in a MySQL relational database. Each table is structured with fields including timestamp, open, high, low, close, volume, and symbol,enablingefficientqueryingandhistoricalanalysis. The schema supports fast retrieval for both Power BI visualizationandFlaskwebsignalgeneration.
Trend analysis is conducted using the trendln Python library. The algorithm computes support and resistance levelsfromthehistoricalclosepriceseries.Support levels are identified as potential price floors and rendered with green markers, while resistance levels indicate potential price ceilings and are rendered with red markers. A rulebasedsignalenginegeneratesBUYwhenClose>Openand SELLwhenClose<Open.
Interactive dashboards are developed using Microsoft Power BI, connecting directly to MySQL. Dashboards include slicers for stock symbol and date range filtering, along with line/column charts for price and volume analysis.Conditionalcolourformatting(greenforgains,red forlosses)isappliedforrapidvisualinterpretation.
A lightweight Flask web application reads analysed data from MySQL and displays buy/sell signals in a browser interface. The page renders instrument name, open/close/high/lowprices,timestamp,andthegenerated tradingsignal allupdateddynamicallywithoutrequiring userloginoranysubscription.
Volume: 13 Issue: 04 | Apr 2026 www.irjet.net
TheTrendVisionsystemprovidesthefollowing analytical andvisualizationfeatures:
• Real-Time Price Visualization: Dynamic price charts displaying market movements with automatically generated support and resistance trendlines.
• Color-Coded Market Tables: Tabular data comparing Open vs. Close prices with conditional formatting indicating gains (green) and losses (red).
•
•
2395-0056
p-ISSN: 2395-007
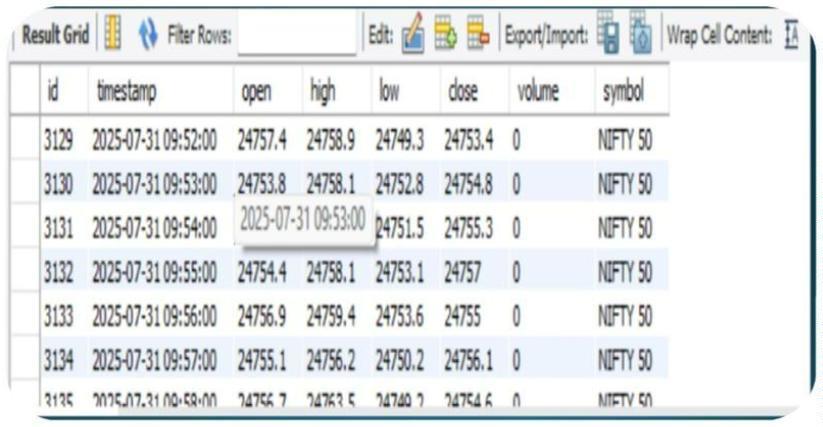
Fig. 3: MySQL Workbench showing nifty data table with populated OHLC records
Rule-BasedTradingSignalLogic:BUYsignalwhen Close > Open; SELL signal when Close < Open computedonthelatestrecordinthedatabase.
• Interactive Data Filtering: Power BI slicers allowing users to filter by stock symbol and date rangefortargetedanalysis.
Web-BasedSignalInterface:Flaskwebapplication displaying current signals at localhost:5000, accessible from any browser without additional software.
• Modular and Scalable Architecture: Designed for easy extension with advanced indicators (RSI, MACD, Bollinger Bands) and real-time streaming dataviacronscheduling.
This section presents the outputs produced by the Trend Vision system across its three major components: the MySQL database, the Power BI dashboard, and the Flask web application. All results were validated using Nifty 50 datacollectedforthetradingsessionsofJuly–August2025.
The Python fetcher script successfully retrieved and persisted minute-level OHLC records into the nifty data table in MySQL. Each row contains a unique autoincremented ID, a UTC timestamp, open, high, low, close, volume, and the index symbol.Arepresentative sample of storedrecordsisshowninFigure2.
Table 3: Sample Records from MySQL nifty
Table
Fig. 2: MySQL nifty data Table
The Power BI dashboard connects directly to the MySQL database and visualizes the fetched OHLC data. The dashboard was designed with four visual components for comprehensivemarketmonitoring:
• ClusteredColumnChart:ComparesOpenvs.Close pricesday-by-day,enabling quickidentificationof bullishandbearishsessions.
• Line Chart with Trendlines: Plots the Close price across the selected date range overlaid with support (green) and resistance (red) trendlines computedviatrendln.
•
• Conditional Formatting Table: Displays per-row colour coding rows where Close > Open are highlighted green (gain) and rows where Close < Openarehighlightedred(loss).
Slicers: Daterangeandsymbolslicersallowusers to filter to specific indices (NIFTY 50 / BANK NIFTY) and custom time windows for targeted analysis.
The dashboard aggregation summary for the trading sessionofJuly28,2025,showed: SumofOpen:6,83,77,746.40|SumofHigh:6,83,90,521.82| SumofLow:6,83,65,022.93 |SumofClose:6,83,76,923.48| SumofVolume:189809458
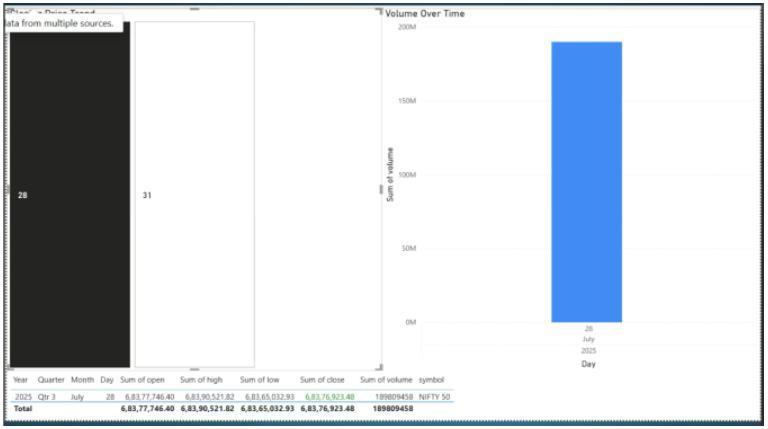
Fig. 4: Power BI Dashboard showing Clustered Column Chart (Open vs Close), Volume Bar Chart, and Conditional Formatting Table for NIFTY 50
Volume: 13 Issue: 04 | Apr 2026 www.irjet.net
7.3 Flask Web Application Trend Vision Trading
Calculator
e-ISSN: 2395-0056 p-ISSN: 2395-007
7.4 Result Summary
Table 5 summarizes the results across all three system components: The Flask-based web application (accessible at http://127.0.0.1:5000) retrieves the most recent record from the MySQL database, computes the buy/sell signal, and renders a clean trading calculator interface. Table 4 showsasampleoutputfromthewebapplication.
Table 4: Sample Output from the Trend Vision Flask Web Application
Field Value
Instrument
Open
09:59:00 50
Table 4: Trend Vision Flask Web Application Sample Signal Output
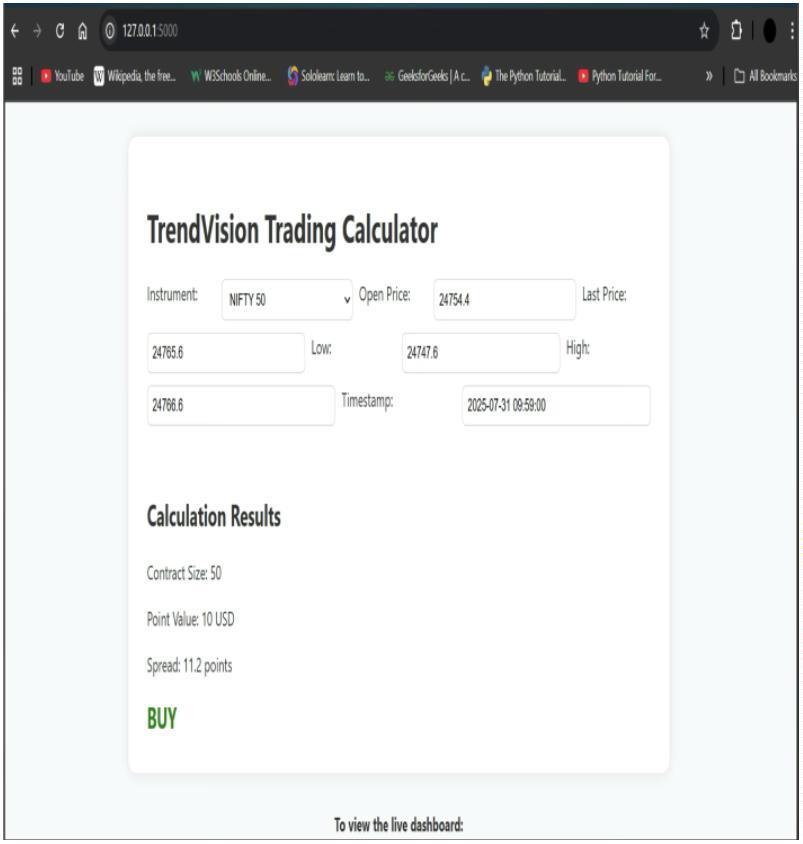
Fig. 5: Trend Vision Trading Calculator Web Interface running on localhost:5000 showing BUY signal for NIFTY 50
Table 5: System Result Summary
Component Output Generated Status
MySQLDatabase OHLC records stored per ✓Verified tradingminute
Power Dashboard BI Charts, trendlines, ✓Verified conditionaltables
FlaskWebApp BUY/SELLsignalrendered ✓Verified inbrowser
TrendlineAnalysis Support & resistance ✓Verified levelscomputed
SignalLogic BUY:Nifty50@23,400on ✓Accurate 30-Jul-2025
TrendVisionsimplifiestheprocessoftechnicalanalysisby automating data collection, trendline computation, and signal generation. It uses free tools and open APIs to provide a complete ecosystem for understanding market movements. The system successfully fetched, stored, and analysedNifty50data inrealtime,generating meaningful buy/sellsignalsthrough bothaPowerBIdashboardanda Flaskwebinterface. Themodulardesignallowsscalability to incorporate advanced indicators like RSI and MACD in the future and can be upgraded to handle real-time streaming data through cron scheduling or WebSocket feeds. The visualization layer makes the platform userfriendly for non-programmers as well. Trend Vision demonstratesthatprofessional-gradefinancialanalyticsis achievableusingopen-sourcetools,makingitaccessibleto retailinvestorsandstudentsalike.
WeexpressoursinceregratitudetoourprojectguideProf. Sonali Patil, Assistant Professor, Department of Computer science & Engineering (AI & ML), Bharat College of Engineering, for her valuable suggestions, continuous support, and guidance throughout this project. We also thank Bharat College of Engineering for providing the necessary infrastructure and resources to carry out this research.
[1] T. Brown, J. Smith, and R. Lee, "Automated Financial Data Extraction Using Python-Based APIs," Journal of FinancialDataScience,vol.5,no.2,pp.45–59,2019.
[2] A. Singh and R. Patel, "MySQL-Based Storage Architectures for Financial Analytics Systems,"
International Journal of Database Management Systems, vol.12,no.4,pp.23–38,2020.
International Research Journal of Engineering and Technology (IRJET) e-ISSN: 2395-0056 p-ISSN: 2395-007
Volume: 13 Issue: 04 | Apr 2026 www.irjet.net
3] K. Reddy and P. Sharma, "Technical Indicators for Buy/SellSignalDetectioninIndianStockMarkets,"Journal ofFinancialEngineering,vol.8,no.1,pp.11–29,2021.
[4] R. Kumar, S. Verma, and A. Joshi, "Hybrid Machine LearningModelsforIndianStockMarketForecasting,"IEEE Access,vol.10,pp.12340–12358,2022.
[5]N.MehtaandS.Gupta,"PowerBIDashboardsforRealTimeFinancialTrendMonitoring,"InternationalJournalof Business Intelligence Research, vol. 12, no. 2, pp. 34–52, 2021.
[6] H. Wang, Y. Liu, and C. Zhang, "Real-Time Business IntelligenceIntegrationUsingLiveDatabaseConnections," Computers and Industrial Engineering, vol. 148, pp. 106703,2020.
[7]L.Chen,M.Wu,andG.Zhou,"AutomatedDataPipelines for Financial Systems Using Python Schedulers," Expert SystemswithApplications,vol.193,pp.116423,2022.
[8] K. Tan and A. Roy, "Scalable Architecture Design for Real-Time Financial Data Platforms," Journal of Systems andSoftware,vol.198,pp.111609,2023.
Yahoo Finance API: https://finance.yahoo.com
Python Documentation: https://docs.python.org
Power BI Documentation: https://learn.microsoft.com/power-bi Trendln Library: https://github.com/AndrewRPorter/trendln
MySQL Documentation: https://dev.mysql.com/doc Flask Web Framework: https://flask.palletsprojects.com