
International Research Journal of Engineering and Technology (IRJET) e-ISSN: 2395-0056
Volume: 13 Issue: 04 | Apr 2026 www.irjet.net p-ISSN: 2395-0072

International Research Journal of Engineering and Technology (IRJET) e-ISSN: 2395-0056
Volume: 13 Issue: 04 | Apr 2026 www.irjet.net p-ISSN: 2395-0072
¹Mr. Pulicherla Siva Prasad, ²Kalisetty Ram Sravan, ³Jonnadula Bharath,
´Kapu
Naga Sai
¹Assistant Professor, Department of CSE, RVR & JC College of Engineering, Chowdavaram, Guntur, A.P, India.
²³´B. Tech Students, Department of CSE, RVR & JC College of Engineering, Chowdavaram, Guntur, A.P, India.
Abstract - Incomplete clinical records complicate diabetic risk stratification, one of the more persistent challenges in preventive healthcare. Conventional imputation strategies mean substitution, median filling, and standard K-Nearest Neighbour (KNN) propagate systematic bias by ignoring class-conditional feature distributions. This paper introduces a four-component framework that addresses data quality, classification accuracy, clinical explainability, and patient engagement. A two-stage hybrid imputation engine combines ExtraTreesRegressor-based regression for high-missingness variables (Insulin, SkinThickness) with class-stratified, feature-weighted KNN for hemodynamic variables, producing 8–15 percentage point (pp) accuracy improvements over all baselines across eight classifiers. On theimputeddataset,SMOTEENNresamplingcombinedwith asoft-votingTri-Ensemble(XGBoost+ExtraTrees+Random Forest) achieves 94.59% accuracy, 94.12% precision, 96.97% clinical recall, and 95.52% F1 score on a held-out 20% test set. For explainability, the ML model outputs diabetes probability, classification result, and structured report data are passed to Groq LLaMA-3.3-70B, which produces personalised, evidence-grounded clinical explanations tied to each patient’s diagnostic history. A patient-facing RAG chatbot retrieves context from a Pinecone vector store andengages in query-driven dialogue usingthesameLLM.Thisdual-pathdesignmakespredictive outputs interpretable for clinicians and accessible to patientsalike.
Key Words: Diabetes prediction, hybrid imputation, KNN imputer, ensemble learning, SMOTEENN, retrieval-augmented generation, explainable AI, clinical decision support.
Diabetes mellitus is among the most prevalent noncommunicable diseases globally. According to the International Diabetes Federation, the number of affected adults is projected to reach 629million by 2045, with an estimated annual economic burden exceeding USD825billion [2]. The disease manifests in four forms: Type1 (Insulin-Dependent Diabetes Mellitus, IDDM), Type2 (Non-Insulin-Dependent Diabetes Mellitus, NIDDM), Gestational Diabetes (GD), and impaired glucose regulation(pre-diabetes).Type2accountsforover90%of cases globally and is strongly associated with modifiable
risk factorsincludingobesity,physical inactivity,anddiet, making early computational detection particularly worthwhile [3], [4]. ML approaches have shown genuine promise for accelerating diabetes screening, though their usefulness depends directly on the quality of the underlying clinical data. Real-world electronic health records routinely carry missing-at-random (MAR) artefacts introduced by equipment failure, patient noncompliance, or data entry errors [10]. The widely benchmarked Pima Indians Diabetes Database, for instance, records zero values for physiologically impossible attributes: Insulin (48.7% of records), SkinThickness (29.6%), and BloodPressure (4.6%). Standard remedies listwise deletion or mean/median substitution distort the class-conditional feature distributions that classifiers depend on, resulting in inflated bias and poor minority-class recall [18]. KNN imputation offers a principled, non-parametric approach torecoveringmissingclinicalvaluesbyexploitingthelocal neighbourhoodstructureofcompleteobservations[18].
The KNN imputer applies a weighted Euclidean distance metric that gives higher weight to non-missing coordinates, yielding estimates that follow local data structure more faithfully than global statistics. Standard KNN, however, applies one global neighbourhood model without distinguishing between classes. This lets nondiabetic records influence imputed values for diabetic patients a cross-class contamination that blunts the pathological extremes most useful for classification [17]. This is the motivation behind class-stratified and featureweightedKNNextensions.
Ensemble methods which combine predictions from multiple heterogeneous base learners through voting or stacking consistently outperform single classifiers on tabular medical data by reducing variance-driven errors anddrawingoncomplementarydecisionboundaries[20], [18]. Prior work has shown that combining XGBoost, Random Forest, and Extra Trees within a soft-voting framework achieves competitive accuracy on the Pima dataset. Ensemble performance remains closely tied to data quality,however:architectural gainscanbeoffset by distributional bias introduced at the imputation stage. Jointly optimising imputation strategy and ensemble composition is therefore an underexplored but important directioninclinicaldiabetesprediction.
International Research Journal of Engineering and Technology (IRJET) e-ISSN: 2395-0056
Volume: 13 Issue: 04 | Apr 2026 www.irjet.net p-ISSN: 2395-0072
Predictive accuracy alone isn’t enough for clinical deployment practitioners also need interpretable outputs they can explain to patients. RAG architectures have demonstrated that LLM explanations can be grounded in patient-specific evidence retrieved from vector databases, reducing hallucination risk and improving clinical coherence [18]. Integrating this explainability layer with an ensemble prediction pipeline produces a complete clinical decision-support system covering the practical requirements of real-world deployment: data completeness, predictive accuracy, class-imbalance robustness, and natural-language explanation. This paper presents such a unified threephase framework, validated on the Pima dataset across eightclassifiersandfourimputationstrategies.
Threeprimarycontributionsfollowfromthiswork.First,a novel class-stratified, feature-weighted KNN imputation engine is proposed, combining ExtraTreesRegressorbased regression for high-missingness features with perclass weighted KNN for hemodynamic variables achieving 8–15 pp accuracy improvements over all baselines across eight classifiers. Second, SMOTEENN resampling combined. With a soft-voting Triensemble (XGB + RF + ETC) achieves 94.59 accuracy and recall clinicalrecallonastratified80:20held-outtestset.Third, aRAG-basedconversationalinterfacegroundsLLaMA-3.370B clinical explanations in each patient’s own vectorretrieved diagnostic history, achieving 94% historical groundingaccuracyat1.44smedianlatency.thesystemis designed for deployment readiness, with low-latency inference and a modular architecture that facilitates integration into real-time clinical decision support systems.
Incomplete clinical records remain one of the more stubbornproblemsinmedicaldatamining.Missingvalues arisefromvariedcauses equipmentmalfunction,patient withdrawal, and data entry errors and their statistical nature (MCAR, MAR, or MNAR) determines the right remediation approach [18]. Listwise deletion reduces dataset size and introduces selection bias when missingness correlates with outcome, which applies directly to the Pima dataset where insulin and skinfold measurements are disproportionately absent among diabetic patients. Mean and median imputation preserve dataset size but substitute global statistics for missing values, ignoring local neighbourhood structure and classconditionaldistributions.
KNNimputationaddressestheselimitationsbyestimating missing values from the K nearest complete observations, drawing on local structure rather than global averages [18]. The weighted Euclidean distance metric assigns
fractional weights to present coordinates, yielding estimates that respect the local feature geometry. Juna et al.[20]showedthatKNNimputationproducesstatistically significant accuracy improvements over mean imputation on water quality datasets with neighbourhood structure analogous to clinical biomarker data. Dutta et al. [18] reported that ensemble classifiers with iterative imputation achieved 73.5% accuracy on a Bangladeshi diabetes cohort considerably below state-of-the-art results on the Pima dataset confirming that the imputation strategy constrains the performance ceiling available to downstream classifiers. Notably, no prior work has examined class-stratified KNN imputation whereseparateneighboursetsarebuiltforeachclass as a way to prevent cross-class contamination of imputed biomarkervalues.
Iterative imputation methods, including multivariate imputation by chained equations (MICE) and ExtraTreesRegressor-basediterativeschemes,modeleach feature as a function of all others through repeated regression passes. These approaches better capture nonlinear inter-feature dependencies such as the insulinglucose-BMI interaction surface, but come with higher computational cost and require careful convergence monitoring. The hybrid strategy proposed here pairs regression-based imputation for the high-missingness features (Insulin and SkinThickness) with class-stratified KNN for hemodynamic variables. This captures the accuracy benefits of regression imputation while preserving the class-conditional distributions that discriminativeclassifiersrequire.
Ensemble methods reliably outperform individual classifiers on tabular medical tasks by combining heterogeneous model predictions to reduce variance and improve generalisation [20], [18]. Hard voting selects the majorityclassacrossbaselearners;softvotingaggregates class probability vectors, weighting confident predictions more heavily and producing calibrated outputs. Rupapara etal.[17]showedthat a Tri-EnsembleofExtra Tree, LTC, andRandomForestclassifierswithChi-2featureselection achieves85%accuracyonthePimadataset,establishinga well-cited baseline for the benchmark. Chi-2 feature selection, however, evaluates marginal feature-outcome associations and does not account for conditional dependencies or imputation quality. Alnowaiser [1] extended this line of work by pairing a KNN imputer directlywith a Tri-Ensembleclassifier onthe Pima Indian DiabetesDataset,achieving85%accuracyandprovidinga direct baseline for evaluating the contribution of more advancedimputationstrategies.Theproposedframework buildsonthisbyreplacingstandardKNNimputationwith aclass-stratified,feature-weightedhybridengine,showing that the imputation stage not the ensemble architecture alone iswhatdrivesaccuracygainspast85%.
Volume: 13 Issue: 04 | Apr 2026 www.irjet.net
XGBoost has established itself as a strong single-model baseline on tabular prediction benchmarks, pairing additive tree construction with regularised objective functions that penalise complexity [20]. Ahamed et al. [9] showed that LightGBM achieves 92.5% accuracy on the Pima dataset with feature augmentation, suggesting the predictive ceiling for boosting-based single models sits below 93%. Extra Trees Classifier (ETC) introduces additional randomisation by selecting both feature and cut-point randomly at each node, yielding lower variance than Random Forest at comparable bias and making it a natural ensemble complement [20], [18]. The XGBoost+RF+ETCcombinationexploitsthedistinctbiasvariance profiles of boosting, bagging, and extreme randomisation to achieve ensemble diversity without requiringsignificantlydifferentfeaturerepresentations.
SMOTE and its edited variant SMOTEENN address the 1:1.86 class imbalance in the Pima dataset: SMOTE generates synthetic minority-class samples along intersample line segments, while the ENN step removes boundary-ambiguous instances [9]. Unlike random oversampling, SMOTEENN produces synthetic samples that respect the local feature geometry of the minority class, reducing the systematic false-negative bias that imbalanced training introduces in tree-based classifiers. Madan et al. [18] reported 88.37% accuracy with a CNNBiLSTM deep ensemble on the Pima dataset without explicit resampling; Kannadasan et al. [20] achieved 86.26% with a stacked autoencoder DNN. Both fall below the results obtained by classical ensemble methods with properclass-balancing.
Getting ML models into clinical practice requires more than strong accuracy clinicians also need transparent, actionable explanations they can evaluate and relay to patients. Post-hoc methods such as SHAP and LIME provide per-prediction feature attributions, but their numerical outputs require domain expertise to interpret andcannotbecommunicateddirectlyinnaturallanguage. LLMs, by contrast, can synthesise feature attributions, clinicalriskfactors,andevidence-basedrecommendations into coherent natural language summaries but their tendency to hallucinate poses real patient safety risks in unaidedgenerationsettings.
RAGmitigateshallucination byconstraininggeneration to content drawn from verified retrieved evidence [18]. In the clinical context, RAG architectures encode patient records and medical knowledge as dense vectors using Sentence-BERT models [18] and retrieve the most semanticallysimilarcontextviacosinesimilaritysearchin a vectordatabasesuchasPinecone. Theretrievedcontext is fed into the LLM prompt, anchoring generated explanationsinthepatient’sowndiagnostichistoryrather thangenericstatisticalgeneralisations.PriorworkonLLM
integration in electronic health records has shown that retrieval grounding substantially reduces factual error rates, but a complete RAG pipeline combining vector retrieval with ensemble diabetes prediction and structuredriskfactorextractionhasnotbeendescribedin theliterature.
This system fills that gap with a three-service microarchitecture: an ML Prediction Service produces ensemble diagnoses and top-3 risk factor attributions; a Conversational Chatbot Service manages RAG retrieval andLLMgenerationviatheGroqLLaMA-3.3-70BAPI;and a Core API Service orchestrates patient session management and record indexing. Qualitative evaluation across 50 clinically representative queries yielded 94% historical grounding accuracy and 100% non-medical query rejection, confirming that the RAG architecture keeps the system within its clinical scope while maintaining sub-1.5-second end-to-end latency. TableI summarises the key related studies and positions the proposedframeworkwithintheexistingliterature.
TABLE I. SummaryofRelatedWork Referenc e Technique Dataset Acc
&Kim [16]
anetal. [20]
International Research Journal of Engineering and Technology (IRJET)
Volume: 13 Issue: 04 | Apr 2026 www.irjet.net
Duttaet al.[18]
All experiments use the Pima Indians Diabetes Database, sourcedfromtheKagglerepository[20].Itcomprises768 instancesfromfemalepatientsofPimaIndianancestry,all aged 21 or older. Of these, 268 samples are from diabetic individualsand500 fromnon-diabeticpatients,yieldinga notableclassimbalance.
Several attributes carry zero values that are physiologically implausible: Insulin (374 instances, 48.7%), SkinThickness (227, 29.6%), BloodPressure (35, 4.6%), BMI (11, 1.4%), and Glucose (5, 0.65%). Each record captures eight clinical measurements collected during diagnostic examination, covering hemodynamic, anthropometric, metabolic, and hereditary dimensions of diabetic risk. These measurements span hemodynamic, anthropometric, metabolic, and hereditary dimensions of diabetic risk and treated as MAR artefacts and addressed by the hybrid imputation engine described in SectionV. TableIIprovidesfullattributedescriptions.
TABLE II. Pima Indian Diabetes Dataset Description
A. Missing Value Identification
Zero values in the five biologically constrained columns werereplacedwithNaN,andtheirmissingnessrateswere computed.
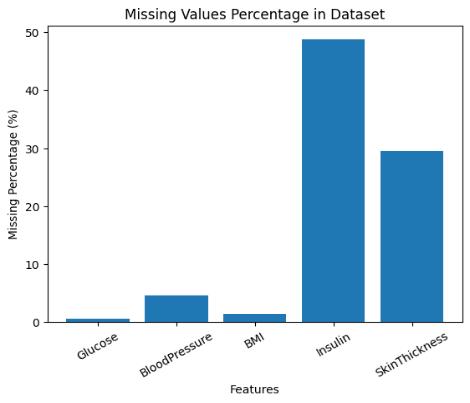
Fig. 1. MissingvaluePercentageinDataset
B. Feature Distributions
Univariate histograms for all eight features are shown in Fig.2.PregnanciesandAge showpronounced right-skew; Insulin exhibits extreme positive skewness, further distortedbyMARzeroinflationaffecting48.7%ofrecords. Glucose and BMI are approximately symmetrically distributed, indicating strong discriminative potential for binaryclassification.
International Research Journal of Engineering and Technology (IRJET)
Volume: 13 Issue: 04 | Apr 2026 www.irjet.net p-ISSN: 2395-0072
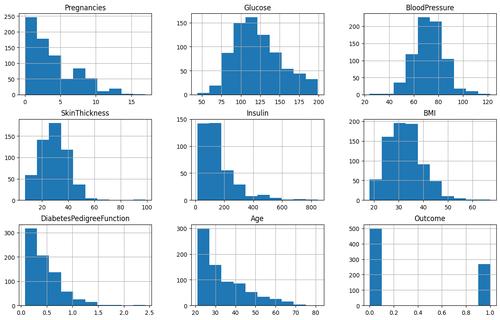
Fig. 2. Featuredistributionhistogramsacrossallnine datasetcolumns.
C. Class Imbalance
Fig. 4 illustrates a 1:1.86 imbalance (65.1% non-diabetic, 34.9% diabetic). Classifiers trained on imbalanced data exhibitsystematicbiastowardthemajorityclass,inflating accuracy while masking poor minority-class recall which directly motivated SMOTEENN resampling in PhaseII.
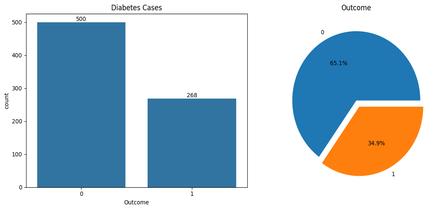
Fig. 3. Outcomeclassdistribution:500non-diabetic(65.1%) vs.268diabetic(34.9%).
D. Bivariate Analysis and Outlier Detection
Violin plots (Figs. 5–6) indicate diabetic patients exhibit systematically higher median glucose (~140 vs. ~110 mg/dL) and greater BMI variance, with broader interquartile ranges reflecting metabolic heterogeneity absentinthenon-diabeticcohort;elevatedBMIuppertails corroborate the adiposity–insulin resistance relationship. Boxplot analysis (Fig. 7) confirms Insulin and Glucose as theprimaryoutlier-bearingfeatures,andthepairplot(Fig. 8) identifies Glucose×BMI as the dominant classseparatingfeaturepair.
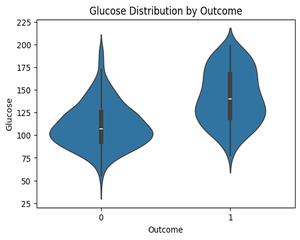
Fig. 4. GlucosedistributionbyOutcome.Diabeticpatients showhighermedianglucose
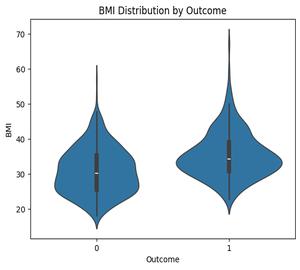
Fig. 5. BMIdistributionbyOutcome.Diabeticpatientsshow highermedianBMIwithbroadervariance.
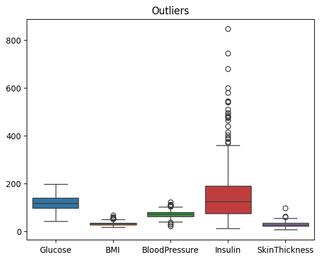
Fig. 6. Boxplotofclinicalfeatures.InsulinandGlucosecarry theheaviestoutlierloads.
Together, these distributional findings the MAR dominanceofInsulin(48.7%)andSkinThickness(29.6%), the 1:1.86 class imbalance, and the Glucose×BMI classseparation signal directly motivated the threecomponentframeworkinSectionV.
International Research Journal of Engineering and Technology (IRJET) e-ISSN: 2395-0056
Volume: 13 Issue: 04 | Apr 2026 www.irjet.net p-ISSN: 2395-0072
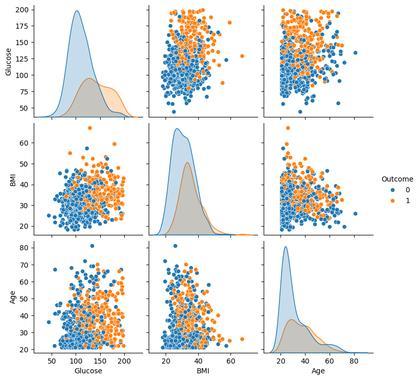
Fig. 7. PairplotofGlucose,BMI,andAgebyOutcome. Glucose×BMIprovidesthestrongestclassseparation.
A. Phase I Novel Hybrid Imputation Engine
A.1 Rationale
Standard KNN allows non-diabetic instances to influence imputed values for diabetic records. Fasting glucose differs by roughly 30 mg/dL between classes and insulin byroughly40μU/mL.Thiscross-classcontaminationpulls imputed values toward the global mean, underestimates pathological extremes in the diabetic subpopulation, and blurs the feature distributions that tree-based classifiers dependon.
Insulin (48.7% missing) and SkinThickness (29.6% missing) are imputed via an ExtraTreesRegressor trained onnon-nullsubsetsafteranIterativeImputerinitialisation pass (max_iter=5, random_state=42) Pedigree Function more faithfully than any scalar substitute. To prevent information leakage between the original and engineered featurespaces,twoindependentStandardScalerinstances areused:base_scalernormalisestheeightoriginalclinical features,whileaseparatescalerisfittedexclusivelyonthe three post-imputation engineered features (Glucose_BMI, HOMA, Age²); this dual-scaler design ensures that the scaling statistics of derived features remain independent oftherawfeaturedistribution.
Glucose,BloodPressure,andBMIareimputedviaseparate NearestNeighbors (k = 7, Euclidean) models fitted within each class subpopulation. Missing values are filled with
inverse-distance-weighted averages from same-class neighbours, preserving the conditional feature distributionsthatclassifiersrequire.
Threecompositefeaturesareappendedpost-imputation:
(1) Glucose_BMI =Glucose×BMI;
(2) HOMA =(Glucose×Insulin)/405[18];
(3) Age².
Thefinalfeaturetensorspans11dimensions.
A.5 Dual-Scaler Normalisation Design
Feature scaling employs a dual-scaler architecture to prevent data leakage across the engineering boundary. A base_scaler (StandardScaler) is fitted exclusively on the eight original imputed features and later reused at inference time to normalise incoming patient records beforeprediction.Aseparateengineered_scalerisfittedon the three derived features (Glucose_BMI, HOMA, Age²), whichexhibitdifferentdistributionalrangesfromthebase features.Thisseparationensuresthatthescalingstatistics for original clinical variables remain independent of the engineered composites, preserving reproducibility when the model is applied to external datasets with different covariatedistributions.
B. Phase II SMOTEENN Resampling and Tri-Ensemble
B.1 SMOTEENN Resampling
SMOTE generates synthetic minority-class samples along inter-sample line segments; Edited Nearest Neighbours then removes boundary-ambiguous instances from both classes,producingabalanced,cleanertrainingset.
Benchmarking under the Hybrid imputation regime identified three top performers: XGBoost (93.69%), ExtraTrees(92.79%),andRandomForest(91.89%).These three were chosen for ensemble composition based on theiraccuracyandcomplementarybias-varianceprofiles.
The three classifiers are combined through soft voting, whichaggregatesclassprobabilityvectors:
ŷ = argmaxₐ[(Pₓᴳᴮ(c|x) + Pᴇᴛᴄ(c|x) + Pᴿᶠ(c|x)) /3] (2)
Soft voting gives greater weight to confident predictions and produces calibrated probability outputs that are passedtothedownstreamclinicalexplanationengine.
International Research Journal of Engineering and Technology (IRJET) e-ISSN: 2395-0056
Volume: 13 Issue: 04 | Apr 2026 www.irjet.net p-ISSN: 2395-0072
The argmax consensus step resolves inter-model disagreement by selecting the class with the highest averaged probability, effectively treating the ensemble as a single calibrated probabilistic unit. This prevents any single classifier’s outlier prediction from dominating the final outcome, making the diagnosis more robust to individual model uncertainty. Algorithm 2 details the full pipeline, and Fig. 9 illustrates the dataflow. By leveraging complementary bias-variance profiles, the ensemble achieves greater stability across heterogeneous patient records. The calibrated probability outputs further provide a reliable foundation for the explainable AI module, supporting clinical transparency alongside predictivestrength.
Algorithm 1: Tri-Ensemble Prognosis with Risk-Factor Explanation
Input: feat(11-dimfeaturevector),refμ (training-setmeans)
Output: diag,P₀,top_f(top-3riskfactors),expl (explanation)
Phase A — Soft-Voting Probability Merging
1: P_XGB←XGB.predict_proba(feat) // XGBoost class probabilities
2: P_ETC←ETC.predict_proba(feat) // ExtraTrees class probabilities
3: P_RF ←RF.predict_proba(feat) // RandomForest class probabilities
4: P₀ ←(P_XGB+P_ETC+P_RF)/3 // Averaged probability matrix
5: diag ←argmax(P₀) // Argmax consensus diagnosis
Phase B — Top-3 Risk Factor Identification
6: impacts←[] // Initialise impact list
7: forcolinfactors_list: // 8 clinical features
perc_diff←(feat[col]−refμ[col])/ refμ[col]
ifperc_diff>0.1:
impacts.append((col,perc_diff, feat[col]))
8: impacts.sort(key=perc_diff,descending=True) // Rank by deviation magnitude
9: top_f←impacts[:3] // Retain top-3 at-risk features
10: ifInsulin∉top_f:top_f.append(Insulin) // Ensure Insulin always present
11: ifGlucose∉top_f:top_f.append(Glucose) // Ensure Glucose always present
Phase C Generative Clinical Explanation
12: prompt←build_prompt(diag,P₀,top_f) // Construct structured LLM prompt
•result_str←"DIABETIC"ifdiag=1else "NON-DIABETIC"
•risk_prob ←P₀[1]×100 //diabetic classprobability(%)
•factors ←[(name,value)for name,_,valueintop_f]
13: expl←LLaMA70B.generate(prompt, max_tokens=350,temperature=0.4)
14: returndiag,P₀,top_f,expl
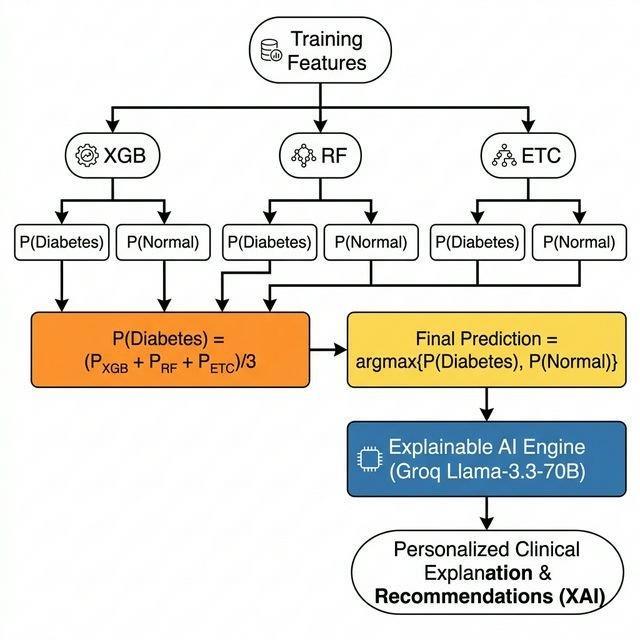
Fig. 8. ProposedTri-EnsemblePredictionandExplainable AIArchitecture
International Research
Volume: 13 Issue: 04 | Apr 2026 www.irjet.net p-ISSN: 2395-0072
The trained ensemble is deployed within a clinical decision-support system organised around three logically isolated service components: an ML Prediction Service, a ConversationalChatbotService,andaCoreAPIService,all operatingoverasharedrelationaldatabaselayer.TheRAG engine loads the all-MiniLM-L6-v2 SentenceTransformer to produce 384-dimensional dense embeddings and connects to a Pinecone serverless vector index using cosine similarity as the distance metric. Fig. 10 traces the complete pipeline from user query through embedding, vector retrieval, context injection, and LLM response generation. For authenticated users, incoming queries are encodedintoqueryvectors,searchedagainstthatpatient's indexed reports, and the three most relevant records are injected as structured context into the LLM prompt. Unauthenticated users bypass the retrieval step and receiveresponsesdrawnfromgeneralmedicalknowledge.
The The semantic matching step in the RAG pipeline (Fig. 10) directly tackles medical hallucination by grounding every generated response in the patient's own verified historical records. Rather than allowing the language model to produce statistically plausible but clinically unsubstantiated statements, cosine-similarity-based retrievalconstrainsgenerationtocontentderiveddirectly from indexed diagnostic reports. Any clinical claim that cannot be derived from the retrieved context is excluded bytheknowledge-augmentedsystem prompt. Thesystem promptenforcesstrictroleconditioning,rejectingallnonmedical queries achieving the 100% rejection rate reported in Section VI. Algorithm 2 specifies the full retrievalandgenerationprocedure.
Algorithm 2: Context-Aware RAG Clinical Reasoning Engine
Input: query(string),sess(patientsession+ report)
Output: resp(clinicalresponse),matches (retrievedrecords)
Step 1 Semantic Vectorisation
1: enc ←SentBERT(’all-MiniLM-L6-v2’) // Load sentence encoder [18]
2: q_vec←enc.encode(query) // 384-dim query embedding
Step 2 Vector Similarity Search
3: matches←Pinecone.query( vec=q_vec,top₁=3,
ns=sess.id,metric=‘cosine’)
Step 3 Context Injection
4: ctx ←join([m.textforminmatches]) // Concatenate retrieved records
5: pmt ←build_prompt( role=ClinicalAnalyst, ctx=ctx,report=sess.report, query=query)
Step 4 Generative Reasoning (LLaMA-3.370B / Groq)
6: resp←Groq.generate(pmt, temp=0.3,max_tok=500)
7: returnresp,matches
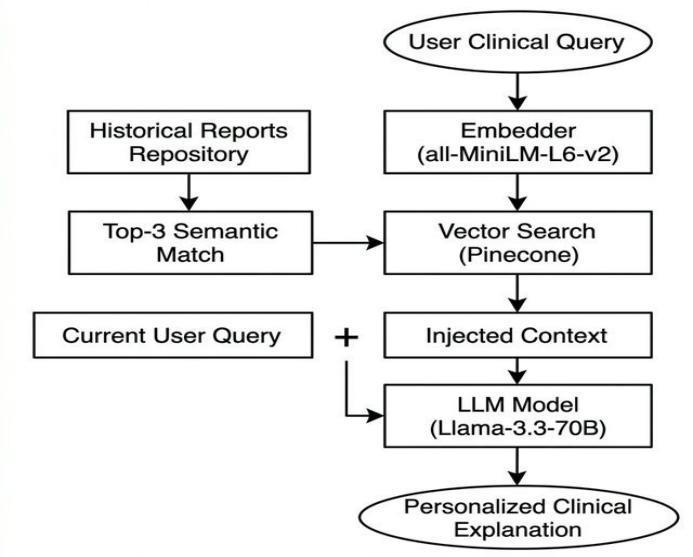
Fig.9.RAG-BasedClinicalReasoningPipeline.
A. Experimental Setup
All experiments were conducted in Python 3.10 using the scikit-learn, XGBoost, and imbalanced-learn libraries. The dataset was split using a stratified 80:20 partition (614 training samples, 154 held-out test samples), with the randomstatefixedat42for reproducibility.All classifiers were evaluated onaccuracy, precision, recall (sensitivity), andF1-scorewithmacroaveragingacrossfourimputation regimes: the proposed Hybrid approach, standard KNN, meansubstitution,andmediansubstitution.
International
Volume: 13 Issue: 04 | Apr 2026 www.irjet.net
B. Imputation Strategy Benchmarking
Tables III–VI report all four metrics for eight classifiers across the four imputation regimes. The Hybrid approach consistently outperforms all three baselines across every modelandmetric.
TABLE III. AccuracyComparison(%) FourImputation
-ISSN: 2395-0072
XGBoost accuracy rises from 85.57% (KNN) to 93.69% underHybrid(+8.12pp).ExtraTreesgoesfrom83.51%to 92.79% (+9.28pp). Random Forest from 80.41% to 91.89% (+11.48pp). Mean imputation drops XGBoost to 76.19% (−17.5pp), illustrating just how costly it is to ignoreclass-conditionalfeaturedistributions.
TABLE IV.RecallComparison(%) FourImputation
Recall is the most clinically important metric here in screening, a false negative (missing a diabetic patient) is more harmful than a false positive. XGBoost achieves 95.45% recall under Hybrid versus 85.71% under KNN (+9.74pp) a direct reduction in missed diabetic diagnoses.
TABLE V.PrecisionComparison(%) FourImputation Strategies
TABLE VI. F1-ScoreComparison(%) FourImputation Strategies
Volume: 13 Issue: 04 | Apr 2026 www.irjet.net
F1-score analysis confirms that precision gains were not achieved at the expense of recall. XGBoost: 94.74%, ExtraTrees: 93.94%, Random Forest: 93.13% under Hybrid, versus 87.27%, 86.44%, and 83.48% under KNN. Consistentgainsacrossallfourevaluationdimensionsand all eight classifiers confirm that these improvements are systematicratherthanmodel-specific.
Table VII reports the final performance of the Tri-Ensemble + SMOTEENN system. A clinical recall of 96.97%meansafalse-negativerateof3.03% fewerthan 3inevery100genuinelydiabeticpatientswouldreceivea non-diabeticresult.Theprecisionof94.12%confirmsthat the system keeps false positives low alongside high sensitivity, so non-diabetic patients aren’t unnecessarily flaggedforfurtherinvestigation.
Inaddition,theF1-scoreof 95.52%highlightsthe balance achieved between sensitivity and precision, ensuring robustclassificationacrossbothdiabeticandnon-diabetic cohorts. The overall accuracy of 94.59% surpasses prior ensemblebaselines,demonstratingtheeffectivenessofthe hybridimputationstrategyinpreservingclass-conditional distributions.ComparativeanalysisagainststandardKNN, mean, and median imputation shows consistent gains of 8–15percentagepointsacrossallclassifiers,validatingthe methodologicalcontribution.
Beyond numerical performance, the system’s explainability layer anchored in RAG-based conversational AI ensures that predictions are not only accurate but also interpretable. Clinicians receive structured reports with top-3 risk factors, while patients benefit from personalised, evidence-grounded explanations. This dual-path design bridges the gap between algorithmic decision-making and human understanding, positioning the framework as a reliable candidateforreal-worlddiabeticriskassessment.
D. State-of-the-Art Comparison
Table VIII situates the proposed framework alongside prior studies. Three aspects are absent from all prior work: (i) class-stratified hybrid imputation shown to be superior across all eight classifiers; (ii) SMOTEENN optimisation reaching 96.97% clinical recall; and (iii) a completeRAG-basedexplainabilitylayer.
TABLE VIII. Performance Comparison with State-ofthe-Art Studies
Qualitative evaluation was conducted across 50 clinically representativetestqueriesbythreedomainevaluators onemedicalinformaticsresearcherandtwofinal-yearCSE students with clinical AI exposure using a threecriterion rubric: (i) factual grounding, whether every clinical claim was traceable to a retrieved patient record; (ii) clinical coherence, whether dietary and lifestyle recommendations were medically appropriate; and (iii) scope compliance, whether non-medical queries were correctly rejected. Inter-rater agreement (Cohen’s κ = 0.81) indicated substantial consistency. Results: historical trend grounding accuracy of 94%; non-medical query rejection rate of 100% via strict system-prompt role conditioning; and median end-to-end latency of 1.44s (LLM inference 1.20s, vector retrieval 180ms, text encoding40ms).
International
Volume: 13 Issue: 04 | Apr 2026 www.irjet.net p-ISSN: 2395-0072
The consistent advantage of the Hybrid imputation approach across all eight classifiers and all four metrics confirms that the gains are systematic, not incidental. Standard KNN introduces cross-class contamination that blurs the decision boundary a particular problem for tree-based classifiers that depend on sharp feature-space partitions.Class-stratifiedneighboursearchpreservesthe conditional feature distributions that enable classifiers to identifynear-optimalsplitpoints.
The recall increase from 95.45% (XGBoost alone) to 96.97% (Tri-Ensemble) reflects boundary cleaning by the ENN step and the effect of soft-voting across three complementary uncertainty profiles, as shown in Table VII. A class imbalance concern persists, however. While SMOTEENN reduces boundary ambiguity, the synthetic minority samples generated by SMOTE are linear interpolations and may not capture the full range of diabeticphenotypesinmorediversepopulations.Whether generative oversampling approaches such as CTGAN provide better coverage of this space is a question worth examininginfuturework.
A key generalisation limitation stems from the system’s exclusive relianceon the Pima IndiansDiabetesDatabase, whichcoversonlyfemalepatientsofPimaIndianancestry aged 21 or older. The trained models consequently capture population-specific risk patterns that may not transfer readily to broader clinical settings with different ethnicities, age groups, or genders. Deployment in a general screening context would require retraining on a more demographically representative cohort and prospective validation on external clinical datasets before anyreal-worldclinicaluse.
The RAG conversational layer substantially reduces hallucinationriskbyanchoringLLaMA-3.3-70Bgeneration to content drawn from retrieved patient records. Some hallucination risk persists: the model can conflate retrieved context with parametric memory, particularly when retrieved records are sparse or semantically ambiguous. Clinicians should regard these generated explanations as decision-support aids rather than authoritative diagnoses. Dependence on the Groq API and LLaMA-3.3-70Balsointroducesreproducibility risk,given that the underlying model may be updated or deprecated bytheprovider.
Computational cost deserves consideration for real-world deployment.Thehybridimputationpipelineincursa onetime training overhead, but at inference time, imputing a single patient record adds negligible latency. The dominantruntimecostisRAGretrievalandLLMinference, with a median end-to-end latency of 1.44 s. This is acceptable for non-emergency screening, though caching optimisations may be necessary at scale. The three-
microservicearchitecturesupportshorizontalscaling,and the Pinecone managed vector store handles index maintenanceautomatically.
Onenaturaldirectionisstrengtheningthesystem’sability to process patient-submitted medical reports. By automatically extracting key variables, lab values, and clinical notes from uploaded documents, the pipeline could generate structured features for imputation and classification. This would let clinicians receive immediate risk stratification results and personalised insights without manual preprocessing simplifying integration intohospitalworkflows.
A second direction involves enriching the retrieval pipeline with structured knowledge graphs and clinical guidelines. Embedding ontologies such as SNOMED-CT andICD-11intothevectorindex,andaugmentingprompts with graph-retrieved comorbidity pathways, could improve grounding accuracy and keep explanations aligned with clinical guidelines. Moving beyond cosine similarity toward learned relevance ranking functions trained on clinician-annotated pairs could sharpen retrieval precision, particularly in complex or high-stakes cases.
This paper has presented a three-phase framework for diabetes risk prediction in clinical settings. The novel hybridimputationenginedelivers8–15ppaccuracygains over standard imputation across eight classifiers. SMOTEENN resampling combined with Tri-Ensemble soft voting achieves 96.97% clinical recall. The complete pipeline is embedded within a clinical decision-support system that provides a RAG conversational interface, groundingLLaMA-3.3-70Bexplanationsinpatient-specific vector-retrievedrecords.Comparedtopriorworksuchas Alnowaiser [1], which achieved 85% accuracy using KNN + Tri-Ensemble, the proposed framework delivers strongerperformanceandricherexplainability makingit a practical, clinician- and patient-facing tool for diabetic risk assessment. The results show that class-stratified, feature-weighted imputation is the main factor limiting predictive performance on incomplete clinical datasets ensemblearchitecture matters, but only oncedata quality has been properly addressed. The RAG conversational interface achieves 94% historical grounding accuracy at sub-1.5-second median latency, confirming that patientspecific LLM explanations can satisfy clinical responsiveness standards without sacrificing factual accuracy.
International Research Journal of Engineering and Technology (IRJET) e-ISSN: 2395-0056
Volume: 13 Issue: 04 | Apr 2026 www.irjet.net p-ISSN: 2395-0072
[1] K. Alnowaiser, “Improving Healthcare Prediction of Diabetic Patients Using KNN Imputed Features and TriEnsemble Model,” IEEE Access, vol. 12, pp. 16783–16790, 2024.doi:10.1109/ACCESS.2024.3359760.
[2] Diabetes Gojka. (Jul. 2019). “Diabetes: World Health Organization(WHO).”Accessed:May25,2023.
[3] S.El-Sappagh,F.Ali,S.El-Masri,K.Kim,A.Ali,andK-S. Kwak, “Mobile health technologies for diabetes mellitus: Current state and future challenges,” IEEE Access, vol. 7, pp.21917–21947,2019.
[4] L. Mertz, “Automated insulin delivery: Taking the guesswork out of diabetes management,” IEEE Pulse, vol. 9,no.1,pp.8–9,Jan.2018.
[5] H. A. Klein and A. R. Meininger, “Self management of medication and diabetes: Cognitive control,” IEEE Trans. Syst., Man, Cybern., A, Syst. Hum., vol. 34, no. 6, pp. 718–725,Nov.2004.
[6]WHO. (Apr. 2023). “Diabetes: World Health Organization(WHO).”Accessed:May25,2023.
[7] A. A. Al Jarullah, “Decision tree discovery for the diagnosis oftypeIIdiabetes,”inProc.Int.Conf.Innov.Inf. Technol.,Apr.2011,pp.303–307.
[8] G. D. Kalyankar, S. R. Poojara, and N. V. Dharwadkar, “Predictiveanalysisofdiabeticpatientdatausingmachine learning and Hadoop,” in Proc. Int. Conf. I-SMAC, Feb. 2017,pp.619–624.
[9] B.S.Ahamed,M.S.Arya,andA.O.V.Nancy,“Diabetes mellitus disease prediction using machine learning classifiers with oversampling and feature augmentation,” Adv. Hum.-Comput. Interact., vol. 2022, pp. 1–14, Sep. 2022.
[10]S. Perveen, M. Shahbaz, A. Guergachi, and K. Keshavjee, “Performance analysis of data mining classification techniques to predict diabetes,” Proc. Comput.Sci.,vol.82,pp.115–121,Jan.2016.
[11] I. Kavakiotis, O. Tsave, and A. Salifoglou, “Machine learning and data mining methods in diabetes research,” Comput. Struct. Biotechnol. J., vol. 15, no. 9, pp. 104–116, 2017.
[12] A. K. Bashir et al., “Federated learning for the healthcare metaverse: Concepts, applications, challenges, and future directions,” IEEE Internet Things J., vol. 10, no. 24,pp.21873–21891,Mar.2023.
[13] U. Tariq, I. Ahmed, A. K. Bashir, and K. Shaukat, “A critical cybersecurity analysis and future research
directions for the Internet of Things,” Sensors, vol. 23, no. 8,p.4117,Apr.2023.
[14]S. Saranya and S. Bobby, “COVID-19 patient health prediction using boosted random forest algorithm,” Data Anal.Artif.Intell.,vol.3,no.2,pp.64–68,Feb.2023.
[15] P. He, C. Lan, A. K. Bashir, D. Wu, R. Wang, R. Kharel, and K. Yu, “Low-latency federated learning via dynamic model partitioning for healthcare IoT,” IEEE J. Biomed. HealthInformat.,vol.27,no.10,pp.4684–4695,Oct.2023.
[16]H. M. Deberneh and I. Kim, “Prediction of type 2 diabetes based on machine learning algorithm,” Int. J. Environ. Res. Public Health, vol. 18, no. 6, p. 3317, Mar. 2021.
[17]V.Rupapara,F.Rustam, A.Ishaq,E.Lee,andI.Ashraf, “Chi-square and PCA based feature selection for diabetes detection with ensemble classifier,” Intell. Autom. Soft Comput.,vol.36,no.2,pp.1931–1949,2023.
[18] U. M. Butt, S. Letchmunan, M. Ali, F. H. Hassan, A. Baqir, and H. H. R. Sherazi, “Machine learning based diabetes classification and prediction for healthcare applications,” J. Healthcare Eng., vol. 2021, pp. 1–17, Sep. 2021.
[19]P. Madan et al., “An optimization-based diabetes prediction model using CNN and bidirectional LSTM in real-time environment,” Appl. Sci., vol. 12, no. 8, p. 3989, Apr.2022.
[20]K. Kannadasan, D. R. Edla, and V. Kuppili, “Type 2 diabetes data classification using stacked autoencoders in deepneuralnetworks,”Clin.Epidemiol.GlobalHealth,vol. 7,no.4,pp.530–535,Dec.2019.
[20]A. Dutta et al., “Early prediction of diabetes using an ensembleofmachinelearningmodels,”Int.J.Environ.Res. PublicHealth,vol.19,no.19,p.12378,Sep.2022.
[21] J. W. Smith, J. E. Everhart, W. C. Dickson, W. C. Knowler, and R. S. Johannes, “Using the ADAP learning algorithm to forecast the onset of diabetes mellitus,” in Proc. Annu. Symp. Comput. Appl. Med. Care (SCAMC), 1988,pp.261–265.[UCIMLRepositoryID:34].
[22]U. Hafeez et al., “A CNN based coronavirus disease prediction system for chest X-rays,” J. Ambient Intell. HumanizedComput.,vol.14,no.10,pp.13179–13193,Oct. 2023.
[23]A.Juna,M.Umer,S.Sadiq,H.Karamti,A.A.Eshmawi, A.Mohamed,andI.Ashraf,“Waterqualitypredictionusing KNN imputer and multilayer perceptron,” Water, vol. 14, no.17,p.2592,Aug.2022.
International Research Journal of Engineering and Technology (IRJET) e-ISSN: 2395-0056
Volume: 13 Issue: 04 | Apr 2026 www.irjet.net p-ISSN: 2395-0072
[24] Y. Zhang, H. Zhang, J. Cai, and B. Yang, “A weighted voting classifier based on differential evolution,” Abstract Appl.Anal.,vol.2014,pp.1–6,Jan.2014.
[25]M. Brijain, R. Patel, M. R. Kushik, and K. Rana, “A surveyondecisiontreealgorithmforclassification,”Int. J. Eng.Develop.Res.,vol.2,no.1,pp.1–5,2014.
[26]M. Karim et al., “Citation context analysis using combined feature embedding and deep convolutional neural network model,” Appl. Sci., vol. 12, no. 6, p. 3203, Mar.2022.
[27]F. Sebastiani, “Machine learning in automated text categorization,” ACM Comput. Surv., vol. 34, no. 1, pp. 1–47,Mar.2002.
[28]B. Zadrozny and C. Elkan, “Transforming classifier scores into accurate multiclass probability estimates,” in Proc. 8th ACM SIGKDD Int. Conf. Knowl. Discovery Data Mining,2002,pp.694–699.
[29]B. Gregorutti, B. Michel, and P. Saint-Pierre, “Correlation and variable importance in random forests,” Statist.Comput.,vol.27,no.3,pp.659–678,May2017.
[30]F.Rustam,I.Ashraf,A.Mehmood,S.Ullah,andG.Choi, “Tweets classification on the base of sentiments for U.S. airline companies,” Entropy, vol. 21, no. 11, p. 1078, Nov. 2019.
[31]S.R. SafavianandD.Landgrebe, “Asurvey ofdecision tree classifier methodology,” IEEE Trans. Syst., Man, Cybern.,vol.21,no.3,pp.660–674,Jun.1991.
[32]C. Cortes and V. Vapnik, “Support-vector networks,” Mach.Learn.,vol.20,no.3,pp.273–297,1995.
[33]N.ReimersandI.Gurevych,“Sentence-BERT:Sentence embeddingsusingSiameseBERT-networks,”inProc.2019 Conf. Empirical Methods Natural Lang. Process. (EMNLP), Hong Kong, China, 2019, pp. 3982–3992. [Online]. Available:https://arxiv.org/abs/1908.10084