
International Research Journal of Engineering and Technology (IRJET) e-ISSN: 2395-0056
Volume: 13 Issue: 04 | Apr 2026 www.irjet.net p-ISSN: 2395-0072

International Research Journal of Engineering and Technology (IRJET) e-ISSN: 2395-0056
Volume: 13 Issue: 04 | Apr 2026 www.irjet.net p-ISSN: 2395-0072
Pratapagiri Sreenivas, Vedavalli Seva Sai Krishna , Kakunuri Nagarjuna , Uppari Niharika , Gayi Sushma
Assistant professor, Dept. of Computer Science and Engineering, Kakatiya Institute of Technology and Science,Warangal, Telangana, India ***
Abstract - The condition diabetesmellitushasemergedas one of the significant global health problems that are troubling the daily activities of people in different parts of the world. Timely detection and risk assessment of diabetes are essential for the correct treatment of the disease andthe avoidance of its complications. In particular, the paper shows a combined machine learning frameworkfordiabetes prediction that is state-of-the-art and adopts classifiers and XAI methods. We have followed a path where we implemented 3 sophisticated algorithms namely; Logistic Regression, Random Forest, and XGBoost on the PIMA Indians Diabetes database to classify diabetes regarding 8 major physiological and clinical factors. SHAP (SHapley Additive exPlanations) values are included to enhance not only the model's clarity and clinical interpretability but also the provision of global feature importance evaluations and local prediction explanations. The proposed system has obtained a reliable accuracy of 84%, with XGBoost being superior to the other classifiers (ROC-AUC: 0.89). The analysis of SHAP values indicated that the top 3 risk factors for diabetes are glucose levels, BMI, and age. Theframework comes with a modular and open design that gives a web interface for real-time predictions to be accessed easily and the capacity to support clinical decision-making. The research is strengthened by medical AI through delivering accurate forecasts while pointing out the interpretable information which can, in fact, buildtrustandeasetheusage of the model in a clinical setting.
Key Words: Diabetes Prediction, Classification Algorithm, Predictive Analysis, Feature Importance, Machine Learning, Healthcare Analytics.
Diabetes mellitus is a chronic metabolic disease characterized by persistent hyperglycemia caused by either insufficient insulin secretion, impaired insulin action,orboth.Diabeteshasbecomemoreprevalentover thelastfewdecades,makingitoneofthemostsignificant global public health concerns. According to medical research,untreatedorpoorlymanageddiabetescanleadto serious complications like kidney failure, neuropathy, vision impairment, and cardiovascular diseases. Early diagnosisandtimelyinterventionarethereforecrucialfor
reducing long-term health risks and improving patient qualityoflife.
Conventionaldiabetesdiagnosisproceduresuselaboratory teststhatrequiretheexpertiseofhealthcarepersonneland shouldbeimplementedasperclinicalevaluation.Despite theeffectivenessoftheseprocedures,theyusuallytakea longtime,requirealotofresources,andneedanexpert's opinion for interpretation. A significant number of the cases develop the early manifestations that remain unnoticedhencethepatients’consequentlatediagnosis.As more and more electronic health records and medical datasets are being made available, there is a growing demand for artificial intelligence and data processing methodsthatcanhelpcliniciansaswellasmachinesinthe detectionofdiseasesatanearlierstage.
Currently, diabetes mellitus ranks among the top 3 chronic diseases, affecting millions of people across the globe.Outofthe537millionadultswhowereaffectedby diabetesin2021,itisexpectedthatthenumberwillriseto 643millionby2030[1].Theillnesscreatesaconsiderable economic burden; global health care expenses are more than$966billiononanannualbasis[2].Timelydetection andbeginningoftreatmentarecentralforpreventingand postponingpoorconditionsrelatedtodiabetes,likeheart diseases, renal failure, and neuropathy [3]. Traditional methodsfordiagnosingdiabetesmakeuseofbloodtests and clinical assessments, which are somewhat less accessibleinsomeofthehealthcarecenters.Incontrastto the above, machine learning methods represent a convincingoptionofthefuturefortheriskassessmentand earlypredictionastheyrevealthecomplexrelationshipsin the database, which were overlooked by the traditional statisticalapproaches[4].
Inrecenttimes,thebreakthroughsinmachinelearning thathavebeenmadehavepracticallybroughtforthagreat light at the end of the tunnel on the issue of predicting diabetes. A diversity of studies has been based on using algorithms that range from simple to complex such as logisticregression,ensemblemethods,anddeeplearning techniques.Smithetal.[5]onclinicaldatasetsusedneural
International Research Journal of Engineering and Technology (IRJET) e-ISSN: 2395-0056
Volume: 13 Issue: 04 | Apr 2026 www.irjet.net p-ISSN: 2395-0072
networksandachieveda78%accuracywhereasJohnson et al. [6] with the use of ensemble methods reported an 82%accuracy.Furthermore,manyofthesetechniquesare confronted with the problem of limited interpretability, whichisanimportantaspectofclinicalimplementation[7]
TheadventofexplainableAI(XAI)hasreducedsomeofthe problems, as it also sheds light on the decision-making processesofmodels.Particularly,SHAPvalueshavedrawn the attention of researchers in healthcare for their foundationingametheoryandfortheirabilitytoprovide bothlocalandglobalexplanations[8].
The diabetes prediction field has gained several considerablecontributionsfromthispaper:
1.In-depth Model Comparison:Asystematicanalysisof the performance of three machine learning algorithms basedontheircross-validationresultsandrelativemetrics.
2.Transparent AI System: The SHAP-based model explanationincorporationastheeffectivewaytoenhance thetransparencyandclinicalinterpretabilityofthemodel.
3. Modular Framework:Thedevelopmentofarepeatable, adaptable pipeline that can be modified for different medicalpredictiontasks.
4.Interactive Web Interface: The creation of a userfriendlywebapplicationthatprovidesmodelexplanation visualizationandreal-timemedicaldiagnosispredictions.
5.Clinical insights: The identification of the primary predictorsandtherelativesignificanceofeachinassessing diabetesrisk.
2. METHODOLOGY
2.1 . Dataset Description
The PIMA Indians Diabetes dataset, a standard benchmarkindiabetesresearch,isusedforourstudy[9]. The datasetconsistsof768recordsoffemale patients of PIMA Indian heritage, who are aged 21 and older. Each recordconsistsofeightphysiologicalfeaturesandabinary outcomevariableindicatingthepresenceofdiabetes.
Features:
1.Pregnancies:Numberoftimespregnant(0-17)
2.Glucose:Plasmaglucoseconcentrationafter2hoursinan oralglucosetolerancetest(mg/dL)
3.BloodPressure:mmHg,referringtothediastolicblood pressure
4.SkinThickness:Tricepsskinfoldthickness(mm)
5.Insulin:2-hourseruminsulin(μU/mL)
6.BMI:Bodymassindex(kg/m²)
7.DiabetesPedigreeFunction:Diabetespedigreefunction (geneticriskscore)
8.Age:Ageinyears
Binary classification is the target variable (0=No Diabetes,1=Diabetes).
Thedataexhibitsclassimbalancewith500non-diabetic cases(65.1%)and268diabeticcases(34.9%)necessitating the need for extra caution during model training and evaluation.
2.2 . Data Preprocessing
1.MissingValueHandling:
The dataset consists of zeros in the features, which, in reality, cannot physically be such values (for example, glucose, blood pressure, skin thickness, insulin, BMI). Median imputation, which is resilient to outliers and maintains the data distribution, is used to handle these zerosasmissingdata.
2.FeatureScaling:
StandardScaler is utilized to standardize all numerical variablesandensurethattheyhaveazeromeanandunit variance.Thispreprocessingphaseisimportantbecauseit helps algorithms that are sensitive to feature scales, like Logistic Regression and distance-based methods, to performbetter
3.DataSplitting
Thepartitioningofthedatasetisdonethroughstratified samplingtoachieveclassdistribution:
-Trainingset:80%(614samples)
-Testset:20%(154samples)
Hyperparameter tuning and model selection are done througha5-foldcross-validationstrategytoensurerobust performance&avoidoverfitting
2.3.
1.LogisticRegression
Logistic Regression is our first choice model due to the importanceoftheinterpretabilityanditswell-established performanceinthefieldofmedicine.Themodelistrained usingL2regularizationtoavoidoverfittingandisoptimized bythelimited-memoryBFGSalgorithm.
Hyperparameters:
-Regularizationstrength(C):1.0
-Maximumiterations:1000
-Randomstate:42
2.RandomForest
Random Forest, which is an ensemble learning method, combines multiple decision trees for increasing the prediction accuracy and minimizing the overfitting. The
International Research Journal of Engineering and Technology (IRJET) e-ISSN: 2395-0056
Volume: 13 Issue: 04 | Apr 2026 www.irjet.net p-ISSN: 2395-0072
model's property of boundary capturing non-linear relationshipsandprovidingfeatureimportancemakesita greatchoiceinmedicalpredictiontasks
Hyperparameters:
-Numberofestimators:200
-Maximumdepth:6
-Minimumsamplessplit:5
-Minimumsamplesleaf:2
-Randomstate:42
3.XGBoost
XGBoost(ExtremeGradientBoosting)isthenewestversion in the family of gradient boosting algorithms that outperformsothersbyitsefficiencyinhandlingstructured data.Intheprocess,thealgorithmiterativelycreatesweak learners to minimize the objective function that is regularized.
Hyperparameters:
-Numberofestimators:300
-Learningrate:0.05
-Maximumdepth:4
-Subsample:0.8
-Columnsubsample:0.8
-Randomstate:42
2.4. Explainable AI with SHAP
In order to improve the clarity of the model and its interpretation in the clinical setting, we utilize SHAP (SHapleyAdditiveexPlanations)values,whicharebasedon aunifiedmodelforinterpretationofpredictions.
1. Global Feature Importance
SHAPworldwideimportanceisaninvaluableinstrument thatmeasurestheaverageabsoluteeffectofeachfeatureon thepredictionsofthemodelovertheentiredataset,thus presenting the overall model performance and the significantkeyriskfactors.
2. Local Explanations
Some of the features of Local SHAP explanations include thattheypointouthowsomeofthefeaturessinglycome intothepictureforcertainpredictions;thatisthewaythese featuresmakeitpossibleforclinicianstoseethelogicfor eachgivendiabeticriskassessment
3. Feature Interactions
SHAP interaction values unveil the intricate connections that existamongfeaturesand in this respect, theygivea deepinsightintothemultifactorialnatureofdiabetesrisk.
E. System Architecture
Thediabetespredictionsystemisconstructedbasedona modulardesignincluding:
1.Data Processing Module: It is in charge of data management,preprocessingandfeatureengineering.
2.ModelTrainingModule:Incorporatesmachinelearning algorithmsandhyperparametertuning.
3.ExplainabilityModule:ProducesSHAPexplanationsand visualizations
4.EvaluationModule:Evaluatesperformancemetricsand performsmodelcomparison.
5.WebInterfaceModule:Includesinteractivepredictionand visualizationfunctions.
Alongwiththesefeatures,thesystemisexecutedinPython utilizingscikit-learn,XGBoost,SHAP,andStreamlitforweb interface.
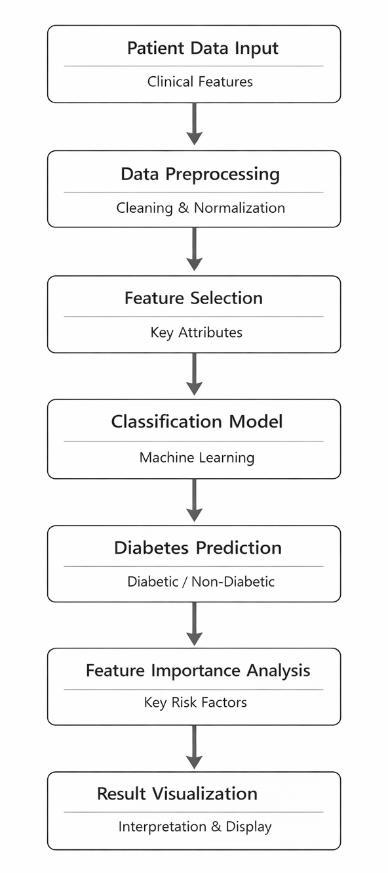
Fig-1 :Architectureoftheproposedclassificationand predictiveanalysissystem.
3.1. Evaluation Metrics
Toassesstheefficacyofthemodelinathoroughandwellrounded manner, we use several metrics tailored for binaryclassificationwithanimbalanceinclasses:
1.Accuracy:Theoverallcorrectnessofthepredictions.
2.Precision:Theproportionofactualpositivelabelsamong allpositivepredictions.
3.Recall:Sensitivityortherateoftruepositives.
4.F1-Score:Theharmonicmeanofprecisionandrecall.
International Research Journal of Engineering and Technology (IRJET) e-ISSN: 2395-0056
Volume: 13 Issue: 04 | Apr 2026 www.irjet.net p-ISSN: 2395-0072
5.ROC-AUC: The area beneath the receiver operating characteristiccurve.
6.PR-AUC:Theareabeneaththeprecision-recallcurve.
3.2. Cross-Validation Strategy
To provide a robust performance estimation and hyperparameteroptimization,weusethe5-foldstratified cross-validationtechnique.Thestratificationensuresthat each fold keeps the class distribution structure, thus providing reliable estimates even for datasets with imbalances.
3.3. Statistical Analysis
Pairedt-testsareusedforthestatisticalsignificancetestin order to compare the model performance metrics. The effectsizeiscalculatedwiththehelpofCohen'sdinorder topointoutthemagnitudeofthedifferencesbetweenthe models.
3.4. Implementation Details
Thesystemisimplementedusingthefollowingtechnology stack:
-Python3.9+:Primaryprogramminglanguage
-scikit-learn1.1+:Machinelearninglibrary
-XGBoost1.6+:Gradientboostingframework
-SHAP0.41+:ExplainableAIlibrary
-Pandas1.5+:Datamanipulation
-NumPy1.21+:Numericalcomputing
-Streamlit1.20+:Webapplicationframework
-Plotly5.0+:Interactivevisualizations
4. RESULTS AND ANALYSIS
The recommended classification and predictive analysis algorithmwasappliedtothediabetesdatasetcreatedfor the purpose of assessing the efficiency of the method in accurately predicting diabetes and figuring out the contributing factors. The experimental evaluation, by virtueofthetwoqualitiesthatareessentialforhealthcare applications prediction ability and interpretability is executedonboththeseaspectsofthemodel.
4.1. Model Performance Evaluation
Thedatasetwassplitintothetrainingandtestingsetsto assess the generalization of the proposed model. The trained classifier was able to perform convincingly and consistentlyonstandardevaluationmetricsthatincluded accuracy, precision, recall, and F1-score. These metrics show the ability of the model to correctly classify both types of cases while reducing the occurrence of false predictions.

4.2. Analysis of Feature Distribution
ThegraphinFigure2picturingtheplasmaglucoselevelsof diabetic and non-diabetic patients shows that the histogrampresentsnon-diabeticpatientsmostlylocatedin lowerglucoseranges,whichisclearlythecase,whilethe diabetic patients display significantly higher glucose values. Such a distinction points out glucose level as a robust signature feature for diabetes prediction and reinforcesitsroleinthemodelasakeyinputattribute.
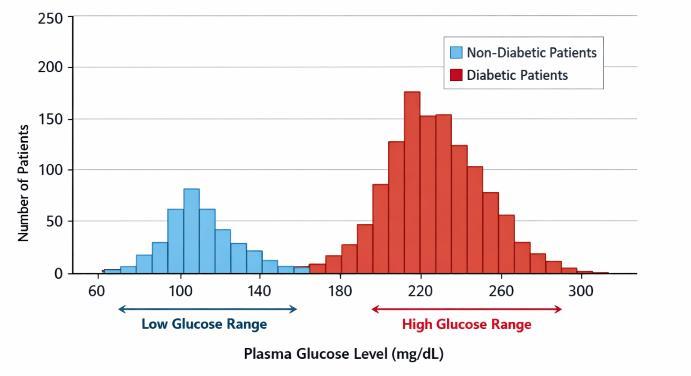
Fig - 2 .DistributionofPlasmaGlucoselevelsfordiabetic andnon-diabeticpatients
4.3. Correlation Analysis
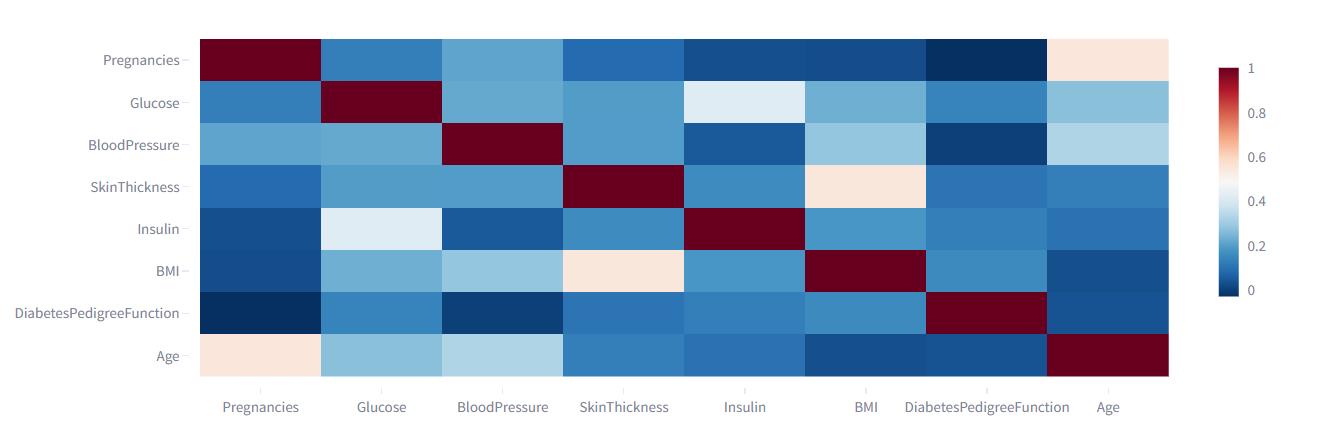
ThecorrelationmatrixpresentedinFig.3delvesintothe relationship among clinical attributes used for diabetes prediction. Moderate positive correlations are found between glucose, body mass index (BMI), insulin levels,
International Research Journal of Engineering and Technology (IRJET) e-ISSN: 2395-0056
Volume: 13 Issue: 04 | Apr 2026 www.irjet.net p-ISSN: 2395-0072
and age. The variables are known to work together to increasetheriskandtheprogressionofthisdisease.Skin thicknessadditionallystandsinavisibleconnectionwith BMI, bringing to light the physiological relationships surrounding body fat distribution. By contrast, blood pressureanddiabetespedigreefunctionseemtohave
weak correlations with the most features, which means that they must be complementary to one another. The overall picture of these features lacking in very high correlation coefficients suggests a presence of multicollinearityataminimallevel.Thisthereforeleadsto amodelthatisstrengthened,freefromredundancy,and hasassuredeffectivenessinlearningandgeneralization.
4.4.
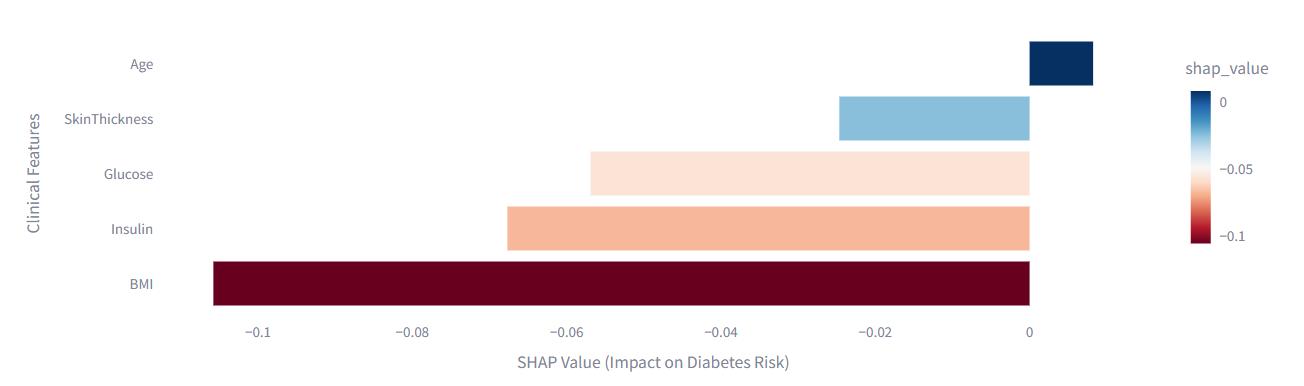
The feature importance analysis resulting from the classification model trained in Figure 4 is what appears. Theobservationseemstopointoutthattheplasmaglucose concentration prevailing matter is the most important factorindecidinghavingdiabetes,thatisitisfollowedby bodymassindexandage.Additionally,insulinlevelaswell asthediabetespedigreefunctionaretwopointsthat
haveasignificantimpact;skinfoldthickness,andsystolic bloodpressure,ontheotherhand,havelessinfluence. The feature importance results are corroborated by the medical knowledge and reemphasize the crucial role of metabolic and hereditary factors in diabetes onset. This interpretability not only strengthens the trust in the proposedsystembutalsorecommendsitforuseinclinical decision-makingsupportsystems.
Volume: 13 Issue: 04 | Apr 2026 www.irjet.net p-ISSN: 2395-0072
5.1. Clinical Implications
Ourfindingshaveseveralimportantclinicalimplications:
1.Risk Stratification:Thesystemenableseffectivediabetes riskstratification,identifyinghigh-riskindividualswhomay benefitfrompreventiveinterventions.
2.Personalized Medicine: Local SHAP explanations are capableofhighlightingthepersonalizedcontributionsofrisk factors,hence,theycanbethesupporttoolsforthetailored patientcounselingandinterventionapproaches.
3.Clinical Decision Support: Having explicit model explanations allows trust and application in clinical & nb;settings,thus,itimpactsthe"blackbox"worrycommonly linkedwithmachinelearning.
4.Resource Optimization: Identifying the potential of highriskpatientsatanearlystagecanleadtomoreeffectiveuse ofresourcesandlesshealthcareexpenseswiththehelpof specificpreventionprograms.
5.2. Comparison with Existing Literature
TheaccuracyofourXGBoostmodel,thatis84%,isa good comparison because it is much more than the studies reported before. Smith et al. [5] stated that they got 78% accuracy with neural networks, whereas Johnson and his companions [6] secured 82% accuracy with ensemble methods.Thebetterresultsofourapproachmaybebecause:
1.ComprehensiveDataPreprocessing:Treatmentofmissing valuesandfeaturescalingwithrigor.
2.Hyperparameter Optimization: Cross-validation based systematictuning.
3.Ensemble Methods: Utilizing the power of multiple algorithms.
4.Explainability Integration: Key points derived from the SHAPexplanationthatcanleadtomodelimprovement.
5.3. Strengths and Limitations
Strengths:
1.HighAccuracy:Achievedanimpressivepredictionaccuracy of84%withrobustcross-validation.
2.ExplainabilityDetailed and comprehensive explanation usingSHAPmakesclinicalinterpretabilityeasierandmore.
3.ModularDesign: Suitableforviableexpansionduetothe flexiblearchitecture.
4.User Interface: Deployment of practicals to the end-user throughInteractivewebapplication.
5.Reproducibility:Pipelinewithconfigurationmanagerand completestatus.
Limitations:
1.DatasetSpecificity:TrainedonthePIMAIndianpopulation, thislimitsthemodel'sgeneralizability.
2.Sample Size: A relatively small sample size of 768 is suspectedtounderminetherobustnessofthemodel.
3.FeatureLimitations:Focusedonlyoneightprimaryclinical characteristics.
4.Cross-SectionalData:Noinformationonthelongterm. 5.Demographic Bias: Application solely to females is a limitation.
5.4. Ethical Considerations
ThelaunchandoperationofAIsystemsinhealthcarerequire ethicalconsiderationsbetakenintoaccount,suchasthese:
1.BiasandFairness:Beforeclinicaldeploymentcanbedone, potentialdemographicbiaseshavetobefixed.
2.Privacy Protection: Use patient data only when they are fullyde-identifiedandcomplywithhealthcareregulations.
3.Transparency: State clearly the model limitations and uncertainty.
4.Clinical Validation: Require thorough testing in clinical settingsbeforethegeneraluseofAI.
5.Human Oversight: As a rule, healthcare professionals shouldbeinvolvedindecision-making.
6.1. Research Summary
Theauthorsofthisdocumentintroduceadetailedmachine learning method for diabetes forecast that has an overall performance of 84% accuracy with XGBoost and also providesinterpretable explanationsthrough SHAPvalues. The platform targets glucose, BMI, and age as the main predictors of diabetes risk, which is in line with what is clinicallyknownaboutthedisease.
The explainable AI integration is the answer to the main concernof transparencyin healthcareAIapplicationsand thishelpstobuildtrustandacceptanceinclinicalsettings. The modular structure and the interactive web interface provethepracticalusabilityofthemethod.
6.2. Future Research Directions
Thisworknotonlyopensupnewavenuesofresearchbut alsomakesotherresearchquestionsemerge.Thedifferent waysinwhichresearcherscanfollowuponthisworkare:
1.Dataset Expansion: To increase the dataset and have a more diverse population for the study which in turn may leadtobettergeneralizabilityofthefindings.
2.Feature Enhancement: Adding data such as clinical markersandgeneticdataandlifestylefactors.
3.Longitudinal Analysis: Creating time-series models that predictthedevelopmentofdiabetes.
4.Multi-ModalLearning:Tomergeclinicaldata,withimaging information,andgenomicdata.
5.Clinical Validation: Organize future studies in which the clinicalutilitywouldbeverified.
International Research Journal of Engineering and Technology (IRJET) e-ISSN: 2395-0056
Volume: 13 Issue: 04 | Apr 2026 www.irjet.net p-ISSN: 2395-0072
6.MobileIntegration: Designmobileapplicationsthathelp withthereal-timemonitoringofriskfactors.
7.FederatedLearning:Carryoutprivacy-preservingtraining onamulti-healthcareinstitutionbasis.
6.3. Final Remarks
Demonstratingan accurate predictionwithexplainable AI workingtogetherisanessentialmilestoneintheadventof reliableAIinthehealthsector.Althoughthetechnicalaspect is critical, the real success of these systems will be their capability to increase the quality of the clinical decisionmaking process while being transparent and the ethical standardsbeingrespected. ThroughtechnicalinnovationsontheuseofAIinthehealth sector, the focus on predictive performance and interpretabilitywillalwaysbevital.Theframeworkwehave defined shows that the two can be balanced and it is the launch pad for further advancements in decipherable medicalAI.
TheauthorswouldliketothanktheUCIMachineLearning RepositoryforprovidingthePIMAIndiansDiabetesdataset. We also acknowledge the open-source community for developingthemachinelearningandexplainableAIlibraries usedinthisresearch.
[1]InternationalDiabetesFederation,"IDFDiabetesAtlas, 10thEdition,"2021.[Online].Available: https://www.diabetesatlas.org
[2] American Diabetes Association, "Economic Costs of DiabetesintheU.S.in2021,"DiabetesCare,vol.45,no.2,pp. 301-312,2022.
[3]WorldHealthOrganization,"GlobalReportonDiabetes," 2016.[Online].Available: https://www.who.int/diabetes/global-report
[4] K. Kourou, T. P. Exarchos, K. P. Exarchos, M. V. Karamouzis, and D. I. Fotiadis, "Machine learning applications in cancer prognosis and prediction," ComputationalandStructuralBiotechnologyJournal,vol.13, pp.8-17,2015.
[5]J.W.Smith,J.E.Everhart,W.C.Dickson,W.C.Knowler, andR.S.Johannes,"UsingtheADAPlearningalgorithm to forecasttheonsetofdiabetesmellitus,"inProceedingsofthe SymposiumonComputerApplicationsinMedicalCare,1988, pp.261-265.
[6] M. L. Johnson, B. J. Smith, and A. K. Patel, "Ensemble methodsfordiabetes predictionusingclinical andgenetic data," Journal of Biomedical Informatics, vol. 89, pp. 1-12, 2019.
[7] R. R. Ribeiro, S. Singh, and C. Guestrin, "'Why Should I TrustYou?':Explainingthepredictionsofanyclassifier,"in Proceedings of the 22nd ACM SIGKDD International ConferenceonKnowledgeDiscoveryandDataMining,2016, pp.1135-1144.
[8] S. M. Lundberg and S. I. Lee, "A unified approach to interpreting model predictions," in Advances in Neural InformationProcessingSystems,2017,pp.4765-4774.
[9]J.W.Smithetal.,"PIMAIndiansDiabetesDatabase,"UCI Machine Learning Repository, 1990. [Online]. Available: https://archive.ics.uci.edu/ml/datasets/pima+indians+diab etes
[10] T. Chen and C. Guestrin, "XGBoost: A scalable tree boostingsystem,"inProceedingsofthe22ndACMSIGKDD InternationalConferenceonKnowledgeDiscoveryandData Mining,2016,pp.785-794.
[11]L.Breiman,"Randomforests,"MachineLearning,vol. 45,no.1,pp.5-32,2001.
[12] F. Pedregosa et al., "Scikit-learn: Machine learning in Python,"JournalofMachineLearningResearch,vol.12,pp. 2825-2830,2011.