
International Research Journal of Engineering and Technology (IRJET) e-ISSN: 2395-0056
Volume: 12 Issue: 08 | Aug 2025 www.irjet.net p-ISSN: 2395-0072
International Research Journal of Engineering and Technology (IRJET) e-ISSN: 2395-0056
Volume: 12 Issue: 08 | Aug 2025 www.irjet.net p-ISSN: 2395-0072
ER. SAMIR KUMAR SINGH
Asst. Manager, Design Departments, UMSL Limited, Bhubaneswar, Odisha
Abstract - This study presents a simulation-basedanalysis of a high-rise (21+G floor) reinforced concrete building The simulations were carried out using ANSYS 17.2 software, utilizing its "Static Structural", "Modal", and "Response Spectrum" tools to evaluate the performance of the building under various loading conditions.
The structural response of the building was analysed under dead load (DL) and live load (LL) using the Static Structural tool. The Modal analysis was performed to determine the natural frequencies and vibration modes of different shear wall orientations. Finally, seismic performance was assessed through Response Spectrum Analysis, simulating ground excitation forces to evaluate earthquake resistance.
The focus of this research is to determine the most effective orientation of shear walls to optimize the lateral resistance of the structure. Five different shear wall configurations were modelled and compared for their performance under seismic loading. The building analyzed has a total height of 128.7 m, with dimensions of 60 m x 30 m and total floor area of 52636.5 m². Key structural elements include M30 concrete columns (1 m × 1.2 m), beams (1.2 m × 1.2 m), slab thickness of 0.15 m, and shear walls of 0.15 m thickness.
This study highlights the importance of strategic shear wall placement in tall buildings to enhance structural stability under lateral loads such as wind and earthquakes. The results provide guidance for optimal shear wall design andcontribute to safer and more resilient high-rise structures.
Key Words: Shear wall orientation, tall building simulation,ANSYS17.2,Responsespectrumanalysis, Earthquakeresistance,High-risestructure,FEM.
1.INTRODUCTION
I am using ANSYS 17.2 software for simulation work. For analysingdeadload(DL)andliveload(LL)onatallbuilding, I use the Static Structural tool. To determine the natural frequenciesofdifferentbuildingtypes,IusetheModaltool. Finally,earthquakeanalysisisperformedusingtheResponse Spectrumtool.
Theaimofthissimulationistoidentifythebestorientation of shear walls to resist ground excitation forces. For this purpose, five different shear wall orientations are considered.
Shear walls are vertical structural elements designed to resistlateralforcesparalleltotheirplane,suchasthosefrom wind or earthquakes. In slender walls, they resist loads through cantilever action. They act as rigid vertical diaphragms,transferringlateralloadsfromfloors,roofs,and wallstothefoundation.
These walls are critical in high-rise buildings to control lateral displacement and resist torsional forces caused by wind,seismicactivity,orunevensettlement.Shearwallsare generallyplaneorflangedinsection,whilecorewallsoften havechannelsections.Theirpositionandshapesignificantly affectbuildingbehaviour.Structurally,theideallocationis central in each half of the building, but due to space constraints,theyareoftenplacedatends,aroundliftshafts, stairwells,orwindowlesssidewalls tominimizeopenings andmaintainstiffness.
Inmysimulation,Iamanalyzingatall,frame-structured buildingwithanovalshape.Theovalformhasbeenchosen asitisoptimizedtoreducewindforcesactingonthebuilding surface, as supported by the findings in the paper "TallBuilding Structure Shape Optimization using Computational Fluid Dynamic (CFD)." [1]Thebuildingconsistsof21floors aboveagroundfloor(21+G),withanoverallheightof128.7 meters.Ithasalengthof60metersandawidthof30meters, resultinginatotalfloorareaof52,636.5m².
Eachfloorhasaheightof5.85meters,whilethestructural columnsare4.5meterstallandspaced10meterscenter-tocenter. The building features slabs with a depth of 0.15 meters, columns measuring 1 meter by 1.2 meters, and beamswithdimensionsof1.2metersby1.2meters.Shear wallsarealsoincluded,eachwithathicknessof0.15meters.
M30gradeconcreteisusedforallstructuralcomponents, withadensity(ρ)of2400kg/m³andaPoisson’sratio(µ)of 0.15. The simulation considers an environmental temperatureof22°C.
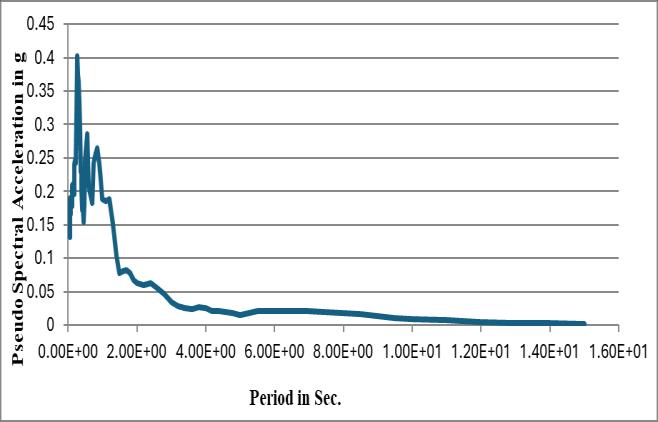
In my simulation, I am using the computed response spectrum data from the Bhuj Earthquake to analyse the seismic performance of the tall building. The earthquake eventoccurredon26thJanuary2001at08:46:42.9IST,with
International Research Journal of Engineering and Technology (IRJET) e-ISSN: 2395-0056
Volume: 12 Issue: 08 | Aug 2025 www.irjet.net p-ISSN: 2395-0072
amagnitudeof7.0Mbor7.6Ms.Theresponsespectrumdata usedinthisanalysiswasobtainedfromtheDepartmentof Earthquake Engineering, Indian Institute of Technology Roorkee,Roorkee-247667,India.
ThedatacorrespondstorecordingsfromtheAhmedabad station,locatedat latitude 23°02′N andlongitude 72°38′E, with the compass direction-oriented N 78° E. The accelerogram was bandpass filtered between 0.07 Hz and 27.0Hz,anda5%dampingratioisconsideredintheanalysis, whichistypicalforreinforcedconcretestructures.
TheaccelerationresponsespectrumofBhujEarthquakeis showninthefollowingFig-1.
In earthquake engineering, lumped mass systems are a common way to idealize structures for dynamic analysis. Thesesystemsassumethatmassisconcentratedatdiscrete points (typically at floor levels), while the stiffness is distributedthroughthestructuralelements(likebeamsand columns). Two widely used methods for analyzing such systemsunderearthquakeloadingare:
1. ResponseHistoryAnalysis(RHA)
2. ResponseSpectrumAnalysis(RSA)
Response History Analysis (RHA) is concerned with the calculationofstructuralresponseasafunctionoftimewhen thesystemissubjectedtogivegroundacceleration.TheRHA procedure is first presented for an arbitrary structural configuration and subsequently specialized for multistory buildingwithasymmetric planandformultistorywithan unsymmetrical plan. Response History Analysis (RHA) is devoted mainly to a single component of ground motion, typicallyoneofthehorizontal components.Combiningthe structural responses determined from such independent analysesforeachexcitationcomponentgivestheresponseof the linear system to multiple-component excitation. Also developedisproceduretoanalyzetheresponseofstructure subjected to different prescribed motions at various
supports.ResponseHistoryAnalysis(RHA)endswithabrief section on the principal requirements that the structural idealizationmustsatisfysothattheresponseofastructure predictedbyanalysisagreessatisfactorilywiththerecorded duringanearthquake.
Response Spectrum Analysis (RSA) is concerned with procedurestocomputethe“peak response”ofastructure duringanearthquakedirectlyfromtheearthquakeresponse spectrumwithouttheneedforresponsehistoryanalysisof the structure. This procedure is not an exact predictor of peakresponse,butitprovidesanestimatethatissufficiently accurateforstructuraldesignapplications.ResponseHistory Analysis(RHA)procedureprovides“structuralresponse”as afunctionoftime,butthestructuraldesignisusuallybased on the peak values of forces and deformation over the durationoftheearthquake-inducedresponse.
Thefiniteelementanalysis(FEA)isanumericaltechnique, whichisusedtoobtaintheapproximatesolutionincomplex engineering problems. It is a matrix-oriented method and computer-based solution method also. In “finite element analysis”thegivensystemwhichisdividedintosmallersubdivisionthatisknownas‘finiteelement’foranalysis.Further sub-division(elements)assumedtobeconnectedinafinite number of points called as nodal points. So the basic elements as three nodes but any number of nodes can be introduced in an element. Matrix displacement method is applicableonlytotheskeletonstructure.Todeterminethe elementcharacteristicinfiniteelementanalysis(FEA)the valuationofunknownfunctionindisplacementisassumein termofitsnodalvalue.[2]
The study aims to determine the total displacement and story drift of a tall oval-shaped building before and after applyinggroundexcitation.Initially,thebuildingisanalyzed without shear walls, and then with varying numbers and orientationsofshearwallstoassessstabilityimprovements. Theobjectiveistocomparethestorydriftresultswiththe permissiblelimitdefinedinIS:1893(Part1),Clause7.11.1, whichis0.004timesthestoryheight(0.51mfora128.7m tallbuilding).
For analysis, ANSYS tools Static Structure, Modal, and Response Spectrum are used. Static analysis (FEA) considers only dead and live loads (DL + LL), while the modal and response spectrum analyses incorporate earthquake loads (DL + LL + EQ) to evaluate dynamic responsesandoptimizeshearwall orientation forseismic performance.
International Research Journal of Engineering and Technology (IRJET) e-ISSN: 2395-0056
Volume: 12 Issue: 08 | Aug 2025 www.irjet.net p-ISSN: 2395-0072
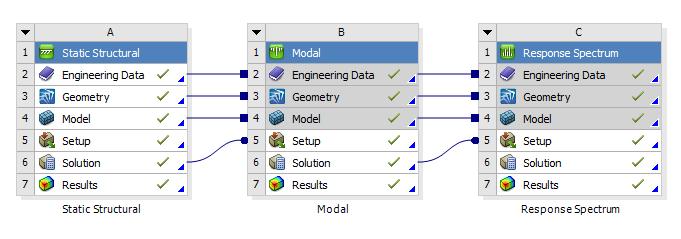
For the purpose of earthquake analysis, the three ANSYS modules Static Structural, Modal, and Response Spectrum wereintegrated,asillustratedinFig-2
4.1
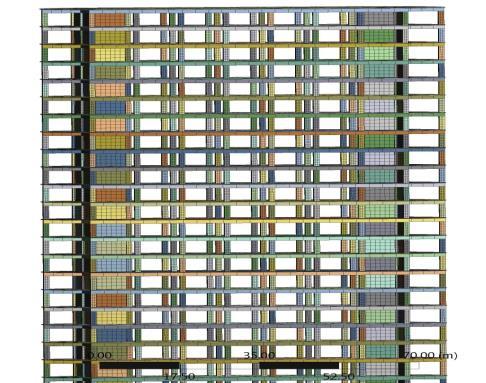
In the static analysis, the objective is to determine the displacementcausedbydeadandliveloads(DL+LL).First, the structural model is created and imported into ANSYS Mechanicalunderthe'Geometry'section.Themodelisthen discretizedintosmallerelementsthroughaprocesscalled meshing,asshowninFig-3.ANSYSoffersvariousmeshing techniques,includingautomatic,tetrahedral,surface,beam, body,andmappedfacemeshing.
After meshing the boundary condition also applied to the model.Forbuildinganalysis,allthecolumnsoftheground floorshouldbefixedsupport.HereIamusingM30concrete material.SoIneedtoassignthematerialineachpartofthe framestructure(i.e.;beam,column,andslab).InAnsys,only twoengineeringdataYoung’smodules(Es)andpoisonratio (µ)requiredtodefinethematerial.
InANSYS,onlytheliveload data ismanuallyinput,asthe deadloadisautomaticallycalculatedbasedonthematerial densityandstandardearthgravity.Forthismodel,standard gravity (9.8 m/s²) acts downward in the negative Zdirection.Allconnectionsbetweenelementsaredefinedas “Bonded”toensureproperstructuralinteraction.[Referto Fig-4]
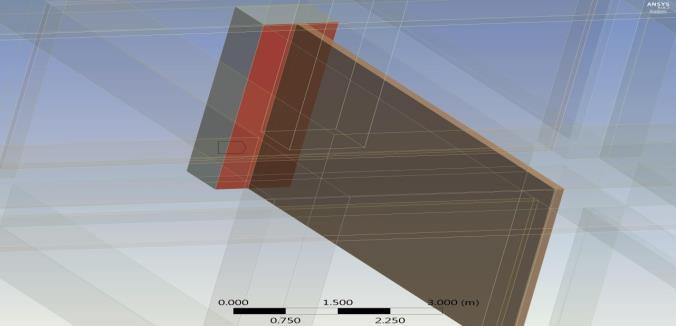
In ANSYS is used to calculate the structure’s natural frequenciesandcorrespondingmodeshapes(φ),whichare essential for determining displacement due to seismic activity. Without these modal values, the maximum displacementunderearthquakeloadingcannotbecomputed using the response spectrum method. The displacement equationisexpressedas:
Modalanalysisutilizesthemassandstiffnessmatricesofthe structuretodetermineitsnaturalperiodsofvibration.These natural periods are critical in earthquake engineering because resonance can occur if a structure’s natural frequency matches the predominant frequency of an earthquake,potentiallyleadingtoseveredamage.
This type of analysis is also significant in structures like bridges,wherematchingofnaturalfrequencieswithhuman or traffic-induced excitations can cause resonance. For example,militarypersonnelareadvisedtobreakstepwhen crossingbridgestoavoidsynchronizedexcitation.
Although modern software like ANSYS automates modal analysis, simplified hand calculations are possible by idealizing a tall building as a fixed-base cantilever with lumpedmasses.
Inthisstudy,tenmodeshapeswereconsideredinANSYS, andthecorrespondingdisplacementsforeachmodewere calculatedaspartoftheseismicresponseanalysis.
Inthispartoftheanalysis,earthquake-induceddisplacement iscalculatedusingtheaccelerationresponsespectrumfrom theBhujEarthquake.TheCompleteQuadraticCombination (CQC)methodisusedtocombinemodalresponses,asthe natural frequencies of the structure are closely spaced. ANSYSoffersthreemodalcombinationmethods:SRSS,CQC, andROSE;CQC isselecteddueto itssuitability forclosely spaced modes. The computed displacements are then comparedwiththepermissiblelimitstoassessthebuilding's
International Research Journal of Engineering and Technology (IRJET) e-ISSN: 2395-0056
Volume: 12 Issue: 08 | Aug 2025 www.irjet.net p-ISSN: 2395-0072
safety. The response spectrum is applied in both the horizontal(X-direction)andvertical(Y-direction)foramore comprehensiveanalysis.
Table -1: Shear-wallorientation
Building Model ShearWallOrientation Descriptions
M-1
M-2
M-3
M-4
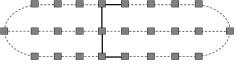
M-5
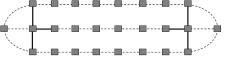
M-6
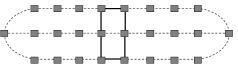
Noshear-wallused
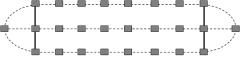
4shear-wallsused.2shear wallsplacediny-axisat2 sidesofthebuilding
4shear-wallsused.2shear wallsplacedinx-axisat2 sidesofthebuilding
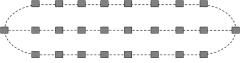
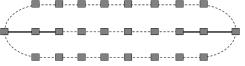
4shear-wallsused.2shearwallsplacedinthex-axis, and2shear-wallsplacedin y-axisatthecenterofthe building.
6shear-wallsused.2shear wallsplacedinthey-axis, and1shear-wallsplacedin x-axisatbothendsofthe building.
6shear-wallsused.2shearwallsplacedinthex-axis, and4shearwallsplacedin y-axisatthecenterofthe building
5.1 TEST RESULT OF STATIC ANALYSIS
Inthispart,Icalculatethedeformationofthebuildingdueto static loads. I consider dead load and live load as a static load.Thevaluesoftotaldeformationduetodeadloadand liveload(DL+LL)areinTable2
Table -2: Totaldeformation
Modelname
deformationinm.
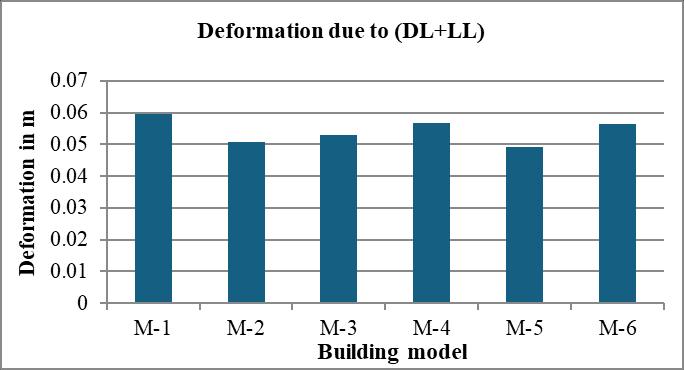
Chart -1:Staticdeformation
FromTable2andChart1,itcanbeobservedthatbuilding model “M-5”is morestable thantheother models.This is because the total deformationvalue of model “M-5” isthe lowest among the six models. Under static loading, the configurationwithtwoshearwallsplacedalongthey-axis and one shear wall at each end along the x-axis provides greater stability. In contrast, the largest deformation is observedinbuildingmodel“M-1”.
5.2 TEST RESULT OF DYNAMIC ANALYSIS
5.2.1 RS-ACCELERATION IN X DIRECTION
Tofindoutthetotaldeformationofthetallbuildingdueto earthquakeIapplied“RS-AccelerationinX-direction.
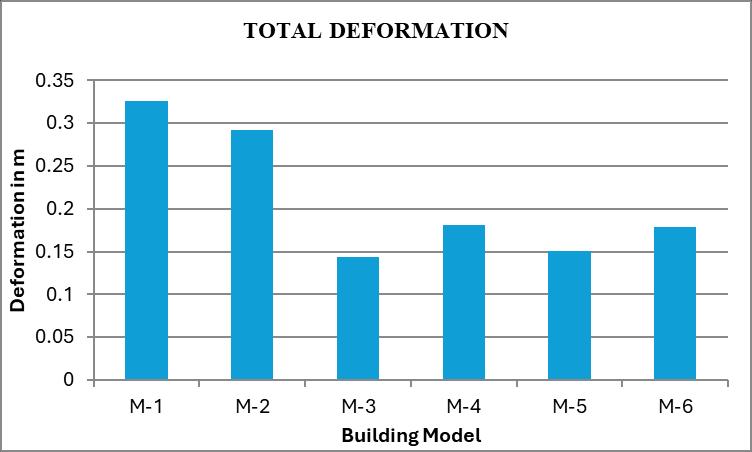
Chart -2:TotaldeformationduetoRS-acceleration
WhenRS-AccelerationisappliedintheX-direction,building model “M-3” is found to be more stable. This is because model“M-3”hastheminimumtotaldisplacementof0.14366 m.ThedeformationinboththeXandYdirectionsduetothe responsespectrumispresentedinChart-3.
M-4
International Research Journal of Engineering and Technology (IRJET) e-ISSN: 2395-0056
Volume: 12 Issue: 08 | Aug 2025 www.irjet.net p-ISSN: 2395-0072
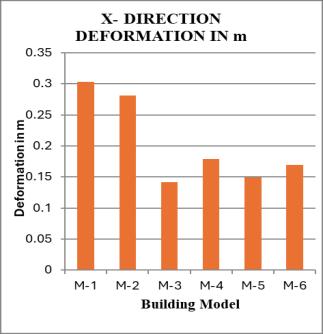
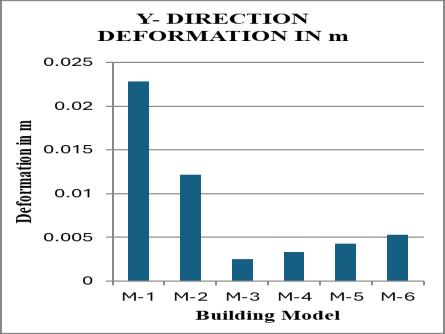
Chart -3:DeformationRS-acceleration
5.2.2 RS-ACCELERATION IN X DIRECTION
Tofindoutthetotaldeformationofthetallbuildingdueto earthquakeIapplied“RS-AccelerationinY-direction.
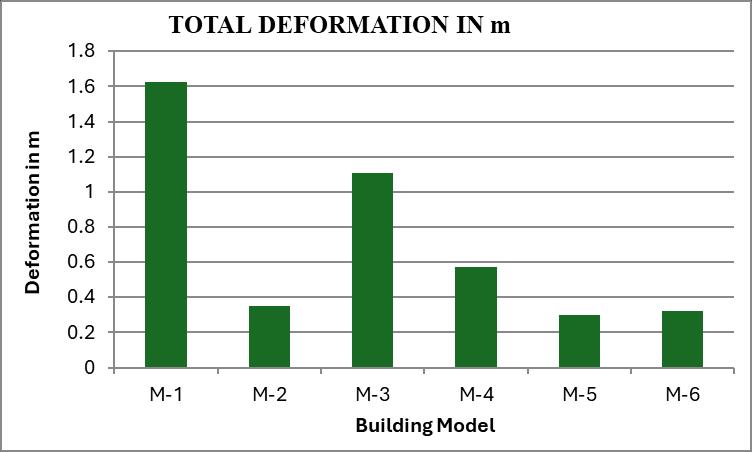
Chart -4:TotaldeformationduetoRS-acceleration
WhenRS-AccelerationisappliedintheY-direction,building model “M-5” is found to be more stable, as it has the minimumtotaldisplacementof0.2988m.Thedeformation intheXandYdirectionsduetothisresponsespectrum is presentedinTable3andTable4respectively.
Table -3: Deformationinx-direction
Table -4: Deformationiny-direction BUILDING
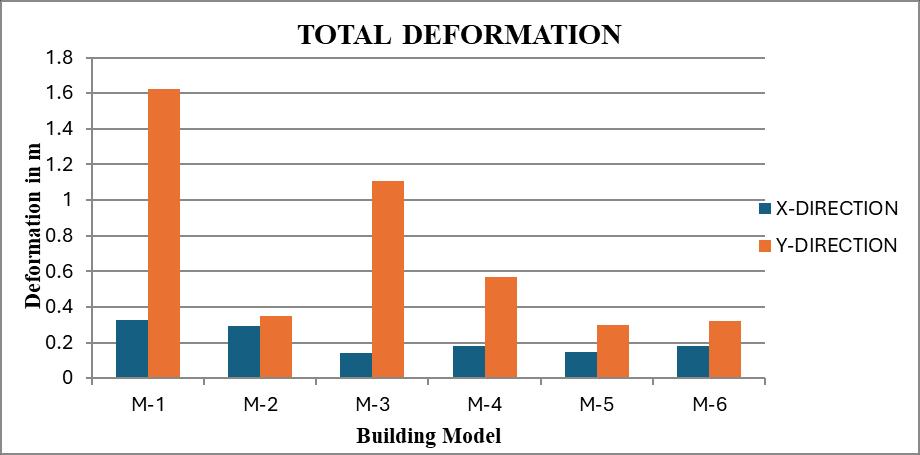
Chart -5:TotalDeformation
Chart 5 provides a graphical representation of the total deformation of each building model due to earthquake loading. The “Blue” bars indicate the total deformation resulting from RS-Acceleration applied in the X-direction, while the “Orange” bars represent deformation from RSAccelerationappliedintheY-direction.Buildingmodel“M-3” shows the minimum total displacement when RSAccelerationisappliedintheX-direction.However,whenthe RS-AccelerationisappliedintheY-direction,itsdeformation is significantly higher and exceeds the story drift limit specifiedinIS1893.Therefore,buildingmodel“M-3”isnot considered a stable structure. In contrast, building model “M-5” remains stable under RS-Acceleration in both directions.
Drift is defined as the lateral displacement of a structure. Storydriftreferstothedisplacementofonelevelofamultistorybuildingrelativetothelevelbelow.Interstorydriftis thedifferenceinlateraldisplacementbetweentheroofand floor of a given story as the building sways during an earthquake, normalized by the story height. In Table 05, I present the displacement at each floor and the correspondinginterstorydrift.
Volume: 12 Issue: 08 | Aug 2025 www.irjet.net
Table -5: Interstorydrift
Initially,IanalyzedaG+20buildingmodelwithoutanyshear wall. The total displacement was found to be 0.0596 m, whichfallswithinthepermissiblelimitasperIS:1893(Part 1).However,whengroundexcitationwasapplied,thetotal displacementincreasedsignificantlyto1.6248m,exceeding theallowablelimit.
To improve the structural performance, shear walls were introduced,andfivemodifiedmodelswerecreated:M-2,M3, M-4, M-5, and M-6 (refer to Table 5). After conducting simulationsonallmodels,itwasconcludedthatModelM-5 is the most stable under response spectrum (RS) accelerationappliedinboththeXandYdirections.
Forinstance,inModelM-3,thetotaldisplacementunderRSacceleration in the X-direction was 0.14366 m, which is withinlimits.However,intheY-direction,thedisplacement increasedto1.1084m,exceedingtheacceptablerange(refer toTables7and10).
Incontrast,ModelM-5showeddisplacementsof0.15043m (X-direction)and0.2988m(Y-direction),bothofwhichare withinthepermissiblelimits.
Therefore,itisconcludedthattheM-5modelprovidesbetter stabilityandsafetyunderseismicloadingconditions.
[1] Samir Ku. Singh "Tall-Building Structure Shape Optimization using Computational Fluid Dynamic (CFD), in press.
[2] FiniteElementAnalysisbyS.SBhavikatti.

IamEr.SamirKumarSingh,currently working as Assistant Manager –DesignatUMSLLimited.Withover8 years + of experience in structural engineering,Ispecializeinthedesign and analysis of water retaining structures and high-rise buildings. I haveastrongcommandovermodern design software and a deep understanding of construction practicesandstandards.Mygoalisto deliver safe, sustainable, and costeffectivestructuralsolutionsthatmeet bothclientexpectationsandindustry benchmarks.