
International Research Journal of Engineering and Technology (IRJET) e-ISSN:2395-0056
Volume: 13 Issue: 05 | May 2026 www.irjet.net p-ISSN:2395-0072

International Research Journal of Engineering and Technology (IRJET) e-ISSN:2395-0056
Volume: 13 Issue: 05 | May 2026 www.irjet.net p-ISSN:2395-0072
Dr
Sandhya Kulkarni1 , Sanket Dange2 , Pratik Chatur3 , Suchit Harinkhede4 , Ankush khaire5
Ujjwal Patil
6
1Professor, 23456UG Student Department of Electrical Engineering, Government College of Engineering Aurangabad, Chhatrapati Sambhajinagar, Maharashtra, India.
Abstract-This paper presents a comprehensive performance analysis of an 11kV agricultural distribution feeder, namely the Sawangi feeder, supplied from a 33/11 kV substation. Agricultural feeders are characterized by highly variable and seasonal loads, primarily consisting of induction motor-driven irrigation pumps, which significantly affect voltage regulation, power factor, and system losses. In this study, a detailed feeder model comprising 46 nodes and 31 distribution transformers is developed using MATPOWER in the MATLAB environment basedonreal field data and satellite mapping. The analysis is carried out under different seasonal conditions, namely monsoon(August),winter(January),andsummer(April),to evaluate the impact of load variation on feeder performance. Time-based load profile analysis is performed over a 24-hour period to examine variations in voltage, current,activepower,andpowerfactor.Theresultsindicate that the feeder experiences significant voltage drop, increasedlosses,andreducedpowerfactorduringpeakload conditions,particularlyinthewinterseasonduetointensive irrigation demand. Based on the analysis, several improvement techniques such as reactive power compensation using capacitor banks, proper conductor selection, and load balancing are proposed to enhance feeder performance. The study provides valuable insights into the operational behavior of agricultural feeders and suggests practical measures for improving power quality andsystemefficiency.
Key Words: 11kV Agricultural Feeder, Load Flow Analysis, MATPOWER, Voltage Profile, Power Factor, Distribution System, Power Losses, Seasonal Load Variation.
Electric power distribution systems play a vital role in deliveringelectrical energy toendusers,withagricultural feeders being particularly important for irrigation and rural development. These feedersprimarilysupply power to induction motor-driven pump sets, which are inherentlyinductiveinnatureandoperatewithlowpower factor and high starting current. As a result, agricultural feeders often face challenges such as voltage drop,
increased line losses, and reduced system efficiency [2],[4]
A key characteristic of agricultural feeders is their seasonal and time-varying load behaviour. During peak irrigation seasons such as winter (Rabi) and summer (Zaid), a large number of pumps operate simultaneously, leadingtoheavyloadingconditions.
In contrast, during the monsoon season (Kharif), the load isrelativelylowerduetoreducedirrigationrequirements. Additionally, peak demand typically occurs during daytime hours, causing further stress on the feeder and resulting in poor voltage regulation, especially at the tailendnodesoflongradialfeeders.
To effectively analyse and address these issues, it is essential to perform a detailed performance evaluation using reliable simulation tools. MATLAB-based MATPOWER is widely used for load flow analysis of distribution systems, enabling accurate assessment of voltage profile, power flow, and system losses under varyingloadconditions[1],[3]
In this study, the 11 kV Sawangi agricultural feeder, supplied from a 33/11 kV substation, is modelled and analysed using MATPOWER based on real field data. The analysis is carried out for different seasonal conditions to evaluate key performance parameters such as voltage variation,currentprofile,powerfactor,andsystemlosses. Based on the findings, suitable improvement techniques are proposed to enhance feeder performance and power quality[6]
The 11 kV Sawangi agricultural feeder, supplied from the 33/11 kV Chauka substation, exhibits several operational challenges due to its long radial structure and the nature of connected agricultural loads. The feeder primarily supplies induction motor-driven pump sets, which are highly inductive and operate with low power factor, leadingtoincreasedreactivepowerdemand.
Field observations and data analysis indicate that the feeder experiences significant voltage drop during peak
International Research Journal of Engineering and Technology (IRJET) e-ISSN:2395-0056
Volume: 13 Issue: 05 | May 2026 www.irjet.net
load hours, particularly between 10:00 AM and 4:00 PM, when a large number of irrigation pumps operate simultaneously. This issue is more severe at the tail-end nodesofthefeederduetoitsextendedlengthof15.06km. [2]
In addition, the feeder shows seasonal variations in loadingconditions,where:
During monsoon (August) - feeder is lightly loadedwithrelativelystablevoltage
Duringwinter(January)-feederisheavilyloaded, resultinginmajorvoltagedropandhigherlosses
Duringsummer(April)-moderatetohighloading withnoticeableperformancedegradation
Theseconditionsleadto:
Poorvoltageregulation
Lowpowerfactor
Increasedlinelosses
Reducedoverallsystemefficiency
Therefore, a detailed performance analysis of the feeder undervaryingseasonalandloadingconditionsisrequired to identify critical issues and suggest suitable improvementmeasures [7]
1.2
The primary objective of this research is to perform a detailed performance analysis of the 11 kV Sawangi agricultural feeder using MATPOWER in the MATLAB environment. The study aims to develop an accurate simulation model of the feeder based on real field data, includingits network configuration,loaddistribution,and transformerdetails. Furthermore,theresearchfocuseson analysing feeder performance under different seasonal conditions, namely August, January, and April, to capture theimpactofvaryingloaddemandonsystembehaviour.
The work also aims to evaluate key performance parameters such as voltage profile, current variation, active power demand, power factor, and system losses under different loading scenarios. In addition, a timebasedloadprofileanalysisiscarriedouttounderstandthe variationinfeederperformanceovera24-hourperiod.
Based on the analysis, the study seeks to identify critical operational issues such as voltage drop, increased losses, and poor power factor, and to propose suitable improvement techniques for enhancing overall feeder efficiencyandpowerquality
The present study focuses on the performance analysis of the 11 kV Sawangi agricultural feeder, which is supplied fromthe33/11kVChaukasubstation.Thisfeederservesa rural agricultural area and primarily supplies power to
p-ISSN:2395-0072
irrigation pump loads, making it highly dependent on seasonalandtime-basedvariations.
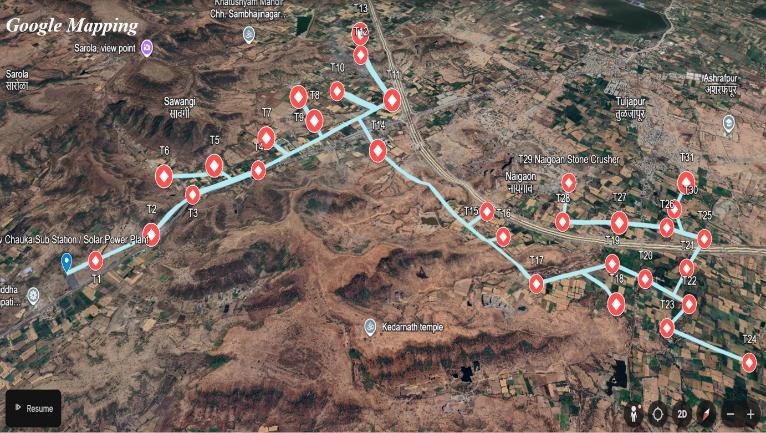
The feeder operates at a nominal voltage level of 11 kV and has a total length of approximately 15.06 km. Due to its long radial configuration and dispersed load distribution,thefeederispronetovoltagedropandpower qualityissues,particularlyatthetail-endnodes.
For accurate analysis, a detailed network model of the feederhasbeendeveloped basedonactual fielddata.The feeder consists of 46 nodes, representing various load points and junctions along the network. These nodes are interconnectedthroughdistributionlinescharacterizedby their respective electrical parameters such as resistance andreactance[2]
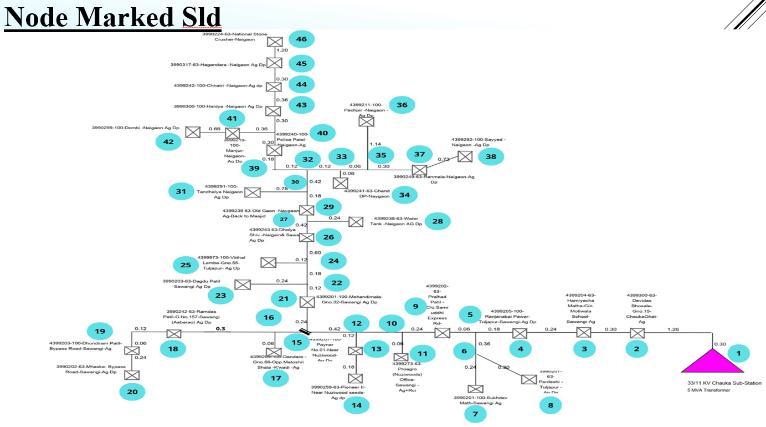
The system includes a total of 31 distribution transformers, which step down the voltage to supply agriculturalconsumers.Amongthese,16transformers are rated at 63 kVA, while the remaining 15 transformers are rated at 100 kVA, reflecting the variation in load demand acrossdifferentlocationsonthefeeder.
The feeder is modelled as a radial distribution system, which is typical for agricultural networks. The substation is considered as the slack bus, maintaining a constant voltage reference, while the remaining nodes are treated asloadbuses.
International Research Journal of Engineering and Technology (IRJET) e-ISSN:2395-0056
Volume: 13 Issue: 05 | May 2026 www.irjet.net
The connected load mainly consists of induction motorbasedagriculturalpumpsetsofratingssuchas3HP,5HP, and 7 HP, which are aggregated to represent the total feederload.Theoverallloadonthefeederisconsideredto beintherangeof1.6MWto2MW,dependingonseasonal andoperationalconditions.
Due to the nature of these loads and the feeder configuration, the system exhibits significant variation in performance parameters such as voltage, current, power factor, and losses. Hence, a detailed simulation-based analysis is essential to evaluate feeder behaviour under differentloadingscenarios[8]
The performance analysis of the 11 kV Sawangi Agricultural Feeder is carried out using MATPOWER Version 8.1 in the MATLAB environment. MATPOWER is an open-source MATLAB-based power system simulation package widely used for steady-state power flow and distribution system analysis . In the present work, AC power flow analysis based on the Newton–Raphson method is adopted to evaluate feeder performance under varyingseasonalloadingconditions.
The feeder originates from the 33/11 kV Chauka Substation and is modelled as a radial distribution network consisting of 46 nodes and 31 distribution transformers. The complete feeder configuration is developed using actual field data, satellite mapping, and single-linediagramrepresentation.Thefeederoperatesat anominalvoltagelevelof11kVwithatotalfeederlength ofapproximately15.06km[1]
The MATPOWER case structure (mpc) is created programmatically using MATLAB scripts. The simulation modelincludes:
mpc.bus→busandloaddata
mpc.branch→feedersectionimpedancedata
mpc.gen→slackbusandsourcedata
The feeder parameters are extracted from Excel-based datasets and automatically converted into MATPOWERcompatiblematrices.Theelectricalparametersconsidered for simulation include conductor resistance, reactance, diversityfactor,powerfactor,andnominalvoltage.
Theparametervariationanalysisindicatesthatthefeeder uses ACSR DOG-100 sq.mm conductors with resistance and reactance values of approximately 0.3 Ω/km and 0.4 Ω/km,respectively.
The system is modelled with a diversity factor of 1.3 and an operating power factor close to 0.98 lagging, representingpracticalagriculturalloadingconditions.
p-ISSN:2395-0072
The loads connected to the feeder mainly consist of agriculturalpumpsetsofratingssuchas3HP,5HP,and7 HP. These loads are aggregated at different buses and modelled as constant PQ loads. The total feeder loading variesbetween1.6MWand 2MWdependingonseasonal irrigationdemand[3].
Load flow analysis is carried out on the developed feeder model using MATPOWER to assess the steady-state performance of the system under varying operating conditions. This analysis enables evaluation of key electrical parameters such as bus voltage magnitude, line current,activeandreactivepowerflow,powerfactor,and systemlosses.
The study is performed under different seasonal loading conditions to capture the variation in feeder behaviour. Threerepresentativescenariosareconsidered:
August(MonsoonSeason)–Lightloadcondition
January(WinterSeason)–Heavyloadcondition
April(SummerSeason)–Moderateloadcondition
In addition to seasonal analysis, a time-based load profile study is conducted over a 24-hour period to examine the variation of system parameters with time. This is particularly useful for identifying peak load conditions, which typically occur during daytime hourswhenagriculturalpumpusageishighest[1]
Theloadflowresultsprovidedetailedinsightsinto:
Voltageprofileacrossallnodes
Currentdistributionalongthefeeder
Activepowerdemandvariation
Power factor behaviour under different loading conditions
Totalsystemlosses
These observations help in identifying critical operating conditions such as significant voltage drop at tail-end nodes, increased current flow during peak hours, and reduction in power factor due to inductive loads. The analysisformsthebasisforproposingsuitabletechniques toimprovefeederperformance[9]
Based on the performance analysis of the 11 kV Sawangi agriculturalfeeder,issuessuchasvoltagedrop,lowpower factor, and increased losses are observed during peak loading conditions. These problems are mainly due to the inductive nature of agricultural loads and the long feeder length. Since this study is based on simulation and analysis, the following improvement techniques are proposedtoenhancefeederperformance.
International Research Journal of Engineering and Technology (IRJET) e-ISSN:2395-0056
Volume: 13 Issue: 05 | May 2026 www.irjet.net p-ISSN:2395-0072
Theinductivenatureofagricultural pumploadsresultsin highreactivepowerdemand,leadingtopoorpowerfactor and voltage drop. To mitigate these issues, installation of shunt capacitor banks at suitable locations is recommended.
Capacitor banks provide local reactive power support, thereby reducing reactive current flow in the feeder. This results in improved voltage profile, enhanced power factor, and reduced line losses. The required reactive powercompensationcanbeestimatedus, Qc=P(tanϕ1-tanϕ2)
3.2 Proper Conductor
Thelongfeederlengthcontributessignificantlytovoltage drop and power losses due to conductor resistance. Therefore,theuseofconductorswithlowerresistanceand higher current-carrying capacity is recommended. This improvement can reduce I²R losses, enhance voltage regulation, and improve overall system efficiency, especiallyunderheavyloadingconditions.
3.2.1 Voltage Magnitude Analysis
The voltage profile from Bus 1 (source) to Bus 46 (tail end) was obtained for all three simulation cases. The minimumpermissiblevoltageonan11kVfeederis10.34 kV (- 6%) and the maximum is 11.66 kV (+6%) as per IndianElectricityGridCode.
Table 3.2.1 –VoltageSummary:KeyNodes(Actual Values)
Note: PF – PowerFactor, DF –DiversityFactor.
Thetail-endvoltageatBus46remainsabovethestatutory minimum of 10.34 kV in all three cases, confirming that the feeder operates within permissible limits under the simulatedloadingconditions.
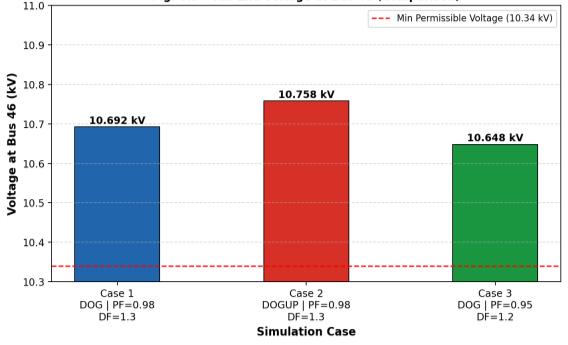
Fig. 3.2.1 –Tail-EndVoltageatBus46:ComparisonAcross AllCases
TheDOGUPconductorimprovesthetail-endvoltageby66 V (0.006 pu) over the existing DOG conductor under identicalPFandDFconditions
3.2.2 Power Flow Analysis
Branch power losses (I²R active losses and I²X reactive losses) were computed by MATPOWER for each simulation case. Table 6.3 presents the total feeder losses convertedtoactualvalues,andFigure6.2providesasideby-sidebarchartcomparison
Table 3.2.2 –TotalFeederPowerLossSummary
Case1: DOG
Parameter
PF=0.98, DF=1.3
Case2: DOGUP
PF=0.98, DF=1.3
Case3: DOG
PF=0.95, DF=1.2
Bus #
Total Load P Served 1.89MW 1.89MW 1.99MW Loss as % of Generation 1.87% 1.46% 2.07%
Max Branch Loss(Br1-2) 17kW 13kW 20kW
International Research Journal of Engineering and Technology (IRJET) e-ISSN:2395-0056
Volume: 13 Issue: 05 | May 2026 www.irjet.net p-ISSN:2395-0072
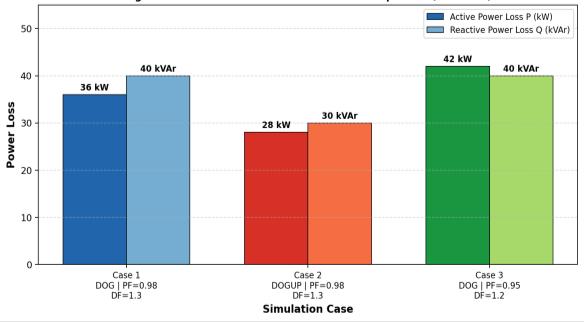
Fig. 3.2.2 –ActiveandReactivePowerLossComparison: AllThreeCases
Replacing the existing ACSR DOG conductor with AAAC DOGUP reduces active power loss by 8 kW (22.2%) and reactive power loss by 10 kVAr (25.0%) under the same loading conditions. Branch 1–2, which carries the entire feeder current, accounts for the highest individual branch loss in all cases and benefits most from conductor upgradation[4],[9].
4. RESULTS AND DISCUSSION
Theperformanceofthe11kVSawangiagriculturalfeeder isevaluatedusingloadflowanalysisinMATPOWERunder different seasonal and time-based loading conditions. The results are analyzed in terms of voltage profile, current variation, active power demand, and power factor behavior.
4.1 Voltage Profile Analysis
The variation of voltage with respect to time for different seasonsisshowninFig.3
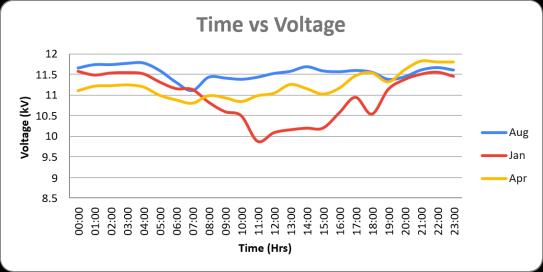
Fig. 3:VoltageProfileunderDifferentSeasonalConditions
The results indicate that the voltage remains relatively stableduringthe monsoon season(August) due to lighter loading conditions. However, during the winter season (January),asignificantvoltagedropisobserved,especially duringpeakhoursbetween10:00AMand4:00PM.Thisis attributed to the simultaneous operation of multiple irrigationpumpsets.
In the summer season (April), a moderate voltage drop is observed, reflecting intermediate loading conditions. The
voltage drop is more pronounced at the tail-end nodes of thefeederduetoitsradialstructureandlonglength.
The variation of feeder current with time is illustrated in Fig.4.
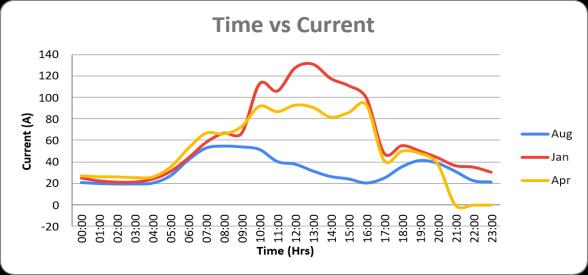
Fig. 4:CurrentVariationforDifferentSeasonal Conditions
It is observed that the current is lowest during the monsoonseasonduetoreducedloaddemand.Incontrast, the current reaches its maximum value during the winter season,particularlyduringpeakirrigationhours.
This increase in current leads to higher losses and increasedstressonthefeeder. Thesummerseasonshows moderate current levels, corresponding to medium load demand.
TheactivepowerdemandvariationispresentedinFig.5.
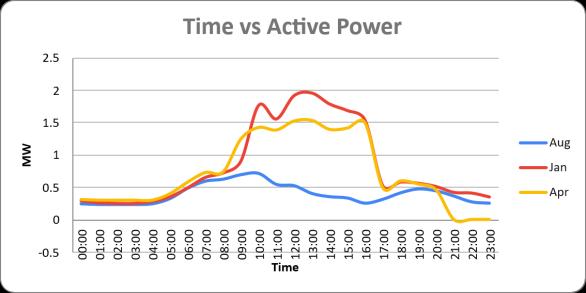
Fig. 5:ActivePowerVariationforDifferentSeasons
Theresultsshowthatthemaximumpowerdemandoccurs during the winter season, reaching values close to 2 MW, indicatingheavyloadingconditions.
During the monsoon season, the power demand is significantlylowerduetoreducedirrigationrequirements. The summer season exhibits moderate power demand, reflectingpartialagriculturalactivity.
International Research Journal of Engineering and Technology (IRJET) e-ISSN:2395-0056
Volume: 13 Issue: 05 | May 2026 www.irjet.net p-ISSN:2395-0072
ThevariationofpowerfactorwithtimeisshowninFig.6
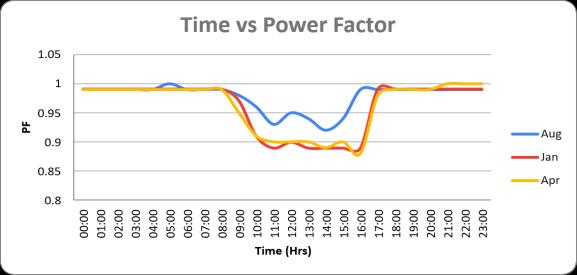
Fig. 6:PowerFactorVariationunderDifferentLoad Conditions
Itisobservedthatthepowerfactordecreasesduringpeak loadconditionsduetotheinductivenatureofpumploads. The lowest power factor is observed during the winter season, while relatively better values are seen during the monsoonseason.
The reduced power factor contributes to increased reactive power demand, higher current flow, and additionalsystemlosses.
Fromtheaboveanalysis,itisevidentthattheperformance of the feeder is significantly influenced by seasonal and time-basedloadvariations.Thefeederexperiences:
Significant voltage drops during peak loading conditions
Increasedcurrentflowandsystemlosses
Reductioninpowerfactorduetoinductiveloads Among the three scenarios, the winter season represents the worst-case condition, while the monsoon season represents the best-case scenario in terms of feeder performance.
These results clearly highlight the need for appropriate improvement techniques to enhance voltage regulation, reduce losses, and improve overall system efficiency.[3],[4]
This paper presented a detailed performance analysis of the 11 kV Sawangi agricultural feeder supplied from the 33/11 kV Chauka substation using MATPOWER in the MATLAB environment. A realistic feeder model was developedbasedonactualfielddata,andtheanalysiswas carried out under different seasonal conditions monsoon, winter, and summer to evaluate the impact of load variation.Theresultsrevealedthatthefeederexperiences significant voltage drop, increased current flow, higher system losses, and reduced power factor during peak
loading conditions, particularly in the winter season due tointensiveirrigationdemand.
The time-based load profile analysis further highlighted that maximum stress occurs during daytime hours, affecting overall feeder performance. Based on these observations, improvement techniques such as reactive power compensation using capacitor banks and proper conductor selection were proposed to enhance voltage regulation, improve power factor, and reduce losses. Although these methods were not implemented practically, the study provides valuable insights into feeder behaviour and offers effective recommendations for improving the efficiency and reliability of agricultural distributionsystems.
[1] R. D. Zimmerman, C. E. Murillo-Sánchez, and R. J. Thomas, “MATPOWER: Steady-State Operations, Planning, and Analysis Tools for Power Systems Research and Education,” IEEE Transactions on Power Systems, vol. 26, no. 1, pp. 12–19, Feb. 2011.
[2] T.Gönen,ElectricPowerDistributionEngineering, 3rded.BocaRaton,FL,USA:CRCPress,2014.
[3] H. Saadat, Power System Analysis. New York, NY, USA:McGraw-Hill,1999.
[4] R.C.Dugan,M.F.McGranaghan,S.Santoso,andH. W. Beaty, Electrical Power Systems Quality, 3rd ed.NewYork,NY,USA:McGraw-Hill,2012.
[5] IEEE Standard 1036-2010, IEEE Guide for Application of Shunt Power Capacitors, IEEE StandardsAssociation,2010.
[6] A. Augugliaro, L. Dusonchet, S. Favuzza, and E. R. Sanseverino, “Optimal Capacitor Placement in Distribution Systems for Loss Reduction and Voltage Improvement,” IEEE Transactions on PowerDelivery,vol.23,no. 3,pp.1530–1537,Jul. 2008.
[7] D. P. Kothari and I. J. Nagrath, Modern Power System Analysis, 4th ed. New Delhi, India: Tata McGraw-Hill,2011.
[8] S. Sivanagaraju and S. Satyanarayana, Electric Power Transmission and Distribution. New Delhi, India:PearsonEducation,2008.
[9] H. Ali, S. Ullah, I. Sami, N. Ahmad and F. Khan, "Economic Loss Minimization of a Distribution Feeder and Selection of Optimum Conductor for Voltage Profile Improvement,"2018 International Conference on Power Generation Systems and Renewable Energy Technologies (PGSRET), Islamabad,Pakistan,2018,pp.1-6.
International Research Journal of Engineering and Technology (IRJET) e-ISSN:2395-0056
Volume: 13 Issue: 05 | May 2026 www.irjet.net p-ISSN:2395-0072






Dr Sandhya S. Kulkarni, Professor, DepartmentofElectricalEngineering, Government College of Engineering Aurangabad, Chhatrapati Sambhajinagar,Maharashtra,India.
Sanket D. Dange, UG Student, DepartmentofElectricalEngineering, Government College of Engineering Aurangabad, Chhatrapati Sambhajinagar,Maharashtra,India.
Pratik M. Chatur, UG Student, DepartmentofElectricalEngineering, Government College of Engineering Aurangabad, Chhatrapati Sambhajinagar,Maharashtra,India.
Suchit J. Harinkhede, UG Student, DepartmentofElectricalEngineering, Government College of Engineering Aurangabad, Chhatrapati Sambhajinagar,Maharashtra,India.
Ankush S. Khaire, UG Student, DepartmentofElectricalEngineering, Government College of Engineering Aurangabad, Chhatrapati Sambhajinagar,Maharashtra,India.
Ujjwal A. Patil, UG Student, DepartmentofElectricalEngineering, Government College of Engineering Aurangabad, Chhatrapati Sambhajinagar,Maharashtra,India