
International Research Journal of Engineering and Technology (IRJET) e-ISSN: 2395-0056
Volume: 13 Issue: 04 | Apr 2026 www.irjet.net p-ISSN: 2395-0072
International Research Journal of Engineering and Technology (IRJET) e-ISSN: 2395-0056
Volume: 13 Issue: 04 | Apr 2026 www.irjet.net p-ISSN: 2395-0072
Pratik Potdukhe1, Praful Tadse2
1 M.Tech Scholar, Dept. of Electrical Engineering, BIT Ballarpur Institute of Technology, Maharashtra, India ² Professor, Dept. of Electrical Engineering, BIT Ballarpur Institute of Technology, Maharashtra, India
Abstract -The rapid proliferation of electric vehicle (EV) charging infrastructure has introduced significant power quality challenges in distribution systems duetothenonlinear nature of EV chargers. These chargers, typically implemented using three-phase diode bridge rectifiers,drawnon-sinusoidal currents from the grid, resulting in high Total Harmonic Distortion (THD), reduced power factor, and increasedsystem losses.
This paper presents the design and simulation of a photovoltaic (PV)-integratedShuntActivePowerFilter(SAPF) for harmonic mitigation in grid-connected EV charging stations. The system models three EV charging units, where two operate under steady-state conditions and onerepresents a dynamic load with time-varying connection to emulaterealworld charging behavior. A 4 kW PV array is integrated with the SAPF DC link through a boost converter controlled using a Perturb and Observe (P&O) Maximum Power Point Tracking (MPPT) algorithm.
The Synchronous Reference Frame (SRF) control strategy is employed for accurate harmonic extraction and reference current generation. The proposed system is implemented in MATLAB/Simulink. Simulation results demonstrate that the source current THD is reduced from 29.53% to approximately 5%, achieving near compliance with IEEE-519 standards. Additionally, thepowerfactor improvesfrom0.9926to0.9978. The integration of PV enhances system efficiency by supporting the DC link and reducing grid power demand. The proposed system demonstrates stable performance under dynamic EV load conditions, validating its applicability for real-world charging infrastructure.
Key Words: Shunt Active Power Filter (SAPF), EV Charging Station, Synchronous Reference Frame (SRF), Photovoltaic System, MPPT, Harmonics, THD, Power Quality.
The global shift towards sustainable transportation has acceleratedElectricVehicle(EV)deployment,drivingrapid expansionofEVcharginginfrastructure.EVchargersemploy nonlinear power electronic converters primarily diode bridge rectifiers and AC-DC converters that draw nonsinusoidal currents from the utility grid, introducing significantharmonicdistortions.
Harmonicscauseincreasedlosses,equipmentoverheating, malfunction of sensitive devices, and interference with communication systems. IEEE 519-2014 limits supply currentTHDtoacceptablelevels.InEV-denseenvironments suchasparkinglotsandhighwaycharginghubs,cumulative harmonic injection from multiple chargers can severely stress the grid. The proposed system models three EV stations where EV Station 1 and Station 3 are identical constantloads(t=0sonward,~500VDCoutput),whileEV Station2representsadynamicloadconnectingatt=0.1s and disconnecting at t = 0.65 s, testing SAPF performance undertransientconditions.
Passive filters have traditionally mitigated harmonics but suffer from fixed compensation, resonance issues, and parameter sensitivity. Shunt Active Power Filters (SAPF) offer flexible, dynamically controlled compensation. Integrating PV systems with SAPF provides dual benefit: harmoniccompensationandcleanenergyinjectionintothe gridDCbus.
TheSynchronousReferenceFrame(SRF)algorithm,based on Park's d-q transformation, provides efficient real-time harmonic extraction. This paper designs, models, and validates a PV-integrated SAPF for a three-EV-station charging system in MATLAB/Simulink, demonstrating significantpowerqualityimprovement.
Fig. 1 shows the complete MATLAB/Simulink model. The systemcomprises:
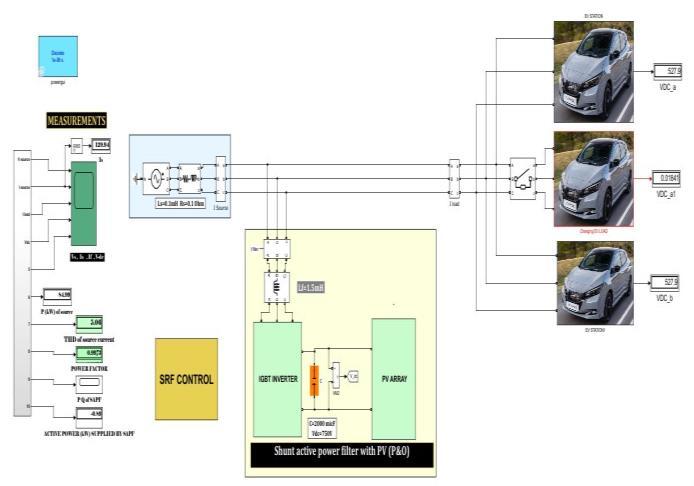
Fig. 1: Complete MATLAB/Simulink Model of PV-SAPF for EV Charging Station
International Research Journal of Engineering and Technology (IRJET) e-ISSN: 2395-0056
Volume: 13 Issue: 04 | Apr 2026 www.irjet.net p-ISSN: 2395-0072
(a)ACSource:Three-phase,415V(line-to-line),50Hz
(b)EVChargingStations:
•EVStation1&3:Identicalthree-phaseAC-DCconverters withPI-controlledDC-DCstage.Activefromt=0s.Output≈ 500VDC
•EVStation2(Dynamic/ChangingEVLoad):Connectsatt = 0.1 s, disconnects at t = 0.65 s. Represents step-change transientloadvariation.
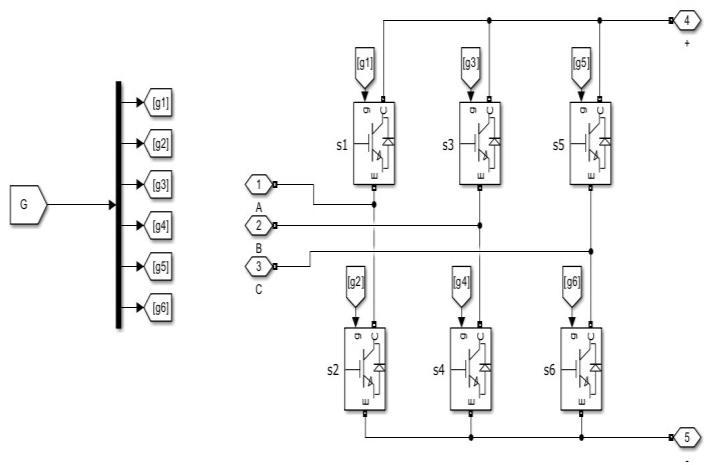
(c)SAPF:Two-levelthree-phaseIGBTVSI(S1–S6)connected inshuntatPCC.DCcapacitorVdc_ref=750V.
(d)PVArray:4kW,4strings×5modules.Permodule:Voc= 57.6 V, Isc = 4.6 A, Vmp = 47 V, Imp = 4.26 A. STC: 1000 W/m²,25°C.
(e)BoostConverter:stepsupPVvoltagetoSAPFDCbus.
(f)P&OMPPT:Stepsized=0.001,implementedasMATLAB Functionblock.
(g)SRFController:abc→dq0transform,LPF(Fo=30Hz),PI DCbusregulator(Vdc_ref=750V).
2.1.
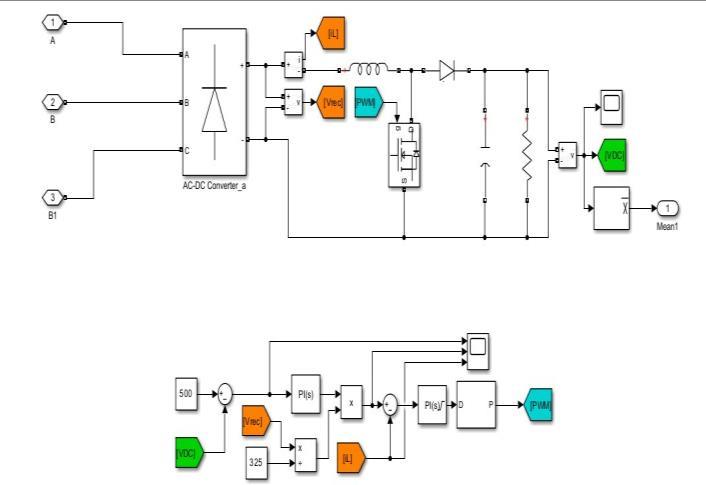
Fig. 2 shows the internal structure of the EV Station subsystem.EachEVstationcomprisesathree-phaseAC-DC converter(diodebridge)followed bya DC-DCbuck/boost converter with dual PI controllers regulating inductor current (IL) and DC bus voltage (VDC) to the reference of 500V.ThePWMblockgeneratesswitchingsignalsbasedon thePIoutput.
PIControlled DC-DC Stage)
Fig.3showstheChangingEVLoad(EVStation2)which usesasix-diodebridgerectifierwithtwoparallelR-Lload branches(R1-Ld2andR3-Ld1).Atimedswitchconnectsthe second branch at t = 0.1 s and disconnects it at t = 0.65 s, creatingastep-changeinloadcurrenttotestdynamicSAPF response.
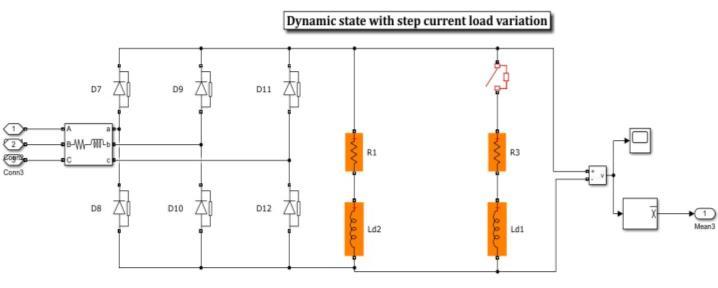
Fig. 4 shows the PV array subsystem with P&O MPPT controllerandboostconverter.The4kWPVarray(4S×5P configuration)feedsaboostconverterthatstepsupthePV voltagetotheSAPFDCbuslevel(~750V).ThePOWEROUT scopeconfirmsthearraytrackingneartheMPPof4000W under1000W/m²irradiance.
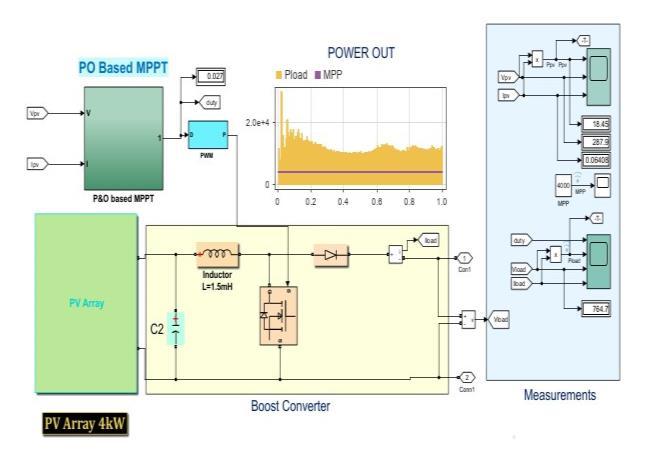
4: PV Array Subsystem with P&O MPPT and Boost Converter
Thearrayconsistsof4stringswith5series-connected modulesperstringusingauser-definedmodulewithVoc= 57.6 V, Isc = 4.6 A, Vmp = 47 V, Imp = 4.26 A. Model parameters:IL=4.6102A,I0=6.02×10⁻¹¹A,n=1.4929,Rs =0.863Ω,Rsh=390.53Ω.
Fig.5showsthetwo-levelthree-phaseIGBTinverter.Six IGBTswitches(S1–S6)arearrangedinthreephase-legs.Gate signals G1–G6, generated by the SRF hysteresis current controller; drive the switches to inject compensating currentsintothePCC.
International Research Journal of Engineering and Technology (IRJET) e-ISSN: 2395-0056
Volume: 13 Issue: 04 | Apr 2026 www.irjet.net p-ISSN: 2395-0072
3. CONTROL STRATEGY
3.1 SRF Control Block
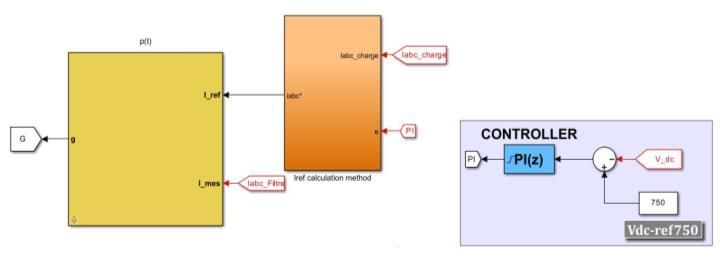
Fig.6 showstheSRFControlsubsystem.Itcomprises theIrefCalculationMethodblock,atwo-levelIGBTInverter, andaPI-basedDCbusvoltagecontroller(Vdc-ref=750V).
3.2 Iref Calculation (SRF Algorithm)
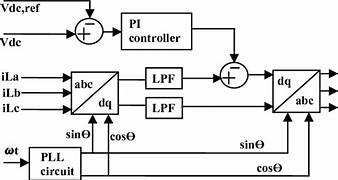
Fig. 7: SRF Control Block Diagram
Fig.6showstheIrefcalculationblock.Thethree-phase loadcurrents(Iabc_charge)aretransformedtothed-qframe using abc→dq0 transformation synchronized to supply voltage angle via PLL. Two low-pass filters (Fo = 30 Hz) extract DC (fundamental) components. The AC harmonic componentsareobtainedbysubtraction.Inversedq0→abc transformation yields reference compensation currents (iabc*).TheSRFblockdiagramisshowninFig.7
3.3 DC Bus Voltage Regulation
APIcontrollercomparesVdc(measured)withVdc_ref= 750V.Theoutputprovidestheactivepowercomponentto maintainDCbusvoltageandcompensateinverterswitching losses.Thisisaddedtothed-axisharmonicreferencebefore inversetransformation.
MeasuredPVvoltage(V)andcurrent(I)arefedintoa MATLABFunctionimplementingtheP&Oalgorithm(Fig.8). Asaturationblocklimitsdutycycle,andaZOHsamplesat theswitchingfrequencytogeneratethePWMdutycyclefor theboostconverter.
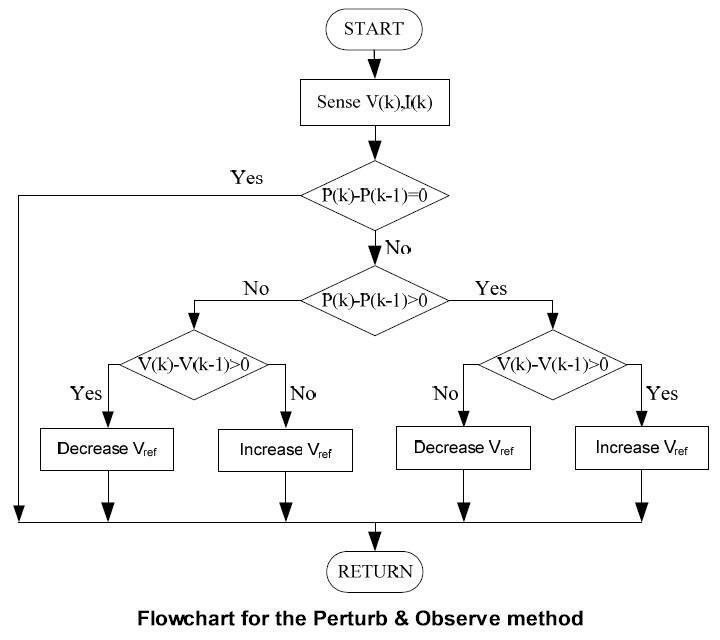
Fig. 8: Flowchart of P&O MPPT Algorithm
The MATLAB P&O function code computes power difference(dp=u·i−uo·io),voltagedifference(du=u−uo), andadjustsdutycyclebystepd=0.001basedonsignofdp anddufollowingstandardP&Ologic.
5. MATHEMATICAL ANALYSIS
5.1 PV Module Single-Diode Model
I=IL−I0·[exp((V+I·Rs)/(n·Vt))−1]−(V+I·Rs)/Rsh whereVt=kT/q=25.85mVat25°C.
International Research Journal of Engineering and Technology (IRJET) e-ISSN: 2395-0056
Volume: 13 Issue: 04 | Apr 2026 www.irjet.net p-ISSN: 2395-0072
5.2 Boost Converter Duty Cycle
Vout/Vin=1/(1−D) → D=1−Vin/Vout
WithVin≈287.9V(4strings×Vmp=4×47=188V×boost), Vout≈764.7V,D≈0.624.
5.3 Park's Transformation (SRF)
[id;iq;i0]=(2/3)·T(ωt)·[ia;ib;ic]ᵀ
AfterLPF(Fo=30Hz),DCcomponentsidDC,iqDCrepresent thefundamental.
Theharmonicreference: id_h=id−idDC,iq_h=iq−iqDC.
Inversetransformyieldsiabc*injectedbySAPF.
5.4 THD Definition
THD=(√(ΣIn²)/I1)×100% where I1 is the fundamental RMS current and In are harmonicRMScurrents.WithoutSAPF:THD=29.53%.With PV-SAPF (SRF): THD = 5.06%, which is very close to the IEEE-519 limit of 5 The slight deviation above 5% is attributedtotransientconditionsintroducedbythedynamic EVload.
Simulations were performed in MATLAB/Simulink R2024b,discretetimestep1×10⁻⁶s,simulationduration=1 s(0.2sdisplayedforwaveformclarity).
6.1 Without SAPF
Fig.9showstheWithout-SAPFmodel.EVStation1and3 provideVDC_a =VDC_b=523.6Vfromt=0.EVStation2 (ChangingEVLoad)showsVDC_a1=0.01856V(nearzeroat thissnapshot – EV2notyetfullycharged).Sourcecurrent THD=29.53%,farexceedingIEEE519-2014.PowerFactor= 0.9926.Totalsourceactivepower=89.87kW.
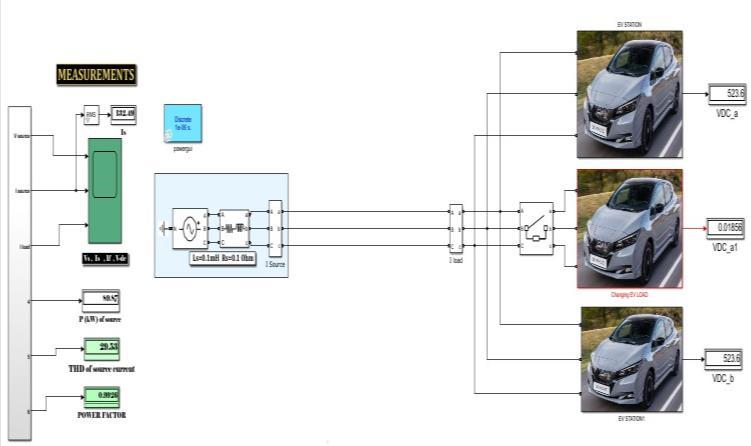
Fig. 9: Without SAPF – MATLAB/Simulink Model with Measurement Results
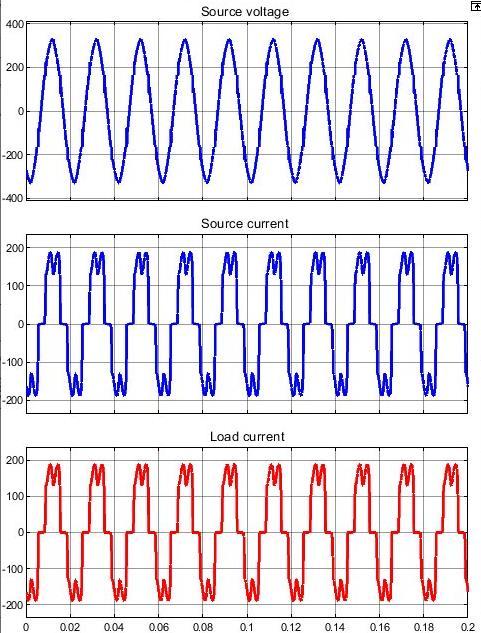
Fig.10showsscope waveformswithout SAPF.Source voltageissinusoidalbutsourcecurrentishighlydistorted (quasi-squarewave)duetodioderectifierconduction.Load currentmirrorssourcecurrentdistortion.THD=29.53%.
6.2 With PV-Integrated SAPF
Fig. 1 shows the complete SAPF system model. With SAPFactive,EVbatteryvoltagesimprovetoVDC_a=VDC_b= 527.9VforEVStations1&3.EVStation2(dynamicload) showsVDC_a1≈0.01841Vduringtransientphase.Source active power = 84.00 kW. THD reduces to 5.06%. Power Factor=0.9978.SAPFactivepower=−0.89kW(PVenergy injection).
Fig. 11 shows scope waveforms with SAPF. Source currentbecomesnearlysinusoidalafterSAPFcompensation. Filtercurrentshowshigh-frequencycompensatinginjection. DC bus voltage settles and remains stable at ~750 V with minorripplethroughoutsimulationincludingthedynamic EVStation2connect/disconnectevents.
International Research Journal of Engineering and Technology (IRJET) e-ISSN: 2395-0056
Volume: 13 Issue: 04 | Apr 2026 www.irjet.net p-ISSN: 2395-0072
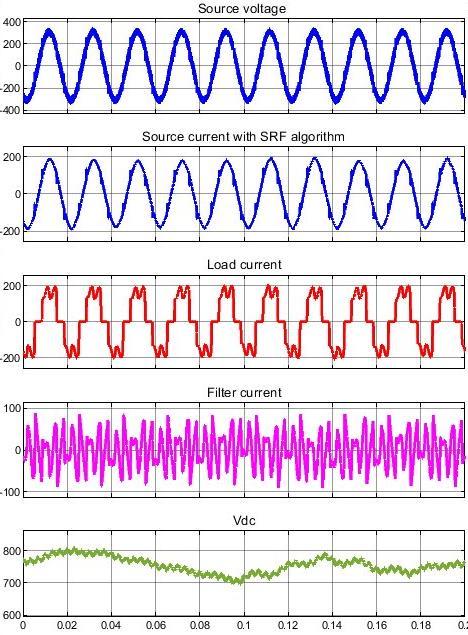
Fig. 11: With SAPF – Source Voltage, Source Current (SRF), Load Current, Filter Current, and Vdc
Table1summarizesmeasuredresultsforbothcases: Table-1: Performance Comparison – With and Without PVSAPF
5.06%,whichisveryclosetotheIEEE-519prescribedlimit of5%.
The power factor is improved from 0.9926 to 0.9978, demonstrating near-unity operation. The SRF controller providesstableanddynamiccompensationundervarying load conditions, including step changes in EV load connectionanddisconnection.
The integration of a 4 kW photovoltaic system enhances overallsystemefficiencybysupplyingrealpowertotheDC link,therebyreducinggriddependency.TheDClinkvoltage remainswellregulatedat750Vthroughouttheoperation.
TheresultsconfirmthattheproposedPV-SAPFsystemisan effectivesolutionforimprovingpowerqualityinmodernEV charginginfrastructure.Futureworkwillfocusonhardware implementationandadvancedcontrolstrategiesforfurther THDreduction.
[1] B. Singh, K. Al-Haddad, and A. Chandra, "A review of activefiltersforpowerqualityimprovement,"IEEETrans. Ind.Electron.,vol.46,no.5,pp.960–971,Oct.1999.
[2]H.Akagi,E.H.Watanabe,andM.Aredes,Instantaneous PowerTheoryandApplicationstoPowerConditioning,IEEE Press/Wiley,2007.
[3] IEEE Std 519-2014, "Recommended Practice for HarmonicControlinElectricPowerSystems,"IEEE,2014.
[4] T. Esram and P. L. Chapman, "Comparison of PV array MPPTtechniques,"IEEETrans.EnergyConvers.,vol.22,no. 2,pp.439–449,Jun.2007.
[5]S.Biriciketal.,"Protectionofsensitiveloadsusingsliding mode controlled three-phase SAPF," IET Power Electron., vol.7,no.7,pp.1742–1752,2014.
[6] A. Khaligh and S. Dusmez, "Topological analysis of conductive and inductive charging for plug-in EVs," IEEE Trans.Veh.Technol.,vol.61,no.8,pp.3475–3489,2012.
[7]B.SinghandJ.Solanki,"Comparisonofcontrolalgorithms forDSTATCOM,"IEEETrans.Ind.Electron.,vol.56,no.7,pp. 2738–2745,2009.
Keyobservations:THDreducesfrom29.53%to5.06% (83% reduction), compliant with IEEE 519-2014. Power factorimprovesfrom0.9926to0.9978.EVbatteryvoltage improvesfrom523.6Vto527.9V.PVarrayinjects~4kW into the SAPF DC bus, reducing grid burden. The SRF controllerrespondsstablytothestep-changeEVStation2 loadeventsatt=0.1sandt=0.65s.
A photovoltaic-integrated Shunt Active Power Filter (PVSAPF)basedonSynchronousReferenceFrame(SRF)control hasbeensuccessfullydesignedandsimulatedforamulti-EV charging station. The system effectively reduces source current Total Harmonic Distortion (THD) from 29.53% to
[8]L.Hassaineetal.,"Overviewofpowerinvertertopologies forgrid-connectedPV,"Renew.Sustain.EnergyRev.,vol.30, pp.796–807,2014.
[9]J.M.Guerreroetal.,"Advancedcontrolarchitecturesfor intelligentmicrogrids PartII,"IEEETrans.Ind.Electron., vol.60,no.4,pp.1263–1270,2013.
[10]S.Kouroetal.,"Grid-connectedPVsystems:Overviewof emerging converter technology," IEEE Ind. Electron. Mag., vol.9,no.1,pp.47–61,2015.
[11] C. Subramani et al., "Simulation of PWM-based shunt activefilterforharmonicmitigation,"Int.J.Comput.Appl., vol.10,no.8,2010.
[12] M. Karimi-Ghartemani and M. R. Iravani, "Nonlinear adaptive filter for signal analysis in power systems," IEEE Trans.PowerDel.,vol.17,no.2,pp.617–622,2002.