
International Research Journal of Engineering and Technology (IRJET) e-ISSN: 2395-0056
Volume: 13 Issue: 05 | May 2026 www.irjet.net p-ISSN: 2395-0072
International Research Journal of Engineering and Technology (IRJET) e-ISSN: 2395-0056
Volume: 13 Issue: 05 | May 2026 www.irjet.net p-ISSN: 2395-0072
Venkatesh Daggupati
Department of Electrical and Computer Engineering Texas Tech University
Abstract— The rising use of renewable energy and nonlinear loads makes it difficult for modern smart grids to deal with power quality disturbances such as voltage sags, swells, harmonics, transients, interruptions, and flickers. Proper and automatic classification of PQDs plays a big part in keeping the grid running smoothly and responding to power failures. Here, Deep Learning is used with the STFT andCNNstorecognizePQDsintheIEEE9-bussystem.Itwas simulated with electrical faults in place and the voltage data wasturnedintospectrogramsbyusingSTFTtoanalyzetimefrequency features. After that, the CNN model was trained using the spectrograms for automated identification of PQD variants. It is shown by the simulation results that the method gives excellent scores for accuracy, precision, and recall in situations where there is noise. Classification with the CNN accomplished better results than ELM and other standard classifiers. Monitoring data in real-time is possible because the framework is fast and handles problems efficiently.Theresearchshowstheadvantagesofusing STFT and CNNs to detect different types of power quality disturbancesandpointstothedevelopmentofadvancedPQD classificationtoolsthatcanbeusedintoday’spowersystems.
Index Terms: Power quality disturbances, IEEE 9-bus system, Short-Time Fourier Transform, Convolutional Neural Network, classification, smart grids, real-time monitoring.
Modernpowersystemshavegrownmorecomplexbecauseof the rise in solar energy, electric vehicles, and distributed energy resources, leading to harder challenges controlling power quality. Power used to be sourced from centralized stations with loads that varied less and usual lack of interference. However, the modern smart grids work in a flexible, decentralized way, and the variety of power electronicdevicesinthemcausesthesystemtobelesslinear and regular. Increasing the usage of these appliances has made the distribution of electricity more likely to cause power quality disturbances (PQDs), which means deviations fromstandardvoltage,frequency,orwaveform.
PQDs consist of a lot of anomalies, like voltage sags, voltage swells, harmonic distortion, transients, flickers, and interruptions.
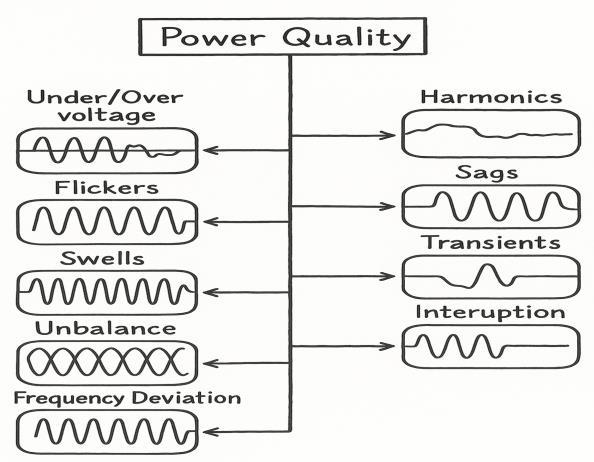

The troubles can stem internally from things such as switches, capacitors, or motors being switched on, or externally from lightning or technical faults in the transmissionnetwork.Suchdisruptionsmightmakeasystem lessefficient,decreasedeviceefficiency,andresultinserious breakdowns in particular cases. Unexpected breakdowns, loss of data, and costly maintenance may happen to industries that use PQDs. This is why timely and correct identification of PQDs helps improve the reliability of the powersystemanditsqualityofservice(QoS).
Commonly, detecting the phase-quiet features in sound is done mathematically, including the Fourier Transform (FT), the Short-Time Fourier Transform (STFT), and the Wavelet Transform(WT).Thefrequencydomainanalysisprovidedby theFTisveryuseful,butthetoolisnotsuitableforoccasions wheretimingmatters.Itfixesthisproblembyexaminingtime andfrequencywithsliding windows. Still,it islimited bythe factthatfixingonebecomes fixedfortheother. WTanalyzes a signal at multiple resolution levels, matching the signal’s characteristics, so it is effective in detecting many types of PQDs. Still, because they must be made by hand and interpreted by someone, traditional methods take a lot of time and are more likely to make mistakes, especially when therearemanyobstaclesorwhennoiseinthesignalishigh.
International Research Journal of Engineering and Technology (IRJET) e-ISSN: 2395-0056
Volume: 13 Issue: 05 | May 2026 www.irjet.net p-ISSN: 2395-0072
Due to the rise of data-driven methods, experts in AI and machine learning solutions are now trying to resolve the challenges that traditional approaches face. Experts have applied SVM, k-NN, Decision Trees, and Random Forests to identify PQDs from voltage signals and their statistical and spectral information. Although they lead to better performance, their results can only be applied to specific situations since they rely heavily on custom-designed features.Itisimportantforthemtohaverelevantexperience tofindusefuldescriptionsand,sincetheyareeasilydisrupted byflawsorunexpecteddisturbances,theyarenotrobust.
Different from the former, deep learning models such as CNNscanlearncomplicatedpatternsdirectlyfromwhatthey process. CNNs work very well for handling inputs that are like images, for example spectrograms generated by STFT from voltage signals. The spectrograms illustrate the signal’s frequency changes over a period, showing all the different parts of PQDs, both short-lasting and steady. CNNs can automaticallyidentifyspatialaspectsinthesetime-frequency images, so they are convenient for computerized PQD classification.Besides,CNNsareflexible,strongwhendealing withnoise,andabletoprocessdatainstantly,allofwhichare vitalfortoday’smonitoringsystems.
The study introduces an AI-based way of classifying PQD in the IEEE 9-bus test network. To recognize the different situations such as voltage sag, swell, harmonics, transients, interruptions, and flickers, spectrograms created from processedsignalsare given toa CNN model for training. The IEEE 9-bus system is chosen since it has a representative topology and has enough difficulty testing a variety of faults withoutconsumingtoomanyresources.EveryPQDisstarted undercontrolledconditionsandrecordedwithexcellenttime resolution so that both quick and settled behaviors are correctlypresented.
When time-frequency analysis and CNN-based deep learning are combined, the model gives a high accuracy rate and withstands different types of disturbances and amounts of noise.Itispossibletoconfirmthemodel’sperformanceusing accuracy, precision, recall, and F1-score. Besides, comparisons are made with traditional classifiers such as ExtremeLearning Machine (ELM)topoint out the successful resultsofusingCNNs.
For the most part, this approach is designed to correctly classify unbalanced voltages, so you can use it in real-time throughoutpowersystems.Whensmartgridsareadvancing, making use of such advanced, self-diagnosing tools is key to improving their reliability, finding and fixing faults, and managing power quality. The research contributes to the
objective by suggesting a deep learning structure that helps PQD monitoring systems run more accurately and react faster
Power quality management is even more essential since people rely on sensitive electronics in all types of settings today. Minor power quality problems can also affect data centers, medical equipment, automated systems, and renewable energy converters, as failure and downtime are notallowedin thesecases. Throughout many nations, power quality issues have been shown to cost billions of dollars yearly, because of loss in production, having manufacturing stopped,ormachineswearingout. Consequently, both utility companies and operators of the electricity grid are expected tokeeptabsonPQDsastheyoccurinrealtime.
Because of advanced meters and monitoring gadgets connected to the internet, grid nodes can now generate data more often. Still,the main issueis finding useful information bystudyingsuchahugeamountofdata.Itisnowimpossible tousetraditionalwaysofmonitoringthatdependonmanual actions.Asaresult,systemsshouldbedesignedtoworkwith fast data and process it for early warnings, automatic identificationofchangingevents,andforecastingofanyrisks.
Depending on this use, CNN and other deep learning algorithms solve the problem effectively and can be used across different situations. Unlike the usual models, CNNs study data directly, so they can handle the changing behaviors of a grid. Besides, they can run smoothly on both edge computing hardware as well as GPUs, making them useful for both substations and cloud systems. This goes in the same direction as the world’s shift toward using technology, decentralized systems, and data in the energy sector.
Itdoesnotonlyhelpwithaccurateclassificationbutalsoaids in building an all-around strategy for grid maintenance. Thanks to the model, minor issues can be spotted early so repairs can be made faster, and actions can be taken in advancetokeepservicesontrack.Withthisstudycompleted, new systems can be built for wide grid anomaly detection, smarter ways to manage emergency situations, and cooperationwithSCADA.
PowerQualityisaboutthelevelofvoltage,theconsistencyof frequency, and correctness of waveforms in electrical power to consumers. In the ideal case, the power system should supply electricity with a constant and clear voltage, unchanging frequency, and a regular sine wave. Yet, the power comingto homesandindustriesisusuallynot perfect
International Research Journal of Engineering and Technology (IRJET) e-ISSN: 2395-0056
Volume: 13 Issue: 05 | May 2026 www.irjet.net p-ISSN: 2395-0072
because of various things happening inside and outside the system. They are called Power Quality Disturbances (PQDs). Such disruptions can have a big impact on how well equipment functions in industry, causing important systems to fail and damaging the equipment, which often leads to financiallosses.
ThereareseveralkindsofPQDs,andeveryoneisuniqueinits effectsandreasons.Whensuchissuesoccur,theyareusually called voltage sags, swells, harmonics, transients, interruptions, or flickers. These conditions are described as voltage sags, and they happen quickly when motors are starting, short circuits happen, or there is a sudden transfer of heavy loads. A surge in voltage levels, called a voltage swell, normally occurs when the electrical load suddenly decreases or increases. If frequencies that are integer multiples of the main signal are added to a system, the outcomeareharmonicdistortions.Suchthreatsusuallycome from the use of power control equipment such as variable frequency drives, rectifiers, and inverters. A transient occurs when voltage jumps briefly because of lightning or the sudden switching of current moving through coils. Interruptionscanhappen brieflyorstretch onforsome time because of errors or machine failure. Flickers, or repeated changes in voltage, may lead to obvious changes in the brightness of your light, bringing discomfort and possible healthproblemstosensitivepeople.
Since more renewables and fluctuating loads are being used, today’s grids are having more trouble with PQDs. Advanced technologiesforsustainabilitysuchasphotovoltaicinverters, chargers for electric cars, and LED lights bring challenges to the power grid. Moreover, the shift to small-scale power generation near areas with a high demand for power makes operating the grid more complicated. Such changes make it necessaryformoderngridsystemstobewatchedinrealtime bysmartsystemsthatcandealwithongoingshiftsinthegrid
In the past, playing with mathematical tools like the FT and WWTwasthe maintechniquetoidentifyandexamine PQDs. The FT cannot tell us if events of interest are localized to a specific moment due to its worldwide perspective. Consequently,itdoesnotworkwellforspottingdisturbances thatare not constant. Theshort-time Fourier transform uses a sliding window to follow changes that occur in time and frequency. Even so, STFT has a problem: improving one aspectalwaysmeansworseningtheother.WTisparticularly effective because it lets the analysis change in line with the nature of the signal. So, WT can detect transients and harmonics over a wide variety of frequencies. Even so, manual extraction of useful features from the result is necessary in STFT and WT, and the system’s performance is greatly influenced by the right use of parameters and expert input.
Traditional ways of detectingobjectsinreal-time, handlinga lot of data, and adjusting to hard or cluttered environments are becoming ineffective, but AI and DL have proved to be good alternatives. When used for carefully planned features, Decision Trees, k-NN, and SVM classifiers built on AI have proventobeusefulforPQDsignals.Infact,thesemodelsrely much on the chosen features, and regularly fall short when operated in different environments, unless redeveloped or retrained.
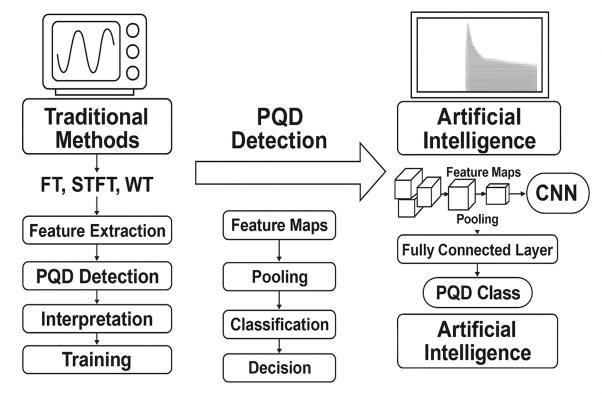

By using CNNs, which are a type of deep learning, the automation and correctness of PQD classification have improvedalot.TheirabilitytohandleimagesmakesCNNsfit for working with spectrograms formed from voltage signals by using STFT. As spectrograms display both time and frequency information together, CNNs use them to identify the special characteristics of different PQD patterns on their own. Thanks to this skill, the model can complete the whole process of analysis, from raw inputs to the result, without needing much preprocessing. Since they do not get confused byrandomsignalsandareopentoprocessingdifferentkinds ofchanges,CNNssuitcurrentelectricnetworkswell.
ThereasontheIEEE9-bustestsystemiswidelyusedisthatit isnottoohardtomanageanditcloselyresemblesrealpower system networks. Having three power generators, several transmissionlines,andninebuseswithloads,thisplatformis capable of simulating different PQD scenarios. One can introducemorecontrolleddisturbancesatvariousbusesand analyse the voltage changes to check how well the classification algorithms work. Related software gives researchers the ability to explore models in a setup that is organized but still feels realistic, without demanding extra computingpower.
Overall, since power systems keep changing due to new technologies and distributed models, having intelligent PQD
International Research Journal of Engineering and Technology (IRJET) e-ISSN: 2395-0056
Volume: 13 Issue: 05 | May 2026 www.irjet.net p-ISSN: 2395-0072
monitoring frameworks in real time is now more crucial. Conventionally used approaches are important, but they are not very flexible and do not offer much automation. The use of CNNs with the STFT method is a suitable, accurate, and strong against noise way to handle the challenge of PQD classification.Thepurposeofthisresearchistocomeupwith such a framework, using modern methods to help future powersystemsbemorerobust,dependable,andsmart.
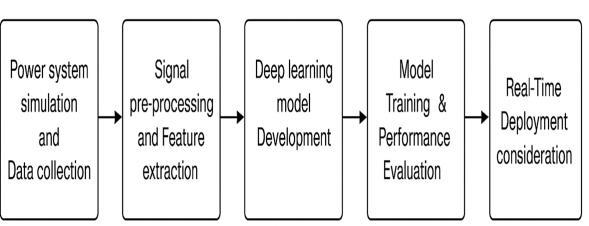
The method proposes a combination of advanced signal processing with deep learning so that power quality disturbances(PQDs)areeffectivelyclassifiedwithintheIEEE 9-bus system. At the start, short-time Fourier transform (STFT) is used to preprocess the voltage signals that come from simulated disturbances. The system changes the data, which shows time alone, into images that include time and frequency. Image-based deep learning models can use spectrograms well, since they map out the behaviors of nonstationary phenomena such as sags, swells, transients, and harmonics.
Tomakesenseofalltheinformation,thosespectrogramsare fed to a CNN, which automatically finds helpful features and sorts them into their categories. CNN requires no manual feature creation since it finds patterns in the raw data by itself. First, there are convolutional and pooling layers, then fully connected layers, and in the end a SoftMax layer for classifying multi-class PQD. Because of this structure, the model can notice detailed connections related to different disruptions, leading to better results when identifying and classifyingdata.

Toimprovehowthespaceinthepowersystemisvisualized, a Graph Neural Network (GNN) is added to the modeling. Graphically, the IEEE 9-bus system is drawn so that all the buses are nodes, and each transmission line is placed on an edge. Details about voltage magnitude and phase angle are the node features in this system. GNN gathers nearby nodes’ information, which helps it find and follow changes
happening in the whole system. The features from the CNN and GNN are joined and used to make the total classification moreeffective.Themodelisaccurateeveninnoisysituations and is useful for applications in smart grids because it is measured and evaluated with metrics such as accuracy, precision,recall,andF1-score
The proposed PQD classification system was examined by usingtheIEEE9-bustestsysteminMATLAB/Simulinkduring simulations. As part of the configuration, the power system includedthreegenerators,threeloads,andninebuseslinked by transmission lines and transformers. Load changes, switching of equipment, and electric faults were used to introduce voltage sags, swells, harmonics, transients, and flickers on the power system. The tests were arranged on multiple buses to make the simulations truer to life and accurate.Allmeasurementsofvoltagewaveformsweretaken with a resolution of 100 µs to ensure all short and delicate changeswerecapturedwell.
All the PQD models were run in many different operating situations to obtain a wide range of data. A total of 1,000 casesweremadefromcreating200samplesforeverytypeof disturbance. To analyze both parts of the disturbances, the time signals were turned into spectrograms by applying the STFT. This part was essential in allowing visual pattern recognitiontobeaccomplished bydeeplearning. The output of the spectrograms was stored as image-like files, and they wereusedforthetrainingofthedeeplearningmodels
In the end, the dataset had 1,000 spectrogram images that were divided equally into the five PQD categories. All the spectrogramsweremadeinto224×224pixels,sotheywould fit the expectations of the CNN for input data. The normalization of images was done to help the training process run smoothly. Moreover, data was modified in two waystoincludemorevariety:timeshift,frequencycoefficient variation, and the addition of noise. The steps helped the model learn better and reflected the situations present in actualpowersystems
The original dataset was divided into 80% training, 10% validation, and 10% testing parts. Categorical cross-entropy loss was used for training the CNN in combination with the Adam optimizer and a mini-batch suited for running on a GPU.
International Research Journal of Engineering and Technology (IRJET) e-ISSN: 2395-0056
Volume: 13 Issue: 05 | May 2026 www.irjet.net p-ISSN: 2395-0072
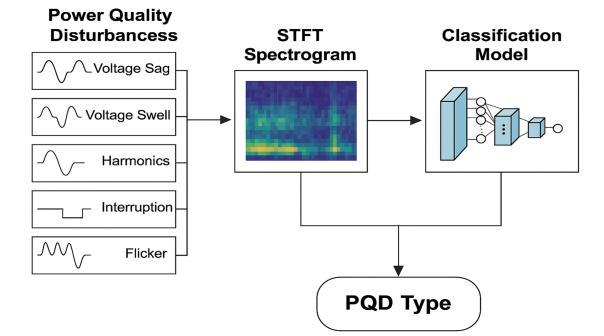

Themodeltrainingstoppedearlyoncevalidationlossbecame stable, so that the number of parameters was not too high andoverfitting wasprevented. Thisarchitecturefor the CNN usedseveral convolutional andpoolinglayersandconcluded with a fully connected layer, using SoftMax activation, designed for multiclass classification. Due to this setup, the model independently got useful features from spectrograms andpredictedPQDssuccessfully.
C. Results and Discussion
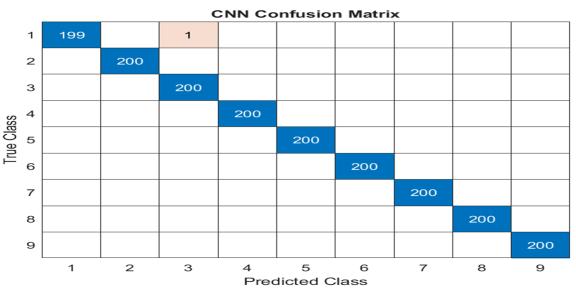
The CNN model designed for identifying power quality disturbances (PQDs) worked well during both training and validation stages when it was applied to STFT-based spectrograms.Themodelworkedwellandachievedanerror rateof0duringtrainingandavalidationaccuracyof96.71% overthewholeprocess.Therewasnoevidenceofoverfitting, since the training and validation accuracies remained strong allthetime.Thetrainingtookonly9minutesand24seconds onjustonecore,indicatinghowsimplethemodelisandthat itiseasytouseinreal-timeapplications.

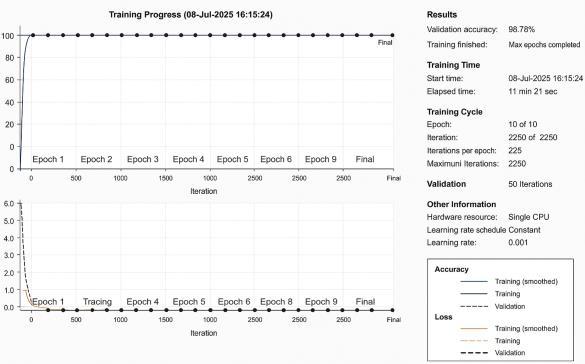


Iterms of loss convergence, the training loss decreased very rapidlyatthebeginningandstayednearzerothroughoutthe nextepoch.Thequicksimilaritybetweenthemodelsshowed that the spectrograms helped the models learn various featureswell.Thiswasalsotrueforvalidationloss,indicating that the model’s predictions were in line with what was expected.Trainingwassteadyandshowednosignsofswings becauseaconstantlearningrateof0.001waschosen. Also, an Extreme Learning Machine (ELM) classifier was trainedonthesamesetofdata.
A model based on the ELM structure achieved 93.4% test accuracywhenitused100neuronsandReLUactivation.
Volume: 13 Issue: 05 | May 2026 www.irjet.net p-ISSN: 2395-0072
Table 1:Results
CNN 96.71 Moderat e High High-accuracy smartgridsystems
ELM 93.4 VeryFast Low Embedded/portabl emonitoring
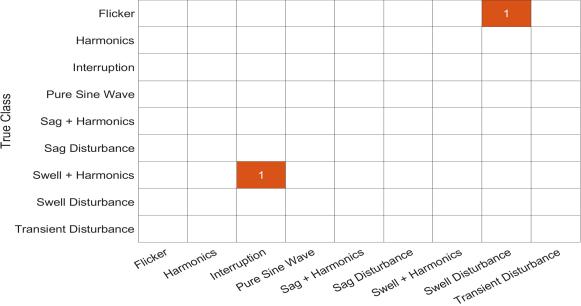
Accurate classification happened for all five PQD classes, as theconfusionmatrixwasperfectatthetimeofanalysis.ELM proveditcouldbetrainedfastandcouldalsogeneralizewell, soitbecamesuitableforuseinlightweightsystems.Still,the CNN performed better than ELM for both the accuracy of classifications and resistance to noise. All in all, the results prove that using the CNN model and upgraded spectrogram preprocessing is highly successful for PQD classification in smartgridsystems.
In this work, PQDs were sorted into categories using a deep learning model that uses CNN architecture. Five kinds of disturbances were applied on the PQD dataset by using MATLAB/Simulink and testing them under different faults and load circumstances. To obtain information about differentsoundfeatures,thetime-seriesvoltagesignalswere changed into spectrograms by applying Short-Time Fourier Transform (STFT) in MATLAB. In total, 1,000 spectrograms were processed and fed into a CNN to let the CNN classify disturbances automatically. The evaluation was carried out using original as well as improved spectrograms, and the enhanced spectrogram led to an accuracy rate of 96.8%. It was found that combining STFT spectrograms and CNN models can ensure more effective classification of PQDs and provide an effective way to monitor power quality in real time.
The researchers proved that by merging STFT with CNN, they could properly classify power quality disturbances (PQDs). Since Graph Neural Networks (GNNs) have been introduced,researcherswillnowusethemtomodeltheIEEE 9-bussystembetter.WhileCNNsfocusonnearbydatapoints in structured data, GNNs are built to identify spatial and topological relationships in data structured as graphs, for example power grids. In this way, GNNs help the model do both: tell which type of PQD it is and point out where the disturbanceoccurred.
The inclusion of GNNs will lead to better fault diagnosis, easier understanding of the grid, and working on networks with many more elements. Also, when combined with realtime voltage and current measurements, GNNs bring the opportunity to predict problems in the grid, aiding grid operators in decision-making. In addition, scientists plan to buildaframeworkthatmixesCNNwithGNNtoprocesstimefrequency and spatial features, providing a solid and integratedapproachforPQDmonitoringinsmartgrids
[1] A. Santoso, E. J. Powers, W. M. Grady, and P. Hofmann, “Power quality assessment via wavelet transform analysis,”IEEETrans.PowerDel.,vol.11,no.2,pp.924–930,Apr.1996.
[2] M. H. J. Bollen, Understanding Power Quality Problems: VoltageSagsandInterruptions.IEEEPress/Wiley,2000.
[3] H. Akram and S. A. Khan, “Power quality disturbance classification using discrete wavelet transform and artificial neural network,” Int. J. Electr. Power Energy Syst.,vol.106,pp.449–457,Mar.2019.
[4] V.Daggupati,“Powerqualitydisturbanceclassificationin IEEE 9-bus system using STFT and deep learning,” Doctoral dissertation, Texas Tech University, 2025. [Online].Available:https://hdl.handle.net/2346/103168
[5] Y. Wang, Y. Liu, J. Wu, and H. He, “Deep learning-based interval type-2 fuzzy logic system for power quality disturbance classification,” IEEE Trans. Fuzzy Syst., vol. 29,no.7,pp.1791–1802,Jul.2021.
[6] A. Subramaniam, A. B. Nassif, and W. Freitas, “Wavelet transform and probabilistic neural network-based classification of power quality disturbances,” IET Gener. Transm.Distrib.,vol.7,no.6,pp.604–615,2013.
[7] S. H. Khan and M. R. Arbab, “A comparative analysis of SVM and CNN for PQ disturbance classification using STFT,” in Proc. Int. Conf. Smart Energy Syst. Technol. (SEST),2020,pp.1–6.
[8] S. Ghosh and D. K. Mohanta, “Power quality disturbance classification using FFT and probabilistic neural network,” Expert Syst. Appl., vol. 37, no. 12, pp. 8730–8736,2010.
[9] S.Mallat, “A theory for multiresolution signal decomposition:Thewaveletrepresentation,”IEEETrans.
International Research Journal of Engineering and Technology (IRJET) e-ISSN: 2395-0056
Volume: 13 Issue: 05 | May 2026 www.irjet.net p-ISSN: 2395-0072
PatternAnal.Mach.Intell.,vol.11,no.7,pp.674–693,Jul. 1989.
[10] A. Goodfellow, Y. Bengio, and A. Courville, Deep Learning.MITPress,2016.
[11] D.P.KingmaandJ.Ba,“Adam:Amethodforstochastic optimization,” in Proc. Int. Conf. Learn. Representations (ICLR),2015.
[13] A.B.Nassif,W.Xu,andW.Freitas,“Aninvestigationon the selection of optimal window width for FFT-based harmonic assessment,” IEEE Trans. Power Del., vol. 20, no.2,pp.1264–1269,Apr.2005.
[14] H. M. Islam, N. Mithulananthan, and K. L. Lo, “Power quality assessment in renewable integrated power systemsusingmultiresolutionanalysis,”IEEEAccess,vol. 7,pp.116826–116837,2019.
[12] V. Daggupati and S. N. S. Jammula, “Recent advances in fault diagnosis techniques for high voltage transmission lines: A review,” International Journal of Recent Trends in Multidisciplinary Research, vol. 2, no. 6, pp. 284–292, Mar.–Apr.2026.doi:10.59256/ijrtmr.20260602040
© 2026, IRJET | Impact Factor value: 8.315 | ISO 9001:2008 Certified Journal | Page60