
International Research Journal of Engineering and Technology (IRJET) e-ISSN: 2395-0056
Volume: 13 Issue: 04 | Apr 2026 www.irjet.net p-ISSN: 2395-0072

International Research Journal of Engineering and Technology (IRJET) e-ISSN: 2395-0056
Volume: 13 Issue: 04 | Apr 2026 www.irjet.net p-ISSN: 2395-0072
1BH Bhujanga Reddy, 2K Teja Sai, 3G Sreeja, 4 M Seetharam
1Assistant Professor Computer Science and Engineering Geethanjali College of Engineering and Technology Hyderabad, Telangana, India 2,3,4 UG Student Computer Science and Engineering Geethanjali College of Engineering and Technology Hyderabad, Telangana, India
Abstract- Climate change and rising carbon emissions are major global problems that need smart solutions for sustainable decision-making. This paper introduces OpenCarbon, an open-access AI-based platform for predicting carbon emissions and analyzing sustainability. It is designed to study carbon emission datasets, provide predictive insights, and raise environmental awareness. The system features a flexible machine learning pipeline that uses INFO optimization and an Optimized Extreme Learning Machine (ELM) model for precise emission predictions. The platform allows users to upload datasets dynamically, automate data processing, generate key performance indicators, visualize results with explainable AI using SHAP, and forecast future emissions. Built with FastAPI,HTML,JavaScript,andSQLite,thesystemoffersan interactivedashboardanduser-friendlyanalyticsforthose without advanced technical skills. For validation, it uses several real-world datasets, including OWID CO₂ data, World Energy Consumption, and country-specific carbon emission datasets. The findings show strong prediction accuracy,scalableperformance,andvaluablesustainability insights. OpenCarbon is a lightweight, smart tool for analyzing carbon emissions, monitoring the environment, andsupportingsustainabilitydecisions.
Keywords-Carbon Emissions, Sustainability Analytics, Explainable AI, ELM Model, Forecasting, FastAPI, SHAP, Environmental Data Analysis.
Global warming and climate change are significant environmental issues caused mainly by rising carbon dioxide (CO₂) emissions. Governments, researchers, and environmental groups need smart analytical tools to track emissiontrends,predictfuturevalues,andgaininsightson sustainability. Traditional carbon analysis systems are oftenfixed,tiedtospecificdatasets,andlackclarity,which limits their effectiveness for flexible environmental analytics.
Recent developments in Artificial Intelligence (AI) and Machine Learning (ML) have made predictive modeling and data-driven sustainability analysis possible. However, most current platforms either concentrate solely on
visualizationorneedcomplextechnicalskillstouse.There is a clear need for an open-access, smart, and flexible platform that can automatically analyze carbon datasets andgiveunderstandablepredictions
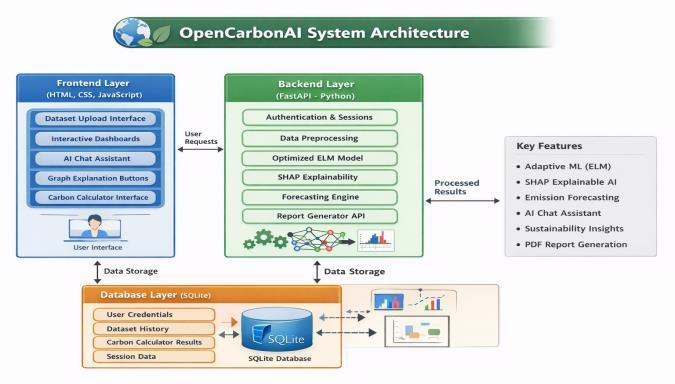
To tackle these limitations, this paper presents OpenCarbon, an AI-based platform for carbon prediction and sustainability analytics. The system is built to work withanydataset,iseasytouse,andcanproducepredictive insights, KPI analytics, and clear visualizations from carbon emission data. The platform blends data preprocessing, improved machine learning, and forecasting methods to aid environmental decisions and research. Figure 1 shows the overall workflow and design of the OpenCarbon platform to help clarify the system's process
Severalstudieshavelookedintousingmachinelearning for analyzing environmental data and predicting carbon emissions. Traditional statistical models like linear regression and time-series forecasting have been commonly used to analyze emission trends. However, these models often struggle to capture the complex nonlinearrelationshipsfoundinlarge-scaleenvironmental datasets.
Recent research has focused on using AI-based predictive models for sustainability analytics. Machine learningtechniqueslikeRandomForest,NeuralNetworks, andSupportVectorMachineshaveshownbetterresultsin emission prediction tasks. Also, explainable AI methods such as SHAP (SHapley Additive Explanations) have been introduced tohelp interpret model decisions and improve transparencyinenvironmentalanalyticssystems.
Open datasets like OWID CO₂ data and World Energy Consumptiondatasetsare widelyusedinclimateresearch to examine global emission patterns. However, many currentsystemsdonotcombineforecasting,explainability, and interactive dashboards in one platform. Additionally, most platforms do not adjust to different dataset structuresandneedmanualsetup.
International Research Journal of Engineering and Technology (IRJET) e-ISSN: 2395-0056
Volume: 13 Issue: 04 | Apr 2026 www.irjet.net p-ISSN: 2395-0072
The proposed OpenCarbon platform addresses these gaps by combining machine learning, explainable AI, forecasting, and interactive dashboards into one openaccess system for analyzing carbon emissions. The system uses an adaptive preprocessing pipeline, an INFOoptimized ELM prediction model, and SHAP-based explainability to provide clear, transparent, and scalable emissionanalytics
A. System Overview
OpenCarbon is a complete AI-driven web platform that allows for smart carbon emission analysis through automatic data processing, predictive modeling, and clear visualization. The system uses a modular design with frontend, backend, AI analytics engine, and database layers.
OpenCarbon is a full AI-driven web platform. It enables smartanalysisofcarbonemissionsthroughautomaticdata processing, predictive modeling, and clear visualization. The system has a modular design. It includes frontend, backend,AIanalyticsengine,anddatabaselayers.
B. System Architecture
AsshowninFig.1,theoveralllayoutoftheOpenCarbon platform brings together dataset upload, preprocessing, optimized ELM prediction, SHAP explainability, and forecastinginoneAI-drivenpipeline.
The backend manages dataset processing, model execution, forecasting, and API communication. The frontend offers interactive dashboards and visualization panels. The SQLite database keeps user sessions, dataset history,andanalyticalresultsforeasyaccess.
A. Data Collection and Datasets
The system uses several real-world carbon emission datasets,including:
Carbon(CO2)EmissionsbyCountry
OWIDCO₂Dataset
WorldEnergyConsumptionDataset
Customcarbon_dataCSVdatasets
These datasets include emissions, energy use, and environmental indicators for each country. They are used forpredictiveanalysis.
B. Data Preprocessing
Thepreprocessingmoduleautomaticallydoes:
Missingvaluehandling
Datacleaningandnormalization
Featureselection
Targetcolumndetection
Datasetscalingandsplitting
This preprocessing helps the platform use different carbondatasetswithoutneedingmanualsetup.
C. Machine Learning Model (INFO + Optimized ELM)
The main prediction engine uses an Optimized Extreme LearningMachine(ELM)modelthatincorporatestheINFO optimizationalgorithm.TheELMmodeloffersfasttraining speedsandeffectivegeneralization,makingitagoodfitfor environmentaldatasets.
The INFO optimizer improves model parameter selection and boosts prediction accuracy. We evaluate model performance using metrics like MSE, RMSE, and R² score.
D. Explainable AI using SHAP
To ensure transparency, the system uses SHAP explainability to interpret feature importance and model predictions. SHAP summary plots and feature impact graphs help users see how variables like energy consumption, region, and historical emissions affect predictionoutcomes.
International Research Journal of Engineering and Technology (IRJET) e-ISSN: 2395-0056
Volume: 13 Issue: 04 | Apr 2026 www.irjet.net p-ISSN: 2395-0072
The forecasting module examines past emission trends and predicts future carbon emission values using timeseries learning patterns. The system allows for global and country-specific forecasting, depending on the available data.
As shown in Fig. 2, the forecasting module examines past carbon emission trends and creates future emission predictions. This helps with long-term sustainability analysisandprovidesinsightsforpolicy-making.
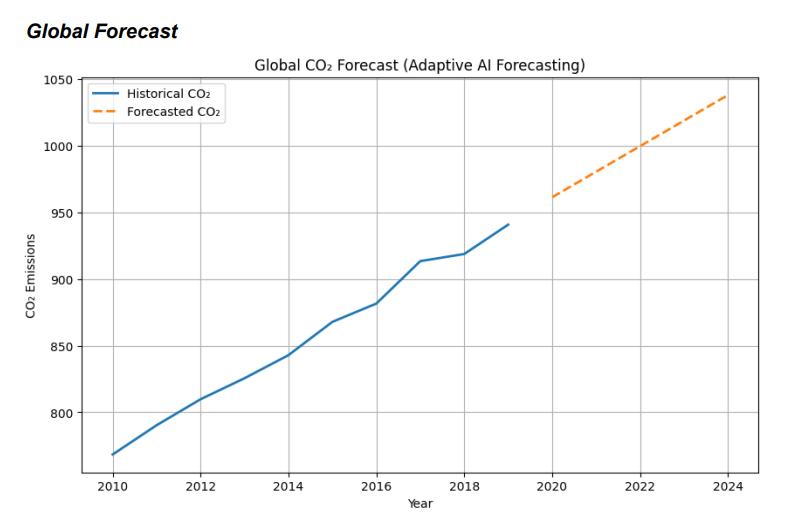
2. Future Carbon Emission Forecast Based on Historical Dataset
V. SYSTEM MODULES
A. USER INTERFACE MODULE
The frontend interface is built with HTML, CSS, and JavaScript. It allows users to upload datasets and includes KPI dashboards, visualization panels, and features for interacting with AI. The design focuses on being simple, interactive,andeasytouse.
As shown in Fig. 3, the dataset upload and analysis interface lets users upload carbon emission datasets and startautomatedAI-basedanalysisusingan interactiveand easy-to-usedashboard.
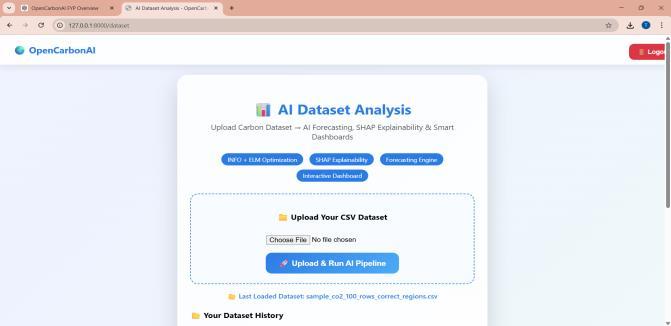
Fig.3.DatasetUploadandAnalysisInterfaceofOpenCarbon Platform
B. Backend Processing Module
The FastAPI backend manages dataset uploads, preprocessing, model execution, forecasting, and API responses. It also serves cached results to avoid reprocessingthedatasetrepeatedly.
C. AI Analytics Module
This module brings together ELM prediction, SHAP explainability, KPI generation, and sustainability insight analysis. It makes up the main intelligence layer of the OpenCarbonplatform.
D. Database Module
SQLite database stores user credentials, dataset history, analytical results, and session-based information. This setupensureslightweightandefficientstorage.
A. Dashboard Analysis
The OpenCarbon platform offers an interactive dashboard that shows important sustainability KPIs like average CO₂ emissions, maximum emissions, minimum emissions, emission trends, and the countries with the highest emissions. The dashboard updates automatically basedontheuploadeddataset.
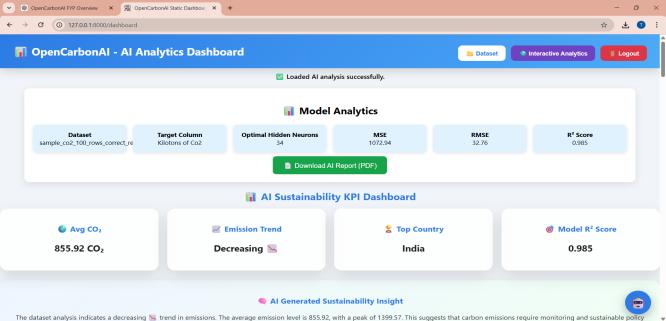
Fig. 4. InteractiveDashboardofOpenCarbonShowingKPI
AsshowninFig.4,theinteractivedashboardoffersrealtimeKPIanalytics.Itincludesaverageemissions,emission trends, and comparisons by country for a detailed environmentalanalysis.
B. Prediction and Model Performance
Experimental evaluation with several carbon emission datasets showed good prediction accuracy and stable model performance. The optimized ELM model reached reliable R² scores and low error metrics. This indicates a strong ability to predict outcomes for environmental data analysis.
International Research Journal of Engineering and Technology (IRJET) e-ISSN: 2395-0056
Volume: 13 Issue: 04 | Apr 2026 www.irjet.net p-ISSN: 2395-0072
As shown in Fig. 5, the optimized ELM model shows a closematchbetweenactualandpredictedcarbonemission values. This indicates strong prediction accuracy and reliableperformance.
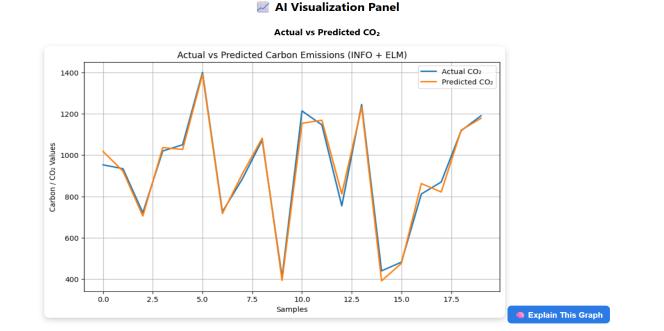
Fig. 5. ActualvsPredictedCarbonEmissionValuesUsing OptimizedELMModel
C. Visualization and Explainability
Thesystemproducesseveralvisualoutputs,including:
ActualvsPredictedEmissionGraph
CO₂TrendAnalysis
SHAPFeatureImportancePlot
ForecastGraphs
As shown in Fig. 6, the SHAP feature importance plot explains how different environmental and energy-related features contribute to predicting carbon emissions. This improvesthemodel'stransparencyandinterpretability.
These visualizations improve understanding and supportresearch-levelenvironmentalanalysis.
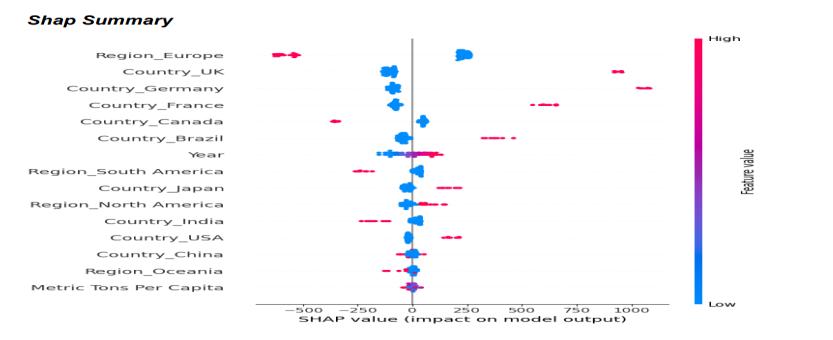
Fig. 6. SHAP Feature Importance Analysis for Carbon Emission Prediction
D. System Efficiency and Usability
The platform works well on regular laptop settings because of its lightweight structure and improved model design.Theopen-accessandweb-basedinterfacemakesit
easyforstudents,researchers,andenvironmentalanalysts touse.
This paper introduced OpenCarbon, an open-access platform that uses AI for predicting carbon emissions and analyzing sustainability. The system combines data preprocessing, machine learning, explainable AI, forecasting, and interactive dashboards into a single platform. Experimental results with real-world carbon emission datasets show good prediction performance and valuablesustainabilityinsights,alongwitheasyscalability. Thisplatformhelpsclimateanalyticsresearchbyofferinga clear,intelligent,anduser-friendlysolutionformonitoring carbonemissionsandsupportingsustainabilitydecisions.
Future improvements of the OpenCarbon platform may include the integration of real-time IoT environmental sensors, deep learning forecasting models, and cloudbased deployment for large-scale climate analytics. Additional features like geo-spatial emission mapping, policy recommendation systems, and multilingual sustainability insights can further enhance the platform’s impactinenvironmentalresearchanddecision-making.
TABLE I. PROJECT MODULES AND DESCRIPTION
Project Module Description
UserInterface Handlesdatasetupload,dashboard andvisualization
Preprocessing Module Datacleaning,normalizationand featureselection
AIPrediction Module INFOoptimizedELMmodelfor carbonprediction
Explainability Module SHAP-basedfeatureimportanceand interpretation
Forecasting Module Futurecarbonemissionprediction
DatabaseModule SQLitestoragefordatasetsand results
TABLE II. TECHNOLOGY STACK
Component Technology
Frontend HTML,CSS,JavaScript
Backend FastAPI(Python)
International Research Journal of Engineering and Technology (IRJET) e-ISSN: 2395-0056
Volume: 13 Issue: 04 | Apr 2026 www.irjet.net p-ISSN: 2395-0072
Database SQLite
DataProcessing Pandas,NumPy
Visualization Matplotlib
ExplainableAI SHAP
MachineLearning OptimizedELM+INFO
TABLE III. TEAM CONTRIBUTION
Team Member Contribution
MemberI AI Model Development, Data Preprocessing, and Prediction Module Implementation
MemberII Frontend Development and Documentation
MemberIII Backend Support, Model Testing, Dataset Handling, Deployment, and SystemPerformanceEvaluation
The authors would like to thank Geethanjali College of Engineering and Technology for providing the academic environment and resources that supported this research work.
The authors express their sincere appreciation to BH Bhujanga Reddy for her valuable guidance, constructive feedback, and continuous support throughout the developmentoftheProject
The authors also acknowledge the support of the Department of Computer Science and Engineering for facilitatingthesuccessfulcompletionofthiswork.
REFERENCES
[1] Y.Zhangetal.,“AnexaminationofdailyCO₂emissions prediction through a comparative analysis of machine learning, deep learning, and statistical models,” EnvironmentalScienceandPollutionResearch,2025.
[2] J.Hofstetter et al.,“Predictionofcarbon dioxidelevels in the European Alps based on machine learning
algorithms,” Applied and Computational Engineering, 2024.
[3] P. Mishra et al., “Neural network approach to carbon emission prediction in industrial and power sectors,” DiscoverAppliedSciences,2025.
[4] R. Singh et al., “Machine Learning Techniques for Multifactor Analysis of National CO₂ Emissions,” arXiv preprint,2025.
[5] M. Rahman and T. Chowdhury, “SHAP-Driven Explainable AI for Climate and Emission Forecasting Systems,”AppliedEnergy,2024.
[6] S. Patel and R. Kumar, “Performance Optimization of ELM-Based Carbon Emission Models Using MetaHeuristicAlgorithms,”IEEEAccess,2024.
[7] L. Wang and R. Gupta, “Machine Learning Approaches for Environmental and Emission Forecasting: A Comprehensive Review,” Environmental Modelling & Software,2023.
[8] J.Liu,H.Chen,andX.Zhao,“AI-BasedCarbonEmission Prediction Using Hybrid Machine Learning Models,” Sustainable Computing: Informatics and Systems, 2023.
[9] K. Sharma and A. Verma, “Deep Learning and TimeSeries Models for Global CO₂ Emission Forecasting,” JournalofCleanerProduction,2024.
[10] S. Das et al., “Explainable Artificial Intelligence in Environmental Monitoring and Climate Analytics,” EnvironmentalResearchLetters,2023.
[11] M. Ali, S. Khan, and N. Ahmad, “Data-Driven Carbon Emission Analysis Using Predictive AnalyticsandAI Techniques,”EnergyReports,2024.
[12] H. Zhang and Y. Li, “Sustainability Analytics Using Machine Learning for Climate Change Assessment,” RenewableandSustainableEnergyReviews,2023.
[13] R. Kumar, P. Gupta, and S. Mehta, “Forecasting Carbon Emissions Using AI and Big Data Analytics,” Sustainable Energy Technologies and Assessments, 2024.
[14] T. Nguyen and D. Tran, “Intelligent Environmental Decision Support Systems Using Explainable AI,” AppliedSoftComputing,2023.