
International Research Journal of Engineering and Technology (IRJET) e-ISSN: 2395-0056
Volume: 13 Issue: 04 | Apr 2026 www.irjet.net p-ISSN: 2395-0072

International Research Journal of Engineering and Technology (IRJET) e-ISSN: 2395-0056
Volume: 13 Issue: 04 | Apr 2026 www.irjet.net p-ISSN: 2395-0072
Aditya Yadav1 , Darshan Chhajed2, Yash Wadave3, Yash Neve4, Prof. Dolly Soni5
1,2,3,4 Student, Department of Computer Engineering, Thakur Polytechnic, Mumbai, India
5 Professor, Department of Computer Engineering, Thakur Polytechnic, Mumbai, India
Abstract - Modern interest in space exploration has surged with the advent of the "New Space" era, yet the vast datasets generated by organizations such as NASA remaininaccessible or difficult to interpret for the general public. This paper introduces LUNARIS, a comprehensive, integrated web-based platform designed to democratize space data through highfidelity 3D visualizations, predictive analytics, and artificial intelligence. LUNARIS employs a React-based frontend with interactive 3D globes and a Flask-based backend to enable real-time satellite tracking, exoplanet discovery tools, and an AI-based astronomicalassistantpoweredbytheGoogleGemini API. The platform integrates a Random Forest Regressor trained on the UCS Satellite Database comprising 8,794 records across 75 countries to predict national space program growth rates, achieving a Coefficient of Determination(R²) of0.9441, a MeanAbsoluteError(MAE)of 0.0062, and a Root Mean Squared Error (RMSE) of 0.0093. By combining NASA API data ingestion with machine learningbased prediction, LUNARIS provides a unified ecosystem for both educational and research-oriented space exploration. Experimental evaluation demonstrates that LUNARIS improves data accessibility, enhances user engagement, and delivers efficient analytical capabilities.
Key Words: Artificial Intelligence, Data Visualization, Machine Learning, NASA API, Predictive Intelligence, Random Forest, Satellite Tracking, Space Analytics, Web Platform
The rapid expansion of the global space industry has generated unprecedented volumes of orbital and celestial data. From the proliferation of Low Earth Orbit (LEO) satellitemega-constellationstothecontinuousdiscoveryof thousandsofexoplanetsystems,theneedforcentralizedand intuitivedataplatformshasreachedacriticallevel[1].The number of operational satellites in orbit has grown significantlyinrecentyearsduetoride-sharingmissionsand
thedemocratizationofsatellitemanufacturing.However,the rawdataproducedbythesemissionsishighlyfragmented anddifficulttouseforstudentsandnon-expertusers.
Existing public platforms are typically limited in scope. SimulatorssuchasNASA'sEyesontheSolarSystemprovide high-fidelity simulations but lack social collaboration or predictive analytics [2]. Web-based trackers such as Heavens-Above focus exclusively on satellite telemetry without integrated AI assistance. Academic tools remain inaccessibleduetosteeplearningcurvesandtheabsenceof intuitiveinterfaces.
LUNARISaddressesthesechallengesbyservingasamultimodal hub that synthesizes visualization, analytics, prediction, and education into a single unified platform. Inspired by the concept of Digital Twins in industrial monitoring[3],LUNARIScreatesavirtualrepresentationof the orbital and celestial environment by integrating realtimedatafromtheNASAAPI,theNASAExoplanetArchive, andhistoricalsatellitedatasets.
Thekeycontributionsofthispaperare:
• Aunifiedwebplatformintegrating3Dsatellitetracking, exoplanet exploration, AI chatbot assistance, gamification,collaboration,andspacenews.
• A Random Forest Regressor-based space program growthpredictionmoduletrainedontheUCSSatellite Database,achievingR²=0.9441.
• AcomparativeevaluationofLUNARISagainsttraditional spacedatatoolsdemonstratingsuperiorintegrationand accessibility.
Theremainderofthispaperisstructuredasfollows:Section 2 reviews related work. Section 3 describes the system architecture.Section4detailsthemethodologyandmachine learningmodel.Section5coversimplementation.Section6 presents results and discussion. Section 7 concludes with futuredirections.
International Research Journal of Engineering and Technology (IRJET) e-ISSN: 2395-0056
Volume: 13 Issue: 04 | Apr 2026 www.irjet.net p-ISSN: 2395-0072
Theapplicationofmachinelearninganddatavisualizationin space research has attracted significant research interest. Researchers have utilized regression models, neural networks,andstatisticaltechniquestoanalyzesatellitedata andpredicttrendsacrossorbitalenvironments[4].
Inthedomainofweb-basedspacedataplatforms,Bostocket al.demonstratedthatinteractive,data-drivenvisualization frameworkscansubstantiallyimproveusercomprehension ofcomplexspatialdatasets[5].However,suchtoolstypically focusonstaticvisualizationandlackpredictiveanalyticsor AI-assistedinteraction,limitingtheirutilityforforecasting nationalspaceprogramtrajectories.
Breiman introduced the Random Forest algorithm as an ensemble learning method combining multiple decision trees to reduce variance and improve generalization [6]. Subsequent studies have validated Random Forest Regressors for multivariate regression tasks involving socioeconomicandtechnologicalindicators[7],makingthe algorithm well-suited for predicting satellite program growthratesfromheterogeneouscountry-levelfeatures.
The integration of Large Language Models (LLMs) into domain-specific web applications has been explored in several studies. Lewis et al. demonstrated that retrievalaugmented generation significantly enhances the factual groundingofLLMresponsesinknowledge-intensivetasks [8].Kasnecietal.furtherdemonstratedthatLLM-powered assistants in scientific platforms produce measurable improvementsinuserengagementandlearningoutcomes [9].
Geographic Information Systems and 3D rendering frameworks such as Three.js and Globe.gl have improved spatialdatarepresentationinbrowser-basedenvironments [10].Despitetheseadvances,mostexistingsystemsaddress singlefunctionalitiesinisolation.LUNARISbridgesthisgap byintegratinganalytics,visualization,prediction,anduser interactionintoasingle,accessibleplatform.
TheLUNARISframeworkisbuiltonamodular,decoupled architecture designed to ensure scalability, flexibility, and high-performance during data-intensive operations. The systemisorganizedintofourprincipallayers:theFrontend Layer,theBackendLayer,theAIServiceLayer,andtheData Layer.
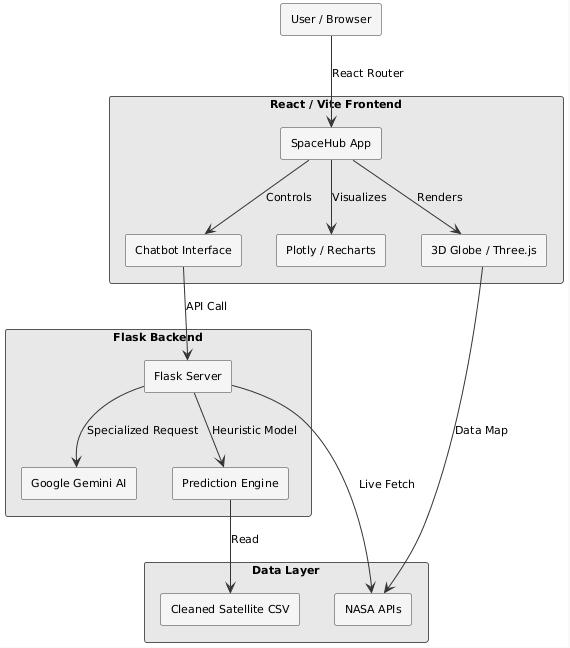
TheinteractionlayerisbuiltusingReact19andVite,chosen for their optimized build cycles and reactive state management.Spatialvisualizationsintegratereact-globe.gl andThree.jsforhardware-accelerated3Drenderingofthe Earthandorbitalpaths.Analyticalviewsarerenderedusing Plotly.jsandRechartsfordynamic,filterablecharts.Theuser interface employs a modern design language powered by Tailwind CSS and Framer Motion, providing smooth transitionsthatreducecognitiveloadfornon-expertusers.
The API layer is implemented as a Flask-based Python application,handlingcross-originrequestsandinterfacing withthedatalayer.Thebackendservesastheorchestration pointfordatanormalization,machinelearningpredictions, andexternalAPIproxying.Adedicatedprediction.pymodule implements the satellite program growth prediction pipeline.
The LUNARIS AI module leverages the gemini-2.5-flash model. It is configured with system-level boundary instructions to actas a specializedastronomical assistant, ensuringthatresponsesaregroundedinscientificfactand confinedtothespacedomain.Queriesoutsidethisdomain
International Research Journal of Engineering and Technology (IRJET) e-ISSN: 2395-0056
Volume: 13 Issue: 04 | Apr 2026 www.irjet.net p-ISSN: 2395-0072
are declined, maintaining a focused and reliable user experience.
Theplatformemploysahybriddatastrategycombiningrealtimeandstaticsources:
• NASAAPIIngestion:FetchestheAstronomyPictureof theDay(APOD)andreal-timespacenews.
• Exoplanet Archive (CSV): Processes a cleaned local datasetofconfirmedexoplanetsforhigh-speedfiltering andvisualization.
• UCS Satellite Dataset: A cleaned repository of 8,794 globalsatelliterecordsacross75countries,usedasthe training corpus for the machine learning prediction module.
The development of LUNARIS follows a pipeline-based approachthatprioritizeslowlatencyanddataaccuracy.
4.1 Feature Engineering from Satellite Dataset
Country-levelfeaturesareextractedfromtheUCSSatellite Database by aggregating individual satellite records. For eachcountry,fiveinputfeaturesarecomputed:
• SatelliteCount(C):Totalnumberofsatelliteslaunched bythecountry.
• MomentumScore(M):Ratioofsatelliteslaunchedafter 2021 to those launched after 2018, capturing recent programacceleration.
• Purpose Diversity (D): Number of unique satellite missiontypes(e.g.,EarthObservation,Communication, Navigation).
• Orbit Diversity: Number of unique orbital classes utilized(LEO,MEO,GEO).
• Program Age: Number of years elapsed since the country'sfirstsatellitelaunch. Thetargetvariable,GrowthRate(G),isinitiallycomputed using a tiered heuristic formula based on satellite count thresholds,formalizedinEquation(1):
G=0.06+0.02M+0.001D, ifC>500
G=0.10+0.03M+0.002D, ifC>100
G=0.14+0.04M+0.003D, ifC>20
G=0.18+0.05M+0.005D, otherwise;G≤0.30 ...(1) where C = Satellite Count, M = Momentum Score, and D = PurposeDiversity.
ARandomForestRegressoristrainedtolearnthenon-linear relationshipsbetweenthefiveinputfeaturesandthegrowth rate targetvariable [6]. The model isconfiguredwith100 decisiontrees(n_estimators=100,random_state=42).The datasetof75countriesispartitionedintoatrainingsetof60 countries(80%)andatestsetof15countries(20%)usinga fixedrandomseedtoensurereproducibility.
TheRandomForestpredictionforagiveninputvectorxis definedbyEquation(2):
ŷ=(1/T)Σ(t=1toT)fₜ(x) ...(2)
where T = 100 is the number of decision trees and fₜ(x) denotes the prediction of the t-th tree. Once trained, the model replaces the heuristic formula for all predictions servedthroughtheFlaskAPI.
UserqueriesareprocessedthroughaspecializedAIroute. Thebackendprependssystem-levelboundaryinstructions to each Gemini API call, ensuring the chatbot remains focusedonspacetechnologyandastronomicalscience.This approach is consistent with the prompt-engineering strategiesdescribedin[8]forgroundingLLMresponsesin specificknowledgedomains.
LUNARIS is implemented using a modern, open-source technology stack. The frontend is built with React 19 and Vite, with Three.js and react-globe.gl providing WebGLaccelerated 3D rendering. The backend is a Flask-based Python 3 application. All machine learning components utilize scikit-learn. Table 1 summarizes the complete technologystack.
Table -1: LUNARIS Technology Stack
Component Technology
FrontendFramework React19,Vite
3DVisualization Three.js,react-globe.gl
Charts&Analytics Plotly.js,Recharts
Styling TailwindCSS,FramerMotion
BackendFramework Flask(Python3)
MachineLearning scikit-learn
AIChatbot GeminiAPI
ExternalAPIs NASAAPODAPI,NewsAPI
Authentication GoogleOAuth2.0
International Research Journal of Engineering and Technology (IRJET) e-ISSN: 2395-0056
Volume: 13 Issue: 04 | Apr 2026 www.irjet.net p-ISSN: 2395-0072
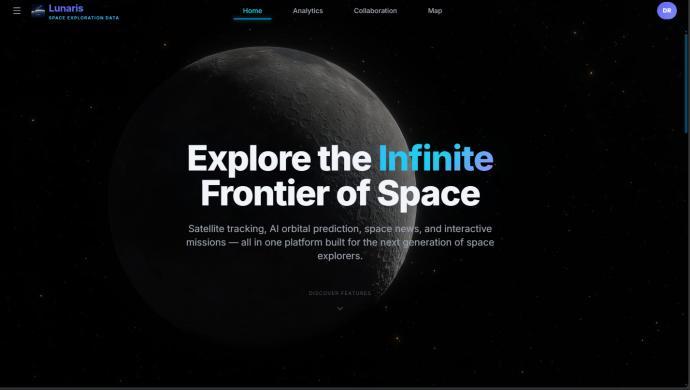
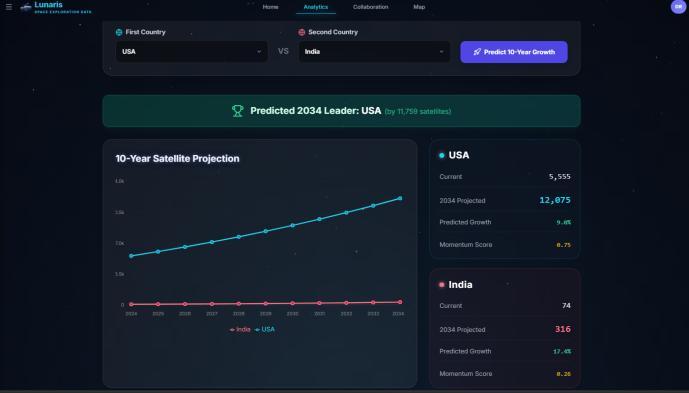
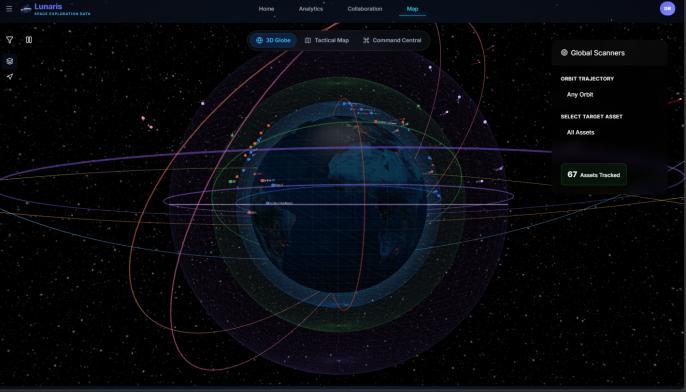
-4:LUNARISInteractive3DGlobe
Thecoremodulesimplementedintheplatformare:
• Interactive 3D Globe: Real-time satellite tracking and orbitalpathvisualizationusingreact-globe.gl.
• Exoplanet Explorer: Filterable browser of confirmed exoplanets from the NASA Exoplanet Archive with detailedvisualrepresentations.
• PredictionModule:FlaskAPIendpointservingRandom Forest-basedgrowthratepredictionsfor75countries, displayedasinteractivelineplots.
• AI Chatbot: Gemini-powered astronomical assistant integratedintotheplatforminterface.
• CollaborationModule:Country-levelspacecollaboration analysisandnetworkvisualization.
• SpaceNews&Gallery:Real-timespacenewsandNASA APODimagesfetchedviaexternalAPIs.
• Gamification: Interactive quizzes on space science to enhancelearningandengagement.
6.1
TheRandomForestRegressorwasevaluatedontheheld-out testsetof15countries.Table2presentsthe performance metrics. The model achieved an R² score of 0.9441, indicating that 94.41% of the variance in national space programgrowthratesisexplainedbythefiveinputfeatures. The MAE of 0.0062 and RMSE of 0.0093 confirm strong predictiveperformancewithminimalerror.
Table -2: Random Forest Regressor Performance Metric Value
(MAE) 0.0062
RootMeanSquaredError(RMSE) 0.0093
TrainingCountries(80%) 60
TestingCountries(20%) 15 NumberofDecisionTrees 100 TotalDatasetRecords 8,794
FeatureimportanceanalysisrevealedthatMomentumScore (43.53%) and Satellite Count (42.29%) are the dominant predictors,togetheraccountingfor85.82%ofthemodel's decisionweight.OrbitDiversity(7.94%),PurposeDiversity (3.55%),andProgramAge(2.68%)contributedadditional meaningfulsignals.Theseresultsindicatethattherecency andvolumeofacountry'slaunchactivityarethestrongest indicatorsoffuturespaceprogramexpansion.
LUNARIS was evaluated across its primary interactive modulesonmid-range hardware.Table 3summarizesthe observedperformancemetrics.
Table -3: LUNARIS Platform Performance Metrics
Metric ObservedValue
R²Score(MLModel) 0.9441
MeanAbsoluteError(ML) 0.0062
RMSE(MLModel) 0.0093
AIChatbotAverageLatency 1.5–3.0seconds
3DGlobeRendering 55–60FPS
APIResponseTime <1.0second
International Research Journal of Engineering and Technology (IRJET) e-ISSN: 2395-0056
Volume: 13 Issue: 04 | Apr 2026 www.irjet.net p-ISSN: 2395-0072
Table 4 compares LUNARIS with widely used standalone spacedatatools.LUNARISprovidesamorecomprehensive andintegratedsolutionbycombiningfunctionalitiesthatare otherwiseavailableonlyinisolation.
Table -4: Comparison with Existing Space Data Tools
Feature NASA Eyes HeavensAbove LUNARIS
3DVisualization Yes No Yes
ML-BasedPrediction No No Yes
AIChatbot No No Yes
ExoplanetExplorer No No Yes
CollaborationModule No No Yes
Gamification No No Yes
Real-timeSpaceNews No No Yes
OpenWebAccess Yes Yes Yes
TheR²scoreof0.9441validatestheuseofRandomForest regression for satellite program growth forecasting. The dominance of Momentum Score (43.53%) as the leading feature aligns with the expectation that recent launch frequency is the most reliable signal of a nation's future spaceambitions.Theplatform'sabilitytosustain55–60FPS during3DgloberenderingconfirmsthattheWebGL-based visualizationstackissuitableforbrowser-baseddeployment withoutdedicatedhardware.
A primary limitation is dependence on external APIs; any downtime in NASA or News API affectsthe real-timedata modules. Additionally, the prediction model is trained on country-level aggregate data, which may not capture subnationalorprivateoperatordynamics.Thetrainingdataset of75countriesissufficientforcurrentanalysisbutwillbe expandedastheUCSdatabasegrows.
ThispaperpresentedLUNARIS,anintegratedmulti-modal webplatformthatsynthesizessatellitetracking,AI-driven exploration, machine learning-based predictive analytics, and astronomical data visualization. A Random Forest RegressortrainedontheUCSSatelliteDatabaseachievedan R²scoreof0.9441,demonstratingtheviabilityofensemble machine learning for national space program forecasting. The platform delivers real-time 3D visualization at 55–60 FPSwithaveragechatbotresponsetimesof1.5–3.0seconds, confirmingpracticalperformanceforpublicdeployment.
Future work will focus on three directions. First, the prediction model will be enhanced with deep learning architecturessuchasLSTMnetworkstocapturetemporal trends in launch frequency. Second, the platform will be extendedtosupportamobileapplication,improvingcrossdevice accessibility.Third, real-timetelemetryintegration from live satellite tracking APIs will replace static dataset queries,enablingfullydynamicorbitalvisualization.
An implementation of the platform is available at: https://LUNARIS-kappa.vercel.app/
[1]NASA,"NASAImageandVideoLibraryAPI,"NASAOpen APIs,2024.[Online].Available:https://api.nasa.gov
[2] C. Peat, "Heavens-Above: Satellite Tracking and Astronomical Data," 2024. [Online]. Available: https://www.heavens-above.com
[3] M. Grieves and J. Vickers, "Digital Twin: Mitigating Unpredictable,UndesirableEmergentBehaviorinComplex Systems," Transdisciplinary Perspectives on Complex Systems,Springer,pp.85–113,2017.
[4] T. Belgiu and L. Drăguț, "Random Forest in Remote Sensing: AReview of ApplicationsandFuture Directions," ISPRSJournalofPhotogrammetryandRemoteSensing,vol. 114,pp.24–31,2016.
[5]M.Bostock,V.Ogievetsky,andJ.Heer,"D3:Data-Driven Documents," IEEE Transactions on Visualization and ComputerGraphics,vol.17,no.12,pp.2301–2309,2011.
[6]L.Breiman,"RandomForests,"MachineLearning,vol.45, no.1,pp.5–32,2001.
[7]A.LiawandM.Wiener,"ClassificationandRegressionby randomForest,"RNews,vol.2,no.3,pp.18–22,2002.
[8] P. Lewis et al., "Retrieval-Augmented Generation for Knowledge-IntensiveNLPTasks,"Proc.NeurIPS,vol.33,pp. 9459–9474,2020.
[9]J.Kasnecietal.,"ChatGPTforGood?OnOpportunitiesand Challenges of Large Language Models for Education," Learning and Individual Differences, vol. 103, p. 102274, 2023.
[10] R. Cabello et al., "Three.js: A JavaScript 3D Library," GitHub Repository, 2024. [Online]. Available: https://threejs.org
[11]UnionofConcernedScientists,"UCSSatellite Database,"2024.[Online].Available: https://www.ucsusa.org/resources/satellite-database