International Research Journal of Engineering and Technology (IRJET) e-ISSN: 2395-0056

Volume: 09 Issue: 09 | Sep 2022 www.irjet.net p-ISSN: 2395-0072
International Research Journal of Engineering and Technology (IRJET) e-ISSN: 2395-0056
Volume: 09 Issue: 09 | Sep 2022 www.irjet.net p-ISSN: 2395-0072
1M.Tech Scholar, School of Geo-Informatics, Remote Sensing Applications Centre, Uttar Pradesh, India 2 Scientist-SE, Remote Sensing Applications Centre, Uttar Pradesh, India 3Scientist-SE and Head of School of Geo-Informatics, Remote Sensing Applications Centre, Uttar Pradesh, India ***
Abstract - Sugarcane is a high-value commodity farmed mostly in India during the Rabi season. The constant cloud cover during this season complicates the calculation of sugarcane crop area using space-borne remote sensing. Because of its capacity to gather photos under hazy conditions, microwave remote sensing can assist in resolving the problem. In the current study, temporal Sentinel-1B SAR data were used to distinguish the sugarcane crop from other competing Rabi season crops in the Sitapur area of Uttar Pradesh in 2021. To analyze the geographical distribution of sugarcane crop in the Sitapur area, the random forest classifier achieved an overall accuracy of 87.12 percent with the sugarcane classification accuracy of 86.60 percent.
Key Words: Microwave Remote Sensing; sugarcane crop; acreage estimation; temporal; random forest classifier
Sugarcane is one of India's most significant cash crops, contributing Rs.75, 000 crore to the Budget each year. Advance predictions of sugarcane crop area and production rates are critical since 5 crore farmers and their families rely on this commodity.Finalproductionestimatesbasedoncomprehensiveenumerationofareaandyieldthroughcropcuttingtrialsare availableonlyafterthecropshavebeenharvested.However,thegovernmentrequiresoutputforecastsinadvanceinorderto makenumerouspolicydecisionsonprice,marketing,export/import,distribution,andsoon. Giventhetrueneedforcrop predictions well before the crops are harvested for different policy considerations, a timetable for publishing advance estimateshasbeendeveloped(Anonymous,2014).Cropestimatesaregeneratedandissuedatfourstagesduringtheyear,as listedbelowTheprioradvanceestimatesforboththeKharifandrabiseasonsarefirmedup/validatedusingdatafromtheState AgriculturalStatisticalAuthorities(SASA),remotesensingdata fromtheSpaceApplicationCentreinAhmadabad, andthe CWWGsessions(Anonymous,2008).Whenworkingwithextremelyvariedregionaldistributionsofgrowthcircumstances, estimatingsugarcanebiomassisproblematic.Accurateandup-to-datelandcoverchangedataisrequiredtocomprehendand analyzed the environmental repercussions of such changes (Kumar et al., 2012). The possibility of time-series Sentinel-1 backscatterdataforsugarcanecropmappingisinvestigatedinthiswork.Toassessthebackscatterbehaviourofthesugarcane crop,weanalyzedmulti-temporalC-bandVHpolarizedSentinel-1SARdatatofine-tunethesugarcanemapinSitapurdistrict, UttarPradeshstate.
TheprincipalobjectiveofthisstudyistofindtotalareaintheDistrictundersugarcanecropcultivationusingSARData.
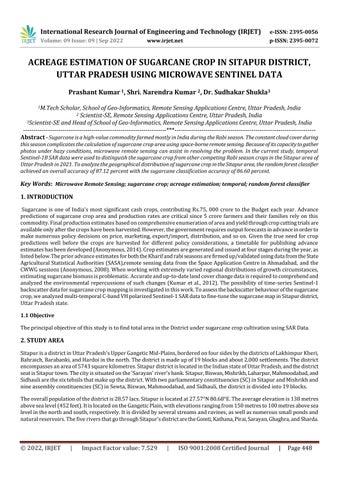
SitapurisadistrictinUttarPradesh'sUpperGangeticMid-Plains,borderedonfoursidesbythedistrictsofLakhimpurKheri, Bahraich,Barabanki,andHardoiinthenorth.Thedistrictismadeupof19blocksandabout2,000settlements.Thedistrict encompassesanareaof5743squarekilometres.SitapurdistrictislocatedintheIndianstateofUttarPradesh,andthedistrict seatisSitapurtown.Thecityissituatedonthe'Sarayan'river'sbank.Sitapur,Biswan,Mishrikh,Laharpur,Mahmoodabad,and Sidhauliarethesixtehsilsthatmakeupthedistrict.Withtwoparliamentaryconstituencies(SC)inSitapurandMishrikhand nineassemblyconstituencies(SC)inSewta,Biswan,Mahmoodabad,andSidhauli,thedistrictisdividedinto19blocks. Theoverallpopulationofthedistrictis28.57lacs.Sitapurislocatedat27.57°N80.68°E.Theaverageelevationis138metres abovesealevel(452feet).ItislocatedontheGangeticPlain,withelevationsrangingfrom150metresto100metresabovesea levelinthenorthandsouth,respectively.Itisdividedbyseveralstreamsandravines,aswellasnumeroussmallpondsand naturalreservoirs.ThefiveriversthatgothroughSitapur'sdistrictaretheGomti,Kathana,Pirai,Sarayan,Ghaghra,andSharda.
International Research Journal of Engineering and Technology (IRJET) e-ISSN: 2395-0056
Volume: 09 Issue: 09 | Sep 2022 www.irjet.net p-ISSN: 2395-0072
TherainyseasonlastsfromJulythroughOctober,withanaverageyearlyrainfallofroughly975mm.Therestoftheyearwill befairlydry.
FIGURE -1: STUDY AREA MAP OF SITAPURDISTRICT 3.
International Research Journal of Engineering and Technology (IRJET) e-ISSN: 2395-0056
Volume: 09 Issue: 09 | Sep 2022 www.irjet.net p-ISSN: 2395-0072
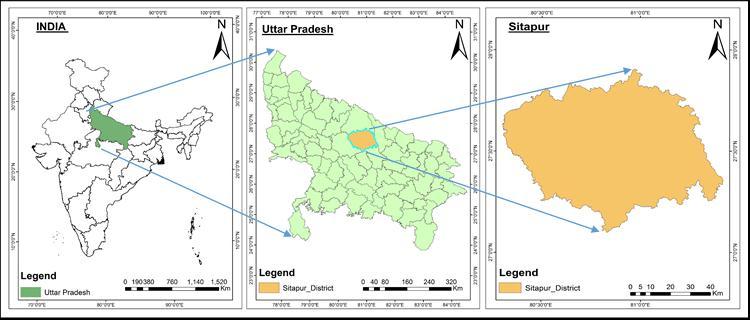
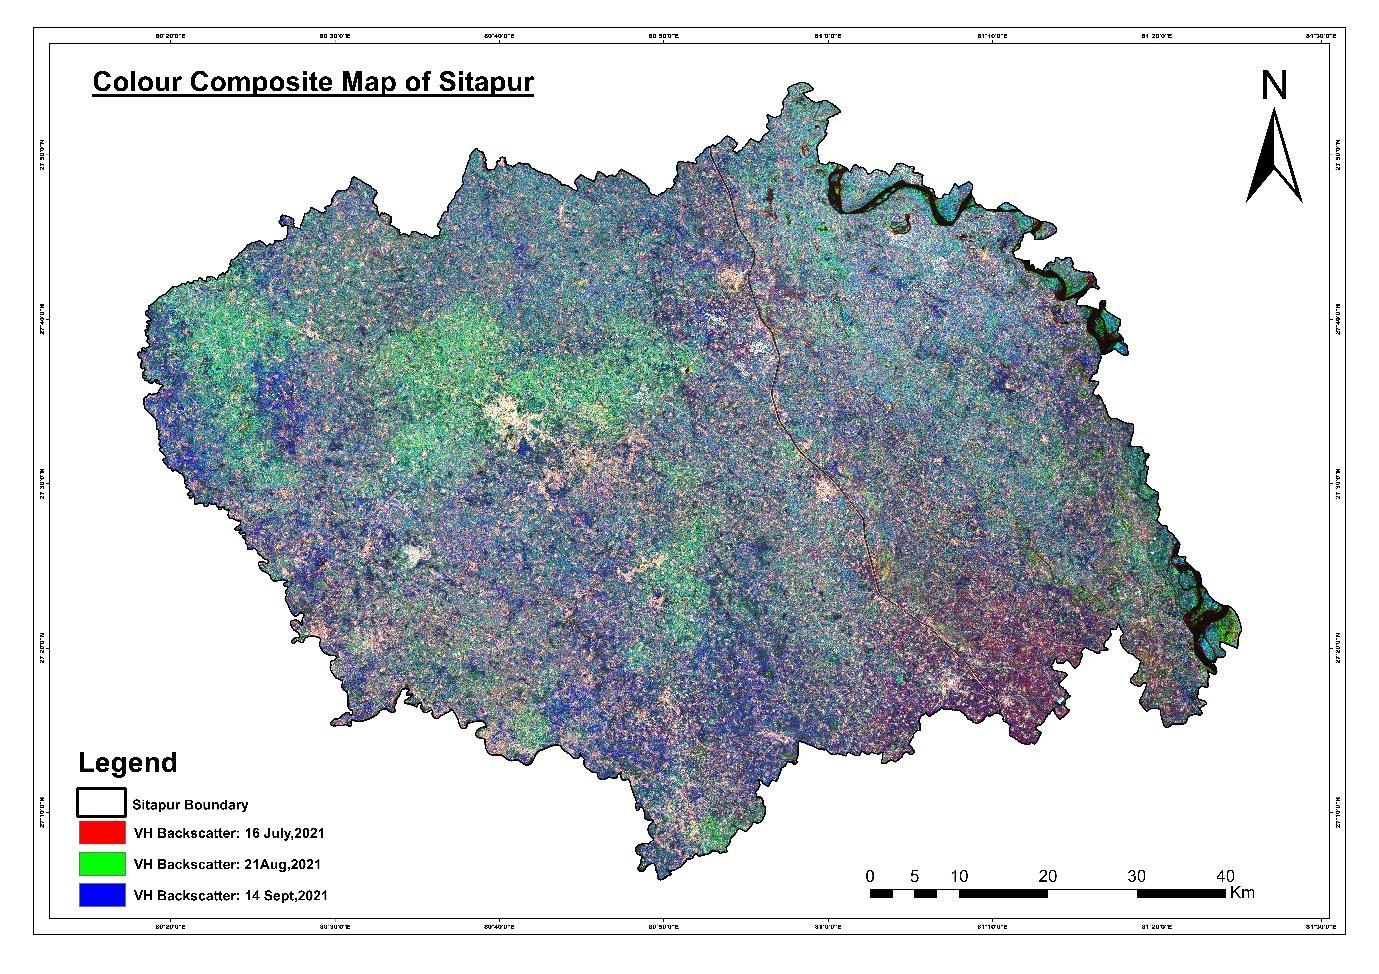
AcreageestimationofSugarcaneCropUsingSentinelSARdatainSitapurDistricthasbeencalculatedusingfollowingsteps. Initially,Sentinel1Aimagesof11April,17May,22June,16July,21August,and14SeptemberweredownloadedfromESA Website.pre-processingofSARdatahasperformedusingSNAPtoolforremovalofspeckleandradiometricandgeometric correction.WehaveusedVHIntensitydataofSARforthesugarcanestudy.
AfterPreProcessing,mosaickingoftheSARDATAconsistingtwofilesforsameareahasbeenachieved.Followingthis,asubset wasgeneratedtogeneratetheareaofinterest(Sitapur)usingthedistrictboundary.Afterthat,thesedataconvertedtodBform usingSNAPToolboxforeachmonth,latergotlayerstackedtomakeitColourCompositeform
As,wehavetocalculatetheacreageestimationmaskingofnon-agriculturelandhasbeendonealongwithgroundtruthof differentcropshasused.RANDOMFORESTclassificationhasbeendonewiththehelpofgroundtruthdatatocalculatethearea underSugarcanecultivationbyassigninggroundtruthandnon-agriculturemaskintheformofvectortoclassificationofimage byclassifiertrainedofvectors.
International Research Journal of Engineering and Technology (IRJET) e-ISSN: 2395-0056 Volume: 09 Issue: 09 | Sep 2022 www.irjet.net p-ISSN: 2395-0072
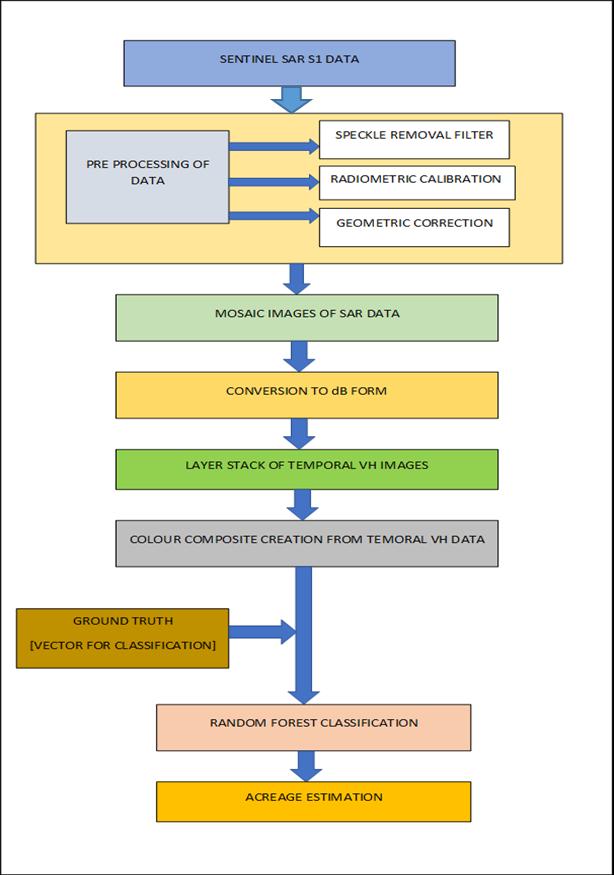
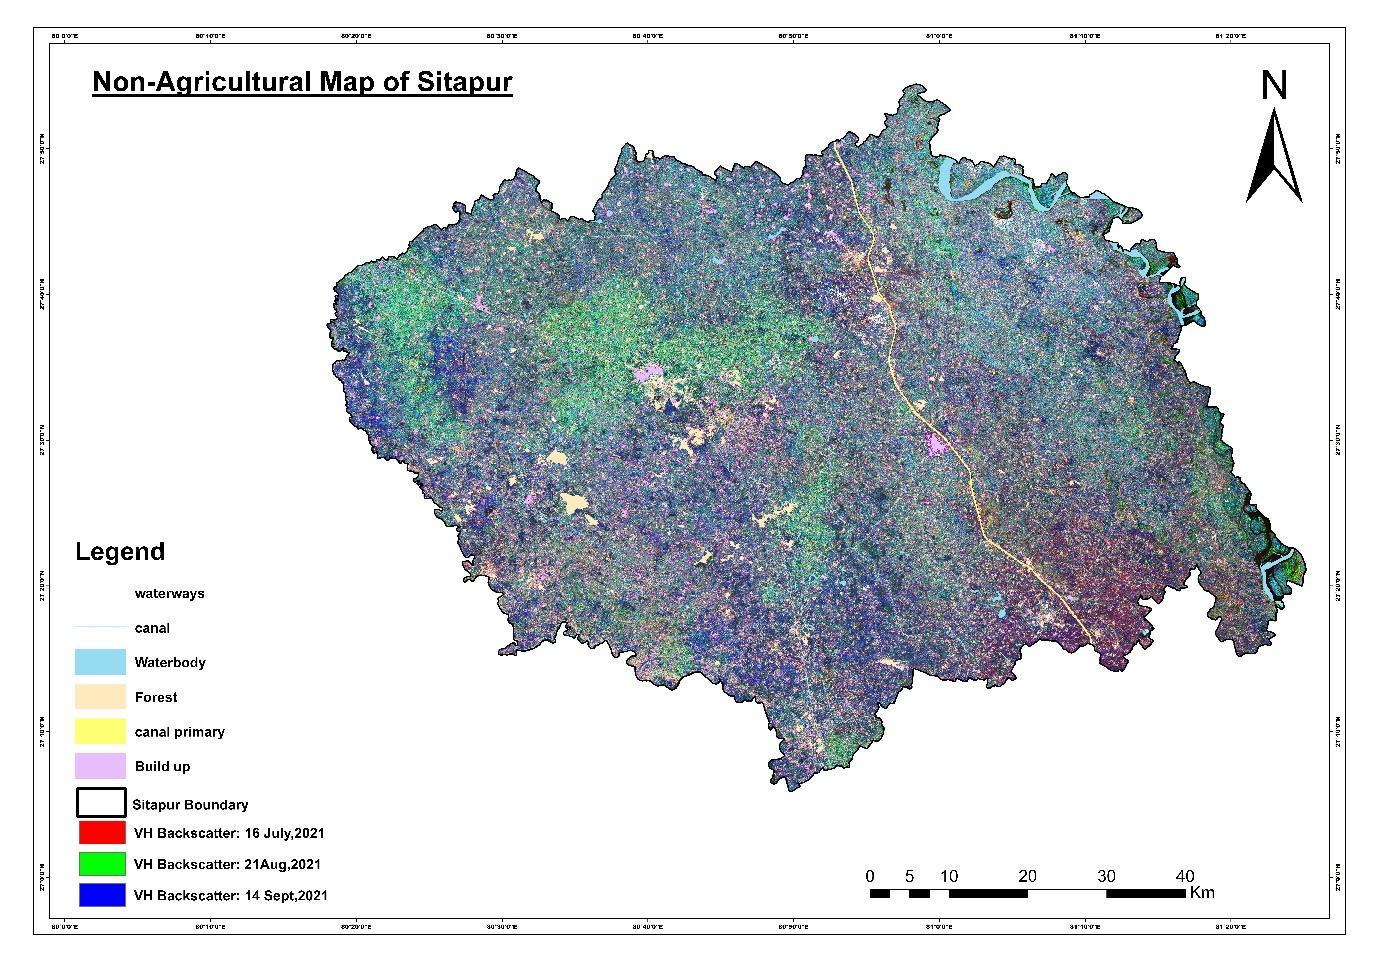
FIGURE -3: SITAPUR DISTRICT, UTTAR PRADESH (STUDY AREA) COLOUR COMPOSITE MAP OF 03-DATES OF VH BACKSCATTER DATA
International Research Journal of Engineering and Technology (IRJET) e-ISSN: 2395-0056
Volume: 09 Issue: 09 | Sep 2022 www.irjet.net p-ISSN: 2395-0072
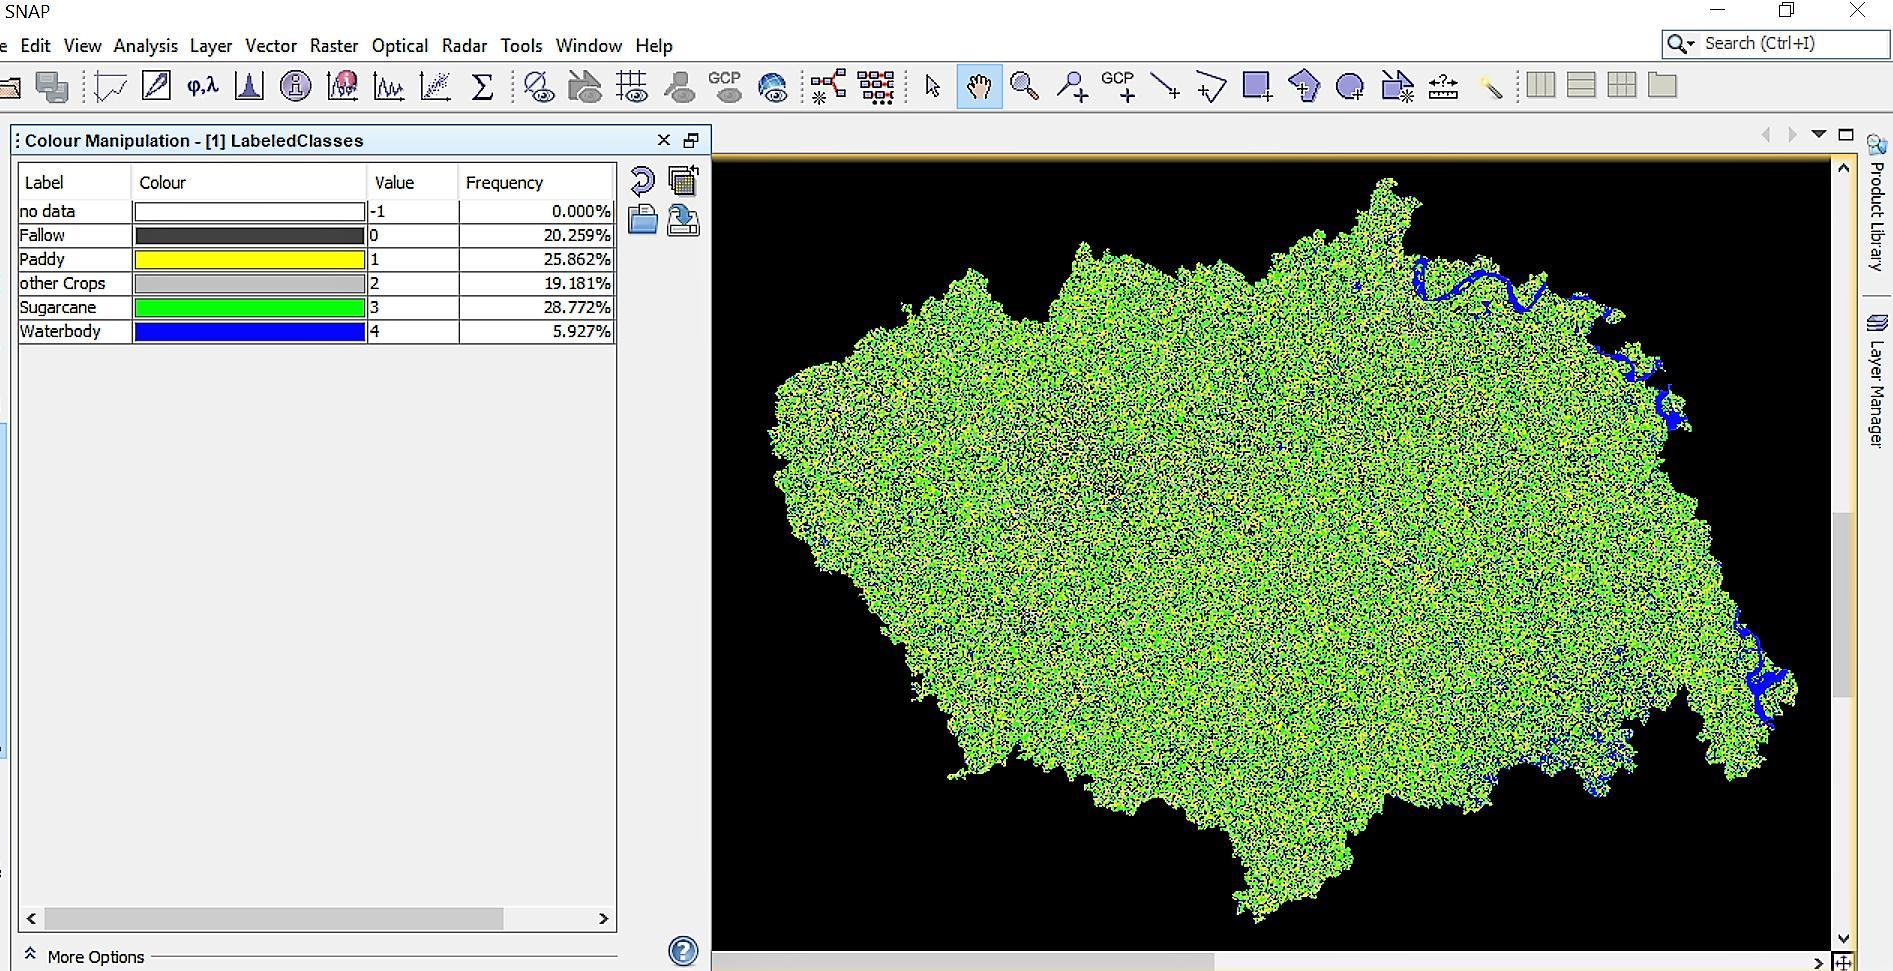
SugarcanecropisidentifiedonthebasisofimageimageclassifiertrainedofvectorsusingRandomforestclassifiermethod wheregreencolorshowstheareaisundersugarcanecultivation.Toassignasamevalueforsugarcanecroplabelingofclasses hasbeenperformed.Areaintheimagehasbeenshownbypercentageoffrequency. Theacquiredgroundtruthdatawas utilizedtotestaccuracy.
% of Sugarcane in sitapur =28.772
Area of sitapur= 5, 73,619 hectare
Area calculated under sugarcane cultivation=1, 65,041.65hectare=1.65 lakh hectare (approx.).
ThepresentstudyexploredthepossibilityoftemporalSARSentinel-1AVHbackscatterforSugarcanecropclassificationin Sitapurdistrict,UttarPradesh.Paddyandothercrophasshownoverlapwithsugarcaneowingtosimilarphenologywhichhas loweredtheclassificationaccuracy.Randomforestclassifierwasexploitedtomapthesugarcanefieldswithaccuracyof86.60 alongwithoverallaccuracyof87.12percent.TheseResultsdemonstratethepossibilityforusingtemporalSentinel-1AVHand RandomforestclassificationtoSugarcanecropmappingframeworkatregionallevel.
[1] B.Barrett,C.Raab,F.Cawkwell,S.Green,(2016).RandomForestswithopticalandradarsatellitedatawereusedto mapuplandvegetation.212-231inProceedingsofthe2ndInternationalConferenceonRemoteSensinginEcology andConservation.
International Research Journal of Engineering and Technology (IRJET) e-ISSN: 2395-0056
Volume: 09 Issue: 09 | Sep 2022 www.irjet.net p-ISSN: 2395-0072
[2] M.Belgiu,L.Drăguţ,(2016).Areviewofapplicationsandfuturedirectionsforrandomforestinremotesensing.114, 24-31,ISPRSJournalofPhotogrammetryandRemoteSensing.
[3] G.Forkuor,C.Conrad,M.Thiel,T.Ullmann,andE.Zoungrana(2014).ImprovingCropMappinginNorthwesternBenin, WestAfrica,byIntegratingOpticalandSyntheticApertureRadarImagery.RemoteSensing,6,6472-6499.
[4] J.Peters,F.V.Coillie,T.Westra,andRobertDeWulf(2011).Forobject-basedolivegrovemapping,acombinationof veryhighresolutionopticalandradardataisused 971-989inInternationalJournalofGeographicalInformation Science,Volume25,Number6.
[5] J.Reiche,(2015).TropicalforestmonitoringusingacombinationofSARandopticalsatelliteimagetimeseries.
2022, IRJET | Impact Factor value: 7.529 | ISO 9001:2008 Certified Journal |