International Research Journal of Engineering and Technology (IRJET) e-ISSN:2395-0056

Volume: 09 Issue: 09 | Sep 2022 www.irjet.net p-ISSN:2395-0072
International Research Journal of Engineering and Technology (IRJET) e-ISSN:2395-0056
Volume: 09 Issue: 09 | Sep 2022 www.irjet.net p-ISSN:2395-0072
1Mustaqueem S. Patwekar, 2P.V.Muley, 3Dr.A.S.Radke
1Post Graduate Student, Datta Meghe College of Engineering, Navi Mumbai, Maharashtra, India 2Professor, Department of Civil Engineering, Datta Meghe College of Engineering, Navi Mumbai, Maharashtra, India
3Professor, Navi Mumbai, Maharashtra, India ***
Abstract - The goal of this study is to examinethe Tuned Liquid Damper (TLD) and Column Tuned Liquid Damper (CTLD),whicharebasedonthemovementofliquidinarigidtanktochangeastructure'sdynamicpropertiesandlessen vibration energy during seismic excitation. A three-storey structure was created for this purpose and put through vibrationtests. TLDandCTLDisinstallattopfloorseparatelyfordifferentfrequencies.ATLDandCTLD,isadevicethat employswaterrestrainedinacontainerthatisusuallyplacedontopofabuildingtolimitthedisplacementofthesystem when it is subjected to excitation. On a scaled model of the structure with TLD and CTLD, several experimental observations are made to assess theiroperationwhen subjected to seismic excitation. Using controlled uniaxial shake tabletesting,arectangular-shapedTLDandCTLDwithvaryingmassratiosareevaluatedovervariousfrequencies.Based on the structure's response reduction, TLD and CTLD effectiveness are assessed. The experiment's sensor, an accelerometer, measures the structure's acceleration in the presence and absence of a TLD and a CTLD while it is subjectedtovibrations.
Key words: Seismicexcitation,tunedliquiddamper,Tunedliquidcolumndamper,Energydissipation,MassRatio.
The demand for taller, lighter, more flexible constructions with relatively low damping values has increased in recent years. All tall and narrow structures, including chimneys, skyscrapers, high-rise buildings, cable structures, telecommunicationtowers,etc.,arecharacterizedbyhavingarelatively lownaturalfrequencyaswellasalowstructural damping.Thiswillincreasethelikelihoodoffailureand,inaddition,causeissueswithserviceability.Asaresult,dynamic stresses such aswind loads andseismic loads. The dynamical response of a Framed structure is a characteristic of structural damping and the magnitude and frequencyof the implementedload. Thus,to reduce the dynamic response of theFramedstructure,onemusteithertoadjusttheloadingorincreasethedamping.[1]
Today there are severaltechniquesavailable for minimizingstructural vibrations, a recentone being theconcept of usingTunedLiquidDamper(TLD).ThisstudywasconductedtoinvestigatetheeffectivenessofusingTLDsandCTLDsto control thevibration ofstructures. It seems to be the most accepted means of increasingdamping in high-risebuildings, chimneys, cables, telecom towers,skyscrapers,etc,by installingTuned Mass Dampers (TMD). However, over thelast 1020years, TunedLiquid Dampers (TLDs)have grown in popularity and are now widelyavailable.Its popularityiseasy to understand given the simplicity of a TLD, whichis essentiallynothing more than a partially filled watertank.Obviously, sucha devicerequiresvery littlemaintenancecomparedto TMD. Thepopularity of TLDsseems to belimited bythe fact thattheirdescriptionismuchmorecomplexthanasimplespring-masssystemlikeaTMD,makingthemdifficulttodesign andjustasimportant,unpredictablefromadesignpointofview.[9]
A TLD (Tuned Liquid Damper) is a passivecontrol device,usually placed onastructure,that dissipates applied excitationenergy through liquidboundary layer friction,waves,and freesurfacecontamination.[6]If the TLCDis perfectly tuned, by controlling the opening ratio, one could easily obtain a satisfactory performance from the TLCD.[2] Todesign an efficient TLD, it is crucial to usean appropriatemodel to illustrate the fluid behavior and to know the optimalTLDparameters.
Fahim Sadek and et al. (1997) Theobjectiveofthisstudywastoworkoutthedesignparametersfortunedliquidcolumn dampers(TLCDs)forseismicapplications.[3]
International Research Journal of Engineering and Technology (IRJET) e-ISSN:2395-0056
Volume: 09 Issue: 09 | Sep 2022 www.irjet.net p-ISSN:2395-0072
S.D.Xue. and et al. (1999) A precise experimental study has been performed to analyze the effectiveness and overall performanceofTunedliquidcolumndamperinsuppressingpitchingvibrationofstructures.[4]
Y. K. Ju and et al. (2004) The characteristics of a TLD with wire screens and little blocks connected to the wall are evaluatedinthisstudy,andanequationisproposedfortheequivalentdampingratiooftheTLD.[5]
Emili and et al. (2013) ThispresentstudytargetedatimplementationofaTLDformitigationofstructuralresponse.[6] Jitaditya Mondal and et al. (2014) They had done the experimental setup models a building using polymer beams and trussesandmakesuseofmoveablebase,poweredbyamotor,tosimulateanearthquake.[7]
Namrata Yannawar and G.R.Patil (2014) Inthisstudy,awatertankwasconstructedtoactasatunedliquiddamper.[8]
Amodel ofa G+3storeyframestructureattachedwith theTLDandCTLDhasbeenconsideredand istobeanalysedto determineoptimalparametersofTLDandCTLDinthestructureforreducingthemaximumdisplacementsofthestructure under harmonic sinusoidal ground motion. The optimal parameters of TLD and CTLD were found out by considering different combinations of the parameters which were verified by carrying out shake table analysis of an actual model attachedwithTLDandCTLD.
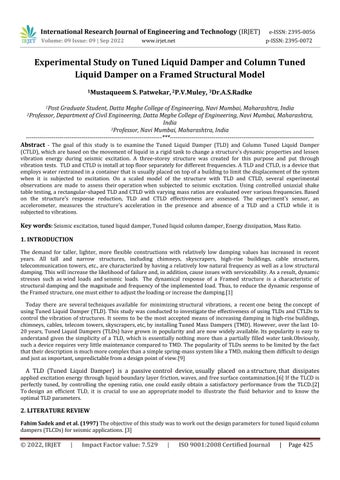
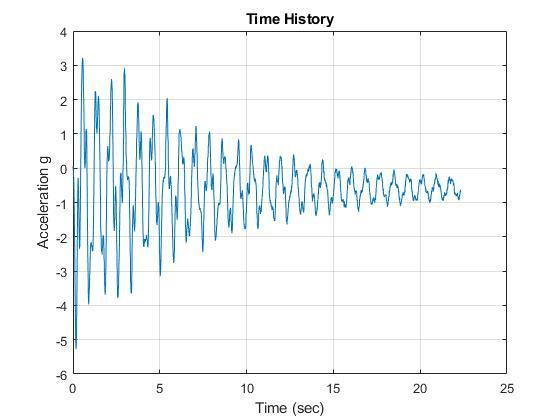
Determine the natural frequency of the framed model with TLD and CTLD attached on top floor center, then do its FFT (FastFourierTransform)to gettheNatural Frequenciesoftheframedstructural model,got the natural frequencyas1.2 Hz,4Hzand6Hz.Damperisattachedtothetopfloorcenterandthenchangethewaterlevelaccordingtomassratio(%). Massratio(%)forTLDistakenas5%,10%,15%,20%,25%,30%,40%,50%,60%,70%,75%and80%.Massratio(%)for CTLDistakenas5%,10%,15%,20%,25%,30%,35%,40%,45%,50%,and55%.ThentheBaseofthestructurei.e.shake tableissetupas:Amplitude=5mm,frequency=1.2Hzandno.ofcycles=15.Andharmonicsinusoidalmotionisapplied. For each Mass ratio, structure's maximum displacement is recorded. Then same procedure is repeated for Damper for Amplitude=5mm,frequency=4Hz,andno.ofcycles=40.
Table-1: FramedModelandDamperDescription
TypeoftheStructure
Multi-storeyrigidjointedplaneframe NumberofStoreys Three,(G+3)
Material PlywoodandAluminium SlabDescriptions Plywood(Dimensions:Length=360mm,Width=260mm,Thickness=12mm,Density=8.458 KN/m3)
ColumnDescriptions Aluminum(Dimensions:Width=19mm,Thickness=2mm,FloortoFloorHeight=400mm)
Weight 3500gm
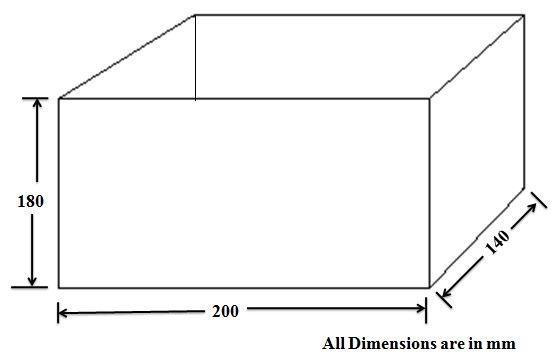
TUNEDLIQUIDDAMPER(TLD)DESCRIPTION
Material Acrylic DamperDescriptions (InteriorDimensions:Length=200mm,Width=140mm,Height=180mm,Thicknessofacrylic sheet=3mm)
Weight 846gm
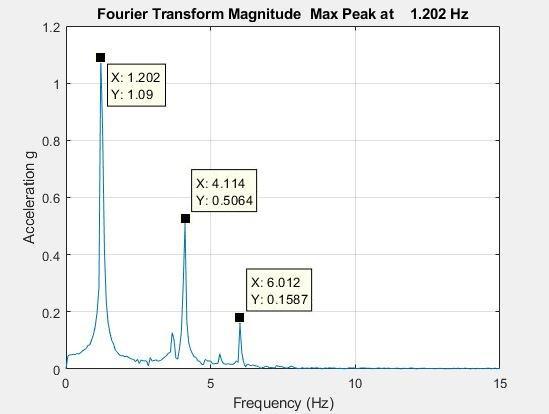
COLUMNTUNEDLIQUIDDAMPER(CTLD)DESCRIPTION
Material Acrylic DamperDescriptions (InteriorDimensions:Length=200mm,Width=14mm,HeightofBottomChannel=40mm,total Height=18mm,WidthofVerticalColumn=40mmEach,Thicknessofacrylicsheet=3mm)
Weight 775gm
International Research Journal of Engineering and Technology (IRJET) e-ISSN:2395-0056
Volume: 09 Issue: 09 | Sep 2022 www.irjet.net p-ISSN:2395-0072
International Research Journal of Engineering and Technology (IRJET) e-ISSN:2395-0056
Volume: 09 Issue: 09 | Sep 2022 www.irjet.net p-ISSN:2395-0072
8 40 64 11.97 72.37 9 50 80 12.17 71.91 10 60 96 11.18 74.19 11 70 112 9.704 77.6 12 75 120 8.637 80.06 13 80 128 9.867 77.22
Top displacement when TLD is placed at Top (3rd) Floor for 1.2 Hz Frequency
Ym ax (m m ) Mr(%)
0 10 20 30 40 50 0 10 20 30 40 50 60 70 80 90
Chart -1:MaximumDisplacementforVaryingMassRatiowhenTLDat1.2HzFrequency
8.2 Maximum Displacement when TLD at 4 Hz Frequency
Table-3:MaximumDisplacementforVaryingMassRatiowhenTLDat4HzFrequency Sr. No. Mr (%) Hs (mm)
When TLD is at TOP Floor Ymax (mm) η (%) 1 0 0 15.15 0 2 5 8 14.19 6.34 3 10 16 14.5 4.29 4 15 24 12.98 14.32 5 20 32 12.51 17.43 6 25 40 11.93 21.25 7 30 48 11.65 23.1 8 40 64 11.43 24.55 9 50 80 11.92 21.32 10 60 96 12.47 17.69 11 70 112 12.59 16.9 12 75 120 12.73 15.97 13 80 128 12.31 18.74
International Research Journal of Engineering and Technology (IRJET) e-ISSN:2395-0056
Volume: 09 Issue: 09 | Sep 2022 www.irjet.net p-ISSN:2395-0072
Ymax (mm) Mr(%)
0 5 10 15 20 0 10 20 30 40 50 60 70 80 90
Chart -2:MaximumDisplacementforVaryingMassRatiowhenTLDat4HzFrequency
8.3 Maximum Displacement when CTLD at 1.2 Hz Frequency
Table-4:MaximumDisplacementforVaryingMassRatiowhenCTLDat1.2HzFrequency
Sr. No. Mr (%) Hs (mm)
When CTLD is at TOP Floor Ymax (mm) η (%) 1 0 0 35.14 0 2 5 7.5 27.51 21.71 3 10 15 18.32 47.87 4 15 22.5 15.11 57.0 5 20 30 12.82 63.52 6 25 37.5 13.63 61.21 7 30 52.5 13.25 62.29 8 35 71.25 12.26 65.11 9 40 90 12.35 64.85 10 45 108.75 10.52 70.06 11 50 127.5 10.62 69.78 12 55 146.25 11.09 68.44
Top displacement when CTLD is placed at Top (3rd) Floor for 1.2 Hz frequency
30
20
2nd Floor Displacement when TLD is placed at Top (3rd) Floor for 4 Hz frequency 0
40 0 10 20 30 40 50 60
Ymax (mm) Mr(%)
10
Chart -3:MaximumDisplacementforVaryingMassRatiowhenCTLDat1.2HzFrequency
International Research Journal of Engineering and Technology (IRJET) e-ISSN:2395-0056
Volume: 09 Issue: 09 | Sep 2022 www.irjet.net p-ISSN:2395-0072
8.4 Maximum Displacement when CTLD at 4 Hz Frequency
Table-5:MaximumDisplacementforVaryingMassRatiowhenCTLDat4HzFrequency
Sr. No. Mr (%) Hs (mm)
When CTLD is at TOP Floor Ymax (mm) η (%) 1 0 0 15.18 0 2 5 7.5 14.47 4.68 3 10 15 13.84 8.83 4 15 22.5 12.9 15.02 5 20 30 12.48 17.79 6 25 37.5 12.39 18.38 7 30 52.5 11.54 23.98 8 35 71.25 12.38 18.45 9 40 90 12.83 15.48 10 45 108.75 12.93 14.82 11 50 127.5 13.55 10.74 12 55 146.25 13.53 10.87
2nd Floor Displacement when CTLD is placed at Top (3rd) Floor for 4 Hz frequency
0 5 10 15 20 0 10 20 30 40 50 60
Ymax (mm) Mr(%)
Chart -4:MaximumDisplacementforVaryingMassRatiowhenCTLDat4HzFrequency
8.9 Comparison Between TLD and CTLD on Top Floor for 1.2 Hz Frequency
Table-6: ComparisonBetweenTLDandCTLDonTopFloorfor1.2HzFrequency Sr. No. Mr (%) Displacement when TLD is at Top Floor (mm) Displacement when CTLD is at Top Floor (mm) 1 0 43.32 35.14 2 5 28.69 27.51 3 10 16.38 18.32 4 15 14.34 15.11 5 20 14.33 12.82 6 25 14.24 13.63
International Research Journal of Engineering and Technology (IRJET) e-ISSN:2395-0056
Volume: 09 Issue: 09 | Sep 2022 www.irjet.net p-ISSN:2395-0072
12.35 9 50 12.17 10.62
TLD & CTLD 1.2 Hz
Ym ax (m m )
0 10 20 30 40 50 0 20 40 60
Top Displacement when TLD is placed at top(3rd) Floor
Mr(%)
Chart -5:ComparisonBetweenTLDandCTLDonTopFloorfor1.2HzFrequency
8.10 Comparison Between TLD and CTLD on Top Floor for 4 Hz Frequency Table-7: ComparisonBetweenTLDandCTLDonTopFloorfor4HzFrequency Sr. No. Mr (%) Displacement when TLD is at Top Floor (mm) Displacement when CTLD is at Top Floor (mm) 1 0 15.15 15.18 2 5 14.19 14.47 3 10 14.5 13.84 4 15 12.98 12.9 5 20 12.51 12.48 6 25 11.93 12.39 7 30 11.65 11.54 8 40 11.43 12.83 9 50 11.92 13.55
TLD & CTLD 4 Hz
15
10
Ym ax (m m ) Mr(%)
20 0 20 40 60
Top Displacement when TLD is placed at top(3rd) Floor
5
Top Displacement when CTLD is placed at top(3rd) Floor
Top Displacement when CTLD is placed at top(3rd) Floor 0
Chart -6:ComparisonBetweenTLDandCTLDonTopFloorfor4HzFrequency
International Research Journal of Engineering and Technology (IRJET) e-ISSN:2395-0056
Volume: 09 Issue: 09 | Sep 2022 www.irjet.net p-ISSN:2395-0072
1)ExperimentalanalysisshowedthatTLDsandCTLDscaneffectivelyreduceastructure'sresponsetoearthquakes.
2)Ithasbeenfoundthatfor1.2HzfrequencytheeffectofTLDincreaseswithanincreaseinmassratio.Themassratiofor theTLD designhas beenfoundto beoptimal whenit isaround 15%after thatthe decrease in displacement is very less. TheefficiencyofTLDisfoundtobearound67%for15%MassRatio.
3)For4HzfrequencythedisplacementisalreadyverylesssothereisnotmuchconsiderabledifferenceofTLDwhenmass ratioisincreased.
4)Ithasbeenfoundthatfor1.2Hzfrequencytheeffectof CTLDincreaseswithanincreaseinmassratio.Themassratio fortheCTLDdesign hasbeenfound to be optimal when itisaround 15%afterthat thedecrease in displacementisvery less.TheefficiencyofCTLDisfoundtobearound57%for15%MassRatio.
5) On comparing the displacement values of TLD and CTLD for optimal position i.e top center it has been found CTLD is actingslightlybetterinreducingthevibrationexcitationthanTLD.
[1]Elrahman,Abd&Elbrolosy,Abdo.(2015).Tunedliquiddampers.
[2] T. Balendra, C.M. Wang, H.F. Cheong, Effectiveness of tuned liquid column dampers for vibration control of towers, EngineeringStructures,Volume17,Issue9,1995,Pages668-675,ISSN0141-0296
[3] Fahim Sadek, Bijan Mohraz, and H. S. Lew(1997): SINGLE- AND MULTIPLE-TUNED LIQUID COLUMN DAMPERS FOR SEISMIC APPLICATIONS. https://onlinelibrary.wiley.com/doi/10.1002/(SICI)1096-9845(199805)27:5%3C439::AIDEQE730%3E3.0.CO;2-8.
[4]AU -S.D.Xue,AU -J.M.Ko,AU -Y.L.Xu,TI -ExperimentalStudyonPerformanceofTunedLiquidColumnDamperin SuppressingPitchingVibrationofStructures.PT -JournalArticle,DP -1999,TA -JournalofIntelligentMaterialSystems andStructures.
[5] Yoon, Sung-Won & Kim, S. & Ju, Young K.. (2004). Experimental evaluation of a tuned liquid damper system. Proceedings of The Institution of Civil Engineers-structures and Buildings - PROC INST CIVIL ENG-STRUCT B. 157. 251262.10.1680/stbu.2004.157.4.251.
[6] Bhattacharjee, Emili & Halder, Lipika & Sharma, Richi. (2013). An experimental study on tuned liquid damper for mitigation of structural response. International Journal of Advanced Structural Engineering (IJASE). 5. 10.1186/20086695-5-3
[7] Mondal, Jitaditya & Harsha Nimmala, & Shameel Abdulla,& Tafreshi, Reza. (2014). Active Tuned Mass Damper. 11921197.10.1109/MED.2015.7158917.
[8] Namrata Yannawar, G.R.Patil (2014). Response Behaviour of a Three Storied Framed Structure with Tuned Liquid Damper. Vol. 3, Issue 7, July 2014. ISSN: 2319-8753. https://citeseerx.ist.psu.edu/viewdoc/download?doi=10.1.1.1045.6477&rep=rep1&type=pdf.
[9]Krabbenhøft,Jørgen.“ShallowWaterTunedLiquidDampers:Modeling,simulationandexperiments.”(2011).