International Research Journal of Engineering and Technology (IRJET) e-ISSN: 2395-0056

Volume: 09 Issue: 09 | Sep 2022 www.irjet.net p-ISSN: 2395-0072
International Research Journal of Engineering and Technology (IRJET) e-ISSN: 2395-0056
Volume: 09 Issue: 09 | Sep 2022 www.irjet.net p-ISSN: 2395-0072
1 M.Tech. (Structural Engineering) Student, Civil Engineering Department, G.N.D.E.C. Ludhiana, Punjab.
2 Assistant Professor, Civil Engineering Department, G.N.D.E.C. Ludhiana, Punjab.
3 Assistant Professor, Civil Engineering Department, G.N.D.E.C. Ludhiana, Punjab. ***
Abstract - One of the most widely used methods for analyzing the environmental impacts of the production and use of concrete, as well as the components derived from it, is the carbon footprint, which describes the value of carbon dioxide and other greenhouse gases affiliated with this product, demonstrated as CO2 equivalents. Using a life cycle analysis methodological approach, the carbon footprint was used inthis work Concrete made with GGBFS, brokenceramic tiles, and copper slag. Carbon dioxide equivalent emissions decreased, as expected, as the use of GGBFS, broken ceramic tiles, and copper slag increased. This study presents an effort to evaluate the economic and environmental performance of concrete with GGBFS, broken ceramic tiles, copper slag replacement withandwithout. First,theessentialmechanical properties (compressivestrengthandsplit tensilestrength)of concrete mixes incorporating different amounts of GGBFS (30%replacement ofbinder),brokenceramictiles(10%,15%, and 20% replacement of coarse aggregate), and copper slag were evaluated (40%, 50%, 60% replacement of fine aggregate). The mechanical properties of the concrete were then tested to determine its strength. Finally, the carbon emissions of each mix were calculated using the LCA. Compressive and split tensile testing results revealed that concretes with varying percentages of replacement can outperformconventionalplainconcrete.Theanalysisrevealed that the proposed concrete has significant environmental benefits. In comparison to other ratios and conventional concrete, the50%copperslagand10%ceramicratioprovides maximumstrengthwhileemittingtheleastamountofcarbon.
Key Words: GGBFS,BrokenCeramicTiles,CopperSlag. Abbreviations: GGBFS = Ground Granulated Blast Furnace Slag, ECF = Embodied Carbon Factor.
Concrete, a most widely used building substance in the world,necessitatesasignificantamountofenergy,especially whenrawmaterialsareused.Furthermore,thewidespread useofOPChasresultedinsignificantCO2emissionsintothe atmosphere.OnetonneofOPCrequiresapproximately2.5 tonnesofmaterialsandproducesapproximatelyonetonne ofCO2.OPCproductiongeneratesapproximately135crore tonsofCO2peryear,causingaround5-7%oftheworld'sCO2 emissions. As a result, it is suggested that a material substituteforthecementbedevelopedinordertoreduce CO2 emissions.
Fordecreasingthecarbondioxidefromenvironmentwhich is produce from concrete production and Several studies investigated the possibility of substituting OPC with SCMderivedfromindustrialby-products,suchasGGBFSand naturalcoarseaggregatesreplacingwithalternativematerial usedinthisprojectarecopperslag,wasteceramictilesand calculating the carbon footprint after replacing these materials GGBFS is a cement by-product of steel blast furnacesthatisfrequentlyusedinconcretework.
Copperslagisproducedasaby-productduringthecopper manufacturingprocess.
Ceramictileshavingaslopingedgeratherthansquaredone andarethin,flattiles.Thesetilesareusedfora variety of applications,includingliningandcovering,andtheyaidin thermalprotection.Ceramictilescomeinavarietyofshapes, sizes,andcolours
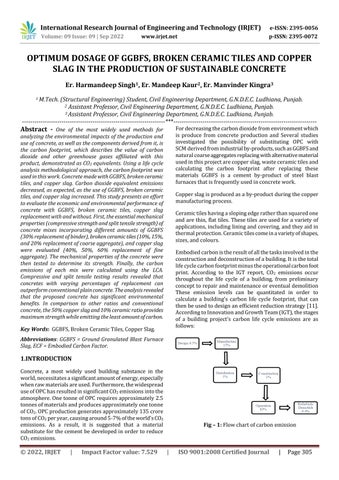
Embodiedcarbonistheresultofallthetasksinvolvedinthe constructionanddeconstructionofabuilding.Itisthetotal lifecyclecarbonfootprintminustheoperationalcarbonfoot print According to the IGT report, CO2 emissions occur throughout the life cycle of a building, from preliminary concepttorepairandmaintenanceoreventualdemolition These emission levels can be quantitated in order to calculate a building's carbon life cycle footprint, that can thenbeusedtodesignanefficientreductionstrategy[11]. AccordingtoInnovationandGrowthTeam(IGT),thestages of a building project's carbon life cycle emissions are as follows:
Fig – 1: Flowchartofcarbonemission
International Research Journal of Engineering and Technology (IRJET) e-ISSN: 2395-0056
Volume: 09 Issue: 09 | Sep 2022 www.irjet.net p-ISSN: 2395-0072
The present work attention at the study of following objectives:1. TodeterminetheoptimumdosageofGGBFS,broken ceramic tiles and copper slag to attain maximum strengthproperties.
2. To determine the carbon footprint of optimum dosageofconcrete. 3. Tocomparetheenvironmentimpactofmodifiedand conventionalconcrete.
Inthissection,aframeworkisprovidedfortheexperimental investigation.Thisincludedapracticesystem,whichhadthe materialsused,testingmethods,andotherproceduresused tocarryouttheresearch.Withdifferentmaterialratios,the current work determined the engineering properties of concrete such as split tensile response, compression, and carbon footprint. More information and data about M25 grademixconcretedesign,materials,andtestingprocedures aredescribed
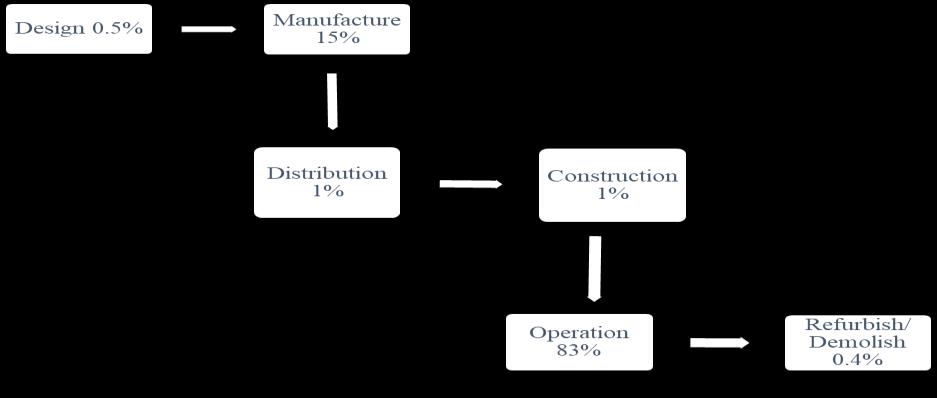
An electrically drum operated mixer was used to mix the concrete. Water was sprayed inside the drum to provide moisture.Themixerwasfirstfilledwithcoarsesediments andbrokenceramictilesthanitwasrotatedtoensurethat the components were mixed evenly. After that, sand and copperslagwerecompletelymixedintothemixture.Togeta uniformdrymix,thedrymixwasrotated for 2-3minutes after adding cement and GGBFS. To obtain a workable concrete,theneededamountofwaterwasaddedtothedry mix and the mixture was thoroughly rotated to get a workableconcrete.

The required number of specimens for various tests were cast. For M25 grade concrete, 6 specimens (three in each sample) of conventional concrete and modified concrete werecasttoconductcompressivestrengthandsplittensile tests(consistingofcopperslag,GGBFS,andbrokenceramic tiles).Similarly,samecastedspecimenswillbeevaluatedfor carbonfootprint.
International Research Journal of Engineering and Technology (IRJET) e-ISSN: 2395-0056
Volume: 09 Issue: 09 | Sep 2022 www.irjet.net p-ISSN: 2395-0072
After24hoursofcastingthespecimensweretakenoutfrom themoldsandplacedinacuringtankforthenext28days. Because cement requires water for complete hydration, curingwasdoneusingtapwater.
L=Lengthofthecylinder(mm)
d=diameterofthecylinder(mm)
3.2 Methodology to Calculate Embodied Carbon of materials
Step-1. LCAwasusedtoestablishedtheamountofcarbon emissionsperunitofgivenmaterial.
Embodiedcarbonofconcreteblocks=Quantityof concreteblocks*Embodiedcarbonconversionsfactorsof concretesinoneblock.

LifecyclemodulesA1toA5
A1=Rawmaterialsupply
A2=Transport
A3=Manufacturing
Afterpropercuring,thespecimenswereremovedfromthe water and dried in a laboratory at room temperature. Followingproperdrying,acompressiontestwasperformed onaCompressionTestingMachine.
The Compressive strength of the test specimen was calculatedfromtheequation
=P/A
Here,P=Peakload(N)
A=Areaofthecube(mm)
Similarlyforsplittensile,afterpropercuring,thespecimen was removed from the water and dried in a laboratory at roomtemperature.Followingproperdrying,asplittensile test was performed on a Compression Testing Machine (CTM).
Thesplittensilestrengthofthetestspecimenwascalculated fromtheequation
A4=Transport
A5=Constructioninstallationprocess
A1toA3carbonfactorECFA13
Table -3: Suggested Embodied carbon factor (ECF3) of common construction materials
S. N o.
Mate rial Type Specifications / Details A1- A3 ECF kg CO2e/k g
Unreinforced,C30/37,UK average ready mixed concrete EPD (35% cementreplacement)
0.013
1. Concr ete
In situ piling, substructu re, superstruc ture
Unreinforced, C32/40, (25% GGBFS cement replacement) 0.120
Unreinforced, C32/40 (50% GGBFS cement replacement) 0.089
2. Steel
Reinforce ments
Rebars
Structural sections
UK: -UK cares sectors averageEPD 0.76
World Wide: - World steels 1.99
hollowsections:-TATA EPD 2.50
Here,T=Splittensilestrength(N/mm2)

P=Peakload(N)
3. Stone
Granite
Granite 0.70 Limestone Limestone 0.09
2022, IRJET | Impact Factor value: 7.529 | ISO 9001:2008 Certified Journal
International Research Journal of Engineering and Technology (IRJET) e-ISSN: 2395-0056
Volume: 09 Issue: 09 | Sep 2022 www.irjet.net p-ISSN: 2395-0072
s Sandstone Sandstone 0.06
-4:
4. Timb er, carbo n seque strati on
Manufactu red Structural Timber
CLT100%,FSC/PEFC 0.437 Glulam, 100% FSC/PEFC 0.512 StudWork / Framing Flooring
Mode
TEF mode (g Co2e /kg/km)
Soft wood 100% FSC/PEFC 0.263 Form work
Ply wood 100% FSC/PEFC 0.681
5. Alumi nium Sheet Europeanconsumption 6.58
InthissectionA4isconcernedwithtransportofmaterialsor productsfromthefactorygatetotheconstructionsite,and thetransportofconstructionequipment(cranes,scaffolding, etc.) and from the site. Remember that some journeys comprisemultiplelegsoverdifferenttransportmodes.We needtoincludethewholejourneyinourcalculations.Reuse of components, materials or products that are locally sourced and transported over short distances will help to reducebothModuleA4andoverallprojectemissions.
Roademission,average 0.10650 Roademission,full 0.07524 Seaemission 0.01614 Flightemission 0.59943 Railemission 0.02556
Table -5:
A4 transport km by road km by sea
Locallymanufactured 50Nationallymanufactured 300Europeanmanufactured 1500Globallymanufactured 200 10000
Thecarbonfactors fortransportationofeachmaterialare calculatedbymultiplyingthetransportationdistancesbythe respectivetransportationmodesemissionsfactors.
ECFA4,i=∑mode(TDmode*TEFmode)
TDmode=TransportDistance
TEFmode=Transportmodeemissionfactor
Transportationembodiedcarbonfactors(ECFA4,i)foreach materialwillnotbeknownuntiltheprojectiscompletedand thematerialtransportationmodesanddistanceshavebeen recorded. In the absence of precise information, the informationthatfollowscanbeusedtoestimateECFA4,i.
Transport emissionsfactors (TEF)canbe estimated using transportemissions
Step-3ConstructionInstallationEmission
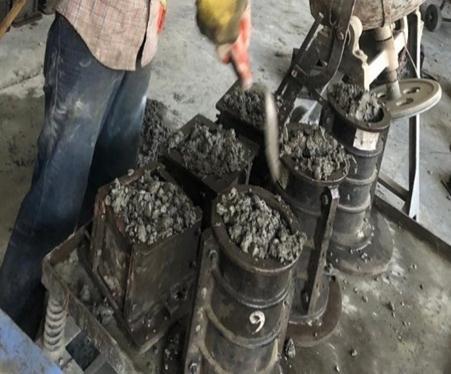
Fig – 5: LifeCycleStages
Fig – 6: Construction Installation Emission
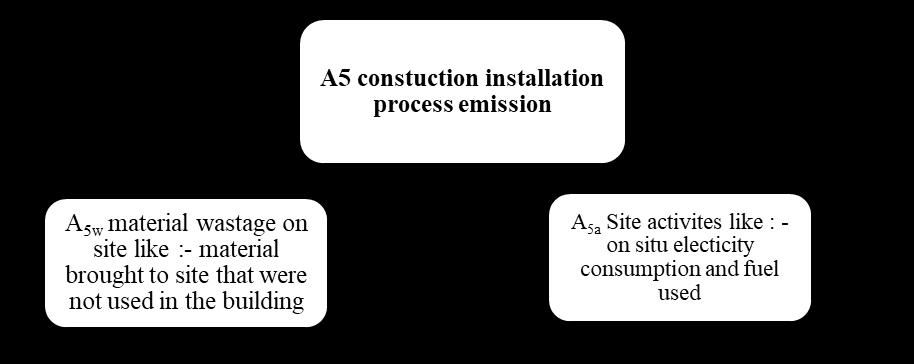
International Research Journal of Engineering and Technology (IRJET) e-ISSN: 2395-0056 Volume: 09 Issue: 09 | Sep 2022 www.irjet.net p-ISSN: 2395-0072
A5W=Lifecycleemissionsofmaterialwasted ECFA5w,i=WFi*(EFCA13,i+ECFA4,i+ECFc2,i +ECFc34,i)
ECFA4,i=embodiedcarbonfactorfortransport(moduleA4)of thematerial(kgCO2e/kg)
= TDtransportdistance(inkm)
TEFtransportemissionfactorin(gCO2e/km)
ECFA5w,i=WF*(ECFA13,i+ECFA4,i+ECFC2,i)
WF=wastefactor
V=volumeofmaterialandWR=wasteratioasestimatethe wrapUKnetwastetool
ECF2,I=Transportfromsite(calculateECFMi)
Table -8: ECF of Material Used in Modified Concrete
Materials
ECF kgCO2e/kg.
OPCCement 0.820 GGBFS 0.143 CopperSlag 0.007 Brokenceramictiles 0.237 Coarseaggregates 0.046 Fineaggregates 0.014 Water 0.540
The results obtained from different tests of distinct specimens are reported and discussed. All test results are displayedfollowedbyadiscussion.
– A3 for the material(kgCO2e/kg)
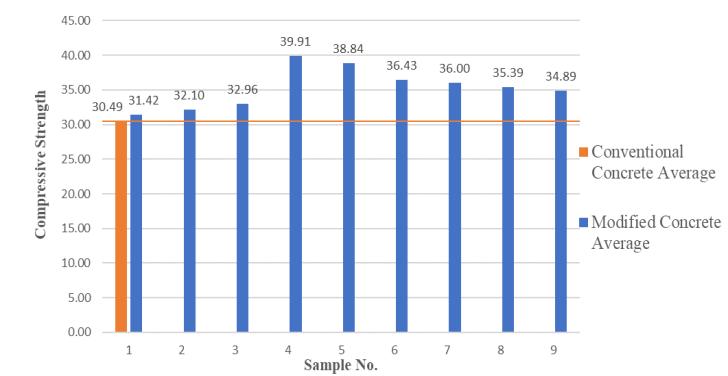
Graph – 1: ComparisonofCompressiveStrengthbetween ConventionalConcreteandModifiedConcrete
When fine aggregate was replaced with copper slag up to 50% and coarse aggregate were replaced with broken
International Research Journal of Engineering and Technology (IRJET) e-ISSN: 2395-0056
Volume: 09 Issue: 09 | Sep 2022 www.irjet.net p-ISSN: 2395-0072
ceramic tiles up to 10%, compressive strength of the modifiedconcreteismaximumwhencomparedtoallother specimens.After50%copperand10%ceramic,atthispoint when further increased in replacement of percentage the reduction of compressive strength was seen. As per test result, the maximum strength obtained due to better interactiontransitionzonewithcombinationofcopperslag, broken ceramic tiles, GGBFS and cement, which was performinghigherascomparetonaturalaggregates.
1. With the inclusion of copper slag and broken ceramic tiles,incrementofsplittensilestrengthofconcretewas seen.
2. Themaximumsplittensilestrengthwasobtainedwhen 50%offineaggregateswassubstitutedwithcopperslag and 10% of coarse aggregates was substituted with brokenceramictiles.
3. The highest split tensile strength was approximately 9.92% greater, when compared to the conventional concrete.Thisincreaseintensilestrengthisattributed to the better interlocking between ceramic particles withcementandGGBFSmixture.
Thehugedifferencewasseenbetweentheperformanceof conventionalandmodifiedconcrete.Themodifiedconcrete producedlowcarbonemissionascomparetoconventional concrete. This happens due to the reuse of waste and byproductmaterial(GGBFS,brokenceramictilesandcopper slag). As the percentage of the broken ceramic tiles were increased,theamountofcarbonemissionwasincreasedand usage of copper slag in concrete decreases the carbon emission. This happened because of the various activities involved in the usage process of broken ceramic tiles as coarseaggregates.Activities liketransportationof broken ceramic tiles to the site, where these are to be used, disintegration process of tiles to the required size of aggregates,increasesthecarbonemission.
Based on the experimental results, the following specific conclusionsaredrawnforthecurrentwork:
1. It is determined that 50% copper slag and 10% ceramic tiles ratio of modified concrete gives the optimumstrengthincompressionandsplittensile both.
2. Itisconcludedthat increasingthe ratioofcopper slaginthemodifiedconcretemixturesreducesCO2 emissions,statingthattheuseofthismaterialhas animpactonthereductionofthecarbonfootprint intheconcreteproductionprocess.
3. After comparing the modified concrete with conventional concrete, it is concluded that the modified concrete is more environment friendly because carbon emission is less as compare to conventional.
Graph – 2: ComparisonofSplitTensileStrengthbetween ConventionalConcreteandModifiedConcrete


1. A. Gholampour, J. Zheng, and T. Ozbakkaloglu, “Development of waste-based concretes containing foundry sand, recycled fine aggregate, ground granulatedblastfurnaceslagandflyash,” Construction and Building Materials, vol. 267, Jan. 2021, doi: 10.1016/j.conbuildmat.2020.121004.
2. M. Mohammed, D. S. Asaad, and A. I. Al-Hadithi, “Experimentalandstatisticalevaluationofrheological propertiesofself-compactingconcretecontainingfly ashandgroundgranulatedblastfurnaceslag,” Journal of King Saud University - Engineering Sciences, 2021, doi:10.1016/j.jksues.2020.12.005.
Graph – 3: ComparisonofEmbodiedCarbon(kgCo2e) betweenConventionalConcreteandModifiedConcrete
3. J.Miller,M.Herson,andD.Program,“CarbonFootprint MeasurementandAnalysisofaMulti-ModalLogistics Network Signature redacted Signature redacted Signature redacted Signature redacted Signature redacted,”2007.
International Research Journal of Engineering and Technology (IRJET) e-ISSN: 2395-0056
4. Al-mohannadiandDhabia,“ASYSTEMATICAPPROACH TOCARBONFOOTPRINTREDUCTIONSTRATEGIESIN INDUSTRIALPARKS,”2014.
5. Ali,L.A.Qureshi,andS.U.Khan,“Flexuralbehaviorof glassfiber-reinforcedrecycledaggregateconcreteand itsimpactonthecostandcarbonfootprintofconcrete pavement,” Construction and Building Materials, vol. 262, Nov. 2020, doi: 10.1016/j.conbuildmat.2020.120820.
6. “Concrete Made With Waste Materials - A Review,” Journal of Environmental Nanotechnology,vol.2,no.2, pp. 102–106, Jun. 2013, doi: 10.13074/jent.2013.06.132022.
7. de Wolf, F. Pomponi, and A. Moncaster, “Measuring embodied carbon dioxide equivalent of buildings: A review and critique of current industry practice,” Energy and Buildings, vol. 140, pp. 68–80, Apr. 2017, doi:10.1016/j.enbuild.2017.01.075.
8. F.Collins,“Inclusionofcarbonationduringthelifecycle of built and recycled concrete: Influence on their carbon footprint,” International Journal of Life Cycle Assessment,vol.15,no.6,pp.549–556,Jul.2010,doi: 10.1007/s11367-010-0191-4.
9. “General Information British Precast Concrete FederationPrecastHollowcoreflooring.”
10. H.W.Kua,“Theconsequencesofsubstitutingsandwith usedcopperslaginconstruction:Anembodiedenergy andglobalwarmingpotentialanalysisusinglifecycle approach and different allocation methods kua life cycleassessmentofcopperslag,” Journal of Industrial Ecology, vol. 17, no. 6, pp. 869–879, 2013, doi: 10.1111/jiec.12059.
11. InstitutionofStructuralEngineers(GreatBritain), How to calculate embodied carbon.
12. VikasSrivastava1,RakeshKumar2,andP.K.Mehta2, “ConcreteMadeWithWasteMaterials-AReview,”vol. 2, no. 2, pp. 102–106, Jun. 2013, doi: 10.13074/jent.2013.06.132022.
13. “ISO 14044 Environmental management-Life cycle assessment-RequirementsandguidelinesManagement environnemental-Analyseducycledevie-Exigenceset lignesdirectrices,”2006.
14. J. Bommisetty, T. S. Keertan, A. Ravitheja, and K. Mahendra, “Effect of waste ceramic tiles as a partial replacement of aggregates in concrete,” in Materials Today: Proceedings, 2019, vol. 19, pp. 875–877. doi: 10.1016/j.matpr.2019.08.230.
15. J. Xiao, C. Wang, T. Ding, and A. Akbarnezhad, “A recycled aggregate concrete high-rise building: 2 structural performance and embodied carbon footprint.”
16. L.F.Jiménez,J.A.Domínguez,andR.E.Vega-Azamar, “Carbon footprint of recycled aggregate concrete,” Advances in Civil Engineering, vol. 2018, 2018, doi: 10.1155/2018/7949741.
17. L. K. Turner and F. G. Collins, “Carbon dioxide equivalent(CO2-e)emissions:Acomparisonbetween geopolymer and OPC cement concrete,” Construction and Building Materials,vol.43,pp.125–130,2013,doi: 10.1016/j.conbuildmat.2013.01.023.
18. “Life Cycle Assessment Best Practices of ISO 14040 Series Ministry of Commerce, Industry and Energy RepublicofKoreaAsia-PacificEconomicCooperation CommitteeonTradeandInvestment,”2004.
19. M.N.T.Lam,D.T.Nguyen,andD.L.Nguyen,“Potential use of clay brick waste powder and ceramic waste aggregate in mortar,” Construction and Building Materials, vol. 313, Dec. 2021, doi: 10.1016/j.conbuildmat.2021.125516.
20. M. Kuittinen, “What are the CO 2 in humanitarian constructionCarbonmitigatethem?emissionsandhow to.”[Online].Available:www.aalto.fiwww.aalto.fi
21. M. S. Shaikh, P. H. Shaikh, K. Qureshi, and I. Bhatti, “Green House Effect and Carbon Foot Print,” in Encyclopedia of Renewable and Sustainable Materials, Elsevier,2018,pp.120–125.doi:10.1016/b978-0-12803581-8.10456-4.
22. M. M. Tahmasebi, S. Banihashemi, and M. S. Hassanabadi,“Assessmentofthevariationimpactsof windowonenergyconsumptionandcarbonfootprint,” in Procedia Engineering,2011,vol.21,pp.820–828.doi: 10.1016/j.proeng.2011.11.2083.
23. O.Mahmoodi,H.Siad,M.Lachemi,S.Dadsetan,andM. Sahmaran,“Developmentofoptimizedbinaryceramic tileandconcretewastesgeopolymerbindersforin-situ applications,” Journal of Building Engineering,vol.43, Nov.2021,doi:10.1016/j.jobe.2021.102906.
24. P. Riyakad and S. Chiarakorn, “Energy Consumption andGreenhouseGasEmissionfromCeramicTableware Production: A Case Study in Lampang, Thailand,” in Energy Procedia, Nov. 2015, vol. 79, pp. 98–102. doi: 10.1016/j.egypro.2015.11.483.
25. R. K. Goyal, V. Agarwal, R. Gupta, K. Rathore, and P. Somani,“Optimumutilizationofceramictilewastefor enhancing concrete properties,” in Materials Today:
Volume: 09 Issue: 09 | Sep 2022 www.irjet.net p-ISSN: 2395-0072 © 2022, IRJET | Impact Factor value: 7.529 | ISO 9001:2008 Certified Journal | Page311
International Research Journal of Engineering and Technology (IRJET) e-ISSN: 2395-0056
Proceedings, 2021, vol. 49, pp. 1769–1775. doi: 10.1016/j.matpr.2021.08.011.
26. S.M.RasoulAbdarEsfahani,S.A.Zareei,M.Madhkhan, F. Ameri, J. Rashidiani, and R. A. Taheri, “Mechanical and gamma-ray shielding properties and environmental benefits of concrete incorporating GGBFS and copper slag,” Journal of Building Engineering, vol. 33, Jan. 2021, doi: 10.1016/j.jobe.2020.101615.
27. Sean.Lockie,Piotr.Berebecki,andRoyalInstitutionof Chartered Surveyors., Methodology to calculate embodied carbon of materials.
28. S.-C. Yang, S. J. Skerlos, C. D. Scott, and L. Y. Srinivas, “Knowledge-based Methods for Integrating Carbon Footprint Prediction Techniques into New Product DesignsandEngineeringChanges.”
29. S. Jonzon Sofie and T. Lundin André, “A method for calculating the carbon footprint at Volvo Logistics Corporation.”
30. W. ten Kuo, H. Y. Wang, and C. Y. Shu, “Engineering properties of cementless concrete produced from GGBFSandrecycleddesulfurizationslag,” Construction and Building Materials,vol.63,pp.189–196,Jul.2014, doi:10.1016/j.conbuildmat.2014.04.017.
31. W.K.Biswas,“Carbonfootprintandembodiedenergy consumption assessment of building construction works in Western Australia,” International Journal of Sustainable Built Environment, vol. 3, no. 2, pp. 179–186,2014,doi:10.1016/j.ijsbe.2014.11.004.
32. X. Dai, S. Aydın, M. Y. Yardımcı, K. Lesage, and G. de Schutter,“EffectsofactivatorpropertiesandGGBFS/FA ratioonthestructuralbuild-upandrheologyofAAC,” Cement andConcreteResearch,vol.138,Dec.2020,doi: 10.1016/j.cemconres.2020.106253.
33. Y.Hu,Z.Tang,W.Li,Y.Li,andV.W.Y.Tam,“Physicalmechanical properties of fly ash/GGBFS geopolymer compositeswithrecycledaggregates,” Constructionand Building Materials, vol. 226, pp. 139–151, Nov. 2019, doi:10.1016/j.conbuildmat.2019.07.211.
34. Z. Zhang et al., “Embodied carbon emissions in the supply chains of multinational enterprises.” 2020. Nature Climate Change, 10,1096-1101.
Volume: 09 Issue: 09 | Sep 2022 www.irjet.net p-ISSN: 2395-0072 © 2022, IRJET | Impact Factor value: 7.529 | ISO 9001:2008 Certified Journal | Page312