International Research Journal of Engineering and Technology (IRJET) e-ISSN: 2395-0056
Volume: 09 Issue: 09 | Sep 2022 www.irjet.net p-ISSN: 2395-0072
International Research Journal of Engineering and Technology (IRJET) e-ISSN: 2395-0056
Volume: 09 Issue: 09 | Sep 2022 www.irjet.net p-ISSN: 2395-0072
1Indian Institute of Geomagnetism. New Panvel (W), Navi Mumbai 410218, India 2Dr. KSK Geomagnetic Research Laboratory, IIG, Prayagraj 221505, India ***
Abstract - A very low frequency electromagnetic (VLFEM) survey was conducted at Tural and Rajawadi hot springs in Ratnagiri district, western Maharashtra, to map the lateral extent of subsurface geo-features. A total of four traverses have been taken at both these hot springs from West to East direction. Each traverse was 80-100 m long and separated by 10 m lateral distance. The intermeasurement spacing for each traverse was maintained at 2 m. Two transmitters with frequencies of 19.6 kHz (Anthorn, UK) and 22.3 kHz (NW Cape, Australia) were used. The data were processed to obtain tilt angle and ellipticity along with Fraser filtered data of real component, and current density value to identify conductive zones. The interpretation reveals three broad conductivity features at Rajawadi (Traverse-1, Traverse-2) and Tural (Traverse -3) at shallow depth levels of 12, 16, and 12.5 m respectively. The conductivity features are observed in the pseudo current density depth sections of Traverse-2 and Traverse-3. These high conductivity features can be inferred as fracture zones extending beyond 16 m depth, which feeds the hot spring.
Key Words: Very Low Frequency (VLF), Geothermal spring, Tilt angle, Ellipticity, Maharashtra
The energy crisis has indisputably demonstrated that there is an urgent need to rapidly develop all possibly conceivable, renewable, alternative natural resources to meet the ever-increasing global and domestic demands of energyformultipurposeapplications.Onesuchrenewable source of energy is geothermal energy. Hot springs have gainedprominenceasaviablealternativetohydrocarbons (Islami and Irianti, 2019). The heat source is usually a shallow magmatic body, which might arise from mantle plume activity, active tectonics, or the existence of radiogenic sources (Baranwal and Sharma, 2006). Explorationofgeothermalsystemsisnecessaryinorderto use geothermal resources for the benefit of civilization. Thesteam,water,orheatfromsuchgeothermalreservoirs can be used to generate electricity and for other commercial applications. Furthermore, toxic materials may combine with groundwater in the area of such reservoirs,therebycontaminatinggroundwaterduetothe
hot water's higher solubility than regular groundwater, resulting in a variety of ailments in human beings as a resultofcontaminatedgroundwater(Kunduetal.,2002).
Geothermal springs have been explored using several geophysical methods by numerous researchers (Henkel andGuzman,1977;BernardandValla,1991;Bensonetal., 1997; Cagler and Demirorer, 1999; El Qady, 2000; Routh et al., 2006) all over the globe. Such studies have been conducted in India by many researchers to quantify the thermalcharacteristicsofdifferentgeologicalprovincesin India and to evaluate their suitability for geothermal exploration(Panda,1985;Arora,1986;RaviShankaretal., 1991; Gupta, 1993; Majumdar et al., 2000, Baranwal and Sharma, 2006; Harinarayana et al., 2006; Sircar et al., 2015;Maitraetal.,2020;SubbaRaoetal.,2022)
Geophysical exploration methods in general, and geoelectrical and electromagnetic methods in particular, playavitalroleintheinvestigationofsubsurfacebecause itisnon-destructive,hasno environmental impact,isfast, and is relatively cheap (Telford et al., 1977). They are effective in determining the geothermal springs' characteristicsbyidentifyinghighconductivitydisparities betweenhotspringsandsurroundinghostrocks.InIndia, a total of seven major geothermal provinces have been identified, viz. Himalayan geothermal province, Sohana geothermal province, Cambay geothermal province, West Coastgeothermalprovince,Son-Narmada-Tapti(SONATA) geothermal province, Godavari geothermal province, and Mahanadi geothermal province (Chandrasekharam and Chandrasekhar, 2010). Over sixty geothermal springs are reported on the west coast of Maharashtra spread over a 350 km linear stretch in NNW-SSE orientation with temperatures varying between 47 to 72ºC (Reddy et al., 2013). These are located in the basaltic terrain belonging to the Deccan traps of Cretaceous to Paleocene age with lowtointermediateenthalpyatshallowdepths(Padhiand Pitale,1995;Deshpande,1998).
Geological, geophysical, and geochemical studies have been carried outover a few hotspringsinthe WestCoast province of Maharashtra to understand the structural characteristics and source geometry and to assess water quality, geothermal characters, and utility for direct uses
2022, IRJET | Impact Factor value: 7.529 | ISO 9001:2008 Certified Journal | Page221

International Research Journal of Engineering and Technology (IRJET) e-ISSN: 2395-0056
Volume: 09 Issue: 09 | Sep 2022 www.irjet.net p-ISSN: 2395-0072
(Pitale et al., 1987; Sarolkar, 2005; Gupta et al., 2010; Kumar et al., 2011; Reddy et al., 2013; Gurav et al., 2016; Chatterjee et al., 2016; Monterio et al., 2019; Low et al., 2020). Geoelectrical studies in and around the Aravali, Tural, Rajawadi, and Unhavare geothermal springs of the West Coast province of Maharashtra were directed towards delineation of the geothermal reservoirs and associated geological features like faults and fractures responsible for vertical movement of geothermal water (Kumar, et al., 2011). These authors have delineated potential geothermal reservoirs at some locations and advocated their association with a fault extending to deeper depths. Vertical electrical sounding studies (Gupta etal.,2010)delineatedafewgroundwaterpotentialzones with normal temperature for exploration purposes to meet the local water supply-demand and also observed very low resistivity values of about 10 Ω-m linked to geothermal reservoirs at Aravali and Tural. Geochemical studies (Sarolkar, 2005; Reddy et al, 2013) revealed that thethermalwaterfrommostoftheWestCoasthotsprings isalkalichloridetypewithhighsulphatecontent.Further, the stable isotope analysis implies that the geothermal water is predominantly of meteoric origin (Sarolkar, 2005). Major and trace element analyses of thermal springs from 15 locations along with groundwater and surface water samples (Gurav et al., 2016) revealed the variations in the trace element concentration in the thermal waters indicating involvement of different rock types although all the thermal emergences are within the Deccanvolcanicflows.
With the foregoing understanding, an attempt is made heretomaptheshallowsub-surfacefeaturesatTuraland Rajawadi hot springs using the very low frequency (VLFEM) method, as it is capable of delineating fractures in a lateraldirectioneffectively.
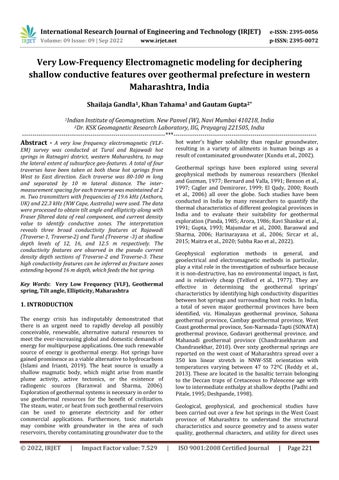
Asmentionedearlier,thetemperatureofhotspringsonthe West Coast varies from 42°C at Rajapur in Sindhudurg district, to 71°C at Unhavre (Khed) in Ratnagiri district. Other major hot springs in this region are Sativli, Ganeshpuri, Aravali, Tural, Rajawadi, and Unhavre. It is also reported that some of these springs emanate gaseous activity.TuralandRajawadihotspringsareconsideredfor the present study (Fig. 1a,b). These hot springs are bounded by 17.25° to 17.26° N latitude and 73.55° to 73.56° E longitude, located about 10-18 km north of Sangameshwar.ThehotspringsarealignedalonganN20° W - S 20° E fracture zone/mega lineament (Fig. 1a). This region is also seismically active with small to medium earthquakes with magnitude ranging from 3.5 to 6.0 occurringfrequently(Chadha,1992).
Fig -1a:Generalizedmapshowingthelineamentsandhot springs.
ThehotspringsaregeologicallysettledinDeccanVolcanic Province (DVP) and expose about 1 km thick basaltic sequence of lava flows overlying Precambrian sedimentary and meta-sedimentary (Kaladgi and Dharwar) rocks and Archaean igneous complex. The Dharwar and Kaladgi formations lying below the basaltic formations are of both ‘Aa’ and Pahoehoe type flows (Deshpande, 1998). The southern part of Ratnagiri and Sindhudurg districts are characterized by the ‘Aa’ type flows whereas the Pahoehoe type flow is confined to the northern part of the Thane district. While some flows are non-porphyritic, the primary flows are porphyritic and contain feldspar phenocrysts (Deshpande, 1998). Several NNE-SSW, NNW-SSE, and EW-oriented lineaments traverse this region. It is reported by CGWB (2014) that the discharge rate is Tural 250 lpm, whereas at Rajawadi thedischargerateisabout50lpm.
International Research Journal of Engineering and Technology (IRJET) e-ISSN: 2395-0056
Volume: 09 Issue: 09 | Sep 2022 www.irjet.net p-ISSN: 2395-0072
Thetiltangleisaratiooftherealcomponentofthevertical secondary magnetic field to the horizontal primary magneticfield.Theellipticityistheratioofthequadrature component of the vertical secondary magnetic field to the horizontal primary field (Paterson and Ronka, 1971). The secondaryfieldhastilt(in-phase)asarealcomponentand ellipticity (quadrature) as an imaginary component. The percentages of the real and imaginary components can be deduced using the following equations (Karous and Hjelt, 1983;OgilvyandLee,1991);
Realor(in-phase)component=tan��*100% (3) Imaginaryor(Quadrature)component= *100% (4)
The VLF data can be efficiently interpreted by applying a filtering technique that will remove biased noise and enhancethesignal-to-noiseratio.Thetwonumericalfilters proposed by Fraser (1969), and Karous and Hjelt (1983) areappliedtothepresentVLFfielddata.
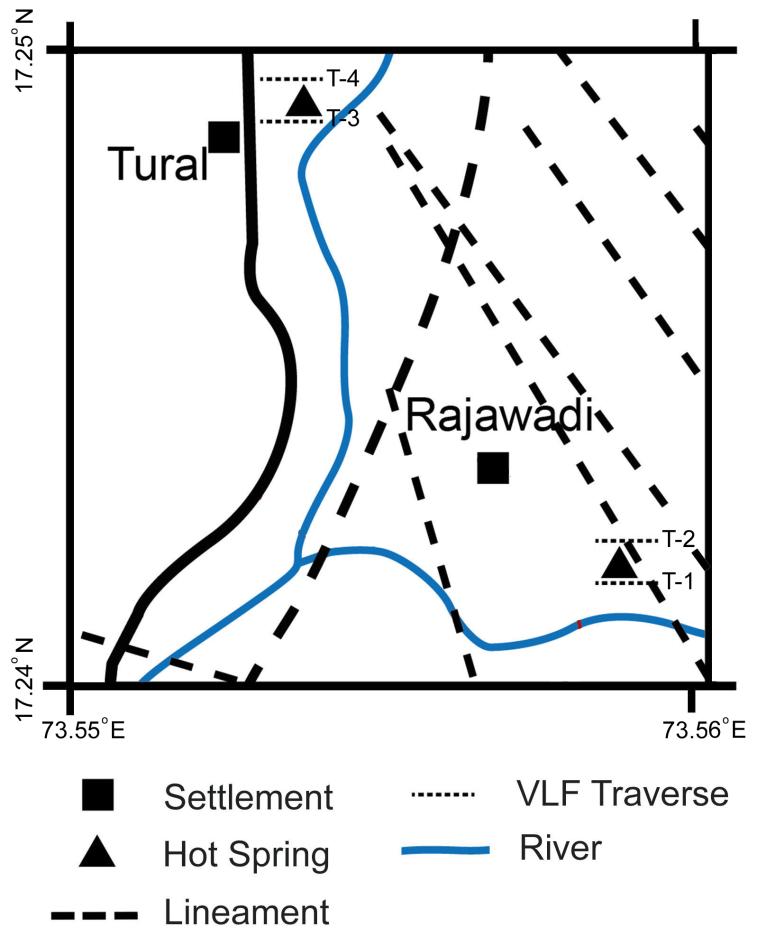
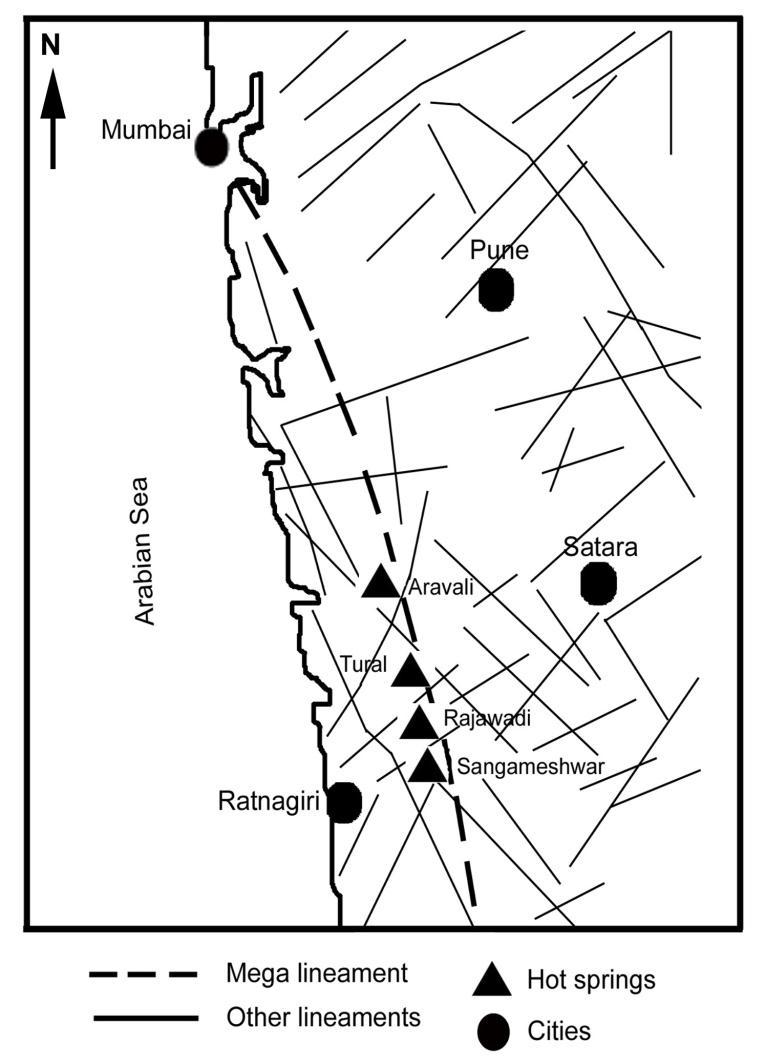
Fig -1a:StudyareaaroundhotspringsshowingtheVLF traverses
Thevery-low-frequencyelectromagneticmethod(VLF-EM) isoneofthewidelyusedgeophysicalmethodsformapping shallowsubsurfaceconductivityvariations.Itutilizesradio signalsasasourcethatistransmittedfrompowerfulradio transmitters located in different parts of the world. The horizontal primary magnetic field induces secondary magnetic fields which are generated by the eddy currents inthepresenceofaconductivebody(Parasnis,1973).The resultant magnetic field which is produced with the interaction of this primary and secondary magnetic field makesanellipseofpolarizationaroundaconductivebody. The resultant measured parameters from the VLF survey are the tilt angle and ellipticity computed using the expressiongivenbySmithandWard(1974),
Tiltangle: tan(2��)= ⁄ ⁄ (1)
Ellipticity: (2)
where Hz and Hx are the amplitudes of the vertical and horizontal components of the magnetic fields: ΔØ = Øx - Øz inwhichØz isthephaseofHzandØx isthephaseofHx.
The temporal variations in the magnetic field (e.g., due tochangesinthewaveguidedbythesurfaceandbottomof theionosphere),affecttheVLFdata,whichcanberemoved by the Fraser filtering. It is performed by converting the cross-over points of real and imaginary anomalies into peakvalues.TheFraserfiltertransformstheanomalysuch that those parts with the maximum slope appear with the maximumamplitude(Nabighian,1982).Theexpressionfor the filter operation is made by differencing the successive valuesofin-phasedataalongthetraverseandisgivenby;
F2,3=[(M3+M4)-(M1+M2)] (5)
WhereM1,M2,M3, andM4 arefourconsecutivereadingsof themeasuredrawdataandF2,3 istheresultantfiltervalue plottedmidwaybetweentheM2 andM3 (Fraser,1969).
KarousandHjelt(1983)isanextensionoftheFraserfilter and it is applied to VLF in-phase data. The K-H filter converts the in-phase values into pseudo depth sections which could delineate the subsurface conductive features. The following equation is given for calculating the K-H filter,
Ia(Δ��/2)=(–0.102H-3+0.059H-2 –0.561H-1 +0.561H1 –0.059H2+0.102H3) (6)
WhereΔZistheassumedthicknessofthecurrentsheet,Ia is the anomalous current density, Δx is the distance betweenthedata pointsandalsothedepthtothecurrent
International Research Journal of Engineering and Technology (IRJET) e-ISSN: 2395-0056
Volume: 09 Issue: 09 | Sep 2022 www.irjet.net p-ISSN: 2395-0072
sheet, the coefficients H-3 to H+3 are the values of real and imaginarycomponentsofthemeasuredVLF-EManomaly.
The IRIS (France) make T-VLF instrument is specially designed for high productivity surveys in groundwater and mining exploration. It is light-weight, its ease of use, its automatic measuring process, its high sensitivity, its datapresentation,anditssolid-statememorymakeT-VLF afieldsurveyinstrumentidealforthesearchofconductive or resistive structures located at a few tens of meters depth. No orientation of the operator with respect to the direction of the transmitter is required since three magnetic sensors measure the components of the VLF field.
The VLF survey has been performed along four traverses at two geothermal springs (Tural and Rajawadi) with frequencies of 19.6 kHz and 23 kHz. The VLF surveying was accomplished in VLF-EM mode or tilt mode and the measuredparametersarethetiltangleandellipticity.The VLF transmitter should always be in the strike direction and the measuring profile should be perpendicular to strike direction (Sharma and Baranwal, 2005). If the measuring profile is parallel to the strike direction, then there will be no VLF anomaly. The traverse T1 is located south of the Rajawadi hot spring with W-E orientation, while,thetraverseT2liesinthenorthernpartofRajawadi hotspringwithW-Ealignment(Fig.1b).Thetwotraverses areseparatedby10mwith2mstationspacing. Similarly, in the vicinity of the Tural hot spring, traverse T3 is performed to the south and T4 to the north of the hot springwith10mtraverseseparationand2minterstation spacinginW-Edirectionrespectively(Fig.1b)
The VLF traverse (T-1) at Rajawadi hot spring has a spreadlengthof80mandisorientedintheW-Edirection (Fig. 1b). The tilt angle values range between -87 to 64 while the ellipticity values range between -64 to 19 siemens. The Frazer filtered values range between -74 to 158siemens.Theoriginaldataoftiltangle(redcolor),and ellipticity (blue color) were plotted along with the Fraser filtered tiltvalues(grey color)and itis depictedinFigure (2a). The Karous- Hjelt pseudo depth section for this traverse is shown in Figure (2b). From Figure (2a) it can be seen that positive values of tilt, ellipticity, and Fraser are observed at the horizontal distance of 15 m. It is suggested by Jeng et al. (2004) that there exists a direct relation between ellipticity and tilt. In Fig. (2a), the ellipticity shows a positive polarity with tilt angle, which indicates poor conductive subsurface. This feature can be seen in the corresponding depth section (Fig. 2b) up to
about 4 m. A strong peak for Fraser value (both positive andnegative)isobservedatahorizontaldistanceof30-44 m,representativeoftheconductivefeature.Thisfeatureis extending from shallow up to a depth of 12 m (Fig. 2b). Similarly, a prominent high peak value of Fraser is observedatahorizontaldistanceof60to70mindicating a conductive zone. These two conductive features are seemingly joined as one unit at depth of about 8 m extendinguptothedepthofstudy.Thisbroadconductive zone is likely to extend deeper and is the signature of the Rajawadi thermal spring. However, a small patch of high resistivity is observed in between this broad conductive zoneatahorizontaldistanceof44to56m(Fig.2b),which maybethesignatureofoverburdenedsediments.
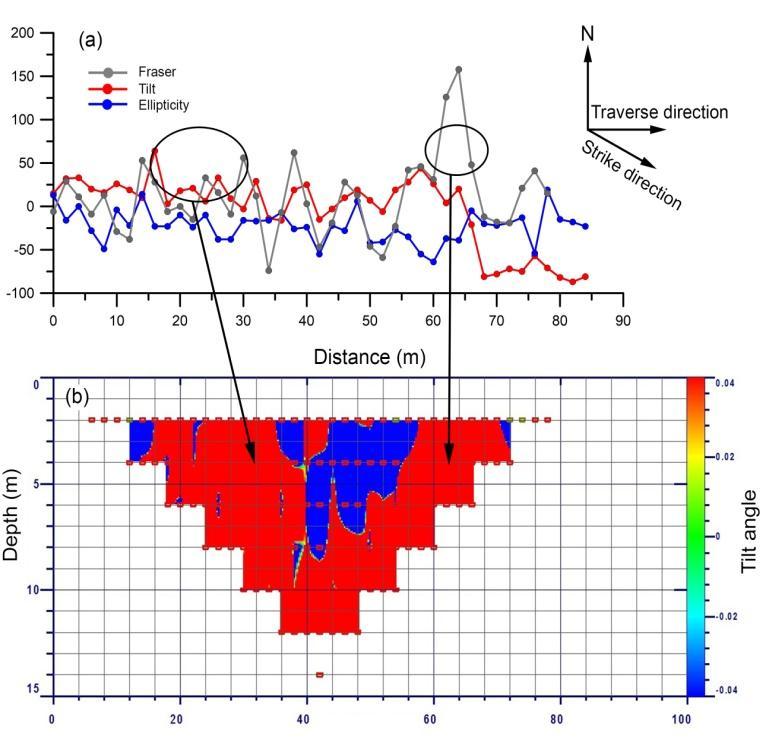
Fig -2:(a)Plotoftilt,ellipticity,andFraserfilter;(b) Karous-HjeltpseudodepthsectionoverTraverse1
Electrical resistivity tomography (ERT) studies (Kumar et al.,2011)werecarriedoutovertwoparallelprofilesatthe Rajawadi thermal spring site. The conductive feature observed here broadly coincides with a low resistivity zone(<15Ωm)uptoalateraldistanceofabout75 mover one ERT profile. These authors are of the view that this zoneisassociatedwiththelateralmovementofhotwater fromnearbythermalsprings.
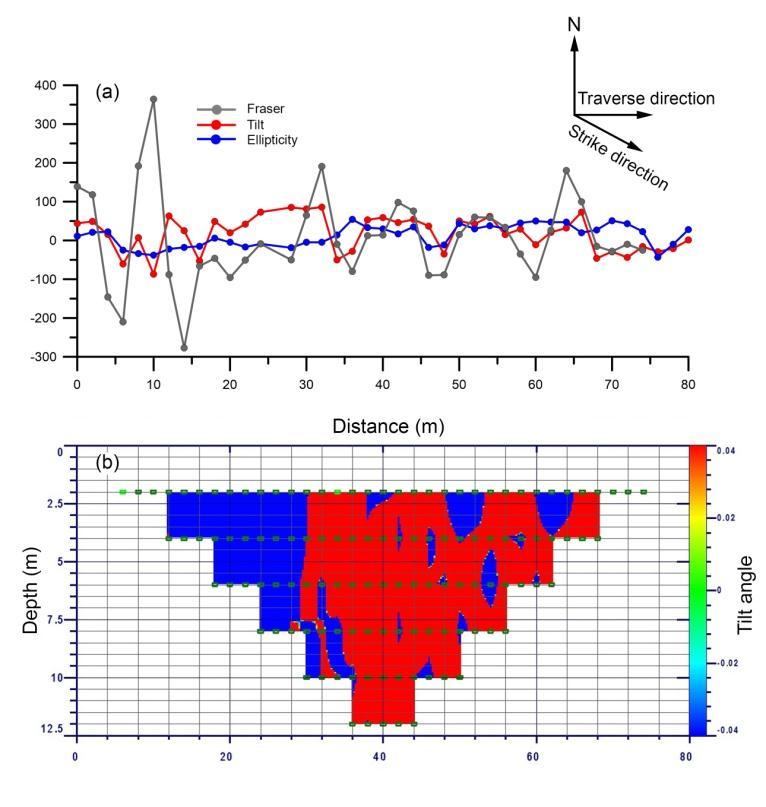
The second traverse at Rajawadi hot spring (T-2) is 100minlengthandisatadistanceof10mfromT-1.The tilt angle values range between -80 to 73 siemens and ellipticity values range between -59 to 43 siemens. The Frazer filtered values vary between -124 to 112 siemens. The plot of tilt, ellipticity, and Fraser filter is shown in Figure 3a. The corresponding depth section is given in
International Research Journal of Engineering and Technology (IRJET) e-ISSN: 2395-0056
Volume: 09 Issue: 09 | Sep 2022 www.irjet.net p-ISSN: 2395-0072
figure 3b. A broad conductive zone is revealed between lateral distances 30 to 52 m, which is marked by both positive and negative tilt and Frazer values (Fig. 3a). This conductive zone is observed up to depths of about 16 m from the surface (Fig. 3b) in the current density pseudo section. The traverse shows three prominent positive filtered tilt values at 28 m, 40 m, and 52 m distance (Fig. 3a),whichsignifiesthepresenceoffracturemarkedasF-F in Fig. 3b. Beyond the lateral distance of 52 m and up to 80 m, the tilt angle anomalies follow the same manner as ellipticity anomalies, reflecting poor conductor, which is presumably due to overburden sediments. Kumar et al. (2011) delineated another low resistivity zone (<15 Ωm) upto a distanceof about30 monthesecondERT profile, indicating a swampy region formed due to seepage of hot waterfromthenearbyhotspring.
coinciding with the Tural hot spring at about 55 m (Fig. 5a).
Fig -3:(a)Plotoftilt,ellipticity,andFraserfilter;(b) Karous-HjeltpseudodepthsectionoverTraverse2
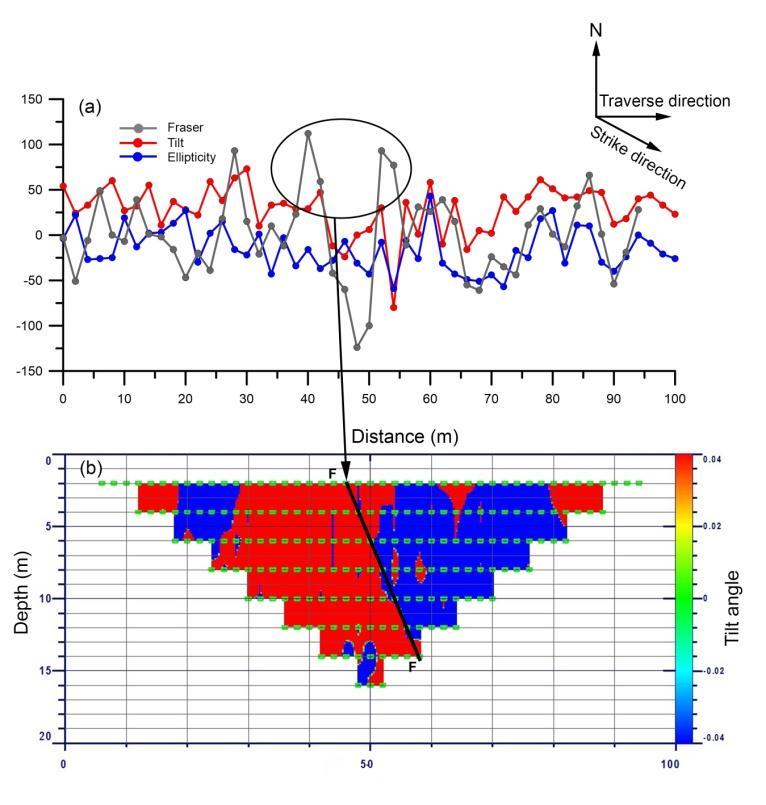
Traverse3isorientedfromwesttoeastandispassing very close to the Tural hot spring on its south. The tilt angle values range between -87 to 86 siemens, ellipticity values range between -43 to 54 siemens and Frazer filtered values range between -277 to 364 siemens. The plot of tilt, ellipticity, and Fraser filter is shown in Figure 4a and the corresponding depth section is given in figure 4b. A significant positive peak is observed in the Fraser filtered tilt values at a horizontal distance of 10 m, however, no conductive zone is observed at the corresponding depth section in Fig. 5b. Cyclic Fraser filtered positive and negative tilt anomalies are observed from horizontal distances 32 m onwards up to 65 m,
value:
Fig -4:(a)Plotoftilt,ellipticity,andFraserfilter;(b) Karous-HjeltpseudodepthsectionoverTraverse3
These anomalies reflect the conductive nature of the subsurfaceduetothesignatureofthethermalspring.This isevidentinthepseudodepthsectionalsoandextends up to depths of 12.5 m in the present case. From the pseudo depth section (Fig. 4b), a sharp resistivity contrast is observed at 25 m which may be the indication of the fracture zone. ERT studies in and around the Tural hot spring (Kumar et al., 2010) observed a sharp resistivity contrast over one ERT profile and attributed it to a fault. These authors also suggested that the observed low resistivity of about 13 Ωm in the region is due to the hot springreservoir.
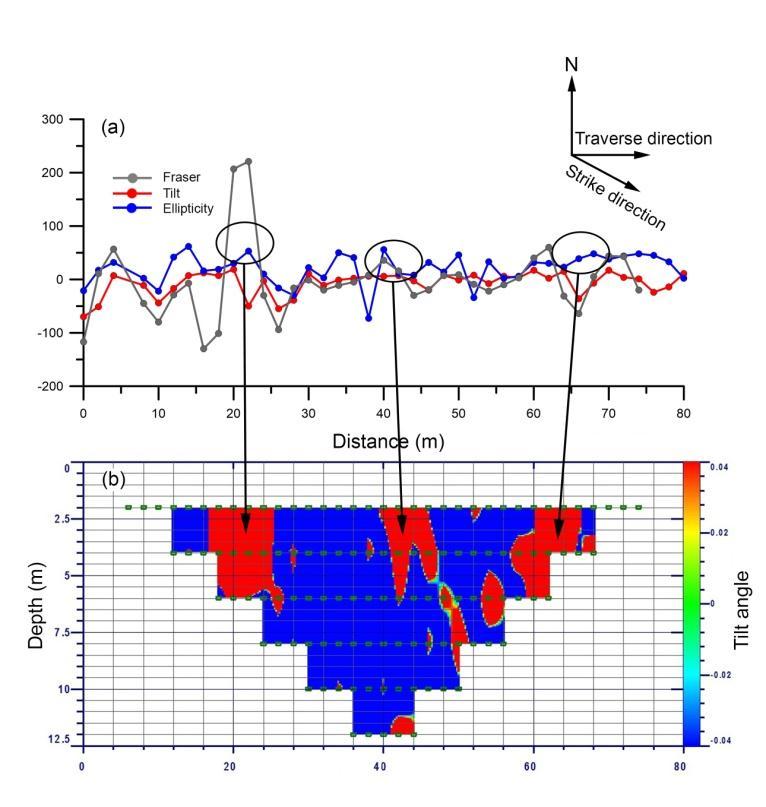
Traverse 4 is located 10 m away from traverse 3 in Tural hot spring zone. Traverse 4 is also oriented from westtoeastdirection.Thetiltanglevaluesrangebetween -70to19siemens,whileellipticityvaluesrangebetween73 to 62 siemens and Frazer filtered tilt values range between -130 to 221 siemens. The plot of tilt, ellipticity, and Fraser filter is shown in Figure 5a and the corresponding depth section is given in figure 5b. From figure(5a),ahighpositiveFraserfilteredpeakisobserved at a horizontal distance of about 22 m which is the signature of a conductive zone and is reflected in the pseudo density depth section up to shallow depths of about 6.25 m. Yet another positive peak in Fraser filtered
International Research Journal of Engineering and Technology (IRJET) e-ISSN: 2395-0056
Volume: 09 Issue: 09 | Sep 2022 www.irjet.net p-ISSN: 2395-0072
valueisrevealedat62mlateraldistance.Thisconductive anomalyisreflectedinthedepthsectionuptoabout6m.
Theauthorsaregrateful toDirector,IIG,forprovidingthe necessary facilities and according permission to publish this work. The authors acknowledge Shri B.I. Panchal for draftingthefigureswithperfection.
[1] Arora, C.L., 1986. Geoelectric study of some Indian geothermalareas.Geothermics,15(5/6)677-688.
[2] Baranwal, V.C., Sharma, S.P., 2006. Integrated Geophysical Studies in the East-Indian Geothermal Province.Pureappl.Geophys.,163,209-227.
[3] Benson, K.B., Payne, K.L. and Stubben, M.A., 1997. Mapping groundwater contamination using dc resistivityandVLFgeophysicalmethods:acasestudy. Geophysics,62(1),80-86.
[4] Bernard,J.andValla,P.,1991.Groundwater explorationinfissuredmediawithelectricalandVLF methods,Geoexploration,27,81-91.
Fig -5:(a)Plotoftilt,ellipticity,andFraserfilter;(b) Karous-HjeltpseudodepthsectionoverTraverse4
From resistivity sounding studies over the Tural region (Guptaetal.,2010),alowresistivityfeatureisobservedat shallow depths coinciding with the Tural hot spring. The conductive zone inferred from VLF broadly matches the resistivityfindings.
The very low frequency (VLF) electromagnetic method was employed to delineate the lateral conductivity distribution of fracture zones in and around the geothermal springs. Four VLF traverses have been conducted at two geothermal springs (Tural and Rajawadi). The traverse (T-1) at Rajawadi hot spring revealedbroadconductivefeaturesandextendedfromthe surfacetothedepthof12m.Thebroadconductivefeature isidentifiedasfracturezonewhichismarkedasF-Finthe second traverse (T-2) at Rajawadi hot spring. The boundaries of these fracture zones are having high resistivity contrasts. The traverse 3 at Tural hot spring revealed one broader conductive feature beyond the lateraldistanceof32mto65mandalsotwofracturesare markedF4andF5.Thisconductivefeatureisthesignature ofthermalspringanditextendeduptothedepthsof12.5 m. Traverse 4 at Tural suggests conductive zones at shallow levels at a lateral distance of 22 m, 60 m, and beyond.
[5] Cagler,I.andDemirorer,M,1999.Geothermal explorationusinggeoelectricmethodsinKestanbol, Turkey.Geothermics,28,803-819.
[6] CGWB, 2014. Groundwater Information, Ratnagiri district, Maharashtra Technical report No. 1825/DB/2014
[7] Chadha, R.K., 1992. Geological contacts, thermal springs and earthquakes in peninsular India; Tectonophys.,213,367-374.
[8] Chandrasekharam, D. and Chandrasekhar, V., 2010. Geochemistry of thermal springs of Orissa, India. Transactions-GeothermalResourcesCouncil34,614616.
[9] Chatterjee, S., Suman Sharma, Md. Arzoo Ansari, Deodhar, A.S., Upananda Low, Sinha, U.K., Ashutosh Dash, 2016. Characterization of subsurface processes estimation of reservoir temperature in Tural Rajwadi geothermal fields, Maharashtra, India. Geothermics, 59,77-89.
[10] Deshpande, GG., 1998. Geology of Maharashtra. GeologicalSocietyofIndia,Bangalore
[11] El-Qady, G., Ushijima, K. and El-Sayed, A., 2000 Delineationofageothermal reservoirby2Dinversion of resistivity data at Hammam Faraun area, Sinai, Egypt.Proc.WorldGeothermalCongress,1103-1108.
International Research Journal of Engineering and Technology (IRJET) e-ISSN: 2395-0056
Volume: 09 Issue: 09 | Sep 2022 www.irjet.net p-ISSN: 2395-0072
[12] Fraser,D.,1969.ContouringofVLF-EMdata. Geophysics,34,958-967.
[13] Gupta, M.L., 1993. Surface heat flow values in Gondwana grabens of Peninsular India: their significance and implications. Gondwana Geol. Mag., Spl. Vol., Birbal Sahni Center, Nat. Symp. Gondwana India,425-437.
[14] Gupta, G., Erram, V.C. and Maiti, S., 2010. Geoelectric investigationofhotspringsinwesternMaharashtra.J. Adv.Sci.Tech.,13(1),86-95.
[15] Gurav, T., Singh, H.K. and Chandrasekharam, D., 2016. Major and trace element concentrations in the geothermal springs along the west coast of Maharashtra, India.Arab J Geosci.,9, 44 https://doi.org/10.1007/s12517-015-2139
[16] Harinarayana. T., Abdul Azeez K.K., Murthy, D.N., Veeraswamy, K., Eknath Rao, S.P., Manoj, C., Naganjaneyulu, K., 2006. Exploration of geothermal structureinPugageothermalfield,LadakhHimalayas, India by magnetotelluric studies. J. appl. Geophys, 58, 280-295.
[17] Henkel,H.andGuzman,M.,1977.Magneticfeaturesof fracturezones.Geoexploration,15,173-181.
[18] Islami, N. and Irianti, M., 2019. Preliminary Geomagnetic Study of the Hot Spring Area in Rokan Hulu, Riau-Indonesia IOP Conf. Ser., Earth Environ. Sci.,332,022056.
[19] Karous,M.andHjelt, S.E.,1983.LinearfilteringofVLF dip angle measurements. Geophys. Prospect., 31,782794.
[20] Kumar, D., Thiagarnajan, S. and Rai, S.N., 2011. Deciphering geothermal resources in Deccan trap region using electrical resistivity tomography technique.J.Geol.Soc.India,78,541-548.
[21] Kundu, N., Panigrahi, M.K., Sharma, S.P. and Tripathy, S., 2002. Delineation of fluoride contaminated groundwateraroundahotspringinNayagarh,Orissa, India using geochemical and resistivity studies. Environ.Geol.,43,228-235.
[22] Low,U,Absar,A,Duraiswami,R.andSingh,A.,2020. GeophysicalexplorationofTural-Rajwadigroupofhot springs, West Coast Geothermal Province, Maharashtra, India and its implications. Geothermics 88,101874.https://doi.org/10.1016/j.geothermics.20 20.10187
[23] Maitra, A., Singh, A., Keesari, T., Sharma, S.P. and Gupta, S., 2020. Elevated equilibrium geotherm in stable continental shield: evidence from integrated structural, hydrological, and electromagnetic studies on nonvolcanic hot springs in the Eastern Ghats Belt, India. J Geophys Res (Solid Earth),https://doi.org/10.1029/2019JB017747
[24] Majumdar, R.K., Majumdar, N. and Mukherjee, A.L., 2000. Geoelectric investigations in Bakreswar geothermalarea,WestBengal,India.J. appl.Geophys., 45,187-202.
[25] Monterio, A.J., Duraiswami, R.A., Pujari, S.J., et al., 2019.Petrophysicalvariationswithinthebasalticlava flowsfromTural-Rajawadihotsprings,WesternIndia and their bearing on the viability of low-enthalpy geothermalsystems.IOPConf Ser.,EarthEnviron Sci., 249 https://doi.org/10.1088/17551315/249/1/012004
[26] Nabighian, M.N., 1982. Electromagnetic methods in appliedgeophysics.Soc.Explor.Geophys.,2,521e640.
[27] Ogilvy,R.D.andLee,A.C.,1991.InterpretationofVLFEM in-phase data using current density pseudosections.Geophys.Prospect.,39,567-580.
[28] Padhi, R.N. and Pitale, U.L., 1995. Potential geothermal fields in the context of national scenario on non conventional energy resources development programmeinIndia.Proc.WGC.,525-530
[29] Panda, P.K., 1985. Geothermal map of India and their significanceinresourcesassessments PetroleumAsia Jour.,VII,202-210.
[30] Parasnis, D.S., 1973. Mining Geophysics: Methods in GeochemistryandGeophysics.Elsevier,Amsterdam.
[31] Paterson, N.R. and Ronka, V., 1971. Five years of surveying with the very low frequency electromagneticmethod.Geoexploration, 9,7-26.
[32] Pitale, U.L., Dubey, R., Saxena, R.K., Prasad, J.M., Muthu-Raman, K., Thussu, J.L. and Sharma, S.C., 1987. Reviewofgeothermalstudiesofwestcoasthotspring belt, Maharashtra. Rec. Geol. Surv. India, 115(6), 97136.
[33] Ravi Shankar, Guha, S.K., Seth, N.N., Muthuraman, K, Pitale, U.L., Jangi, B.L., Gyan Prakash, Bandopadhyay, A.K. and Sinha, R.K., 1991. Geothermal atlas of India. Geol.Surv.India,19,60-99.
2022, IRJET | Impact Factor value: 7.529 | ISO 9001:2008 Certified Journal | Page227
International Research Journal of Engineering and Technology (IRJET) e-ISSN: 2395-0056
Volume: 09 Issue: 09 | Sep 2022 www.irjet.net p-ISSN: 2395-0072
[34] Reddy, D.V., Nagbhusanam, P. and Ramesh, G., 2013. TurnovertimeofTuralandRajvadihotspringwaters, Maharashtra,India.Curr.Sci.,104(10),1419-1424.
[35] Routh,P.S.,Lyle,M.,Hess,S.andBradford,J.,2006.3D Magnetic Characterization of Hot Springs in a Hydrothermal System in the Alvord Basin, Oregon. GRCTransactions,30,937-940
[36] Sarolkar, P.B., 2005. Geochemical characters of hot springs of west coast, Maharashtra State, India. Proc. WorldGeothermalCongress,Antalya,Turkey,24-29.

[37] Sharma, S. and Baranwal, V., 2005. Delineation of groundwater-bearing fracture zones in a hard rock area integrating very low frequency electromagnetic andresistivitydata.J appliedGeophys.,57,155-166.
[38] Sircar, A, Shah, M, Sahajpal, S, et al., 2015. Geothermal exploration in Gujarat: case study from Dholera. Geotherm Energy, 3, 1-25. https://doi.org/10.1186/s40517-015-0041-5
[39] Smith, B.D. and Ward, S.H., 1974. On the computation of polarization ellipse parameters. Geophysics, 39, 867-869.
[40] Subba Rao, P.B.V., Deshmukh, V., Vijaya Kumar, P.V.and Singh, A.K., (2022).Electrical conductivity structure of Aravalli and Tural hot springs (western part of DVP) inferred from magnetotelluric data.J. Earth Syst. Sci.,131, 88. https://doi.org/10.1007/s12040-022-01832-1
[41] Telford, W.M., King, W.F. and Becker, A., 1977. VLF mappingofgeologicalstructures.GeologicalSurveyof Canada,Ottawa,25-76
GANDLA SHAILAJA, Ph.D. in Geophysics, has expertise in Electrical Resistivity and EM technique Working at Indian Institute of Geomagnetism (IIG), NaviMumbai


KHAN TAHAMA, MSc. in Geophysics, has expertise in Electrical Resistivity, GIS and Geochemistry Working at Indian Institute of Geomagnetism (IIG), NaviMumbai
GAUTAM GUPTA, Ph.D. in Geophysics, is a Professor at Dr KSKGRL(IIG),Prayagraj.