International Research Journal of Engineering and Technology (IRJET) e-ISSN: 2395-0056

Volume: 09 Issue: 09 | Sep 2022 www.irjet.net p-ISSN: 2395-0072
International Research Journal of Engineering and Technology (IRJET) e-ISSN: 2395-0056
Volume: 09 Issue: 09 | Sep 2022 www.irjet.net p-ISSN: 2395-0072
1Mechanical Engineering, College of Engineering Pune, 411005 India 2Associate Professor, Dept. of Mechanical Engineering, College of Engineering Pune, 411005 India ***
Abstract - Petroleum as obtained from different refineries, is predominantly a mixture of many hydrocarbons with differing molecular structure. This mixture varies from company to company, refinery to refinery due to difference in there blending techniques. It may also contain small amounts of Sulphur, oxygen, nitrogenandimpuritiessuchaswater.This influences the chemical and physical properties of our fuel. And one such important property is Calorific value. Calorific value of fuel is an important property thereby measuring the energy content as well as purity of fuel. The conventional instrument used for measuring calorific value of fuel is bomb calorimeter. Measuring calorific value by bomb calorimeter is a destructive technique where fuel samples are burned every time, we measure the value. In order to overcome this disadvantages, alternate way of determining calorificvalue of liquid fuels is elaborated here. Prediction model based on different Machine Learning (ML) techniques which will successfully predict the calorific value of diesel are developed The dataset originating from experimental measurements consisting of different properties of diesel were gathered, processed and then used as an input for machine learning model. Artificial neural network (ANN), Support vector regression (SVR) and multivariatelinearregression(MLR) are the various regression models used for predicting calorific value of fuel followed by comparative study between these techniques on the basis of accuracy, robustnessandreliability.
Key Words: Root Mean Square Error, Machine Learning, Artificial neural networks, Support Vector Regression, Multivariate Regression
Calorific value (CV) is an important measure to check performance and purity of fuel. Existing methods to determine calorific value given in IS 1448 [P-6] and [P-7] takesmoretimeandareexpensive.Andsometimethefailure ofinstrumentsasdemonstratedbyJohnNail,etal[1]canbe risky. Plus, it is economically impossible to assert the calorific value of various fuel samples originating from different refineries. Hence many of the researchers were interested in determining the calorific value of fuel using indirect methods like establishing correlation between calorific and other parameters – chemical, physical or spectral
W.F.Faragheretalin1970haddevelopedaquantitative relationship between the calorific value and the A. P. I. gravity of fuel oils such as topped crude oil and cracked residuum[2].OliveiraL.E. andDaSilvaM.workaimedto obtainexperimentallyandcomparethecetanenumberand calorific value of different blends of biodiesel [3]. While RajneeshK.Verma,etalusedrefractiveindextodetectthe adulterationoffuelbySPRbasedfiberoptictechnique[4]. Feasibility study was carried out for measuring gross calorificvalue(GCV),carboncontent,volatilemattercontent and ash content of solid biomass fuel using laser-induced breakdownspectroscopybyZhiminLuetal[5]. PLSmodel basedonspectraandZ-scorestandardizationestablishedan equation for prediction of calorific value of biomass. Also, numerous effortsonquantitativeanalysishavebeendone using NIR and the multivariate method of partial least squares(PLS)regression[6-9],especiallyfordieselfuelsfractionof petroleumatmosphericdistillation200–300 °C [10] Several research analyzed biodiesel/diesel blends based on NIR spectroscopy and diverse multivariate methods have produced interesting results [11–14]. Particularly,Alvesetal.demonstrated,thesimplicityofusing PLS versus others multivariate methods, as e.g., Support Vector Machine (SVM) [14]. Nevertheless, an important challengethatstillhastobefacedisthecostandcomplexity involvedinthesetechniques.Achievingsuchperformance depends on diverse chemo metrical calibration settings. Some of them, as prediction intervals, infrared spectral region,calibrationalgorithm,plus,spectralpre-processing procedure have to be studied for petrochemicals [15-17]. Thisencouragedustogoforaeasierapproachandcheckfor correlationbetweencalorificvalueandotherpropertieslike density,viscosity,pH,refractiveindex,etc.
Also, prediction model which will correlate these propertiestothecalorificvaluewastobedeveloped.There were many researchers who had successfully predicted calorificvalueusingmachinelearningmodels.LikeShagufta U.Pateletalin2006haddevelopedtotalofsevennonlinear models using the ANN methodology for the estimation of GCV with a special focus on Indian coals [18]. The most accurate model had RMSE value of 0.514, Average percentageerror2.067andcoefficientofcorrelation0.997 fortestdataset.
In2012 ColmD. Everard et al developed a PLSRmodel to determinecalorificvalueofdedicatedbioenergycrops[19].
International Research Journal of Engineering and Technology (IRJET) e-ISSN: 2395-0056
Volume: 09 Issue: 09 | Sep 2022 www.irjet.net p-ISSN: 2395-0072
Visible and near infrared spectroscopy was used to determine the composition of 44 samples. While Qihong Feng et al [20] carried a comparative study between 3 regressionmodeltodeterminewhichgiveshighestaccuracy while predicting calorific value of coal 1) support vector machine 2) alternating conditional expectation and 3) artificial neural network are the 3 models taken into consideration. It was found that SVM and ANN regression modelcanworkonsmalldatasetandgivesresultswithhigh accuracy.In[21]LijunXuetalalsocarriedsimilarstudybut used single technique with three different approaches. Severalstatisticalapproachesincludingprincipalcomponent analysis(PCA),independentcomponentanalysis(ICA)and partial least squares analysis (PLSA) were used in SVM nonlinear regression analyses. Work by S.S. Matin and S. ChehrehChelganishowedthatrandomforestmethodgives betterresultsonlyforlargeandmultidimensionaldatabase [22].
Researchers used machine learning models to predict physicalpropertiesoffuelslikecoal,biodieselandbiomass So, we have extended the methodology and applied it to dieselandfacilitatedpredictionofit’sCV.Also,fromthese literatures it was found that the calorific value is best predicted by non-linear regression models and hence dependinguponvariousfactorslikesizeofdata,complexity, performance, ANN, SVM, MVR techniques were selected. These techniques gave most accurate results while predicting calorific value of diesel Thus, a relatively less complextechniqueofcalorificvaluemeasurementofdiesel hasbeenproposed.
All samples were of post-blending, ready to use diesel, whichwerecollectedfromthecommercialoutletsofdifferent petroleumcompaniesinMaharashtra,IndialikeHPCL,IOCL, BPCL,Reliance,Essar Thesamplescompositionincludedthe addition of diverse amountsof kerosene, atmosphericand heavyatmosphericdieselsfromvariousrefiningprocesses such as fluid catalytic cracking (FCC), direct distillation, coking, Vis breaking and hydrotreatment Their greatest source of variability was their composition, which was essentially dependent on the origin of the crudes. Usually, hydrocarbonstreamsemployedtoformulatethedieselfuel canbederivedfrom2to5crudesfromdiversesourcesas wellasstreamsfromvariousrefiningprocesses. Outletsin Maharashtra receive diesel out of refineries from Gujarat, Bina, Mumbai, Vishakhapatnam, Chennai, etc. So, to have equalinclusionofallrefineriesandoutletbrandsandtoavoid developmentofbiasedmodel,extensivenumberofsamples were collected. This took in to account all the variations possible. A total of 179 samples were used to construct, validateandassessthemodels.Sampleeachofsize400ml approx.werecollected.GovernmentofIndia’sguidelinesfor storingofdiesel(classBfuel)asper“ThePetroleumRules
1976” were followed. Feature extraction followed by preprocessingthedatawascarriedoutovereachsample.
Thebasisforselectingafeaturewaseasewithwhicha featurecanbemeasured,possibilityofcorrelationwithCV, measurementaccuracyoftheinstrumentortechniqueand previousstudies.Degreeofcorrelationcouldbeconfirmed onlyafterpre-processingthecollecteddata.So,otherfactors weretakenintoaccountwhileselectingafeature.Properties thatwereselectedwere:pH,Viscosity(cSt),Density(kg/m3), Re r tiveIn ex Fl shPoint C FirePoint C Thoughthis listisnotatallexhaustive,butincludingmanyfeaturescan increase complexity of the model, whose results would be difficulttoexplainorcorrelate.Problemthatcanarisewhen toomanyfeaturesareconsideredisthatofmulticollinearity. AndfurthermethodslikePCAorFactorAnalysisneedtobe employedtofacilitatedimensionorredundancyreduction. Though above tests were still accounted on the selected featurestoeliminateanyuncertainty.
Table -1: PrecisionofReferencemethods
Parameter Method Repeatability (r) Reproducibility (R)
Calorific Value(KJ/kg) IS1448 [P:6] 276J/g 773J/g
pH ENISO 10523 -Viscosity(cSt), IS1448 [P:25] 0.0035 0.007
Density (g/ml-1) ENISO 12185 0.0002 0.0005
Refractive Index ENISO 22241 0.004 0.01
FlashPoint ENISO 2719 1.62–2.03 3.98–4.97
FirePoint ENISO 2719 1.62–2.03 3.98–4.97
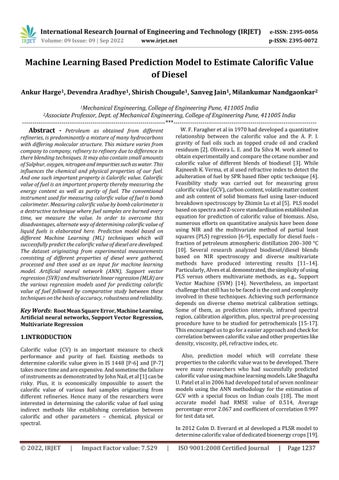
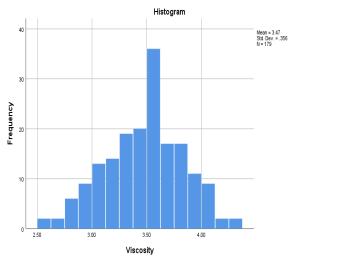
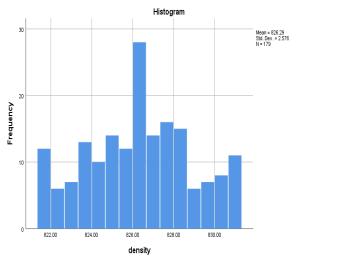
The179sampleswhichwerecollectedwerepre-processed to gather insight into the data. The software that was employed was IBM SPSS Statistics 26.0 Most of the parametricstatisticaltestslikeANOVAaswellasmanyML techniquesareperformedbasedontheassumptionthatthe provideddataisstatisticallynormal.Hencetestofnormality was conducted for each feature. These tests took into accountparameterslikeskewness,kurtosisandhistogram plot. The results were supplemented with KolmogorovSmirnov(K-S)andShapiro-Wilk(S-W)testofnormality.
International Research Journal of Engineering and Technology (IRJET) e-ISSN: 2395-0056
Volume: 09 Issue: 09 | Sep 2022 www.irjet.net p-ISSN: 2395-0072
explainingtheinfluenceofeachXioverdependentvariable Y.ε istheerrorvector.
Parameter Mean Variance Std. Deviation Skewness Kurtosis
FlashPoint 56.4947 (0.35) 21.924 4.68232 0.418 (0.182) 0.157 (0.361)
FirePoint 69.9596 (0.355) 22.668 4.76106 -0.026 (0.182) -0.328 (0.361)
Density 826.29 (0.5985) 6.638 2.57646 -0.006 (0.182) -0.734 (0.361)
Viscosity 3.4697 (0.0266) 0.127 0.35583 -0.17 (0.182) -0.21 (0.361)
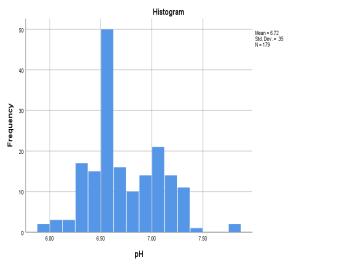
pH 6.725 (0.02615) 0.122 0.34987 0.48 (0.182) -0.69 (0.361)
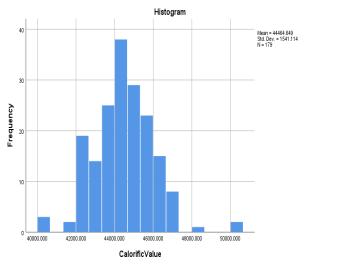
Calorific Value 44464.65 (115.2) 2375033 1541.114 0.258 (0.182) 1.253 (0.361)
*Bracketvaluedenotesstd.error
Table -3: Kolmogorov-SmirnovandShapiro-Wilktestof normality
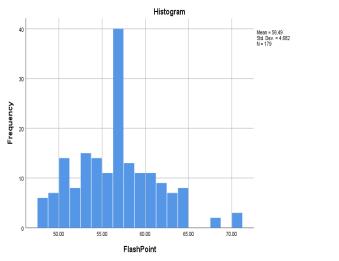
The measurementsof refractive index (RI) of the samples showthatitdoesnotvarymuchacrossthesamplesandthe rangeforthiswasfoundouttobe0.037across179samples. Asaresult,thestandarddeviationforRIwas0.00146,which is too low and hence nearly constant. For the rest of the features,itcanbeseenfrom Chart 1.thatthefeaturesare roughly normally distributed. This can be further be supportedfromtheK-StestandS-WtestfromTable3.The cut-offvalueforK-SandS-Wsignificanceis0.05.Ifafeature hasvalueabovethis,thefeaturefollowsnormaldistribution. Below0.05therewillbesignificantdeviationfromnormal distributionbehaviour.Andforthenumberofsamples<300 theskewnessandkurtosisz-valuei.eskewness/std.erroror kurtosis/std.errorshouldliebetween±3.29.Thoughdensity and flash point is failing the K-S and S-W test, the ML techniques like SVM, ANN does not require a normally distributeddata,henceweproceed
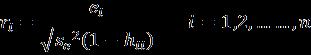
Secondly,thedatawasanalyzedforanyoutliersorleverage pointsandalsoteste ormulti olline rity.Forthis Cook’s distance and correlation matrix was considered. For a p rti ul robserv tiontobe noutlier theCook’s ist n e forthatobservationiscomputed.
Where,Xisanxpmatrixofpindependentvariableovern observations or samples, then β is the oe i ient ve tor
KolmogorovSmirnova Shapiro-Wilk
Features Statistic df Sig. Statistic df Sig.
FlashPoint 189 29 010 881 29 004
FirePoint 169 29 034 935 29 074 density 189 29 009 902 29 011 Viscosity 110 29 200* 971 29 586 pH 120 29 200* 959 29 303 Calorific Value 160 29 056 927 29 047
*Thisisalowerboundofthetruesignificance.
a.LillieforsSignificanceCorrection
ThenCook’s ist n eisgiven s
hii isthehatmatrixandse is thestandardizedsumsquare error.Whileeiistheith errorterm.ItisfoundthatDi follows Fdistributionandthus,
International Research Journal of Engineering and Technology (IRJET) e-ISSN: 2395-0056
Volume: 09 Issue: 09 | Sep 2022 www.irjet.net p-ISSN: 2395-0072
Forourcase,n=179,p=5,
Thus,Cooks’s ist n ew s l ul te ontheb siso whi h 16observationswereobservedtoexceedthislimit.Because ofwhichtheseobservationswereidentifiedasoutliersand hence,removedfromthedataset.Theseobservationswere not used to develop the correlation matrix. The feature values were min-max normalized before calculating the correlationmatrix.
Table -4: Featurecorrelationmatrix.
pH FlashPoint Density Viscosity FirePoint
pH 1 -0.63 -0.61 0.362 0.764
FlashPoint -0.63 1 0.412 0.18 -0.85
Density -0.61 0.412 1 -0.528 -0.594 Viscosity 0.362 0.018 -0.528 1 0.082
FirePoint 0.764 -0.85 -0.594 0.082 1
The correlation matrix shows that the parameters are multicollinearandwillrequiredimensionalreduction.This can be done use PCA or Factor Analysis. However, with dimensionalreductionvaluableinformationislostasitdoes nottakeintoaccountthecovariancestructurebetweenthe features.Also,PCAtechniquesarerecommendedwhenthere arelargenumberoffeatures.But,wehaveonly5features andifwefurtherreducethedimensions,themodelswillbe oversimplified causing underfitting and hence, it will not capturethedesiredpattern.Hence,wegoaheadwithallthe featureswithoutdimensionreductionwiththeassumption thatMLmodelswillhandlethemulticollinearity.
Machine learning model was developed on a system with Intel i5 processor and windows 10 operating system. R studio and Spyder are the two integrated development environmentsusedtoworkonthemodels.Randpythonare the two programming languages used. SVR model is developed using R programming language and Python programminglanguageisusedtopreparecodeforMVRand ANN. ANNmodelisdevelopedusingpythonversion3.8.5in Spyderenvironmentversion4.1.5.Pythoncodefor2-layered ANN, 3 layered ANN models are developed. While developing this model various libraries such as pandas, NumPyetcareused.
Modelisdevelopedusing2datasets,dataset_179(contains 179 observations) and dataset_163 (contains 163 observations).Intotal3ANNmodelsweredeveloped,first
wasbuilton179samplesusing3layeredANN.Secondand third model were built on 163 samples using two layered and 3 layered ANN. There were some outliers presents in 179 datasets as found during pre-processing because of whichaccuracyofmodelwassuffering.Afterremovingthose outliers’ new t set i.e. t set containing 163 observations were created. K-fold cross-validation was carriedouttoimproveonthegeneralizationofmodelover entiredataset.
Table -5: ANNmodelparametersandhyperparameters.
ANNModel1 ANNModel2 ANNModel3 Dataset dataset_179 dataset_163 dataset_163
Testset Observations 1to30 Observations 1to30 Observations 1to30
Trainset Observations 30to179 Observations 30to163 Observations 30to163
Nooflayers 3 2 3
Noofnodes [6,4,1] [13,1] [6,3,1]
Normalization technique Min-max normalization Max normalization Max normalization
Learningrate 0.09 9 6.7 beta 0.95 - 0.3 lambda 0.0001 - 0.0001 Noof iterations 14501 100000 100000
SVR model is developed by using R version 4.0.0 in R studio environment. Predefined function of SVR is available and extensive coding is not required in this case. Various libraries are used to split the dataset and import SVR predictivefunction.CaToolsisusedtosplitthetrainandtest data and e1071 to use SVM function to train and test SVR model. SVR model was developed using dataset_163 Rigorous iterations were carried out by changing hyperparametersandevenbychangingarchitectureofSVR model.
MVRmodelisdevelopedbyusingpredefinedfunctions availableinSklearnlibrary.MVRmodelwasdevelopedusing pythonversion3.8.2inSpyderversion4.1.5.Modelwasbuilt ondatset_163 DevelopingandunderstandingMVRmodelis very easy and we do not have to perform meticulous trial anderrorprocesstofindcorrectvaluesofhyperparameters. DevelopingMVRmodelisveryeasytakelesstimerelativeto theothermodels
2022, IRJET | Impact Factor value: 7.529 | ISO 9001:2008 Certified Journal |
International Research Journal of Engineering and Technology (IRJET) e-ISSN: 2395-0056
Volume: 09 Issue: 09 | Sep 2022 www.irjet.net p-ISSN: 2395-0072
Table -6: SVMmodelparametersandhyperparameters.
Parameter value Dataset dataset_163 Test-trainsplitratio 0.8 seed 0 Kernel radial cost 0.98 gamma 0.17
InordertoassesstheaccuracyofmodelRsquaredvalueand RMSE value is used. Graphs (scatter plots) are plotted between true value and predicted value for test and train dataset.Graphsallowustovisualisethedeviationbetween truevalueandpredictedvalue.Desirableshapeofgraphisy =xstraightline.
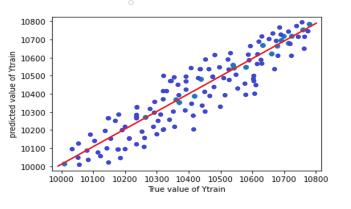
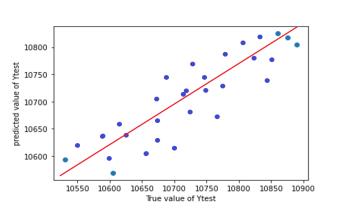
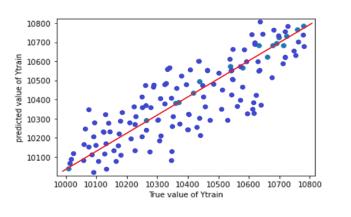
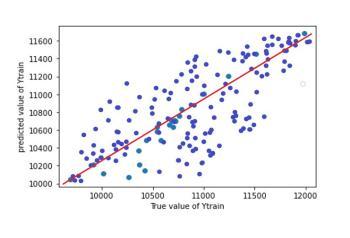
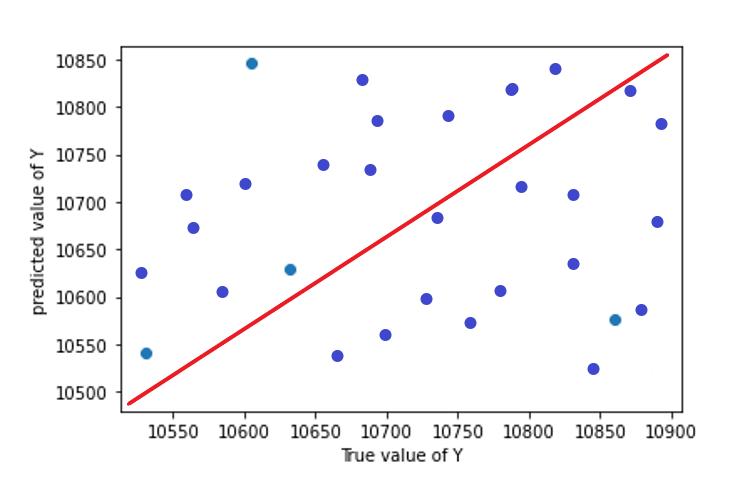
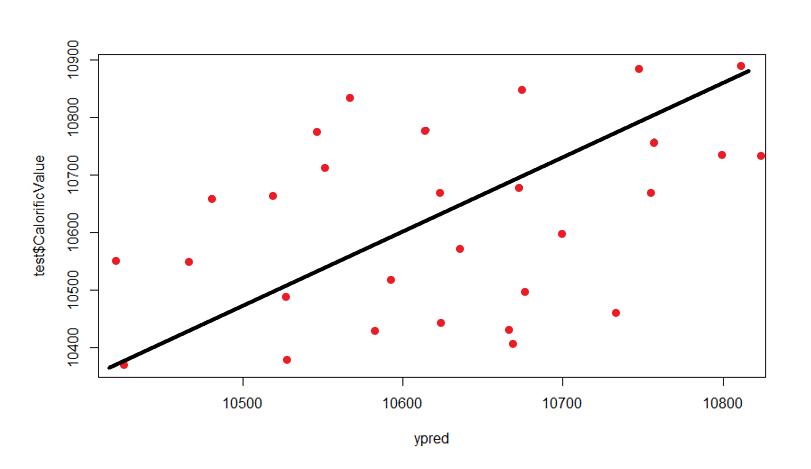
Table -7: R2 andRSMEvaluesofpredictionmodel
Modelname (Testdata)R2 (Testdata)RMSE (kcal/kg)
ANNModel1 0.784 166.11
ANNModel2 0.854 130
ANNModel3 0.939 83.6
SVRModel 0.564 106.4 MVRModel 0.67 263.7
Chart 2: ANNModel1testtrainpredictionplot
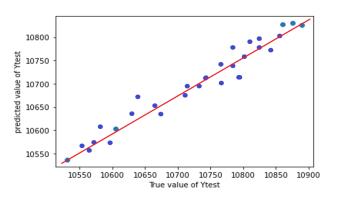
Chart 4: ANNModel3testtrainpredictionplot
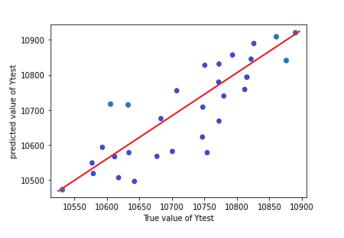
Chart 5: SVRpredictionplotfortestdata
We did comparative study of ANN, SVR and MVR model basedonhowwell itfitsthedataandpredictionaccuracy (forourapplication).Otherparameterssuchascomplexity ofmathematics,easinessofhyperparametertuningprocess, parameterstotune(flexibility),hardwaresystemrequired, Time of execution of programme are also taken into consideration.
Allthesepropertiesarequantifiedbygivingcertainweights to each of them. Points are assigned to each of the model considering their performance in each section. More weightageisgiventopredictionaccuracyandflexibilityto createmoreclassifiers.(1islowestand5ishighest)
Chart 3: ANNModel2testtrainpredictionplot
© 2022, IRJET | Impact Factor value: 7.529 | ISO 9001:2008 Certified Journal | Page1241
International Research Journal of Engineering and Technology (IRJET) e-ISSN: 2395-0056
Volume: 09 Issue: 09 | Sep 2022 www.irjet.net p-ISSN: 2395-0072
ANN SVR MVR score score score
R2 5 0.939 5 0.564 1 0.67 2
RMSE(kcal/kg) 5 83.6 5 106.4 4.5 263.7 1 Noof parameters 3 8 5 3 2.5 1 1
Easinessof tuningprocess 3 low 1 medium 3 high 5
Complexityof maths 2 high 1 high 1 low 5
Timeof execution 4 31 sec 1 0.09sec 5 0.03 sec 5
total 74 66 63
TheresultsintermsofR2andRSMEvalueshaveshownthat theANNmodelisgivingsufficientaccuracy.Thereasonfor thelowaccuracyofSVRandMVRmodelscanbeattributed tothefactthatthefeaturesaremulticollinear.LinearKernel ofSVMisverysimilartoLogisticRegression,andhencethe effectofmulticollinearityhasasimilareffectinthecaseof Linear Kernel of SVM. RBF Kernel is based on distance betweenthedatapoints,similartoK-NearestNeighbors.So It oesn’tm kemu hsensetoget e tureimport n einthis case,ratherwelookatdatapointswhichhasinfluencedthe decision in favor of a class to get an interpretation of the model.So,RBFkernelisalsoimpactedbymulticollinearity problem. Wehavetoremovemulticollinearityifwewantto useweightve torsβ ire tly or e tureimport n e.While neural networks generally do not suffer from multicollinearitybecausetheytendtobeoverparameterized. The extra learned weights create redundancies that make effectsthatinfluenceanysmallsubsetoffeatures(suchas multicollinearity)insignificant.Multicollinearityisaproblem in linear regression mainly because of process of model fitting.Assumingthatthereexistsauniquesolutiontothe problem,theparameterscanbeestimatedbyinvertingXTX. Butthisisnotpossibleinthecaseofperfectcollinearityas thematrixisnotinvertible,alsoitisdifficultinthecaseof imperfectcollinearity(asinourcase),becausetheinverseis inaccurateduetoitslargeconditionnumber.InANNdueto its overparameterization, the coefficients or weights of a neural network are inherently difficult to interpret. However, it is this very redundancy that makes the individual weights unimportant. At each level of the network,theinputsarelinearcombinationsoftheinputsof the previous level. The final output is a function of many combinations of sigmoidal functions involving high order interactionsoftheoriginalpredictors.Andhencea3layered Network is superior in handling the problems against multicollinearitycomparedto2layeredmodel Thus,neural
networksguardagainsttheproblemsofmulticollinearityat theexpenseofinterpretability.
Wehaveusedthreeregressionmodelsi.e.,ANN,SVM,MVR topredictcalorificvalueofdieselusingbasicpropertiessuch as density, viscosity, pH and others. Model 3 of ANN has highest prediction accuracy and can be used for real time prediction of calorific value of diesel. The study demonstrates that there exists a relationship between calorificvalueandotherpropertiesofdieselsuchasdensity, viscosity etc. which can be explained with the use of predictionmodels.ANNmodelhashighpredictionaccuracy andissuperiortoothertwoalgorithmsbecauseitissuperior in handling multicollinearity. ANN is flexible but complex andtediousprocesswhosespeedcanbeincreasedbyusing high performance hardware system. SVR model is a fast, correlationtoolbutnotmuchaccurateinpredictingcalorific value of diesel. MVR is easy to understand and easy to implement.MVRgivesaclearalgebraicrelationshipbetween calorificvalueandotherproperties.Butconsideringthecase ofmulticollinearity,SVMandMVRarenotaccurateenough tocorrectlypredictthecalorificvalue.
[1] John N il Di n H milton “An lysis o bomb lorimeter ilure” Journ l o Chemi l He lth n Safety, vol. 17, Issue 2, pp 21-23,2010, https://doi.org/10.1016/j.jchas.2009.08.002.
[2] W.F.F r gher J.C.Morrell n J.L.Essex “Rel tionship between Calorific Value and Other Characteristics of Resi u lFuelOils n Cr ke Resi uum's”In ustri l and Engineering Chemistry, pp 933, 1970, https://doi.org/10.1021/ie50238a012
[3] L. E. Oliveir n M. D Silv “Rel tionship between cetane number and calorific value of biodiesel from Til pi vis er l oil blen s with miner l iesel” RenewableEnergyandPowerQuality,2013.
[4] R. K. Verm P. Suw lk n J. Y v “Dete tion o adulterationindieselandpetrolbykeroseneusingSPR b se ” Opti l Fiber Te hnology vol. 43, pp. 95-100, 2018,https://doi.org/10.1016/j.yofte.2018.04.011.
[5] ZhiminLu,XiaoxuanChen,ShunchunYao,HuaiqingQin, Lifeng Zhang, Xiayang Yao, Ziyu Yu and Jidong Lu, “Fe sibilitystu yo gross lorii v lue rbon ontent volatilemattercontentandashcontentofsolidbiomass uel using LIBS” Fuel vol. 258, pp.116150, 2019, https://doi.org/10.1016/j.fuel.2019.116150.
International Research Journal of Engineering and Technology (IRJET) e-ISSN: 2395-0056
Volume: 09 Issue: 09 | Sep 2022 www.irjet.net p-ISSN: 2395-0072
[6] C.-A.BaldrichF.,L.-A.NovoaM.”R pi characterization ofdieselfuelbyinfraredspectroscopy“,CT&FCiencia, Tecnol.YFutur.3(2006)171–182.
[7] R.E. Morris, M.H. Hammond, J.A. Cramer, K.J. Johnson, B.C. Giordano, K.E. Kramer, et al., Rapid fuel quality surveillance through chemometric modeling of nearinfra redspectrarapidfuelqualitysurveillancethrough chemometricmodelingofnearinfraredspectra,Energy 4 (2009) 1610–1618, http://dx.doi.org/10.1021/ef800869t
[8] M.C. Breitkreitz, I.M.J. Raimundo, J.J.R. Rohwedder, C. Pasquini, H.A. Dantas Filho, G.E. José, et al., Determination of total sulfur in diesel fuel employing NIRspectroscopyandmultivariatecalibration,Analyst 128 (2003) 1204–1207, http://dx.doi.org/10.1039/b305265f
[9] F.B.Gonz g C.P squini “A low ostshortw ve ne r infrared spectrophotometer: application for etermin tiono qu lityp r meterso iesel uel”An l. Chim. Acta 670 (2010) 92–97, http://dx.doi.org/10.1016/j.aca.2010.04.060
[10] M.A. F him T.A. Als hh A. Elkil ni “Ch pter2Re inery Fee sto ks n Pro u ts” Fun ment ls o Petroleum Refining, Elsevier, pp. 11-31, 2010, http://dx.doi.org/10.1016/B978-0-444-52785-1.000024.
[11] R.M.B l bin E.I.Lom kin R.Z.S iev “Neur lnetwork (ANN) approach to biodiesel analysis: analysis of biodiesel density, kinematic viscosity, methanol and watercontentsusingne rin r re NIR spe tros opy” Fuel, vol 90, pp. 2007–2015, 2011, https://doi.org/10.1016/j.fuel.2010.11.038
[12] J.C.L.Alves R.J.Poppi “Bio iesel ontent etermin tion in diesel fuel blends using near infrared (NIR) spe tros opy n support ve tor m hines SVM ” Talanta, vol 104, pp. 155–161, 2013, http://dx.doi.org/10.1016/j.talanta.2012.11.033.
[13] V.O. Santos, F.C.C. Oliveira, D.G. Lima, A.C. Petry, E. G r i P.A.Z. Su rez et l. “A omp r tive stu y o diesel analysis by FTIR, FTNIR and FT-Raman spectroscopy using PLS and artificial neural network n lysis”An lyti Chimi A t vol.547 pp.188–196, 2005,http://dx.doi.org/10.1016/j.aca.2005.05.042
[14] J.C.L.Alves R.J.Poppi “Simult neous etermin tiono hydrocarbonrenewablediesel,biodieselandpetroleum dieselcontentsindieselfuelblendsusingnearinfrared NIR spe tros opy n hemometri s” An lyst vol. 138, pp. 6477–6487, https://doi.org/10.1039/C3AN00883E
[15] .A.Honorato,B.deB.Neto,M.F.Pimentel,L.Stragevitch, R.K.H. G lvão “Using principal component analysis to find the best calibration settings for simultaneous spectroscopic determination of several gasoline properties” Fuel vol.87pp.3706–3709,2008, http://dx.doi.org/10.1016/j.fuel.2008.06.016
[16] R.R. Bou k ert E. Fr nk G. Holmes D. Flet her “A comparison of methods for estimating prediction interv ls in NIR spe tros opy: size m tters” ChemometricsandIntelligentLaboratorySystems,vol 109 pp. 139–145, 2011, http://dx.doi.org/10.1016/j.chemolab.2011.08.008
[17] R.M. B l bin R.Z. S iev “Ne r-infrared (NIR) spectroscopy for biodiesel analysis: fractional composition,iodinevalue,andcoldfilterpluggingpoint rom one vibr tion l spe trum” Energy Fuel vol. 25 pp.2373–2382, 2011, http://dx.doi.org/10.1021/ef200356h
[18] S.U.Patel,J.B.Kumar,Y.P.Badhe,B.K.Sharma,S.Saha, S.Biswas,A.Chaudhury,S.S.TambeandB.D.Kulkarni, “Estim tion o gross lori i v lue o o ls using rti i i l neur l networks” Fuel vol. 86, pp.334-344, 2007,https://doi.org/10.1016/j.fuel.2006.07.036
[19] C. D. Everard, K. P. McDonnell and C. C. Fagan, “Pre i tiono biom ssgross lorii v luesusingvisible n ne r in r re spe tros opy” Biom ss n Bioenergy, vol. 45, pp. 203-211, 2012, https://doi.org/10.1016/j.biombioe.2012.06.007
[20] Q. Feng J. Zh ng X. Zh ng n S. Wen “Proxim te analysis-based prediction of gross calorific values of coals: A comparison of support vector machine, alternatingconditionalexpectationandartificialneural network”FuelPro essingTe hnology vol.129 pp.120129,2014.,https://doi.org/10.1016/j.fuproc.2014.09.001
[21] L.Xu Y.Cheng R.Yin n Q.Zh ng “Comp r tivestu y ofregressionmodelingmethodsforonlinecoalcalorifc v lue pre i tion rom l me r i tion e tures.” Fuel vol. 142, pp. 164-172, 2014 https://doi.org/10.1016/j.fuel.2014.10.081
[22] S.S.M tin n S.C.Chelg ni “Estim tiono o lgross calorific value based on various analyses by random orest metho ” Fuel vol. 177 pp. 274-278, 2016, https://doi.org/10.1016/j.fuel.2016.03.031