International Research Journal of Engineering and Technology (IRJET) e-ISSN:2395-0056

Volume: 09 Issue: 09 | Sep 2022 www.irjet.net p-ISSN:2395-0072
International Research Journal of Engineering and Technology (IRJET) e-ISSN:2395-0056
Volume: 09 Issue: 09 | Sep 2022 www.irjet.net p-ISSN:2395-0072
1Student, Dept. of ECE, B.M.S. College of Engineering, Bengaluru, India
2Assistant Professor, Dept. of ECE, B.M.S. College of Engineering, Bengaluru, India ***
Abstract - Surgical site infection (SSI) is defined as infection occurring up to 30 days after surgery (or up to one year after surgery in patients) and affecting either the incision or deep tissue at the operation site. It results in prolonged hospitalization, increased morbidity, mortality and increased surgery related costs. Therefore, early detection and prediction is of mere importance. Since, most of the techniques are not accurate and invasive, it is necessary to overcome the limitations of such studies. Thermography is a non-invasive, non-contact tool that uses the heat from our body to aid in making diagnosis of health care conditions. To overcome these limitations of previous studies to detect and predict surgical site infections the use of thermal imaging becomes necessary. This study proposes the use of thermal imaging on surgical site infections in abdominal surgeries by bringing about temperature and statistical analysis to help predict surgical site infections at an early stage. It is found that the temperature at the infection site is less comparatively less than the normal body temperature. Thus thermography is an effective method to evaluate the surgical site infection at an earlier stage. Image fusion techniques are used to get more informative images for further applications.
Key Words: Thermography, Image Processing, ROI, REASEARCH IR SOFTWARE, Segmentation, Contrast, Homogeneity,KurtosisSurgical site infections are infections that occur after surgery. They can be infections involving just the skin or deeper tissues and organs. Symptoms might include redness and pain around the area of surgery, drainage of puss or cloudy fluid, fever etc. Most predominantly visible surgical site infections are seen in abdominal surgeries. Abdominal surgeries have high rates of surgical site infections (SSIs), contributing to increased morbidity and mortality and costs for hospitalization, therefore the Thermography is completely safe and uses no radiation. It canbringaboutatemperaturevariationintheimagethatis beingcaptured.
To overcome the limitations of previous studies and yet detectandpredictsurgicalsiteinfectionstheuseofthermal imagingbecomesnecessary.Thisstudyproposestheuseof thermal imaging on surgical site infections in abdominal surgeries by bringing about temperature and statistical analysis to help predict surgical site infections at an early stage. Thermal and digital images of the Surgical site are captured. At the region of surgical site infection there are variations in surface body temperature compared to the normal body temperature. These variations can be analyzedusingthethermal imagesbytwomethods,image processing and statistical analysis. Image processing uses filtering, segmentation methods, feature extraction for the evaluationofthewound.
Existing modalities includes surveillance method, patient interactions and evaluating the medical history which causes the less accuracy. The Studies based on the direct observationofwoundbyhealthprofessionalhasdone,the disadvantage being that interpretation may not always be right. Abdominal surgery is a classification of surgical proceduresperformedin theabdominal region totreat or diagnose the medical conditions. This involves different types of techniques depending on which abdominal organ is involved that is liver, kidney and stomach. These procedures requires the opening of the abdomen with the large incision and referred to as laparotomies or abdominalsurgeries.
1. To generate thermal and digital image database of abdominalsurgicalsites.
2. To carryout statistical analysis using Research IR and MATLABsoftwares.
3. To identify prominent feature, which can be used to detecttheonsiteofinfectionattheearliest.
International Research Journal of Engineering and Technology (IRJET) e-ISSN:2395-0056
Volume: 09 Issue: 09 | Sep 2022 www.irjet.net p-ISSN:2395-0072
Sudarvizhi D, Kaavyaa A, Nandini N, Lakshmi priya K[1] DescribedhowThewoundimageiscapturedandthenoise is removed using different types of filters. The ROI image from background is separated by image segmentation is used for dividing an image into different textures on the image. Region growing, edge detection and Gabor filter algorithmareusedtoperformsegmentation.
Snehalatha umapathy, Sowmya v, Anburajan Mariamichael[2] Described how The K-means algorithm was used for image segmentation. From the output segmentedimagethefeaturesareextractedusingthegraylevelco-occurrencematrixmethod.
K.SundeepKumarandB.EswaraReddy[3]Describedhow Thefirsttaskistoassessthewoundandcapturethewound images by photographic wound assessment tool(PWAT). segmentationisdonefortheareaofwoundusingdenoising techniques.Usedwoundimageanalysisclassifiertoclassify thewoundimages.
Renu Bala[4] Descibed how Several methods of texture feature extraction such as structural based method, statistical based methods, transformation methods are used to find first order,second order and higher order statisticsareobtained.
R. Johnson Suthakar, J.Monica Esther, D. Annapoorani, F. Richard Singh Samuel[5] Descibed how different fusion techniques such as pixel-level, feature level and decision level. The fused image provides detail information about the region which is useful to perform image processing, segmentationandfeatureextraction.
1. The subject will be briefed about the test and provide consentontheconsentform.
2. At room temperature and ambient relative humidity level dressing shall opened, with wound well exposed, on days as per surgeons’ protocol for wound management.
3. Thewoundwouldbeexposedfor5minutes toattain thermal equilibrium with room temperature. After the acclimatization time, the thermal images and digital images of the wound are acquired while the subject is lyingonthebed.
4. The images will be subjected to detailed statistical analysisandimageprocessing.
The first step involves the collection of the data. The data was acquired from Pavan clinic, Hoolageri. Our study involves 6 subjects of which two of the subjects do not havetheoccurrenceofinfection.Atotalof6digitalimages and thermal images of the surgical site of the patient are captured with the aid of the thermal camera. During this process the room temperature and the humidity of the surroundingisalsonoted.
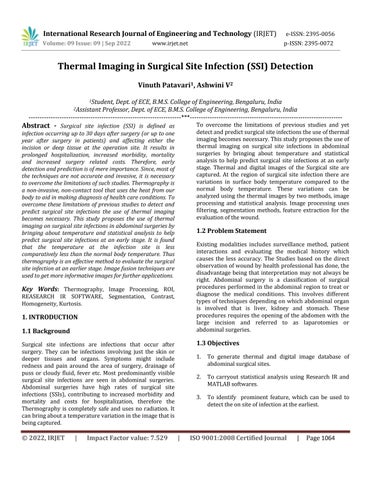
The collected thermal images are loaded to the Software ResearchIR-whichiscameraspecific.Thissoftwarehelps inanalysisofthethermalimage.
REASEARCHIRSOFTWARE:ResearchIRisapowerfuland easy to use thermal analysis software package for FLIR ScienceCameras.
Temperatureanalysisinvolvesthefollowingsteps:
1. Loadtheimagetothesoftware.
2. Selectapaletteaccordingtotherequirement.
3. Input the humidity and room temperature correspondingtothatimage.
4. Adjust the temperature scale based on the minimum andmaximumtemperatureoftheimage.
International Research Journal of Engineering and Technology (IRJET) e-ISSN:2395-0056
Volume: 09 Issue: 09 | Sep 2022 www.irjet.net p-ISSN:2395-0072
5. Aftertheseadjustmentsselect4regions:-twoinfected andtwonon-infectedreferringtothedigitalimages.
6. Using analysis toolbox the mean temperature minimum temperature and maximum temperature of theregions arefound.
7. Thesevaluesare notedin excel sheetsandgraphs are plottedforeasyinterpretation.
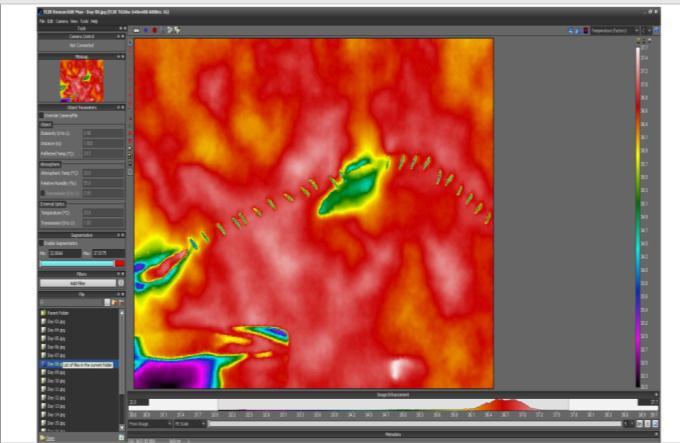
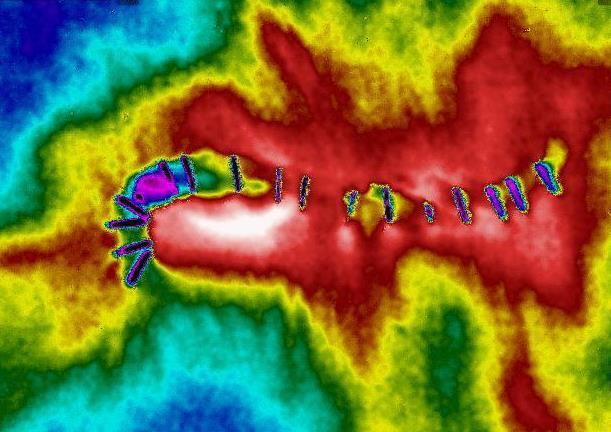
Thermal image is basically the temperature mapping of the body. It shows the differences in the surface temperature using a color palette. The processing is done asfollows:
1.
The thermal image is read in software MATLAB 2018a.
2. Preprocessing techniques:
This step involves RGB to gray conversion and filtering of the gray scaleimageis doneconsidering 5 typesoffiltersnamely-
Gaussian Filter: A Gaussian filter is a linear filter. It's usuallyusedtoblurtheimageortoreducenoise.
Weiner Filter: It removes the additive noise and inverts the blurring simultaneously. The Wiener filteringisoptimal interms ofthemeansquare error. In other words, it minimizes the overall mean square error in the process of inverse filtering and noise smoothing.
Median:Itisanon-linearfilterusedtoremovenoise.
Box: It is basically an average of surrounding pixel kindofimagefiltering.
Guidedfilter:Itisanedge-preservingsmoothingonan image,usingthecontentofasecondimage.
The validation of filters is done by calculating the PSNR and SNR of the images wrt the original image. The filter obtaining the highest values is considered for further processing. Here GAUSSIAN FILTER is taken. When workingwithimagesweneedtousethetwodimensional Gaussian function. The Gaussian filter works by using 2D as a point-spread distribution functionality. This is achieved by convolving the 2D Gaussian distribution function with the image. The Gaussian filter is a nonuniform low pass filter. The kernel coefficients diminish with increasing distance from the kernel’s centre. Central pixelshaveabetterweightingthanthoseontheperiphery Larger values of σ produce a wider peak (greater blurring). Kernel size must increase with increasing σ to take care of the Gaussian nature of the filter. Gaussian kernelcoefficientsrelyonthevalueofσ.Attheedgeofthe mask,coefficientsmustbenear0.
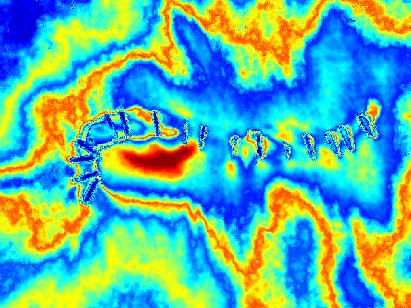
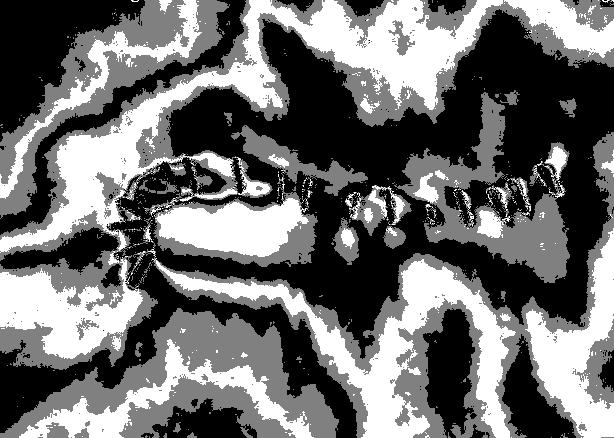
3. Segmentation of the Filtered image: Segmentationmethodssuchas
Edgedetection(Sobel):isatechniqueusedforfinding theboundariesofobjectswithinimages.
Multilevelthresholding:segmentsthegraylevelimage into several distinct regions taking more than one threshold.
Gabor filter texture based segmentation: partition of theimageintoregionsbasedontheirtexture.
International Research Journal of Engineering and Technology (IRJET) e-ISSN:2395-0056
Volume: 09 Issue: 09 | Sep 2022 www.irjet.net p-ISSN:2395-0072
All these methods are validated using the following parameters:
Diceco-efficient:alsoknownasSorensen-Diceindexis a statistical tool which measures the similarity betweentwosetsofdata.
Jaccard index: is a statistic used for gauging the similarityanddiversityofsamplesets.
Structural similarity index: perceptual metric that quantifies image quality degradation which requires 2imagesfromsameimagecapture.
Results with automated and manual segmented images were compared in which it showed no significant differences, hence automated segmentation was not considered.
4. ROI (region of interest):
ROIselectionisdonemanuallybyselecting6regions, two infected, two non- infected and two skin regions referringtothecorrespondingdigitalimage.
Standard Deviation: it shows how much variation or "dispersion"existsfromtheaverage.
This is a pre-processing step in image processing which basicallyhelpsinremovalofthenoise.
5.
Once the ROI is selected Higher order statistical features like Contrast, Correlation, Homogeneity, Energy, Skewness, Kurtosis, Variance, Mean and StandardDeviationwereextractedfromthoseregions whicharedefinedasfollows
Contrast:Differenceinluminance/color.
Correlation: Statistical measure which indicates how twoormorevariablesfluctuate.
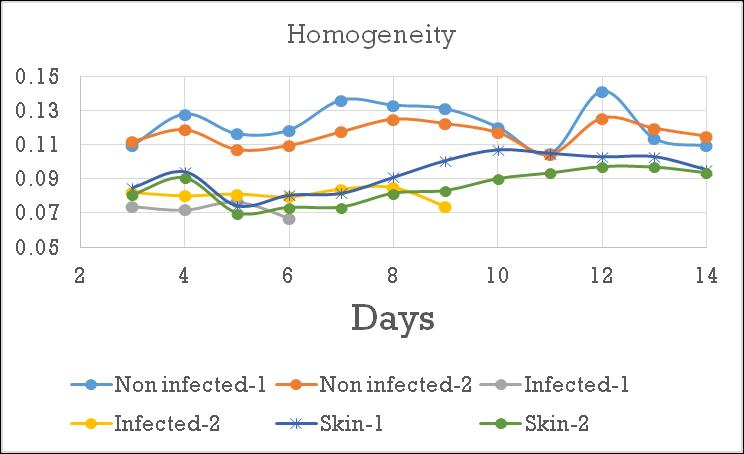
Homogeneity:Dependsonintensity,samegrayvalues meaninghomogeneitysame.
Energy: It is mapped to brightness or intensity of image.
Skewness: It is a measure of symmetry, or more precisely,thelackofsymmetry.
Kurtosis: Kurtosis is a measure of whether the data arepeakedorflatrelativetoanormaldistribution.
Variance:measureshowfarasetofdataisspreadout. Varianceistheaverageofthesquareddistancesfrom eachpointtothemean.
Mean: is most basic of all statistical measure. Means areoftenusedingeometryandanalysis.
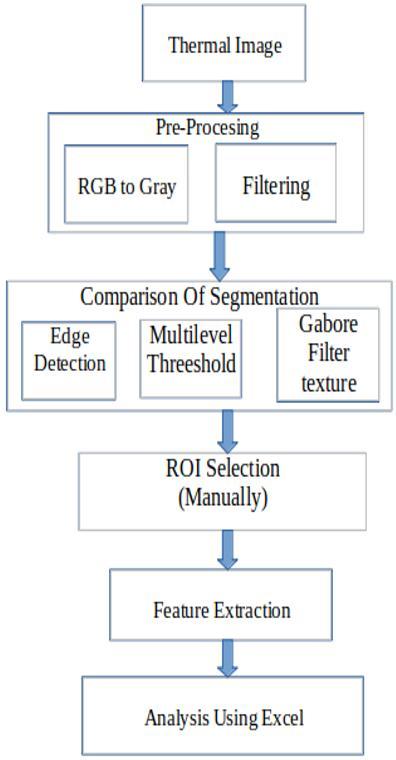
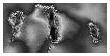
Fig-3:UnfilteredThermalImage
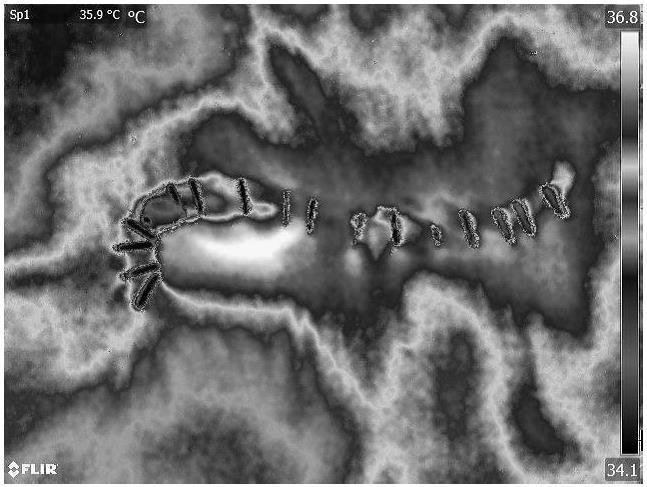
Fig-4: FilteredThermalImage
Filtering is carried out by considering 5 filters and is comparedusingPSNRandSNR.
Table-1:FiltertableofThermalimage
Filter PSNR SNR
Gaussian 98.2327 91.4025
Weiner 35.02846 28.21020
Median 29.98850 23.17025
Box 29.98860 23.17035 Guided 34.01 27.22171
For thermal image the Gaussian filter gives higher PSNR andSNRwithsigmavalueof0.265.
International Research Journal of Engineering and Technology (IRJET) e-ISSN:2395-0056
Volume: 09 Issue: 09 | Sep 2022 www.irjet.net p-ISSN:2395-0072
For the analysis of which segmentation gives the better results we considered 3 segmentation methods and evaluated them with a manually segmented image using thefollowingparameters.
Table-2: Segmentationcomparisonofimage
Segmentation Dice Index Jaccard Index Structural Similarity
EdgeDetection 0.046 0.4478581 0.023643 MultilevelThreeshold 0.999 0.4478582 0.999975 Gabortexture segmentation 0.436 0.5834246 0.279565
(d)Infectedregion1 (e)Infectedregion2
Fig-6: Manuallysegmentedimages
4.4
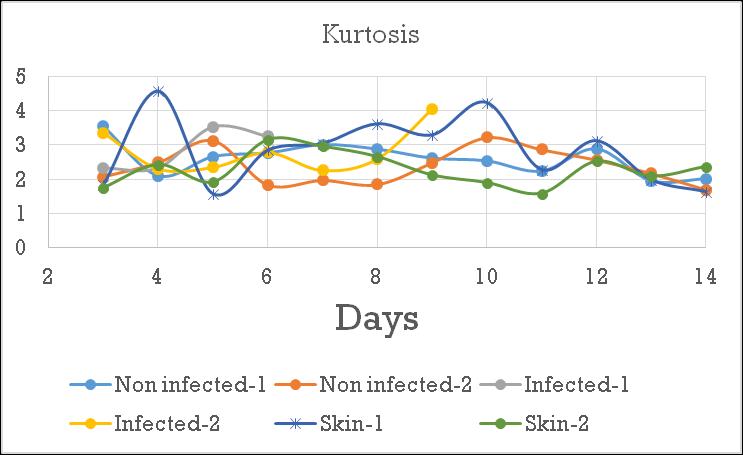
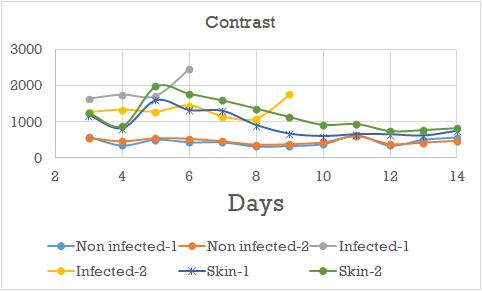
Graphs of the parameters were plotted and analyzed. It’s seen that Contrast, Homogeneity, Mean and Kurtosis shows significant variations compared to other features. Hencetheyaretakenforanalysis.
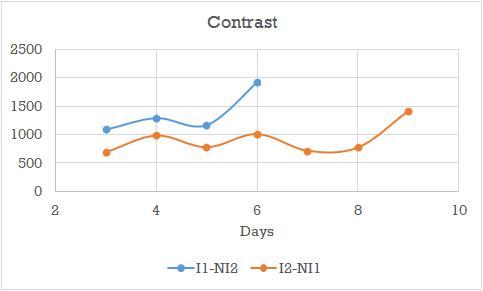
Chart– 1: Representingcontrastofthermalimage.
Fig-5: MultilevelThresholding
The ROI - 2 non infected, 2 regions outside SSI and all infectedregionsaremanuallysegmented.

(a)Segmented image

(b)Noninfectedregion1 (c)Noninfectedregion2
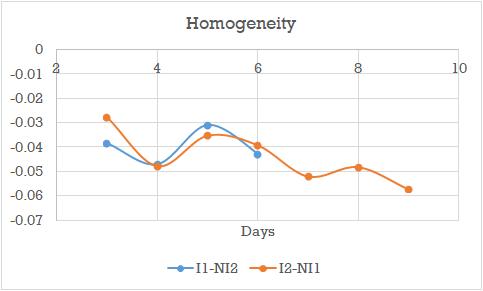
Chart– 2: Representinghomogeneityofthermalimage
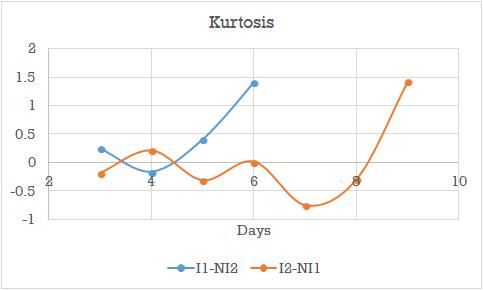
Chart– 3: Representingkurtosisofthermalimage.
International Research Journal of Engineering and Technology (IRJET) e-ISSN:2395-0056
Volume: 09 Issue: 09 | Sep 2022 www.irjet.net p-ISSN:2395-0072
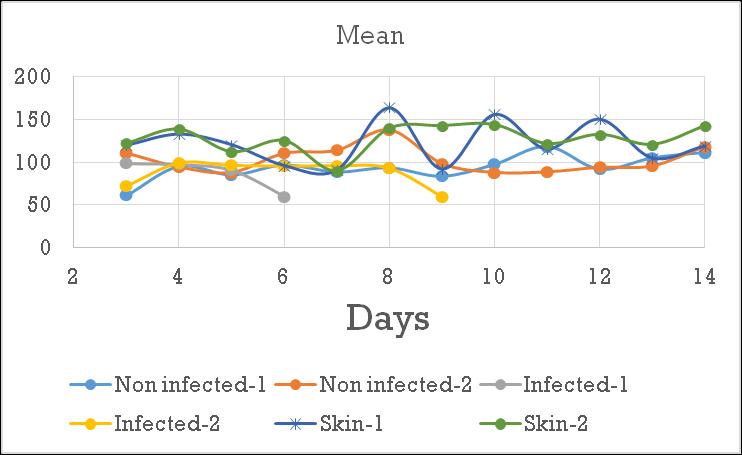
Chart– 4: Representingmeanofthermalimage.
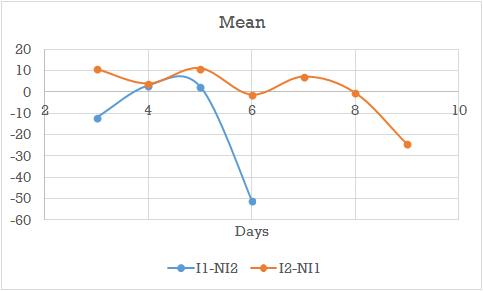
From the feature values the difference between the infected and nearest non-infected site were taken i.e I-NI.
Thesevalueswereplotted
Chart– 5: Representingdifferencecontrastofimage.
Chart– 7: Representingdifferencekurtosisofimage.
Chart– 6: Representingdifferencehomogeneityofimage.
Chart– 8: Representingdifferencemeanofimage.
The features were extracted and analyzed in excel sheet. Features which gave better results were taken. i.e Contrast, Homogeneity, Mean and Kurtosis. Variations in the graphs were observed. And difference between the infected and non infected site is taken. These difference graphshelpinquantificationofthewound.Bythiswecan predicttheinfectionatanearlierstagei.ebeforevisibleto nakedeye.
[1]AutomatedMethodsforSurveillanceofSurgicalSite
[2]Thesurgicalwoundininfrared:thermographicprofiles and early stage test-accuracy to predict surgical site infection in obese women during the first 30 days after caesareansection.
[3] Port site infection in laproscopic surgery: A review of itsmanagementhttps://researchgate.net/publication.
[4]https://en.wikipedia.org/wikiThermographic_camera.
[5]https://dsp.stackexchange.com/questions/56532/wha t-is-energy-in-image-processing
International Research Journal of Engineering and Technology (IRJET) e-ISSN:2395-0056
Volume: 09 Issue: 09 | Sep 2022 www.irjet.net p-ISSN:2395-0072
[6] “Thermal territories of the abdomen after caesarean section birth: Infrared thermography and analysis”CharmaineChildsSheffield HallamUniversity,Arul Selvan Sheffield Hallam University, Hora Soltani Sheffield Hallam University,TomFarrellSheffieldTeachingHospital.
[7] “Determining the worldwide epidemiology of surgical site infection after gastrointestinal resection surgery: protocol for a multicentre, international, prospective cohort study (GlobalSurg 2)”-University of Birmingham, Birmingham,UK
[8] “Benchmarking for surgical site infections among gastrointestinal surgeries and related risk factors: multicenter study in Kuwait”-Wafaa S Hamza, Mona F Salama,SamarSMorsi,NaglaaMAbdo,MariamAAlFadhli.
[9] “Relative Temperature Maximum in Wound Infection and Inflammation as Compared with a Control Subject Using Long-Wave Infrared Thermography”- Arjun Chanmugam, MD, MBA; Diane Langemo, PhD, RN, FAAN; Korissa Thomason, MS, BSSN, RN; Jaimee Haan, PT, CWS; Elizabeth A. Altenburger, PT, MSPT, CWS; Aletha Tippett, MD;LindaHenderson,RN;andToddA.Zortman,RN.
[10] “The surgical wound in infrared: thermographic profiles and early stage test accuracy to predict surgical site infection in obese women during the first 30 days aftercaesareansection”-CharmaineChilds,NicolaWright, Jon Willmott Matthew Davies, Karen Kilner, Karen Ousey, HoraSoltani,PriyaMadhuvrataandJohnStephenson