International Research Journal of Engineering and Technology (IRJET) e-ISSN: 2395-0056

Volume: 09 Issue: 09 | Sep 2022 www.irjet.net p-ISSN: 2395-0072
International Research Journal of Engineering and Technology (IRJET) e-ISSN: 2395-0056
Volume: 09 Issue: 09 | Sep 2022 www.irjet.net p-ISSN: 2395-0072
Sajal Anand1 , S.S Ohol2 , Subhajit Basu3
1Student, College Of Engineering Pune, Maharashtra
2Associate Professor, Department Of Mechanical Engineering, College Of Engineering Pune, Maharashtra 3Lead COC, Varroc Engineering Limited,Pune,Maharashtra ***
Abstract - This paper presents investigationof PMMA grade material for use in a Two-wheeler speedometer lens application. Of all the various components that make up the speedometer the lens is directly visible to the rider and hence correct and clear display of information is important as it directly affects their decision making. Mold flow analysis is carried out to establish the molding parameters and defects if any. From the risk assessment derived from the DFMEA and customer specific test standards CAEanalysis has beencarried at loading conditions of tightening torque of two different cases, modal analysis and harmonic response are simulated to check for any adverse stresses and deformations for any fouling and cracking at lens withinfrequencyrange of interest.
Key Words: Polymethyl Methacrylate, Speedometer, Mold Flow, CAE, Modal Analysis.
A speedometer or speed meter is a gauge meter that measures and displays the instantaneous speed of the vehicles. A traditional speedometer is of mechanical type alsocalledaseddy-currenttype;aflexiblecabledrivenby the gear linked at transmission. When the vehicle is in motion, a gear assembly turns the speedometer cable. A smallpermanentmagnetaffixedtothecableinteractswitha small aluminum cup (called a speed cup) attached to the shaftofthepointerontheanalogspeedometerinstrument. Asthemagnetrotatesnearthecup,thechangingmagnetic field produces eddy current in the cup, which themselves produceanothermagneticfield.Withtheadvancementsin the field of mechatronics and development of sensor technology traditional mechanical speedometers were replacedbydigitalspeedometers.Smallmagnetattachedto the car's rotating drive shaft sweep past tiny magnetic sensors (either reed switches or Hall-effect Sensors) positionednearby.Eachtimethemagnetspassthesensors, theygenerateabriefpulseofelectriccurrent.Anelectronic circuit counts how quickly the pulses arrive and converts thisintoaspeed,displayedelectronicallyonanLCDDisplay. Aspeedometerunderstudyisanassemblyofthefollowing componentstransparentcoverlens,CRspongeSealingring, Printed dial, Reflector with tell tale symbols, PCB with electronicsandsteppedmotor,housing/casingandwiring harness.
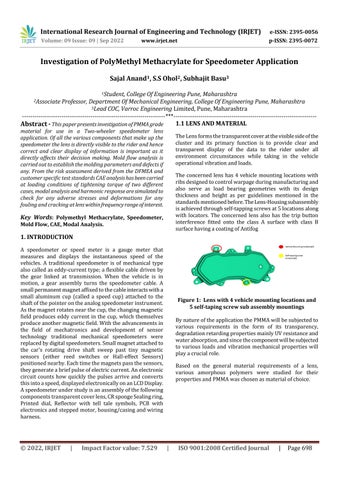
TheLensformsthetransparentcoveratthevisiblesideofthe cluster and its primary function is to provide clear and transparent display of the data to the rider under all environment circumstances while taking in the vehicle operationalvibrationandloads.
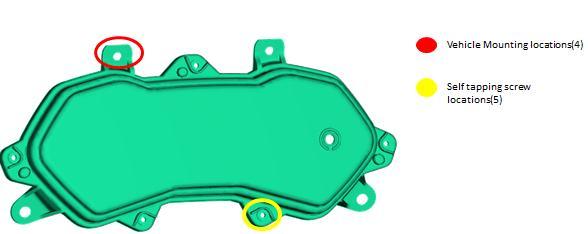
The concerned lens has 4 vehicle mounting locations with ribsdesignedtocontrolwarpageduringmanufacturingand also serve as load bearing geometries with its design thickness and height as per guidelines mentioned in the standardsmentionedbefore.TheLens-Housingsubassembly isachievedthroughself-tappingscrewsat5locationsalong with locators. The concerned lens also has the trip button interference fitted onto the class A surface with class B surfacehavingacoatingofAntifog
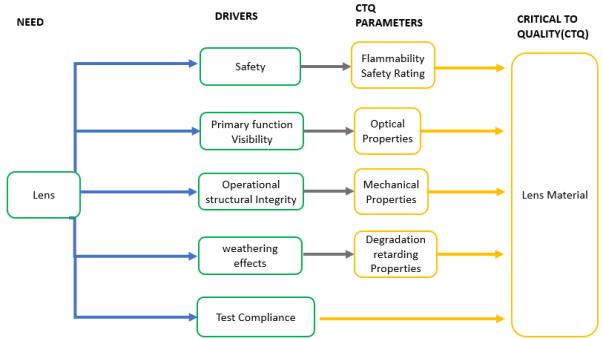
BynatureoftheapplicationthePMMAwillbesubjectedto various requirements in the form of its transparency, degradationretardingpropertiesmainlyUVresistanceand waterabsorption,andsincethecomponentwillbesubjected to various loads and vibration mechanical properties will playacrucialrole.
Based on the general material requirements of a lens, various amorphous polymers were studied for their propertiesandPMMAwaschosenasmaterialofchoice.
International Research Journal of Engineering and Technology (IRJET) e-ISSN: 2395-0056
Volume: 09 Issue: 09 | Sep 2022 www.irjet.net p-ISSN: 2395-0072
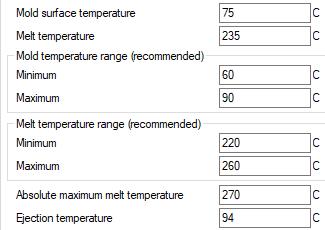
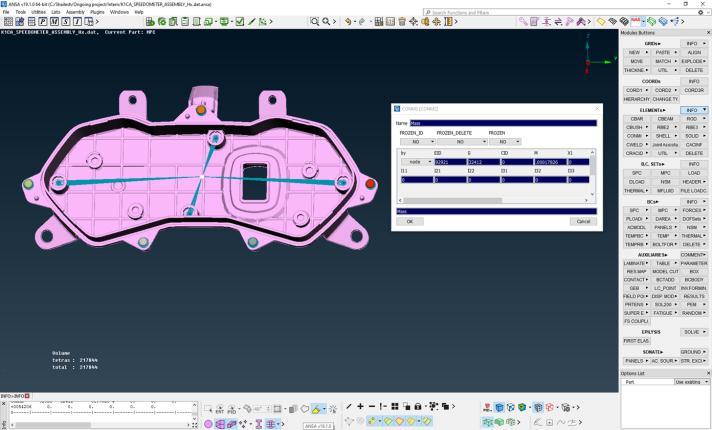
The objective of the analysis is to carry out FILL+PACK+WARP analysis for the component using an industry grade PMMA. Initial molding parameters will be established and any aesthetic defects can be addressed. AUTODESKMoldflow2021hasbeenusedforthisanalysis. DualDomainmeshhasbeencarriedoutfollowedbyadding 10layersof3Dtetras.Theaspectratioistobemaintained within 100, the total 779642 tetrahedral have been generated.Therecommendedmoldingconditionsfromthe softwareareasfollows,
Themaximumpressureobservedduringthefillingphaseis 101.2MPawhichwellbelowthemachinelimitof120MPa.
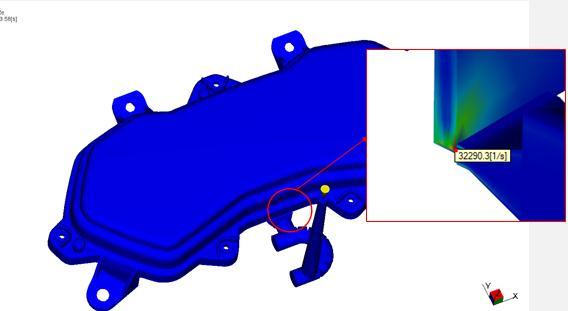
The shear rate is a measure of the rate of slip between different layer so polymer material, shear rate generates temperature which is desirable for viscous material like PMMAtoenablebetterflowhowevertoolargeshearrates cancausematerialdegradation.Theshearrateobservedis 32290.3(1/s)whichisbelow4000(1/s).
A cold sprue edge gate has been used with width and thicknessas16mmand1.4mmrespectively.Packingprofile hasbeensetas80%oftheinjectionpressurefor10seconds.
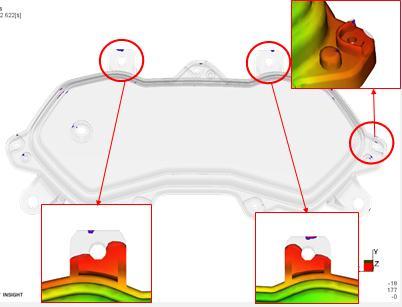
Ittakes2.66secondstofillthecavitywithnoobservedshort shots.Areascoloredredaretheonesfilledtowardstheend aresubjecttomoreshrinkageduetolackofpacking.
Airtraps(endfilllocations)andunavoidableweldlinesare observedatareasfurthestfromthegateasexpectedasthese regionsarefilledlastandflowfrontsmeet.Airtrapscanbe avoidedbyprovidingventingatthesepoints,althoughthe weldlinesareunavoidabletheyareattemperaturesabove themelttemperatureasshown
International Research Journal of Engineering and Technology (IRJET) e-ISSN: 2395-0056
Volume: 09 Issue: 09 | Sep 2022 www.irjet.net p-ISSN: 2395-0072
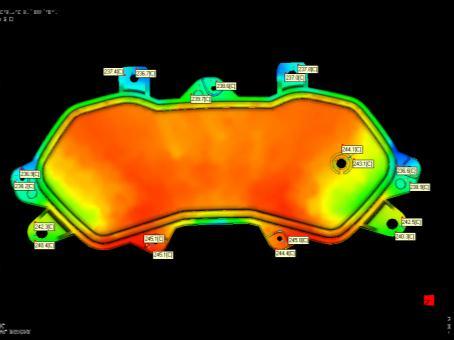
The shear along the mold walls and the shear rate cause temperaturestorisewithinthemeltdecreasingitsviscosity, the melt temperature was set at 235℃ and maximum temperatures observed are 10℃ above, no drop of temperatureisobservedhenceweldlinesarestrong.
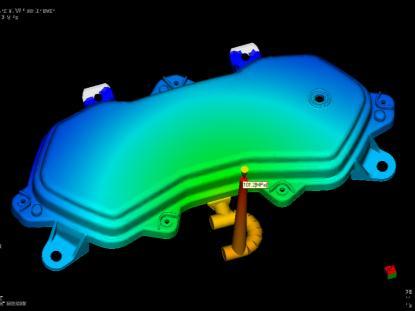
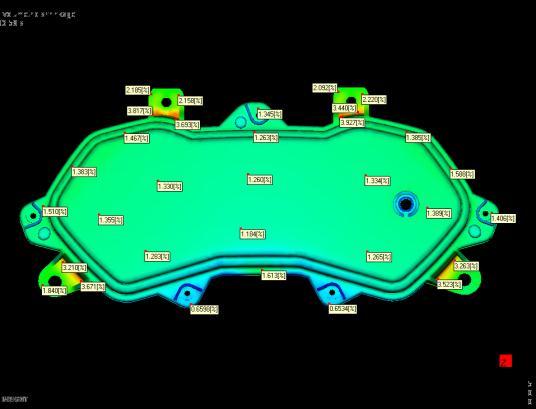
The volumetric shrinkage plot shows variable shrinkages which are due to variable thickness geometry. The thicker sectionsundergomoreshrinkageasthecoolingtimewithin themoldisnotsufficient,moreovertheportionsofgeometry furtherawayfromthegatewitnessmoreshrinkagesdueto the lack of packing. Multiple gates and more packing time/pressurecanbeprovidedtoreducethevalues.
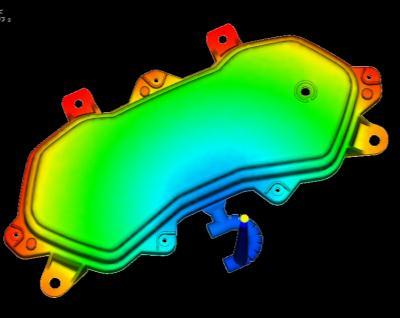
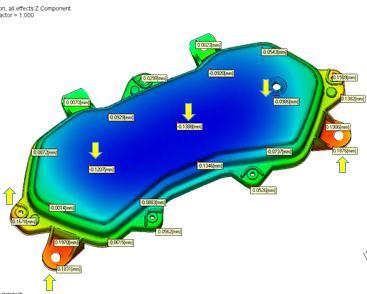
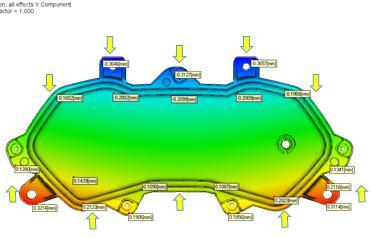
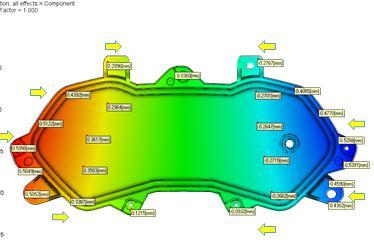
Deflection plots due to differential shrinkage alone are plottedinX,Y&Zdirectionsindividuallyasshown.
The deflections in X(figure 9) direction are +0.6mm and0.59mm which are symmetric as desirable, moreover maximumdeflectionsareobservedinareasfurtherfromgate duetolackofpacking.Howeverthesedeflectionsarewithin thelimitsofallowableshrinkagesderivedfromDFMEA. The maximumdeflectionsinYdirection(figure10)are+0.35mm and-0.38mmwhicharebothsymmetricandwithinlimits. Deflections in Z direction (figure 11) are more in thicker regionswhichareexplainedaslackinpropercoolingtime, also the flappy parts are therefore designed with ribs to minimize warpage in Z direction, maximum values of deflectionsobservedare+0.23mmand-0.14mmwhichare withinlimit.
Materialsusuallyexhibitafixedmeltingtemperaturesfor polymersthetemperatureatwhichhardglassystateofan amorphousmaterialchangestorubberystateiscalledasthe glasstransitiontemperatureTg.Asthetemperatureofthe materialreachedTgitsbehaviorchangesfromviscoelasticto viscoplastic. The Tg value of our chosen PMMA grade is 117℃butsinceourcomponentisexposedtotemperatures muchbelowtheTgmaterialnonlinearityisunaccountedfor andlinearstaticanalysisiscarriedout.Moreover,sincethe rise in temperature induces softness and hence a drop in yieldstressaFOSof2isareasonableparametertoaccount forinouranalysis.
International Research Journal of Engineering and Technology (IRJET) e-ISSN: 2395-0056
Volume: 09 Issue: 09 | Sep 2022 www.irjet.net p-ISSN: 2395-0072
Loadingandboundaryconditionsareasfollows,
From the customer specifications and DFMEA done the tightening torque values at the Speedometer assemblyvehiclemountinglocationshavebeentakenas1.3 Nm.The poission’s ratio of 0.35, yield stress and Young’s modulus havebeenderivedfromthematerialdatasheet. BETA CAR ANSA hasbeenusedforPre-processingandmeshingwitha globaledgelengthof2mm, MSC FEA 2020 hasbeenusedas solverandpostprocessor.
Tocalculatetheequivalentclampingforceasaconsequence ofthetighteningtorqueiscalculatedas
Where,
T=Tighteningtorque
K=Constantbasedonboltmaterial
d=Nominaldiameterofthebolt
I=Lubricationfactor.
Onenteringtherelevantvaluesweget F= 1300 N
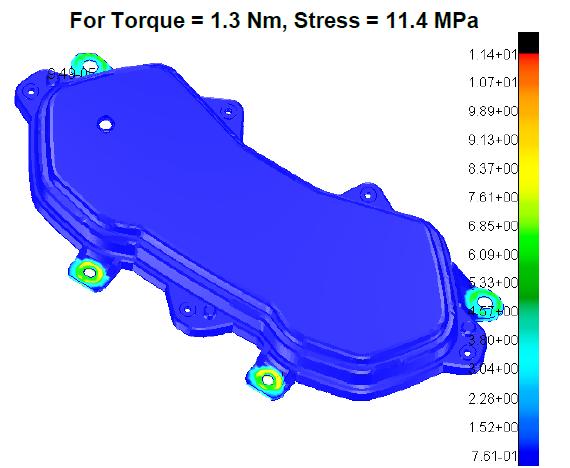
TheVonmisesstressinducedasaconsequenceoftightening areshowninthefigure14.
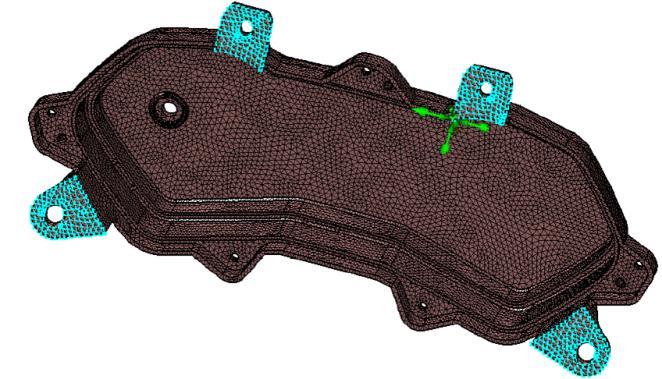
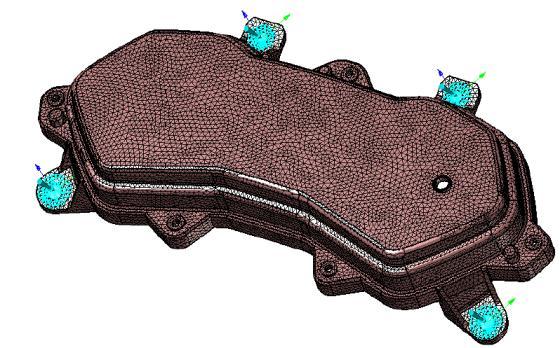
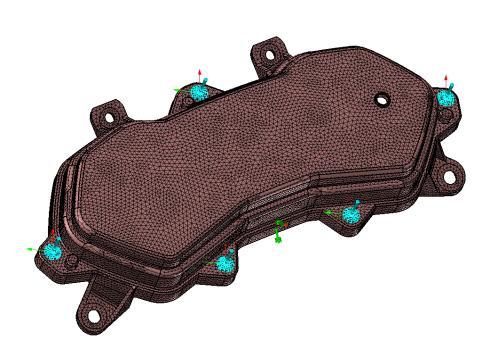
Thefigure12showsthe4mountinglocationsatwhichthe 1300N equivalent clamping force has been applied using NASTRANbasedRBE2Stiffeningelementswithsalvenodes takenatwasher.Theboundaryconditionsareusedtoarrest the6DegreesoffreedomontheclassBsurfaceofthelensas showninfigure13.
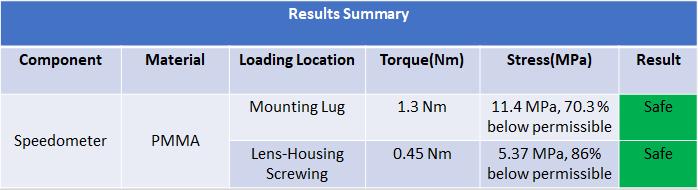
Themaximumstressvaluesobservedare11.4MPawhich arebelowthepermissiblelimitby70%calculatedusinga factorofsafetyof2.
At the 5 self-tapping screw locations a similar static structural analysis is carried with the same meshing conditions, the equivalent clamping force however is calculatedusing, Where, p-Pitch
µ1-Frictioncoefficientatscrew-lenssurface µ2-Frictioncoefficientatscrew-casingsurface
����-nominaldiameterofscrew
��ℎ-Diameterofcasingsurface
����-Diameteroflenssurface
����ℎ-Diameterofscrewheadbottom.
Puttinginthevaluesforatighteningtorquevalueof0.45Nm andfrictioncoefficientof0.7theequivalentclampingforce F= 250N
TheloadingconditionsusingtheRBE2elementsareshown in figure 15 while the arrested degree of freedom class B surfaceisshowninfigure16.
International Research Journal of Engineering and Technology (IRJET) e-ISSN: 2395-0056
Volume: 09 Issue: 09 | Sep 2022 www.irjet.net p-ISSN: 2395-0072
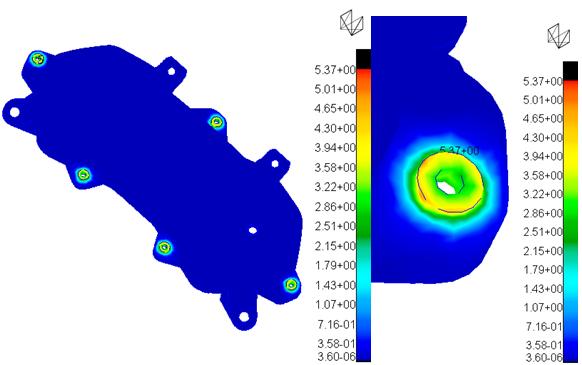
The Von mises stress generated as a consequence of this tighteningtorqueisshowninfigure17,
ThemaximVonmisesstressvalueis5.37MPawhichiswell belowthepermissiblelimitby86%
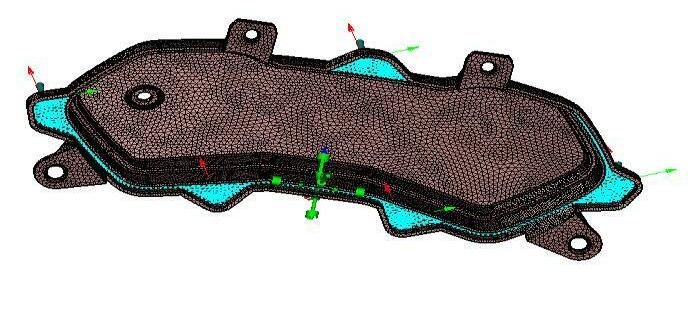
For the modal analysis materials are assigned to the different components of the speedometer assembly in the CATIAV5software.Anequivalentmassof173gramsofthe internal subassemblies is placed on the center of gravity. Using the BETA CAE ANSA meshing is carried out for the LensandthehousingwithNASTRANbasedRBE3elements connectingtheequivalentmassestothehousingmounting locationsasshown,
The4vehicle-speedometerassemblymountinglocationsare connectedusingRBE2elements.Carryingoutthefree-free modalanalysisallthe6degreesoffreedomarearrestedat thepointtoavoidthefirst3rigidbodymotionaccountingas modalfrequenciestobe0.Thefree–freemodalanalysiswas carried out using BETA CAE EPILYSIS as solver and BETA CAE META as post processor. The resulting modal frequenciesareobservedandfrequencieswithin50-500Hz are of further investigation based on the test standards employedbythecustomer.Thetablebelowgivesthemodal frequencyoutput, Mode Frequency(Hz) 1 382.03 2 517.46 3 710.50 4 767.20 5 785.77 6 857.45 7 922.67 8 1070.51 9 1132.33 10 1223.40
Modalfrequencyofinterestwithintherangeof50-500Hzis 382.03Hz.
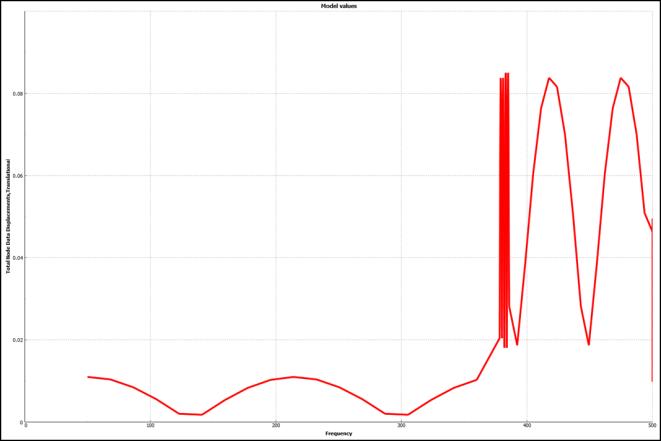
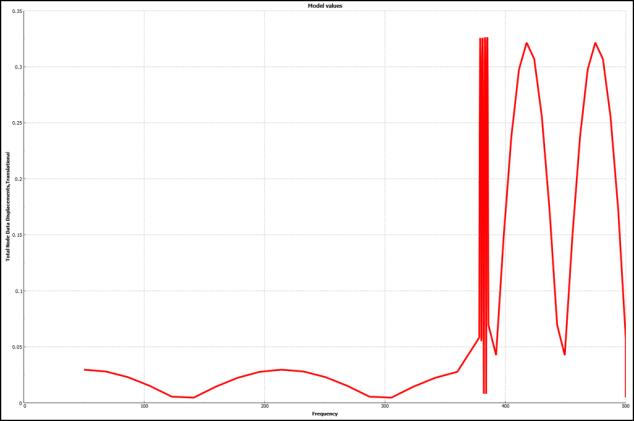
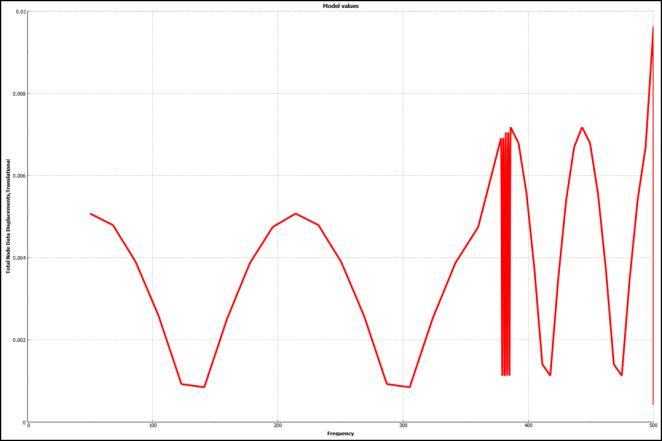
Theharmonicresponseofthespeedometerislens-housing andequivalentmasssubassemblyiscarriedoutwith10gof acceleration in X,Y,Z directions individually at frequency ranges of 50-500Hz and first modal frequency using dampingratioof5%.
International Research Journal of Engineering and Technology (IRJET) e-ISSN: 2395-0056
Volume: 09 Issue: 09 | Sep 2022 www.irjet.net p-ISSN: 2395-0072
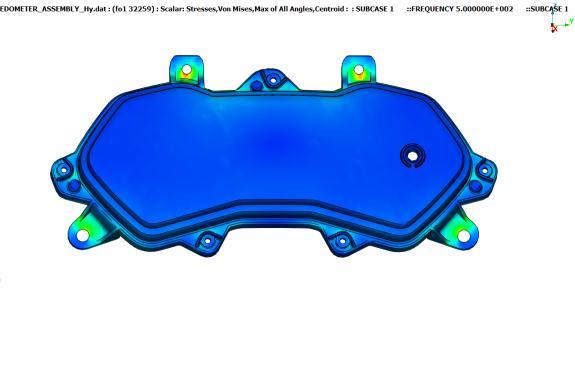
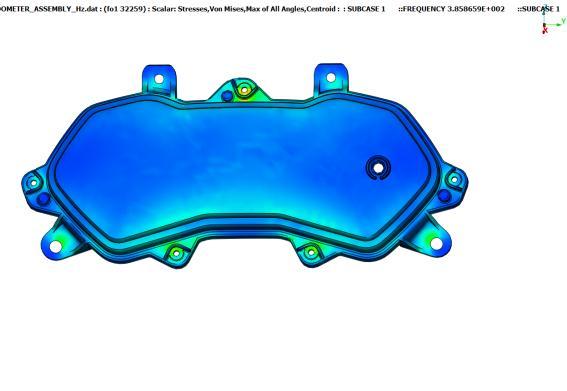
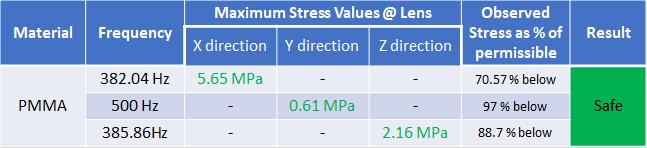
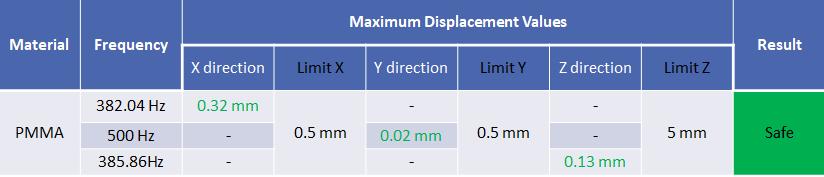
TheallowabledeformationsintheX&Ydirectionare0.5mm whileintheZdirectionis5mmasmentionedintheDFMEA. Moreover,thestressinducediscomparedagainstthefatigue limit value of σy /4 for our chosen PMMA grade. The softwaredisplaysthefrequencyatwhichthedeformationis maximum.FortheXdirectiontheresponseofthesystemis maximum at 382.03 Hz and the stresses generated are shownbelow,
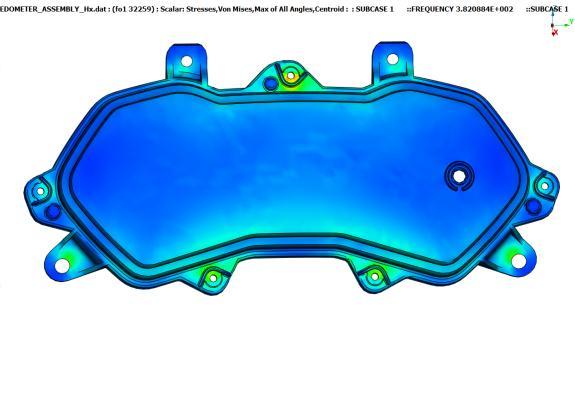
Similarly, the response of the system is maximum in Z directionatafrequencyof385.86Hz.Thevalueofmaximum displacementsobservedatthisfrequencyare0.13mmwhich is below the permissible limit of 5mm moreover the resulting stresses at this frequency on the lens amount to 2.16MPawhichisbelowthefatiguelimitby88.75%.The aboveisshowninfigures21and22respectively.
ThemaximumvalueofdisplacementobservedinXdirection is 0.32 mm which is below the limit of 0.5mm while the stressesgeneratedasshowninfigure18are5.65MPawhich isbelowthematerialfatiguelimitby70.57%.
TheMaximumdisplacementsoccurringinYdirectiontake place at frequency of 500Hz while the maximum stresses generated on the lens amount to 0.61 MPa only both of which are under the permissible limit. They have been showninfigures19and20respectively.
International Research Journal of Engineering and Technology (IRJET) e-ISSN: 2395-0056
Volume: 09 Issue: 09 | Sep 2022 www.irjet.net p-ISSN: 2395-0072
Based on risk assessment derived from DFMEA static structuralanalysiswascarriedoutfortighteningtorqueat2 locationsnamelyvehicle-speedometerassemblymounting locationsandlens-housingsubassemblyself-tappingscrew locations.Afactorofsafetyof2waschosenforthesame.The resultsofbotharerepresentedinatabularformatbelow.
A thorough understanding of the general material requirements for the Lens was established and different amorphous polymers were studied for their thermo mechanicalproperties,safetyratings,opticalpropertiesand environmental degradation retarding properties etc. An AMECAlistengradeofPMMAwaschosenasourmaterialof choice. With the chosen material Mold Flow analysis was carriedouttoestablishmoldingparametersandtocheckfor any mold defects that could hamper the aesthetic region, followingresultswereobtainedfromthemoldflow.
The single cavity old is filled with PMMA in 2.62 secondswithnoshortshot.
Themaximumpressureduringinjectionisfoundto be101.2MPawhichiswithinmachinelimit.
Temperatureatflowfrontrisesby10.6℃withno drop observed below the melt temperature of 235℃
Requiredclampingforceis138tonnes.
Shearratesarewithinmateriallimitandprominent atthegatearea.
Airtrapsarefoundattheendfill locationsandat theweldlinelocations.
Weldlinesareunavoidableandvisiblebutstrongas temperature at front doesn’t fall below melt temperature.
Volumetric shrinkage is found varying due to variablepartthickness.
Deflectionobserved(InXdirectionis+0.60mm&0.59mm); (In Y direction is +0.35mm and0.38mm); (In Z’ direction is +0.23mm and0.14mm).
Afree-freemodalanalysiswascarriedoutwithmeshedlens andhousingwithanequivalentmassplacedatCglocation, thefirst10modalfrequencieswerecalledfortheresults.By thecustomerprovidedteststandardonlyfrequencieswithin 50-500Hzrangewereofinterest.Thefirstmodalfrequency of 382.05 Hz fell within this range. Further harmonic response wascarried outwitha 10gaccelerationvalue in X,Y,Z directions within the frequency range of interest including the first modal frequency. The results of the harmonicresponseareshownintabularformatinthefigure below.
[1] F.V.Loocket.AlDeformationandfailuremapsofPMMA inuniaxialtension,EngineeringDepartment,Cambridge Univeristy,April2018M.Young,TheTechnicalWriter’s Handbook.MillValley,CA:UniversityScience,1989.
[2] D.G. Gilbert, M.F. Ashby, P.W.R. Beaumont, Modulusmapsforamorphouspolymers,J.Mater.Sci.21(1986) 3194–3210.K. Elissa, “Title of paper if known,” unpublished.
International Research Journal of Engineering and Technology (IRJET) e-ISSN: 2395-0056
Volume: 09 Issue: 09 | Sep 2022 www.irjet.net p-ISSN: 2395-0072
[3] W.M. Cheng, G.A. Miller, J.A. Manson, R.W. Hertzberg, L.H. Sperling, Mechanical behaviour of poly(methyl methacrylate),J.Mater.Sci.25(1990).
[4] J.E. Mark, Physical Properties of Polymers Handbook, 3rdEd.,CambridgeUniversityPress,2003.
[5] G. Buisson, K. Ravi-Chandar, On the constitutive behaviour of polycarbonate under large deformation, Polymer(Guildf).31(1990)2071–2076.
[6] L.S.Asmithet.AlTheeffectofwateronglasstransition temperatureofpolymethylmethacrylate,Aachen11th April1998.
[7] Reimschuessel, H.K., 1977. Nylon 6.Chemistry and mechanisms. Journal of Polymer Science: MacromolecularReviews,12(1),65-139.
[8] K.P.Menard,DynamicMechanicalAnalysis:Apractical introduction,Bocaraton:CRCpressLLC,1999.
[9] V.Shaktawat,N.Jain,N.S.Saxena,K.B.SharmaandT.P. Sharma,J.Poly.Sci.SeriesB49,236-239(2007).
[10] M.Dixit,V.Shaktawat,K.B.Sharma,N.S.SaxenaandT.P. Sharma, “Mechanical Characterization of Poly methyl methacrylate and Polycarbonate Blends” in Thermophysical Properties of Materials and DevicesNCTP '07, edited by P. Predeep et al., AIP Conference Proceeding1004,AmericanInstituteofPhysics,Melville, NY,2008,pp.311-315
[11] S. Agarwal et. Al Investigation of thermo-mechanical properties of PMMA,.,Semi conductor and Polymer ScienceLaboratory,UniversityofRajasthan,2010.
[12] J.Rosler,H.Harders,M.Ba€ker,Mechanical behaviour of polymers, Mechanical Behaviour of Engineering MaterialsMetals,Ceramics,Polymers,andComposites, Springer,Berlin,2007.
[13] E.M. Arruda, M.C. Boyce, R. Jayachandran, Effects of strain rate, temperature and thermomechanical coupling on the finite strain deformation of glassy polymers,Mech.Mat.19(1995)193e212.
[14] A.D. Mulliken, M.C. Boyce, Mechanics of the ratedependent elasticeplastic deformation of glassy polymers from low to high strain rates, Int. J. Solids Struct.43(2006)1331e1356.99[15]ISO527-1,Plastics Determination of Tensile Properties - Part 1: General Principles,ISO,2012.
[15] S. Ataya et.al Temperature Dependent Mechanical Behavior of PMMA: Experimental Analysis and Modelling,April2017
[16] Henzi P, Rabus DG, Bade K, Wallrabe U, Mohr J. Proc. SPIE2004;5454:64-7
2022, IRJET | Impact Factor value: 7.529 | ISO 9001:2008 Certified Journal |