International Research Journal of Engineering and Technology (IRJET) e-ISSN: 2395-0056

Volume: 09 Issue: 09 | Sep 2022 www.irjet.net p-ISSN: 2395-0072
International Research Journal of Engineering and Technology (IRJET) e-ISSN: 2395-0056
Volume: 09 Issue: 09 | Sep 2022 www.irjet.net p-ISSN: 2395-0072
1Lecturer, Dept. of Civil Engineering, Leading University, Sylhet-3112, Bangladesh,
2Professor, Dept. of Civil and Environmental Engineering, Shahjalal University of Science and Technology, Sylhet3114, Bangladesh,
3Graduate, Dept. of Civil and Environmental Engineering, Shahjalal University of Science and Technology, Sylhet3114, Bangladesh
4Graduats, Dept. of Civil and Environmental Engineering, Shahjalal University of Science and Technology, Sylhet3114, Bangladesh ***
Abstract - Geotechnical modeling requires precise measurement of soil deformation to be effective. Understanding the final collapse process of a geotechnical structure depends on measuring gross deformations. A geotechnical model's post-test excavation often allows for the observation of gross or ultimate displacements. These measures serve as a "before" and "after" snapshot of the model, enabling estimation and calculation of the failure mode. Currently, a grid of target markers placed in a plain of exposed soil is tracked via a series of video shots. The analysis of distorted paths for various soil forms using a cheap, adaptable technology is described in this study. It allows for non-contact assessment of soil deformation at pre-failurestrainlevelswithouttheneedfortargetmarkers. This system combines digital photography and image analysis. It finally will lead to getting a better understanding of competent soil formation which is required to meet the ever-growing need for rehabilitation andexpansionofcivilinfrastructures.Fromthestudy,itcan be summed up, which formation of soil is better for foundation design and decisions can be made about differentsoilimprovementtechniquesfor differentsoilsand soil formations. This study helps to conclude with different numeric data that all sandy soil formation is the best for foundations as the deformation width is higher, resulting in less settlement whereas all clayey formation is the worst case.
World Bank) and the infrastructure investment has reached $6 billion in 2016-17 from $2 billion in 2011-12 (The Daily Star 2017). To fulfill the constantly expanding requirements of society, civil infrastructure must be renovatedandexpanded.However,thecapacitytodosois directly impacted by the availability of suitable soils. The assessment of large deformations is often essential to comprehending the eventual process of collapse of a geotechnical structure [1]. Serviceability state design necessitates an understanding of settlements and ground developmentsatsignificantlylowerstressesincontrastto the substantial deformations found in the extreme state [1]. Compressive and elastic stresses, which often appear when soil shears, are the cause of the deformation observedinthesoil[2].Becausesoilsensorscan'tprovide a continuous view of the intentional continuum, model studies to measure three-dimensional deformation patterns inside a soil mass are constrained. Additionally, soilsensorsexhibitstaticanddynamicpropertiesthatare distinctfromthoseofthesurroundingsoils,changinghow thedeliberatecontinuumresponds[3]
Imaging technologies are progressively being utilized to consider numerous geotechnical issues. For instance, a framework was created to consider the conveyance of voidsinsoilexamples[4].AVisionConehaslikewisebeen createdforin-situsoilinvestigation,andprocedureswere createdtoutilizeitscaughtpicturesinsoilportrayal[5].
Population and civil infrastructure continue to expand at an unprecedented rate. The population of Bangladesh (about 163 million) is growing at an annual rate of 1.1% (2016) (Population and growth rate of Bangladesh 2016-
For analyzing the distorted path, many organizations and scientistshavetriedtodeveloptoolsandmethods.Among these, one of the most reliable techniques is the “Digital Image Correlation (DIC)” process. “Digital image correlation (DIC)” is a distortion estimation method in progressively boundless use over a wide scope of experimental mechanics research disciplines [6], [7]. In recentyears,thegeotechnicalengineeringcommunityhas adopted digital image correlation methodologies,
International Research Journal of Engineering and Technology (IRJET) e-ISSN: 2395-0056
Volume: 09 Issue: 09 | Sep 2022 www.irjet.net p-ISSN: 2395-0072
providing professionals with a revolutionary tool for the visualizationoffailureprocessesandtheevaluationofsoil and soil-structure interaction behavior in physical model experiments [8]. But a few things can alter how precise and accurate DIC is. Some of them are subset surface and size,camera commotion, thedecisionof subpixel addition conspires, and the camera geometry mistakes related to without-of-plane development, self-warming, and the complexities of mentioning objective facts through thick transparentwindows[8]
The first measurements of displacements inside a soil mass were made by Gerber (1929) using an X-ray approach in which led bullets are implanted in the soil model.Progressiveradiographsareacquiredtofollowthe passage of these markers in huge sand models and shear devices to determine incremental strain patterns. [9] Through the use of large (2.0 m x 0.5 m) models, with an accuracy of 0.1 percent, the technology was successfully employed to produce volumetric strain and shear contours.[10]
Beginning in the late 1990s, researchers wound up mindful that DIC was likewise especially appropriate to geotechnical engineering applications [1], [3], [11]– [14]. Although the most well-known use of DIC in geotechnical engineering is geotechnical centrifuge modeling, which prohibits the exposure of radiographs in flight, choosing therightimagetextureformeasurementsinsoilswasone of the first tasks when applying DIC methods in geotechnical engineering measurement applications [1], [11] Modelerschangedtheapproachinsteadbyincluding atransparentwindowthatshowsthemodel'splanewhere the target markers are positioned. However, this transparent sidewall is required to have enough stiffness to simulate plane strain conditions under loading, leading totypicalacrylicwindowthicknessesofupto76mm.This large window causes extra refraction-related mistakes as well as changes the optics of errors brought on by out-ofplanedeformationandcameraself-warming.Additionally, the camera pieces will rotate and deflect concerning the measurement plane within the transparent window if the physical model test is carried out using the centrifuge modeling technique under enhanced gravity. This large window causes extra refraction-related mistakes as well aschangestheopticsoferrorsbroughtonbyout-of-plane deformationandself-warmingofthecamera.Additionally, the camera pieces will rotate and deflect concerning the measurement plane within the transparent window if the physical model test is carried out using the centrifuge modeling technique under enhanced gravity. It goes on to explain that if the camera lens is viewed as a cantilever beam, growing self-weight causes the lens body to deflect downwards whereas the scene in the image seems to move higher [12]. In-flight strain measurements are presented by Beasley (1973) and Mair (1979) to a
resolution of 1 percent, from a measurement accuracy of 100μm.[15],[16].
Video capture has lately been used to monitor deformations in centrifuge tests [17], and attempts have been made to assess triaxial test deformation using video footage [18]. The use of video photography can eliminate the requirement for the time-consuming calculation of exposed film. The image processing technique of centroiding may be used to evaluate the area of a large numberoftargetmarkers.Centroidingisaccountedforin thestatesofacommongeotechnicalmodelforidentifying target markers to an accuracy of 0.1 pixels [19]. Taylor et al. (1998) provide a centroiding-based estimate approach capableoftrackingthemovementof3mmdiametertarget markersimplantedinclaywithanaccuracyof60-105 μm over a 300 x 200 mm field of view [20]. Grant (1998) introduces an example of following displacement measurements as strain contours with a resolution of 1% [20],[21]
Particle Image Velocimetry is an alternate method for assessing soil deformation using a sequence of digitally acquired photographs (PIV). Particle Image Velocimetry (PIV) is a velocity-measurement technology that tracks texture patches through an image sequence [1]. This advancedvelocitymonitoringapproachoriginatedinfluid mechanics, where the flow field of a fluid may be investigatedbyseedingtheflowwithmarkerparticlesand following the movement of tiny patches within a broader picture [22]. Soil deformation can be thought of as a lowvelocity flow phenomenon. In fluid mechanics testing, polystyreneballsorcoloredpowderareintroducedtothe flow field to provide an identifiable texture for image processing.Naturalsand,ontheotherhand,hasitstexture in the shape of varied colored grains, as well as the light and shadow framed between continuous grains when illuminating a plane of granular material. Texture can be imparted to an exposed plane of clay by using colored 'flock'orfinesand.
TheParticleImageVelocimetry(PIV)approachissimilarly relevant to triaxial testing and has been demonstrated to have adequate resolution to quantify pre-failure stresses as well as the flexibility to record non-homogeneous deformations that are unseen to traditional transducers [11]
That’s why in this study, imaging technology was chosen for demonstrating the distorted path of different layered soil when the load was applied to the soil deposition. A high-resolutioncamera wasutilizedtocapturepicturesof the soil deposition before and then afterward the distortion. Next video editing process was performed to take snapshots at 5 seconds intervals of up to 30 seconds foranalyzingthedistortedpathofdifferentlayeredsoil.A model has been developed to measure deformations
2022, IRJET | Impact Factor value: 7.529 | ISO 9001:2008 Certified Journal | Page2
International Research Journal of Engineering and Technology (IRJET) e-ISSN: 2395-0056
inside different soil depositions. In this situation, an underlying reference pictureisutilizedtocatchthevisual appearance of the example surface before loading. Six pictures are then taken to catch the visual appearance of the distorted layers under load. The finding of the study should be applied to serving people to let them know about the settlement condition and distorted path of soil on which the superstructure will be constructed. The experiment was performed in “The Geotechnical EngineeringLaboratory”atShahjalalUniversityofScience and Technology, Sylhet, at the Department of Civil and EnvironmentalEngineering.Thesoilswerecollectedfrom the clay modelers. The tests were performed in a nonwater table and dry condition. The objective of this study wastodesignandfabricateacomprehensiveexperimental protocol to measure the settlement of soil deposition in different conditions by analyzing the distorted path of differentlayeredsoil.
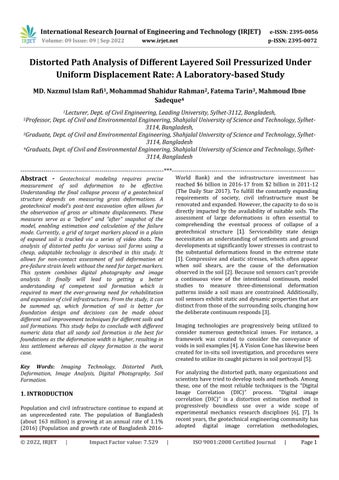
There were four main components of the proposed study such as i) design of the product ii) fabrication of the productandfinallyiii)Validationandiv)Applicationofthe product.Theflowdiagramofthegeneralframeworkofthe researchactivitiesisshowninChart-1
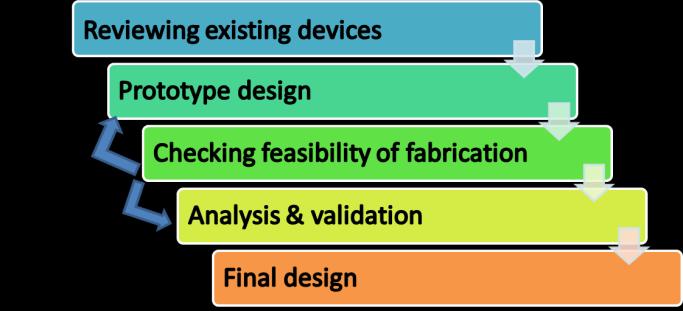
experimental model. The model is comprised of four transparentsideswhichhasholdtightusinganironframe. Thenathickironplatewasusedasafootingbywhichthe totalloadappliedwasimposedtothesampleformation.A frontviewofthechamberisshowninFig-1.
Atransparentchamberwasmadeusingsteelaroundits corner so that the chamber stays strong. The load was applied to the model along with the sample to check its validation and finally, after several trials, the required modelwasdesignedtoconductdifferenttestexperiments. As illustrated in Chart- 2 the flow diagram shows the designapproachforthefabricationofthemodel.
This part presents the product details of the experimental model for the tests. All the elements are enunciatedoftechnicalspecifications,instrumentaldetails, diagrams, images, and testing procedures. The device was planned to fabricate cost-effectively. Locally available commercial materials along with some commercial parts were used to build the setup. The model apparatus has someinternalandexternalsupportinggadgets.Theglasses were first made airtight using silica gel, then it was connected to the external frame to give them a firmer structure.Theframesteelwas1inchinthicknessandfully polished and painted. On the other hand, a footing was made using a thick iron. The thickness of around 10mm. Theframe'sdimensionsasfirstcalculated are10inchesin length,8inchesinheight,andwidthtobe4inchesin.The glass thickness was 10 mm high-quality glass. The glasses areattachedattheinsideoftheframemakingaclearspace of 9-inch length and 3.5-inch width. Thus, the footing is madeofawidthof3.5inchesand2inchesinlength,sothat itcanhelpinbulgingthesoilwhentheloadwasapplied.
Thewholeapparatuswasdesignedkeepinginmindthe real-world scenario and real-world soil stratification and formation.Theloadwasappliedsimilarlytoo

Some factory-made materials and tools were also used to maintain the serviceability and precision of the
The 10 mm glasses on the four sides make easily visible the deformation when the load is applied. The glasses were made airtight using silica gel and then connected to theinsideofasteelframewhichwasmadeofthick1-inch
Volume: 09 Issue: 09 | Sep 2022 www.irjet.net p-ISSN: 2395-0072 © 2022, IRJET | Impact Factor value: 7.529 | ISO 9001:2008 Certified Journal | Page3
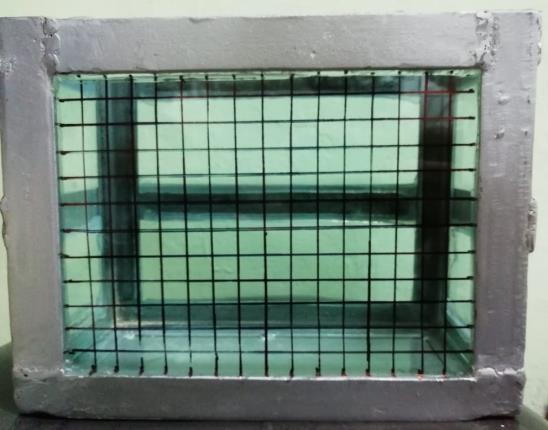 Chart -1: Generalframeworkoftheresearchworks
Fig-1: FrontviewoftheModel
Chart -1: Generalframeworkoftheresearchworks
Fig-1: FrontviewoftheModel
International Research Journal of Engineering and Technology (IRJET) e-ISSN: 2395-0056
Volume: 09 Issue: 09 | Sep 2022 www.irjet.net p-ISSN: 2395-0072
steel. These steels were welded together and formed a structureofcontainers.Theglasscontainerwasputinside ofit.
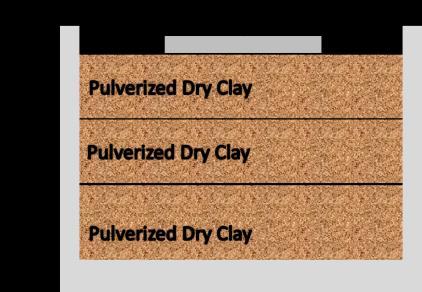
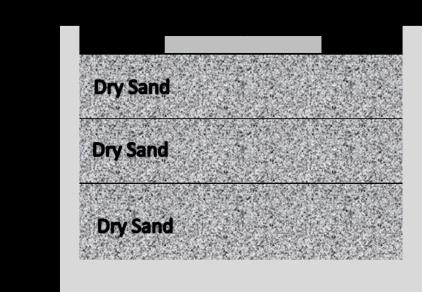
Once the model was set up, it was time for the soil layers to be put in and applied load. The pulverized clay was collected from sand modelers. Those were some packs of clays. Those were ground first then oven-dried to get the requiredpulverizedclay.Andtheothersandwasthesand oftheShariRiverwhichisnormallyusedforthefilling-up process.Itwassievedandovendriedandthenputintothe experiment.
After calculation, the properties of dry sands for the researchwerefound.
DryUnitWeight=26.095kg/m3
SpecificGravity=2.66
From the grain size distribution curve, it can be said that the particle size distribution of sand is wellgraded.
The density of 1 layer of sand to be put in the experimentalsetup=0.024kg/m3
2.3.3
After calculation, the properties of pulverized clay for the researchwerefound.
DryUnitWeight=26.487kg/m3
SpecificGravity=2.70
PlasticLimit,PL=22.7%
LiquidLimit,LL=56.26%


PlasticityIndexPI=33.56%
Densityof1layerclayis=0.016kg/m3
A high-resolution mobile camera was used to video shoot the loading and with a tripod to remove the shakiness of the video. Later video analysis was done on adobe premiere pro software and finally, analysis was done on thestillimageswhichwerecapturedfromthevideo.
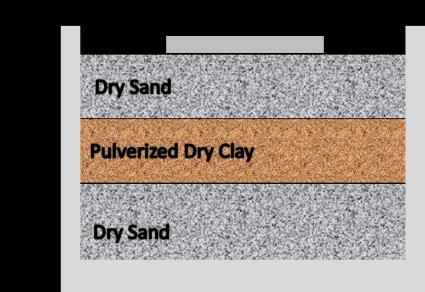
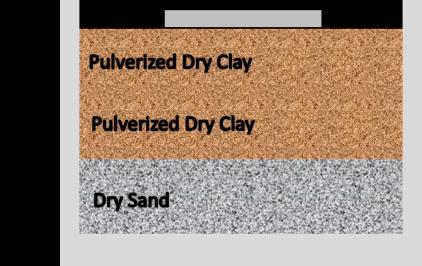
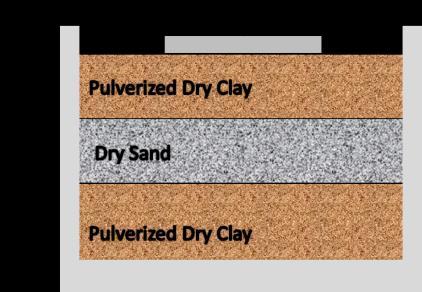
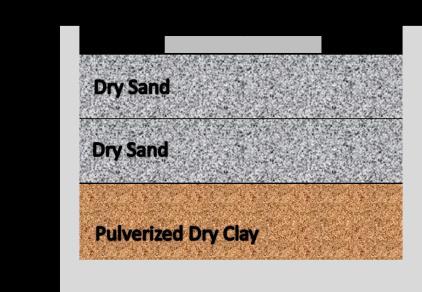
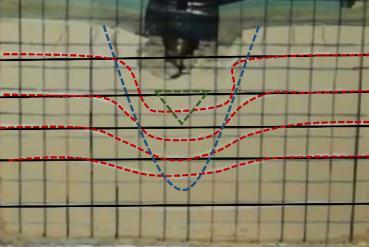
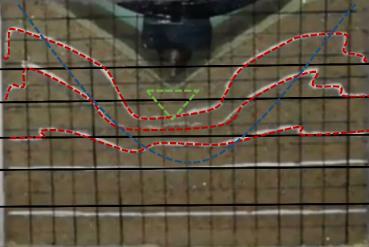
To observe the distortional behavior closely, the soil was putintotheexperimentwithdifferentformations,keeping the real-world scenario in mind. In the Fig-2, the red demarcation line denotes the deformation at the joint of the layers. The blue line denotes the general shear failure path, and the green line denotes the direction of the
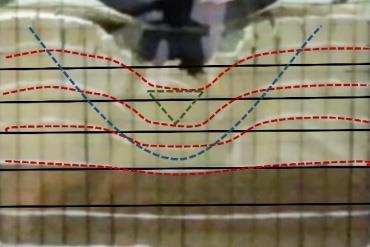
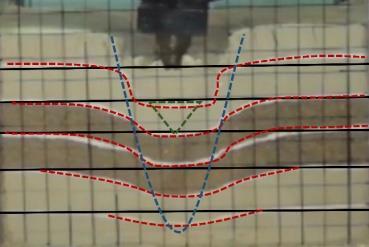
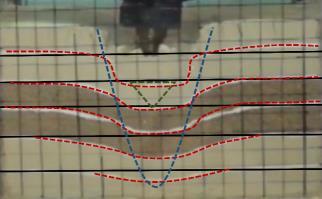
punching
2022, IRJET | Impact Factor value: 7.529 | ISO 9001:2008 Certified Journal |
International Research Journal of Engineering and Technology (IRJET) e-ISSN: 2395-0056
Volume: 09 Issue: 09 | Sep 2022 www.irjet.net p-ISSN: 2395-0072
So, the whole clayey layer is not at all suitable for foundations whereas the whole sandy layer is the best fittedandperfectzoneforthefoundation.
Cases
1 2 3 4 5 6
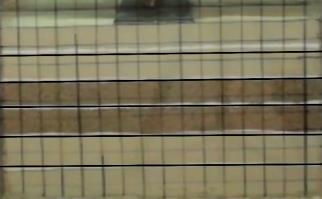
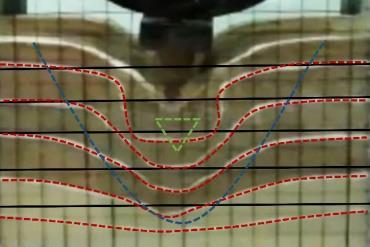
Fig-7: Case5Soilformationandfailure.
15 Sec
Maximum heave height(Inch)
0.5 0.5 0.25 0.25 0.5 0.25
Theoffsetofmaximum heaveheight(inch) 2 2 1 1 2.5 1.5
Overall width of deformation zone (inch) 5 4 3.5 3 7.5 2
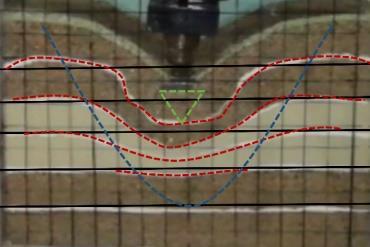
Fig-8: Case6Soilformationandfailure.
The figures show the deformation behavior from snapshots taken during each test at 5, 10-, 15-, 20-, and 25-secondsdisplacement,andthedeformationbehaviorin eachinstancewaspreciselyobservedduringeachtest.The maximum vertical height of the heave, the offset of this maximum height from the edge, and the width of the deformationwerenotedduringtheexperiment.
Between the models, a clear piece of glass with a printed grid was used to help scale the geometry of the deformation behavior, with each square on the grid measuring 0.5 inches by 0.5 inches, and the deformation valuesareshowninTabl-1
From the calculations, while summing up it can be said based on the width of the deformation zone because the morethewidthofthedeformation,thelessthesettlement makesthedistributionofloadtoagreaterarea.
Case 5 gives the most definitive result and shows deformations in such a way that it proves that it is the most suitable in the real-world scenario. As the width of thedeformationisthehighestinchisabout8inches.
Andcases4and6givetheworstresultasthewidthofthe deformation zone is the lowest and resulting in more settlementinadefinitearea.
25 Sec
Maximum heave height(Inch)
1 1 0.5 0.5 1 0.5
Theoffsetofmaximum heaveheight(inch) 2.5 2.5 1.5 1.5 3 3
Overall width of deformation zone (inch) 6 5 3.5 3 8 3
Importantfindingsofthestudycouldbelistedbelow This study proposed a unique idea to design a costeffective experimental setup in the laboratory using locallyavailablematerials.
It also described a simple procedure to find out the competent soil formation by checking the distorted path after the load is applied using imaging technologies.
The developed tool can give an assumption of the real-worldscenarioandthesettlementofthesoil.
The tool can finally be used as a powerful tool for studyingdeformationinsidesoilsnon-intrusively.
While summing it can be said based on the width of the deformation zone because the more the width of the
International Research Journal of Engineering and Technology (IRJET) e-ISSN: 2395-0056
Volume: 09 Issue: 09 | Sep 2022 www.irjet.net p-ISSN: 2395-0072
deformation, the less the settlement makes the distributionofloadtoagreaterarea.
Thewholesandysoillayersgivethemostdefinitiveresult andshowdeformationsinsuchawaythatitprovesthatit is the most suitable in the real-world scenario. As the width of the deformation is the highest inch is about 8 inches.
And the whole clayey layers give the worst result as the width of the deformation zone is the lowest and resulting inmoresettlementinadefinitearea.
So the whole clayey layer is not at all suitable for foundations whereas the whole sandy layer is the best fittedandperfectzoneforafoundation.
[1] D.J.White,M.D.Bolton,D.J.White,W.A.Take,and M. D. Bolton, “Measuring soil deformation in geotechnical models using digital images and PIV analysis SEE PROFILE Measuring soil deformation in geotechnical models using digital images and PIV analysis,” pp. 997–1002, 2001, Accessed: Aug. 31, 2022. [Online]. Available: https://www.researchgate.net/publication/23726 2677
[2] R. Jewell, “Soil reinforcement with geotextiles,” 1996, Accessed: Aug. 31, 2022. [Online]. Available: https://agris.fao.org/agrissearch/search.do?recordID=US201300016528
[3] S. Sadek, M. Iskander, J. L.-J. of computing in civil, and undefined 2003, “Accuracy of digital image correlation for measuring deformations in transparent media,” researchgate.net, 2003, doi: 10.1061/(ASCE)0887-3801(2003)17:2(88).
[4] J. Frost, C. K.-G. T. Journal, and undefined 1996, “Automated determination of the distribution of local void ratio from digital images,” astm.org, Accessed: Aug. 31, 2022. [Online]. Available: https://www.astm.org/DIGITAL_LIBRARY/JOURN ALS/GEOTECH/PAGES/GTJ10334J.htm
[5] S. A. Raschke and R. D. Hryciw, “Vision Cone Penetrometer for Direct Subsurface Soil Observation,” Journal of Geotechnical and Geoenvironmental Engineering,vol.123,no.11,pp. 1074–1076, Nov. 1997, doi: 10.1061/(ASCE)10900241(1997)123:11(1074).
[6] B. Pan, K. Qian, H. Xie, and A. Asundi, “Twodimensional digital image correlation for in-plane displacement and strain measurement: A review,”
Meas Sci Technol, vol. 20, no. 6, 2009, doi: 10.1088/0957-0233/20/6/062001.
[7] M. Sutton, J. Orteu, and H. Schreier, Image correlation for shape, motion and deformation measurements: basic concepts, theory and applications. 2009. Accessed: Aug. 31, 2022. [Online]. Available: https://books.google.com/books?hl=en&lr=&id=Al kqMxpQMLsC&oi=fnd&pg=PA1&dq=Image+correl ation+for+shape,+motion+and+deformation+meas urements.+&ots=5WjU9aDD3H&sig=vHurSKgnNUxM9eAoMLmODy0wpo
[8] W. A. Take, “Thirty-sixth canadian geotechnical colloquium: Advances in visualization of geotechnical processes through digital image correlation,” CanadianGeotechnicalJournal,vol.52, no.9,pp.1199–1220,Feb.2015,doi:10.1139/CGJ2014-0080.
[9] K.R.-Civ.E.Publ.W.Rev.andundefined1963,“The determination of strains in soils by an X-ray method,” ci.nii.ac.jp, Accessed: Aug. 31, 2022. [Online]. Available: https://ci.nii.ac.jp/naid/10012319105/
[10] R. James, “Stress and strain fields in sand,” 1965, Accessed: Aug. 31, 2022. [Online]. Available: https://www.repository.cam.ac.uk/handle/1810/ 283746
[11] D.J.White,M.D.Bolton,D.J.White,W.A.Take,and M. D. Bolton, “Measuring soil deformation in geotechnical models using digital images and PIV analysis SEE PROFILE Measuring soil deformation in geotechnical models using digital images and PIV analysis,” pp. 997–1002, 2001, Accessed: Aug. 31, 2022. [Online]. Available: https://www.researchgate.net/publication/23726 2677
[12] D. J. White, W. A. Take, and M. D. Bolton, “Soil deformation measurement using particle image velocimetry (PIV) and photogrammetry,” Geotechnique,vol.53,no.7,pp.619–631,2003,doi: 10.1680/GEOT.2003.53.7.619.
[13] D.White,W.Take,…M.B.-P.ofthe,andundefined 2001, “A deformation measurement system for geotechnical testing based on digital imaging, close-range photogrammetry, and PIV image analysis,” researchgate.net, 2001, Accessed: Aug. 31, 2022. [Online]. Available: https://www.researchgate.net/profile/DavidWhite-
38/publication/303190522_A_deformation_measu
© 2022, IRJET | Impact Factor value: 7.529 | ISO 9001:2008 Certified Journal | Page6
International Research Journal of Engineering and Technology (IRJET) e-ISSN: 2395-0056
ring_system_for_geotechnical_testing_based_on_dig ital_imaging_close_range_photogrammetry_and_PI V_image_analysis/links/5743188008aea45ee84b1 940/A-deformation-measuring-system-forgeotechnical-testing-based-on-digital-imagingclose-range-photogrammetry-and-PIV-imageanalysis.pdf
[14] A.Rechenmacher,R.F.-G.T.Journal,andundefined 2004, “Digital image correlation to evaluate shear bandingindilativesands,” astm.org,Accessed:Aug. 31, 2022. [Online]. Available: https://www.astm.org/DIGITAL_LIBRARY/JOURN ALS/GEOTECH/PAGES/GTJ11263J.htm
[15] D. H. Beasley, “Centrifugal testing of models of embankments on soft clay foundations CambridgeUniversityPhDthesis,”1973.
[16] R. Mair, “Centrifugal modelling of tunnel constructioninsoftclay,”1980,Accessed:Aug.31, 2022. [Online]. Available: https://www.repository.cam.ac.uk/handle/1810/ 283790
[17] H. Allersma, … H. S.-I. conference, and undefined 1994, “Using image processing in soil mechanics,” pascal-francis.inist.fr, Accessed: Aug. 31, 2022. [Online]. Available: https://pascalfrancis.inist.fr/vibad/index.php?action=getRecord
Detail&idt=6347543
[18] R. Chaney, K. R. Demars, M. T. Obaidat, M. Taleb Obaidat, and M. F. Attom, “Computer vision-based techniquetomeasuredisplacementinselectedsoil tests,” researchgate.net, 1998, doi: 10.1520/GTJ10422J.
[19] J.Chen,S.Robson,M.A.R.Cooper,andR.N.Taylor, “An evaluation of three different image capture methods for measurement and analysis of deformation within a geotechnical centrifuge,” International archives of photogrammetry and remotesensing,vol.31,no.B5,pp.70–75,1996.
[20] R. Taylor, R. Grant, S. Robson, J. K.-C. 98, and undefined 1998, “An image analysis system for determining plane and 3-D displacements in soil models,” pascal-francis.inist.fr, Accessed: Aug. 31, 2022. [Online]. Available: https://pascalfrancis.inist.fr/vibad/index.php?action=getRecord Detail&idt=6214398
[21] R.Grant,“Movementsaroundatunnelintwo-layer ground,” 1998, Accessed: Aug. 31, 2022. [Online]. Available: https://openaccess.city.ac.uk/id/eprint/7569/
[22] R. A.-A. review of fluid mechanics and undefined 1991, “Particle-imaging techniques for experimental fluid mechanics,” academia.edu, Accessed: Aug. 31, 2022. [Online]. Available: https://www.academia.edu/download/73332358 /fb3231b36d942b6ff1dacb8df68a6df9c9b0.pdf
Volume: 09 Issue: 09 | Sep 2022 www.irjet.net p-ISSN: 2395-0072 © 2022, IRJET | Impact Factor value: 7.529 | ISO 9001:2008 Certified Journal | Page7