International Research Journal of Engineering and Technology (IRJET) e-ISSN: 2395-0056

Volume: 09 Issue: 08 | Aug 2022 www.irjet.net p-ISSN: 2395-0072
International Research Journal of Engineering and Technology (IRJET) e-ISSN: 2395-0056
Volume: 09 Issue: 08 | Aug 2022 www.irjet.net p-ISSN: 2395-0072
1Research Scholar, Department of Computer Science, OPJS University, Churu, Rajasthan, India
2Associate Professor, Department of Computer Science, OPJS University, Churu, Rajasthan, India ***
Abstract - A new information source for data mining techniques has emerged: Twitter. An important information source for gauging public opinion on topics ranging from politicstocurrentfashiontrendsistweets.Citizenscanexpress their ideas on social media platforms without danger. Due to the viral nature of social media, there is an increasing feeling of urgency to grasp public opinion. Making sense of these crowd dialogues is necessary for engaging in meaningful discourse. In a research called sentiment analysis (SA), sentiments are calculated for a conclusion. SA is applicable wherever as the public's opinion on a range of topics may be gauged. Since a few decades ago, a vast quantity of data has been produced online, and it is growing quickly. Manually categorizingbrieftextdocumentsfrombothonlineandoffline sources have grown more challenging. In this context, we are examining words with unigrams and bigrams feature extraction forsentiment. Inthisarticle,welookattheissue of classifyingtheemotionofEnglishTwitterpostsusingmachine learning methods. Weusevariousfeatureselectionstrategies in this study, including Chi-square (CHI), Information Gain (IG), Symmetric Uncertainty (SU), Correlation-based Feature Selection (CFS) and Gain Ratio (GR). The classification is performed using Naïve Bays Multinomial (NBM), 5-NN, Sequential Minimal Optimization (SMO) and REPTree, providedbywekatool. Wealsolookintothefinestfeaturefor gleaned thoughts from reviews. Based on each classifier's output, the results for unigram and bigram features were compared. In comparison to unigram features experimental findings indicated that bigram features achieved the highest accuracy of 85.83% with 5-NN algorithm.
Key Words: Data Mining; Feature Selection; Unigrams; Bigrams; Feature Extraction
Asignificantamountofdataisproducedeachdayinthe global and digitalized world due to the rising usage of community,socialnetworking,andmicrobloggingwebsites and portals. Today's world has made using the internet easier.Ithasfundamentallyalteredhowindividualsseeand reacttothedailyhappeningsandproblems.Throughonline discussion,socialmediaposts,andothermeans,peoplemay exchange ideas and stay in touch. Deep learning has increased the popularity of twitter sentiment analysis. Microblogging websites are crucial for assembling vast
amountsofinformation.Onsocialnetworkingsites,millions of people express their thoughts on a range of subjects. Thesemicrobloggingplatformsforceuserstobesuccinctly expressive in their remarks or ideas because to the 280charactermessageconstraint[1, 12,7]. Twitter isa social networking platform with approximately 200 million members,ofwhichmorethanhalfareactive.Moreoverhalf of twitter users who log in daily send out more than 200 milliontweets[6].Tweetsthatmaybeevaluatedrepresent the opinions of the general public. These publicly voiced opinionsarecrucialtobusinessesseekingfeedbackontheir goods,topoliticiansseekingtoanticipateelectionoutcomes, and to investors seeking to forecast stock prices. In this studies used unigrams, bigrams feature extraction to categoriseattitudesaspositiveandnegative[10].Alongwith microblogging traits, they retrieved lexical features and mechanically categorised Twitter sentiments. Positive or negative messages were assigned to the messages. Their architecture comprised two independent parts, classifiers and feature extractors, which used machine learning methodsforsentimentanalysistoattainimprovedaccuracy. Asaresult,sentimentanalysisofusertweetscanbeusefulin a variety of contexts. It is nearly hard to manually extract such valuable information from this vast amount of data. Positiveandnegativeemotionsmayallbeclassified,which aidsindetermininghowthegeneralpopulationfeelsabout certain issues. The objective of this study is to identify feelings from tweets as precisely as feasible [12]. In this study, the training data for each tweet has a class label. Followingtheapplicationofseveralclassifierstothetraining dataset, including Naïve Bayes Multinomial (NBM), 5-NN, SMO,andREPTree,themodelisthenfedthetestingtweets. Thus, with the aid of trained classifiers, the tweets are divided into positive and negative. Our goal is to evaluate various classifiers' performance using the twitter dataset. This work provides a unigrams and bigrams feature selectionstrategyforcategorisingtextsentimentdatathat takestheseconcernsintoconsideration.Filter-basedfeature selectionapproaches,suchasChiSquare(CHI),Information Gain (IG), Symmetric Uncertainty (SU), Correlation Based Feature Selection (CFS) and Gain Ratio (GR) have been effectively used because to their simplicity and relatively goodperformance[3,4,5].Theoutcomesoftheexperiments suggestthattheunigramsandbigramsmayidentifyresilient andusefulfeatures[8,45].
International Research Journal of Engineering and Technology (IRJET) e-ISSN: 2395-0056
Volume: 09 Issue: 08 | Aug 2022 www.irjet.net p-ISSN: 2395-0072
Themaincontributionsoforthisstudyishighlightedas follows:
i. Usethetop-rankedfeaturesfromthetwitterdatasetto comparethecategorizationaccuracybyusingunigramand bigramfeatureextraction.
ii. Using the twitter dataset, propose a framework for twittertextsentimentanalysisbasedonunigramandbigram features.
iii. Based on our dataset, examine the effectiveness of four classification algorithms for sentiment analysis of tweets[13].
Thefollowingishowthepaperissetup:theremainderof this work is divided into the following sections: Section 2 described the Literature Review. The methodology is presentedinSection3.Theexperimentalsetupdescribedin Section 4. The Experimental Results and Discussion is presented in Section 5. The conclusion is presented in Section6.
Why feature extraction techniques are necessary: In order to create results for the test data, machine learning algorithmslearnfromapredefinedsetoffeaturesfromthe training data. However, the primary issue with language processing is that machine learning techniques cannot be usedtodirectlyhandlerawtext.So,toturntextintoamatrix (orvector) offeatures, weneedcertain feature extraction algorithms. Among the most often used techniques for featureextractionare:Bag-of-WordsandTF-IDF.
Bag of Words: Bag-of-Words is one of the most basic processesforconvertingtokensintoacollectionoffeatures is the use of words. Each word is utilised as a feature to train the classifier in the BoW model, which is used to categorisedocuments.Forinstance,thepresenceofterms like "fantastic" and "great" in a sentiment analysis task based on reviews suggests a favourable evaluation, whereasthepresenceofphraseslike"annoying"and"bad" indicatesanegativeassessment.ABoWmodeliscreatedin threesteps:
a) text-preprocessing
b)createavocabulary
c)createamatrixoffeatures
Theorderinwhichwordsappearislostwhileusing thisapproachsincewegenerateavectoroftokensina randomizedmanner.However,bytakingintoaccountNgrams(mainlybigrams)ratherthanindividualwords,we canfixthisissue(i.e.unigrams).
TF-IDF Vectorizer: Termfrequency-inversedocument frequencyisreferredtoasTF-IDF.Itdrawsattentiontoa particular problem that might not come up often in our corpus but is really significant. The TF-IFD score rises in direct proportion to the frequency of a word in the documentandfallsindirectproportiontothenumberof documentsinthecorpusthatusetheterm.Itisdividedinto twosmallerportions,whichare:
a) TermFrequency(TF)
b) InverseDocumentFrequency(IDF) [20]
Recentyearshaveseenadramaticsurgeinthestudyof sentiment analysis (SA). The goal of SA is to categorise a text's emotion into positive or negative polarity. The necessityfortheindustrytounderstandconsumeropinions on their products via internet portals, blogs, discussion forums, and reviews, among other sources, is the driving force behind SA research. For a better sentiment classificationmethod,effectivefeaturesmustbeextracted [12].
Sentimentsencompassawiderangeofemotions,butin thisstudy,theyareonlyspecificallyreferredtoaspositive andnegative.Theselabelsserveasthebuildingblocksfor the sentiment analysis field, which broadens to include automaticallyassigningtheselabelstotextsbasedonone's knowledge and beliefs. On twitter, for instance, sentiment analysishasbeenusedtoascertainthetoneofdiscussions [2].However,theterminologyusedinnewsstorytitlesand social media articles differs. Unlike news story headlines, whichareshorterandmoreprofessional,communicationon socialmediaisfrequentlywrittencasuallyandaslengthier sentences.Textscanbecategorisedonseveraltextuallevels, fromsinglewordsandbriefsentencestowholemanuscripts. Unsupervised machine learning methods have shown promisefordocumentlevel categorization[37,22]. When they concentrated mainly on the subjective aspects of the texts, supervised ones had fared well [19]. Non-machine learningtechniquesforsentencelevelcategorizationhave beendeveloped.Eachwordcanbegivenapolarityfroman enlargedWordNet[17]thatwasstartedwithasmallnumber of core polarised terms [9] by part-of-speech tagging sentences.Then,thewordpolaritiesarejoinedtocreatethe phrasepolarity.Thecategorizationofphrasesandwordsis frequentlydoneusingpre-madelistsoftermsthathavebeen given a polarity [2]. For example the polarities are then modified to meet the situation, taking negations and expletives.
Feature selection is a crucial step in the algorithm training process. Algorithms must be taught based on the features.Featureselectionaimstochooseanidealsubsetof characteristicsbyremovingfeaturesthatareunnecessaryor providenomoreinformationthanthoseintheidealsubset. Forman [16] said that a variety of accessible feature selection strategies may be employed to eliminate
International Research Journal of Engineering and Technology (IRJET) e-ISSN: 2395-0056
Volume: 09 Issue: 08 | Aug 2022 www.irjet.net p-ISSN: 2395-0072
superfluousfeatureswhileenhancingclassifierperformance. LeeandPangPangandLee[18]effectivelycategorisepapers withaccuracyusingsentimentdatasuchas"thumbsup"or "thumbsdown."Guyonand Elisseeff[21]showedthatthe decrease of over fitting is a contributing factor in performance gains brought on by feature selection. Word polarity based on previous probability was used by Kouloumpis et al. [8] as an extra feature. In order to outperform unigrams in terms of accuracy, Saif et al. [36] looked into sentiment-topic characteristics and semantic features that may be employed in addition to unigrams. Sentimentcategorizationalsotakesintoaccountemotions. Emotionaltweetsareinterpretedasgoodfeelingswhereas negatively interpreted tweets are interpreted as positive sentiments. R. Bhayani and L. Huang [23] implement the methodsforthese.Inordertocategorisetweetsandinclude sentiment analysis classifier capabilities into web applications,Go,R.Bhayani,andL.Huang[23]lookedatthe twitter API. The best results for classifying tweets as subjective or objective were obtained, according to Chamlertwate et al. [25], by combining SVM with IG. However,theydidnotspecifyhowmanyfeatureswereused orwhichotherclassifierswereexamined.Inacomparable area of sentiment classification for movie reviews, Narayananetal.[26]carriedoutanexperimentillustrating the value of using feature selection; however they only examinedasingleranker,mutualinformation,usingNaïve Bayes. Kouloumpis et al. [8] look at the categorisation of emotionontwitter.TheyemployN-gramfeaturestocapture informationabouttheinformalandcreativelanguageused inmicroblogging,suchasemoticons,abbreviations,andthe presence of intensifiers. These features also contain a sentimentlexiconandpartofspeechcharacteristics.Their research demonstrates that qualities related to parts of speechreallyreduceperformance.Additionally,theyassert that components from an existing sentiment lexicon combined with micro blogging features were relatively beneficial. In this study, we make use of the manually categorisedtwitterdataset.WithNgrams,weemploythe salient feature selection approach. We evaluate the performanceoftheclassificationalgorithmsbypresenting variousfeatureselectionmethods[15].
In earlier research for sentiment categorization using machinelearningalgorithms,N-gramandtag-basedfeatures wereoftenemployed[14,27,28].N-gramfeaturesarewords where the letter “N” denotes the number of words in the feature. Words in tag-based features have their Part-ofSpeech(POS)orSentiwordnetscoresassignedtothem.The tagsmaybeutilisedbothinconjunctionwithfeaturesand justforfeatureselection.Unigrams,bigrams,andadjectives were employed as features in Pang et al. [29] machine learning-based sentiment analysis. On a dataset of movie reviews,theauthorsutilisedSVM,MaximumEntropy,and Naïve Bayes for classification. When employed with unigrams, binary weighting provided more accuracy than term frequency, while SVM provided the highest level of
precision.Forthepurposeofcreatingthefeaturevector,Pak and Paroubek [30] employed subgraphs that were taken fromthedependencytreeofaphrasethathadbeenparsed. Theyexperimentedwithmoviereviewsandfoundthatthe SVM classifier with subgraph-based features provided the greatestresults.Onthemoviereviewdataset,Nguyenetal. [31]combinednovelrating-basedfeatureswithunigrams, bigrams,andtrigramstoincreasetheprecisionofdocumentlevel sentiment analysis. Hung and Alfred [61] employed phrase-basedfeatureslikebigramsandtrigrams,aswellas word-basedfeatureslikeunigrams,POS-basedfeaturesand sentiwordnet features. Massive feature sets present a challenge for machine learning-based sentiment categorization.Featureselectiontechniquesareutilisedto get rid of the unnecessary and redundant characteristics, whichhelpssentimentanalysisperformbetterintermsof accuracy and execution time. To decrease the size of the featurevector,severalresearchershaveworkedonfeature selection techniques as Document Frequency, Mutual Information,andInformationGain[11,16,32,33].Fisher's discriminantratioisabrand-newfeatureselectionmethod thatWangetal.developed[16].Itisbasedonbooleanand frequencydata.Accordingtothetrials,IGutilisinganSVM classifier performs worse than frequency-based Fisher's discriminantratio.ThehybridisedIG androughset-based featureselectionstrategyforsentimentanalysiswasputout byAgarwalandMittal [11,34].
Themostpopularmethodintheliteratureforhandling twitter sentiment analysis is to use machine learning algorithms [8, 23, 35, 36, 38]. Go et al., 2009 [39] groundbreaking work in this area involved the use of emoticons as noisy signals to acquire annotated training data. To create two-class sentiment classifiers, they experimented with SVM, Naïve Bayes, and Maximum Entropy classifiers and employed unigrams, bigrams, and POS tags as features. Their most accurate classifier, Maximum Entropy, had an accuracy of 83.0% and was trainedona mixofunigramsandbigrams. Theirfindings suggestthatmixingvariousn-gramfeaturelevelsimproves theperformanceoftheclassifiers.TheeffectivenessofPOS characteristics for classifying twitter sentiment has been highlycontestedintheliterature.PakandParoubek(2010) [40]demonstrated that the distributionofPOS tagsis not uniformamongdifferentsentimentclasses,whichsuggests that they can be used as discriminating features to train sentimentclassifiers.Goetal.(2009)[39]andKouloumpiset al. (2011) [8] concluded that POS features are not at all useful for classifying twitter sentiment. In the second strategy,POStagswereusedtotrainaNaïveBayesclassifier usingn-gramfeatures.Theydidnot,however,lookintothe extenttowhichaddingPOSelementstounigramsimproved performance[37].
2022, IRJET | Impact Factor value: 7.529 | ISO 9001:2008 Certified Journal | Page433
International Research Journal of Engineering and Technology (IRJET) e-ISSN: 2395-0056
Volume: 09 Issue: 08 | Aug 2022 www.irjet.net p-ISSN: 2395-0072
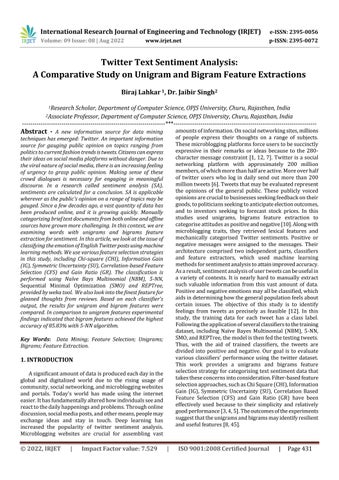
A framework based on unigram and bigram feature extraction is proposed with the goal of improving classification results in order to conduct experiments on twitterdataset.Anon-rankedfeaturecollectionisexamined using5featureselection/evaluationprocedures.Thereare hence five sets of ranked feature sets with various rank orderings. Figure-3.1 demonstrates each component and eachofthestepsthatgointotheproposedframeworkfor creatinganefficientpatterntoidentifysentimentintweets. The first stage is gathering twitter data from the publicly accessible website https://www.kaggle.com. For analysis, unigramandbigramfeaturesweregeneratedfromthisdata by preprocessing and annotation. Five feature selection techniquesareappliedtotheretrievedunigramandbigram featuresfromthedataset,andthetopfivefeaturesetswith various rank orderings are chosen. Then, results are produced using 4 distinct classification algorithms. The results are displayed depending on how well the chosen classificationalgorithmsperformed.
N Term 1 Unigram 2 Bigram 3 Trigram N N-gram
ItisreferredtoasaunigramwhenN=1,asisshownin thetableabove.ItisreferredtoasabigramwhenN=2,and soon.
Forexamplethesentence:“That’sanicepicture” Sl.No. Typesof GeneratedN-grams
1. Unigram [“that’s”,“a”,“nice”,“picture”]
2. Bigram [“that’sa”,“anice”,“nicepicture”]
3. Trigram [“that’sanice”,“anicepicture”]
The terms "unigram" and "bigram" and "trigram" respectivelydenotetakingonewordatatime,twowordsat atimeandthreewordsatatime.Inthiswork,weshallonly usebigramsuptoacertainpoint.
However,itiscrucialtotakethetimetolearnaboutthe ins and outs of this notion rather than passing it by as terminology since it will serve as the basis for comprehending more sophisticated natural language processingtoolsandprocedures.
The number of N-grams for sentence K would be as followsifX=NumofwordsinaparticularsentenceK:
NgramsK =X–(N-1)
Figure-3.1: Proposedframeworkfortweetssentiment
N-grams are continuous word, symbol, or token sequencesinatext.Theymaybedescribedtechnicallyasthe adjacentgroupsofitemsinadocument.Theyarerelevant fordoingNLP(NaturalLanguageProcessing)activitieson textdata.NismerelyavariableinN-gramsthatmaytakeon positiveintegervalueslike1,2,3,andsoon.Basically,"N" standsformany.
Dependingonthevaluethat'N'takes,thefollowingsorts ofN-gramsiscategorized
AstringofNwordsorcharactersisreferredtoasan"Ngram"simply.Intextminingandactivitiesinvolvingnatural language processing, N-grams of texts are frequently employed. They are essentially a collection of words that oftenappearinacertainwindow,andwhilecomputingtheNgrams,weusuallyadvanceoneword(althoughwecanmove Xwordsforwardinmoreadvancedscenarios).N-gramsare employed for a wide range of purposes. For instance, Ngramsareutilisedtocreatebigramandtrigrammodelsin additiontounigrammodelswhencreatinglanguagemodels. The creation of web scale N-gram models by Google and Microsoft allows for a range of activities, including text summarization,wordsplitting,andspellingcorrection.The development of features for supervised MachineLearning models like SVMs, MaxEnt models, Naïve Bayes, etc. is anotheruseofN-grams.Insteadofonlyusingunigramsin the feature space, the goal is to incorporate tokens like bigrams[41,42,43].
International Research Journal of Engineering and Technology (IRJET) e-ISSN: 2395-0056
Volume: 09 Issue: 08 | Aug 2022 www.irjet.net p-ISSN: 2395-0072
Featureselectionistheprocessofselectinganacceptable feature subset from a data collection so that classification algorithms can effectively deal with high-dimensional feature spaces. By removing redundant or unnecessary information,featureselectionalgorithmsaimtoreducethe training time needed to create a classification model [44]. Whilefilter-basedtechniquesassessthevalueandutilityof features based on heuristics and assessment metrics, wrapper-based approaches choose features based on the performance of a machine learning algorithm to improve prediction performance. The two types of filter-based featureselectionstrategiesareindividualfeaturemeasures and group feature measures [45]. Individual feature measures evaluate the worth of traits using a particular evaluationmetric.Basedonthesignificanceofthisstatistic,a ranking of the traits is established. Group feature measurements are used to evaluate the value of feature subsets. In terms of running time, individual feature measurements are more effective than group-based measures.Thissectionprovidesabriefdescriptionofeachof thefilter-basedmeasuresutilisedintheframework[12].
ChiSquareisafeatureselectiontechniquethatperforms quite well, particularly with multi-class data [46]. The techniquehasbeenappliedinavarietyofcontexts,including theclassificationoftumoursdetectionofnetworkintrusions, textcategorization,illnessdiagnosis,andothers[45,46,47, 48,49].ChiSquarecalculatesthestatisticalvalueshownin equation (2)to determine the strength of each feature's association[50].TheformulaforChi-squareTestis:
Xc 2 = …………….(2)
Where, c =Degreesoffreedom, O =ObservedValue, E = ExpectedValue
Additionally,usingthe Xc 2 valueinconjunctionwiththe ChiSquaredistributiontable,itispossibletocomputethe correlationofthesignificantvalue.Thefeaturehasastrong relevanceinthedata,orisanimportantfeature,ifthesigned valueislessthanacrisispoint,whichis0.05[50].
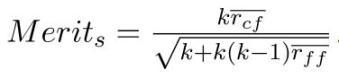
IGisafilterapproach.IGisaclassifieragnostic,itmaybe usedwithmanydifferentclassifiers.Basedonacertainclass, informationgaincanidentifythefeature(s)withthegreatest information.Thelikelihoodofaneventorattributeisusedto calculate the entropy, which is a measure of a class's uncertainty. It has a negative relationship to IG. A typical metric for assessing how well a word may be used for classification based on the information it can provide to
discriminateacrossclassesisInformationGain(IG)[14].It serves as a measure of the amount of information that a sentenceincludes[51].Theformulaisshownbelow[52].It is an entropy-based method for determining impurity for featurevalues.
I(Y; X) = H(X) + H(Y) – H(X, Y)
X and Y's combinedentropyis H(X, Y), where, Whenthepredictivevariable X iscontinuousratherthan discrete, the information gain of the corresponding class attribute Y iscalculatedbytakingintoaccountallpotential binary characteristics, XӨ that originate from X when a threshold Ө isseton X Ө takesvaluesfromallof X'svalues. Theinformationgainedisthensimply:[43]
I(Y; X) =argmax XӨ I(Y; XӨ)
3.2.3 Symmetrical uncertainty coefficient:
Inordertoassessredundancy,symmetricaluncertainty (SU)wasdefined:
IG(X|Y)=E(X)−E(X|Y) ……….(3) SU(X,Y)=2× .................(4)
IG(X|Y)
E(X)+E(Y)/
Where, IG(X|Y) is the information gained by X after viewingY,andE(X)andE(Y)aretheentropiesoffeaturesX and Y, respectively. To gauge the correlation between features,C-correlationandF-correlationaredefinedbased onSU.TheC-correlation,shownasSUi,c,istheSUbetween any feature Fi and the class C. The SU between any two featuresFi andFj(i≠j),representedbySUi,j,isknownasthe F-correlation[54].
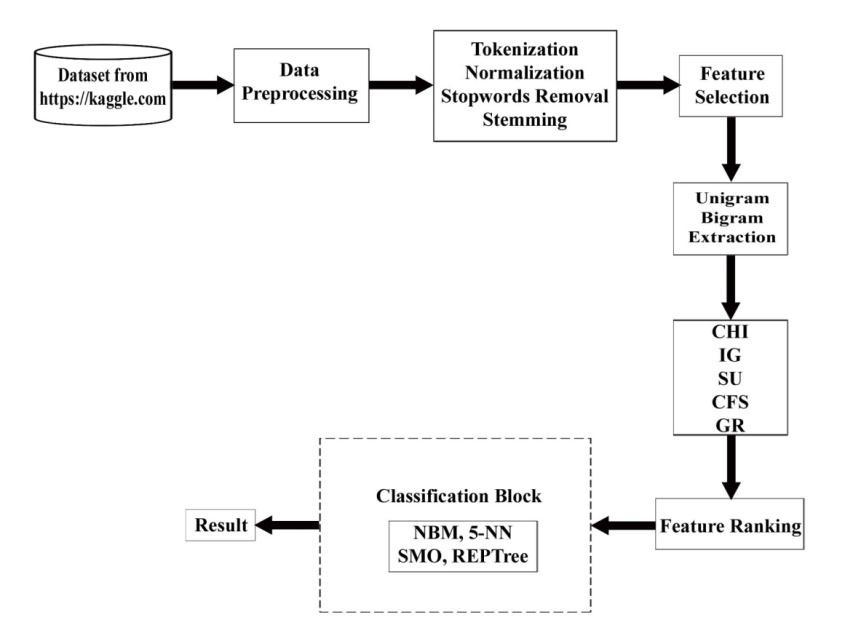
Since the correlation-based feature selection (CFS) technique is a filter method, it is unrelated to the chosen classificationmodel.Asimpliedbythename,correlations,it exclusivelyanalysesfeaturesubsetsbasedonintrinsicdata characteristics. Finding a featuresubset with low featurefeature correlation, which prevents redundancy, and high feature-class correlation, which preserves or boosts predictivepower,istheobjective.
To do so, the method uses the following equation to estimatetheworthofasubset s with k features:
International Research Journal of Engineering and Technology (IRJET) e-ISSN: 2395-0056
Volume: 09 Issue: 08 | Aug 2022 www.irjet.net p-ISSN: 2395-0072
Where,bar rff istheaveragefeature-featurecorrelation, bar rrf is the average feature-class correlation and k is the numberoffeaturesofthatsubset[55].
Gain Ratio introduces a balancing factor called the Intrinsic Information in an effort to reduce the bias of Information Gain on heavily branching predictors. The entropy of sub-dataset proportions is referred to as the intrinsic information. In other words, it refers to how difficultitisforustodeterminewhichbrancharandomly chosensampleisplacedin[53].
TheGainRatiois: Gain(Attribute)=
Fourpopularclassificationalgorithmswerelookedatto gauge the efficiency of FS approaches during the classificationprocess.NaïveBayesMultinomial(NBM),5-NN (k-nearestNeighborsclassifierwithk=5;referredtoas5NNinthiswork),SequentialMinimumOptimization(SMO) andREPTreeareallusedunlessotherwisestated.TheWEKA tool was used to create each and every classifier. Support vectormachinesarefrequentlytrainedusingSMO,whichis implementedbythewell-knownLIBSVMutility.KNNsare usedasinstance-basedlearningclassifiers.NBMforBayes' theorem,andREPTreeistree-basedapproaches.Thegoalof the classifier heterogeneity project is to examine the performanceofvariousFStechniques employingunigram and bigram feature extraction on several classifiers with variedfeaturerankingsizes.
For our testing, one tweet dataset, tweets.csv, was gathered from the publically accessible website https://www.kaggle.com. Obtaining data from an open datasetsourceinvolvesthreestages.Startbydownloading thedata asa CSVfilefrom theaforementionedURL.Next, transferthewholedatasetfromoneCSVfiletoanother.The datasetthenhastobeadjusted.Manypre-processingordata cleaningstrategieswereevaluatedonthetwitterdatasets once they were collected. The tweets.csv dataset contains tweetsduringthetimeperiodthatthenumberofCOVID-19 cases in India increased. From the beginning of the epidemic until April 28, 2021, tweets using the hashtag "covidindia" areincluded in thetweets.csv dataset. Each tweet contains 10 fields: created at, user id, username, name, location, tweet, language, replies count, hashtags, andsentiment.Thereare9655tweetstotal.Theemotion label has two possible values: NEGATIVE and POSITIVE.
Unigram(onewordinsideatweet'stext)andBigram(two words inside a tweet's text) were retrieved as features. After pre-processing the data and extracting it for our experiment, we had a dataset with 5054 instances and 1956 and 9932 features or attributes for Unigram and Bigram,respectively.
WEKA, a machine learning workbench, was utilised to design and evaluate our experiments. The University of Waikato in New Zealand offers the free service known as WEKA, or the "Waikato Environment for Knowledge Analysis."Avarietyoffeaturesandauser-friendlyinterface areavailableinthisworkbenchfordevelopingandanalysing machinelearningmodels[56].Theautomaticevaluationof essaysisoneofthemanyusesforthesemodels.Allofthe researchwasconductedusingalaptopmodelHP15-r006TU. ThelaptophasanIntel(R)Core(TM)i3-4010Uprocessor clocked at 1.70 GHz and 4 GB of RAM, however WEKA workbenchisonlyconfiguredtouse1GB.Windows764bit isthelaptop'soperatingsystem[57].
Weevaluateouralgorithmusingthefollowingcriteria:
4.3.1
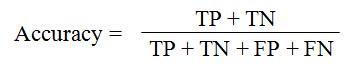
Therearenumerousapproachestocalculateaclassifier's accuracy,whichisthelikelihoodofaccuratelyguessingthe class of an unlabeled instance (Baldi et al., 2000) [58]. Classificationaccuracyisdefinedastheproportionofcases that a particular classifier properly classified, or as the numberofcorrectlyclassifiedreviewstothetotalnumberof reviews. It's expressed as a percentage. Four different classifierswereusedtoanalyseandrecordtheclassification accuracy of this feature subset for the evaluation. Here is howclassificationaccuracyisdefined:
In where TP stands for "True Positive," TN for "True Negative," FP for "False Positive," and FN for "False Negative".
One of the most prominent techniques frequently employedbydatascientistsisk-foldcross-validation.Itisa methodofdatapartitioningthatenablesustomakethemost use of our information to create a more comprehensive model.Anytypeofmachinelearninghasasitsmajorgoalthe creation of a broader model that can function well with unknowninput.Onthetrainingdata,aperfectmodelcanbe created with 100% accuracy or 0 errors, but it may not generalisetonewdata.Asaresult,itisapoormodel.The
International Research Journal of Engineering and Technology (IRJET) e-ISSN: 2395-0056
Volume: 09 Issue: 08 | Aug 2022 www.irjet.net p-ISSN: 2395-0072
trainingdataareoverfitbyit.Machinelearningisallabout generalisation;hencetheperformanceofthemodelcanonly beevaluatedusingdatapointsthatwerenotutilisedinthe trainingphase.Becauseofthis,wefrequentlydivideourdata intotrainingandtestsets.Theprocedureofdata splitting can be carried out more successfully with k-fold crossvalidation. We employed 10-Fold Cross Validation in our work[59,60] Thefittingoperationwouldbecarriedoutten timesusing10-foldcrossvalidation,witheachfitbeingmade on a training set made up of 90% of the total training set randomlychosenandtheremaining10%servingasahold outsetforvalidation.
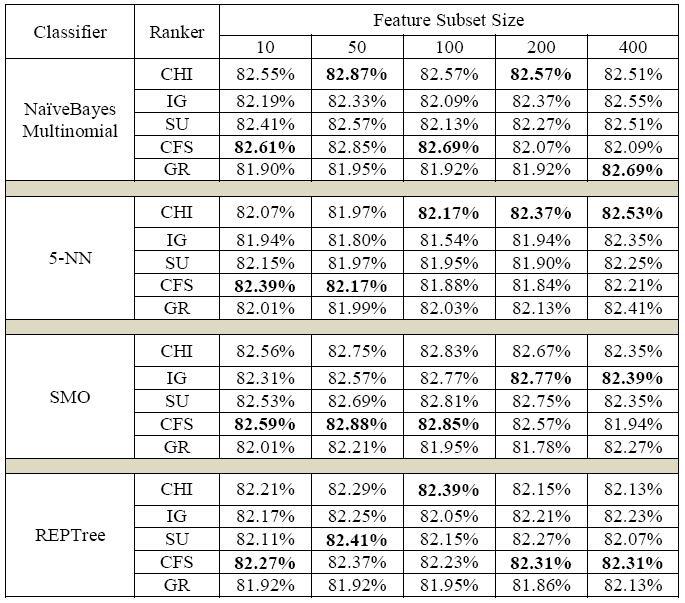
Bycontrasting unigramand bigram feature extraction, we assessed the effectiveness of our feature selection methodintermsofclassificationaccuracyusingfivefeature selection strategies. Refer to Tables 5.1 and 5.2 for our classification accuracy results using unigram and bigram featureextractionacrossourdataset,respectively.Foreach ofthefeaturerankers,weusedoneoffivetoprankedfeature subsetsizes:10,50,100,200,and400.Theselectionofthese metricswasmadetoaccountforarangeoffeaturesubset sizes. Bigram feature extraction has higher classification accuracy with five feature choices in our dataset than unigram feature extraction. The best model for each column's feature subset size in Tables 5.1 and 5.2 is boldfaced.Byutilisingall1956and9932featuresthatare accessible in our dataset, for unigram and bigram feature extractionrespectively,this makesitpossibleforunigram andbigramfeatureextractiontobesuccessful.
Table-5.1: ClassificationAccuracyResultsforunigram featureextraction
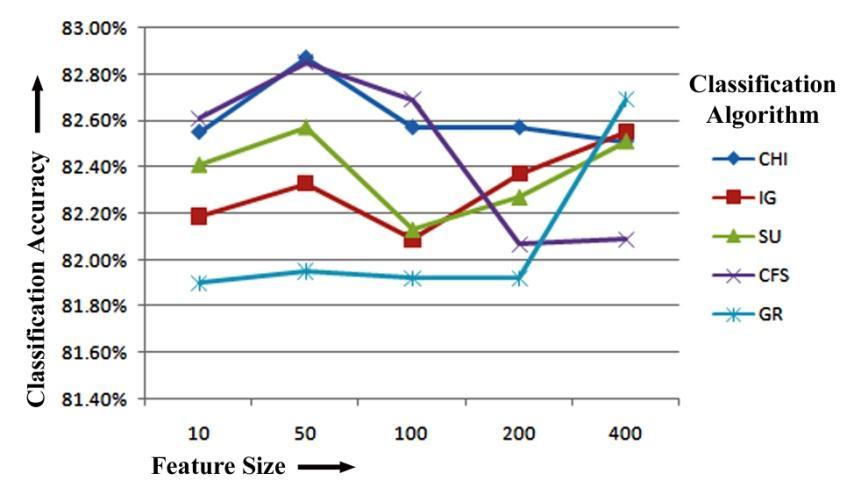
We'll start by looking at the Naïve Bayes Multinomial results.ItcanbeproventhatCFS,whentrainedusingNBM, hasthehighestclassificationaccuracyof82.61%forthetop 10featuresand82.69%forthetop100featuresforunigram featureextraction.Oncemore,whiletrainingwithNBMon 50 and 200 top features for unigram feature extraction, respectively,CHIhasthemaximumclassificationaccuracyof 82.87%and 82.57%. For unigram feature extraction train usingNBM,GRhasthemaximumclassificationaccuracyof 82.69% for the top 400 numbers of features. Figure-5.1 displays the Naïve Bayes Multinomial Classifier-based unigramfeatureextractionresultsoffivefeatureselection methodsforclassificationaccuracy.
Figure-5.1: ClassificationAccuracycomparisonoffive FeatureselectionMethodsforunigramfeatureextraction basedonNaïveBayesMultinomial(NBM)Classifier
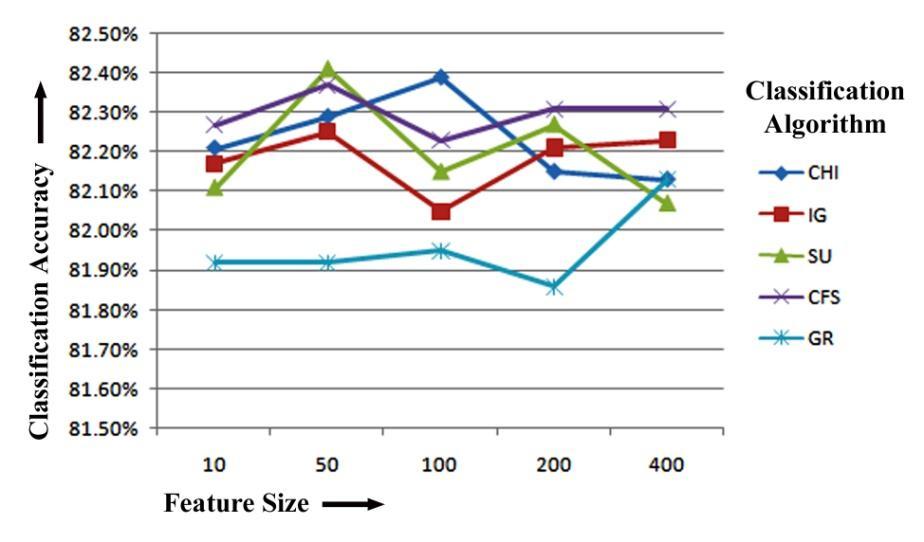
Wecanseefromthe5-NN classifier'sresults.Itcanbe proventhatCFS,whentrainedusing5-NN,hasthehighest classificationaccuracyof82.39%forthetop10featuresand 82.17% for the top 100 features for unigram feature extraction.Oncemore,whiletrainingwith5-NNon50,100 and200topfeaturesforunigramfeatureextraction,CHIhas themaximumclassificationaccuracyof82.17%,82.37%and 82.53%respectively.Figure-5.2displaysthe5-NNClassifierbased unigram feature extraction results of five feature selectionmethodsforclassificationaccuracy.
International Research Journal of Engineering and Technology (IRJET) e-ISSN: 2395-0056 Volume: 09 Issue: 08 | Aug 2022 www.irjet.net p-ISSN: 2395-0072
Figure-5.2: ClassificationAccuracycomparisonoffive FeatureselectionMethodsforunigramfeatureextraction basedon5-NNClassifier
Figure-5.4: ClassificationAccuracycomparisonoffive FeatureselectionMethodsforunigramfeatureextraction basedonREPTreeClassifier
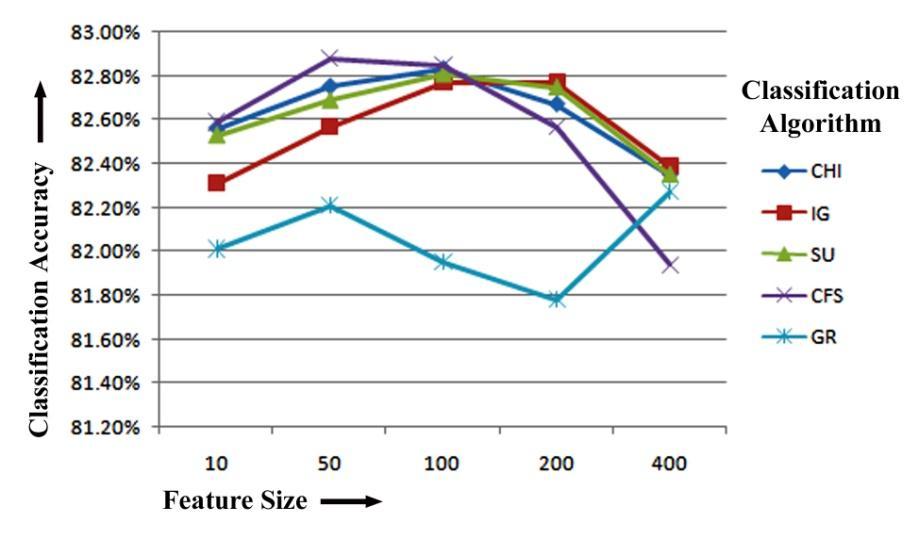
ItisclearfromtheSMOresultsthatCFS,whentrained usingSMO,hasthehighestclassificationaccuracyof82.59%, 82.88%and82.85%forthetop10,50and100featuresfor unigramfeatureextraction.Oncemore,whiletrainingwith SMO on 200 and 400 top features for unigram feature extraction; IG has the maximum classification accuracy of 82.77%,82.39%respectively.Figure-5.3displaystheSMO Classifier-based unigram feature extraction results of five featureselectionmethodsforclassificationaccuracy.
Figure-5.3: ClassificationAccuracycomparisonoffive FeatureselectionMethodsforunigramfeatureextraction basedonSMOClassifier
Table-5.2: ClassificationAccuracyResultsforbigram featureextraction
Finally,wecanseefromtheREPTreeclassifier'sresults thatCFShasthehighestclassificationaccuracyof82.27%, 82.31%and82.31%forthetop10,200and400featuresfor unigram feature extraction. Again, while training with REPTreeclassifieron50numbersoftoprankedfeaturesfor unigram feature extraction, SU has the maximum classification accuracy of 82.41%. CHI has the highest classification accuracy of 82.39% when selecting top 100 numbers of features. Figure-5.4 displays the REPTree Classifier-based unigram feature extraction results of five featureselectionmethodsforclassificationaccuracy.
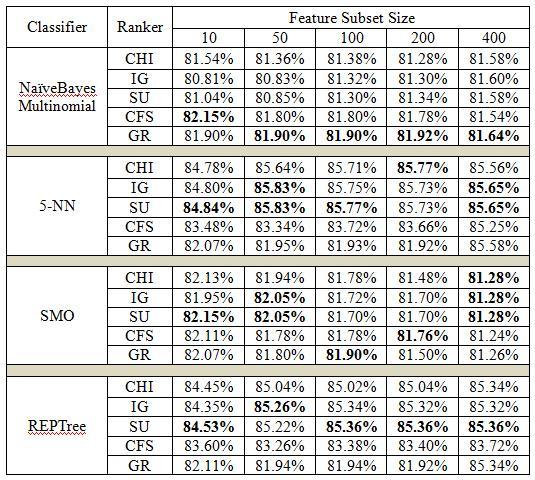
We'll start by looking at the Naïve Bayes Multinomial results.ItcanbeproventhatCFS,whentrainedusingNBM, hasthehighestclassificationaccuracyof82.15%forthetop 10featuresforbigramfeatureextraction.Oncemore,while training with NBM on 50, 100, 200 and 400 top ranked featuresforbigramfeatureextraction,GRhasthemaximum classification accuracy of 81.90%, 81.90%, 81.92%and 81.64% respectively. Figure-5.5 displays the Naïve Bayes Multinomial Classifier-based bigram feature extraction results of five feature selection methods for classification accuracy.
International Research Journal of Engineering and Technology (IRJET) e-ISSN: 2395-0056
Volume: 09 Issue: 08 | Aug 2022 www.irjet.net p-ISSN: 2395-0072
Figure-5.5: ClassificationAccuracycomparisonoffive FeatureselectionMethodsforbigramfeatureextraction basedonNaïveBayesMultinomial(NBM)Classifier
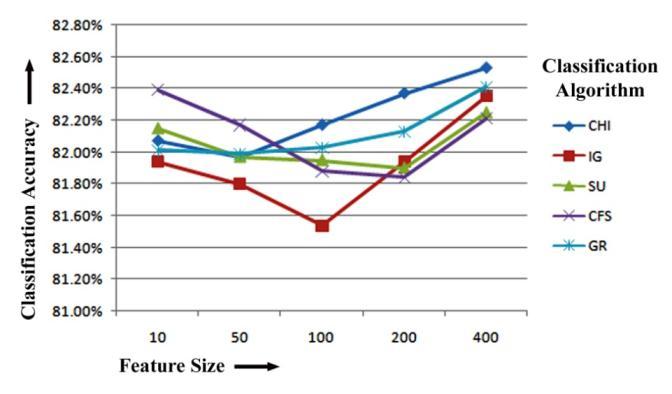
accuracyof81.76%whenpicked200toprankedfeatures. CHIhasthehighestclassificationaccuracyof81.28%when picked400toprankedfeatures.Figure-5.7displaystheSMO Classifier-based bigram feature extraction results of five featureselectionmethodsforclassificationaccuracy.
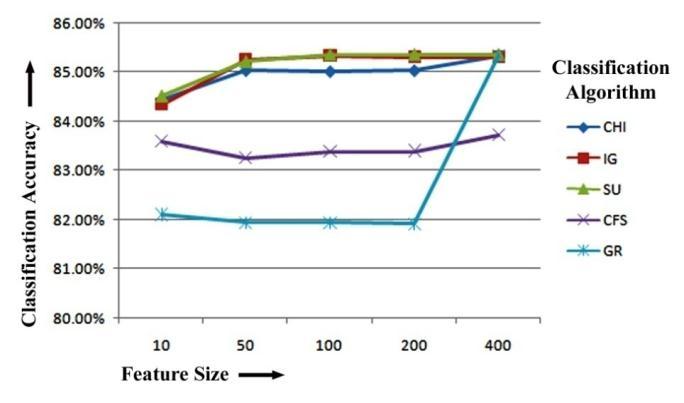
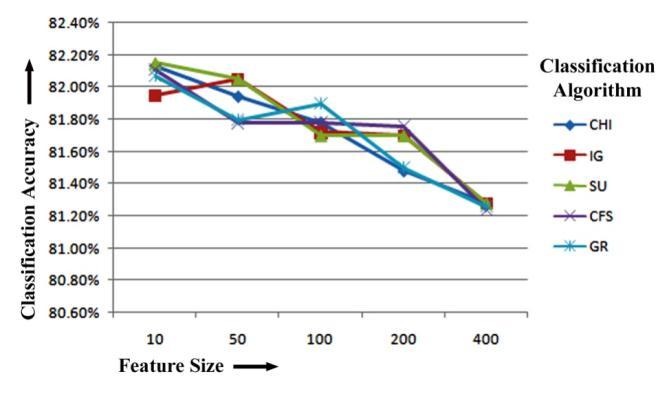
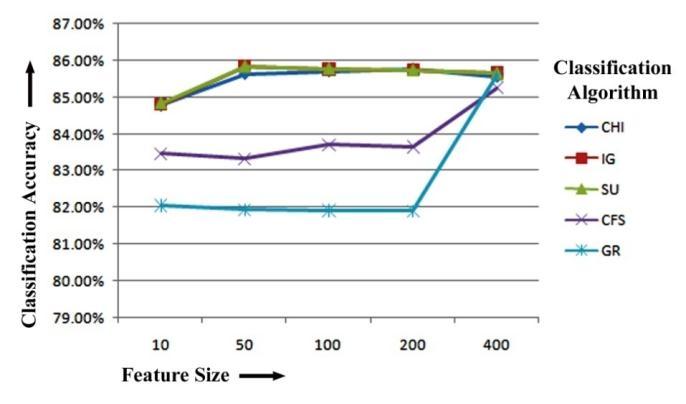
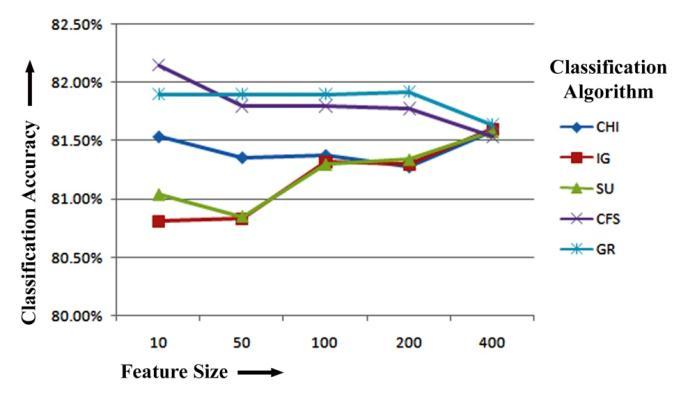
Figure-5.7: ClassificationAccuracycomparisonoffive FeatureselectionMethodsforbigramfeatureextraction basedonSMOClassifier
Wecanseefromthe5-NN classifier'sresults.Itcanbe proven that CFS, when trained with 5-NN, has the highest classification accuracy of 84.84%, 85.83%, 85.77% and 85.65%forthe10,50,100and400toprankedfeaturesafter bigramfeatureextraction.Again,whiletrainingwith5-NN on50and400topfeaturesforbigramfeatureextraction,IG has the maximum classification accuracy of 85.83%and 85.65% respectively. CHI has the highest classification accuracyof85.77%whenselecting200numberoffeatures trained with 5-NN classifier. Figure-5.6 displays the 5-NN Classifier-based bigram feature extraction results of five featureselectionmethodsforclassificationaccuracy.
Figure-5.6: ClassificationAccuracycomparisonoffive FeatureselectionMethodsforbigramfeatureextraction basedon5-NNClassifier
Finally,wecanseefromtheREPTreeclassifier'sresults that CU has the highest classification accuracy of 84.53%, 85.36%,85.36%and85.36%forthetop10,100,200and 400 features for bigram feature extraction. Again, while training with REPTree classifier on 50 numbers of top ranked features for bigram feature extraction, IG has the maximum classification accuracy of 85.26%. Figure-5.8 displays the REPTree Classifier-based bigram feature extraction results of five feature selection methods for classificationaccuracy.
Figure-5.8: ClassificationAccuracycomparisonoffive FeatureselectionMethodsforbigramfeatureextraction basedonREPTreeClassifier
ItisclearfromtheSMOresultsthatCFS,whentrained usingSMO,hasthehighestclassificationaccuracyof82.15%, 82.05%and81.28%forthetop10,50and400featuresfor bigram feature extraction. Once more, while training with SMO on 50 and 400 top features for bigram feature extraction, IG has the maximum classification accuracy of 82.05%,81.28%respectively.Fortopranked100features GRhasthehighestclassificationaccuracyof81.90%when trainedwithSMOclassifier.CFShasthehighestclassification
Theriseofsocialmedia,liketwitter,hasgivenindividuals a free platform to communicate their thoughts and sentiments.Thetremendousvolumesofopinionatedtweets
2022, IRJET | Impact Factor value: 7.529 | ISO 9001:2008 Certified Journal | Page439
International Research Journal of Engineering and Technology (IRJET) e-ISSN: 2395-0056
Volume: 09 Issue: 08 | Aug 2022 www.irjet.net p-ISSN: 2395-0072
thatareproducedontwitterencompasseveryfacetofour everyday life. Effective sentiment analysis of tweets can providehigh-qualityinformationonthepublic'sworriesand preferences. However, this effort is more difficult than in otherareaswherethecontentiswell-editedbecauseofthe informal andslanglanguage usedin twitteraswell asthe highfrequencyofmisspellings.Thevastmajorityoffeatures are produced via feature engineering techniques for categorising tweet sentiment. Furthermore, training classifiers on a sizable dataset is computationally challenging. The technique of feature selection, which has received little attention in tweet sentiment classification research,choosesthebestsetoffeatures,whichreducesthe dimensionalityofthedataset,lowerscomputationalcosts, andmayevenimproveclassification.Thisstudyexamined five filter-based feature selection algorithms using four distinctlearners.Fivedifferentfeaturesubsetsarechosen using these methods for a twitter dataset obtained from https://www.kaggle.com
Inthisstudy,wecarefullyassessedhowwellNBM,5-NN, SMO and REPTree classifiers performed when given the featuresextractedfromunigramsandbigrams.Accordingto the findings of our experiments, adding bigrams feature extraction consistently enhances the performance of the classier feature extraction when compared to unigrams feature extraction. The highest classification accuracy for unigram feature extraction is 82.88% when trained with SMOclassifierforthetop50features.Again,whenusingour datasetandtheREPTreeclassifiertrainedwith100,200,and 400toprankedfeatures,thehighestclassificationaccuracy was 85.36%. We also looked into how bigram properties affectedtheeffectivenessoftheclassification.Asaresult,we draw the conclusion that utilizing a bigrams feature extraction is an excellent but straightforward way to enhance twitter sentiment classifier performance, particularly if the training data is sparse. Therefore, to improve twitter sentiment performance, we recommend bigramfeatureextractionwithREPTreeclassifier.
The results of our work are encouraging, and other featureselectionstrategiesaswellastheusageofmorethan 400characteristicsshouldbeinvestigatedinfutureresearch. Todeterminewhetherthepatternsdiscoveredinthisstudy arealsoprevalentinotherdatasets,thisresearchshouldbe expanded to include other datasets. We'd want to incorporate stacking strategies to improve categorization performance.Bigramsandtrigramsareexamplesofthengram format, whereas Ranking Aggregation methods that use different classifiers are examples of the suggested featureselectiontechnique.
[1] Xia,R.,Zong,C.andLi,S.,2011.Ensemble offeature sets and classification algorithms for sentiment
classification. Information Sciences,181(6),pp.11381152.
[2] Agarwal, A., Xie, B., Vovsha, I., Rambow, O. and Passonneau, R., 2011. Sentiment Analysis of Twitter Data. Proceedings of the Workshop on Languages in Social Media,pp.30-38.
[3] Kumar, S., Singh, P. and Rani, S., 2016. Sentimental analysisofsocialmediausingRlanguageandHadoop: Rhadoop. 2016 5th International Conference on Reliability, Infocom Technologies and Optimization (Trends and Future Directions) (ICRITO),.
[4] Liu,B.,Blasch,E.,Chen,Y.,Shen,D.andChen,G.,2013. ScalablesentimentclassificationforBigDataanalysis usingNaïveBayesClassifier. 2013IEEE International Conference on Big Data,.
[5] Kotsiantis,S.,2007.SupervisedMachineLearning:A ReviewofClassificationTechniques. Proceedingsofthe 2007 conference on Emerging Artificial Intelligence Applications in Computer Engineering: Real Word AI Systems with Applications in eHealth, HCI, Information Retrieval and Pervasive Technologies,pp.3-24.
[6] Parr,B.,2011. TwitterHas100MillionMonthlyAct ive Users; 50% Log In Everyday. [online] Available at: <http://mashable.com/2011/10/17/twittercostolostats>[Accessed1August2022].
[7] SumayaIshratMoyeen,Md.SadiqurRahmanMabud, Zannatun Nayem and Md. Al Mamun, 2021. SENTIMENTANALYSISOFENGLISHTWEETSUSING BIGRAMCOLLOCATION. EPRAInternationalJournalof Research & Development (IJRD),pp.220-227.
[8] Kouloumpis, E., Wilson, T. and Moore, J. (2011) “Twitter Sentiment Analysis: The Good the Bad and the OMG!”, Proceedings of the International AAAI ConferenceonWebandSocialMedia,5(1),pp.538-541. Available at: https://ojs.aaai.org/index.php/ICWSM/article/view/1 4185(Accessed:1August2022).
[9] Kim,S.andHovy,E.,2004.Determiningthesentiment of opinions. Proceedings of the 20th international conferenceonComputationalLinguistics -COLING'04,.
[10] Hatzivassiloglou,V.andMcKeown,K.,1997.Predicting thesemanticorientationofadjectives. Proceedings of the 35th annual meeting on Association for Computational Linguistics,.
[11] Agarwal, B. and Mittal, N., 2016. Prominent Feature Extraction for Sentiment Analysis. Socio-Affective Computing,.
[12] Geetha, S. and Kaniezhil, R., 2018. A SVM Based Sentiment Analysis Method (SBSAM) for Unigram and Bigram Tweets. [online] Acadpubl.eu. Available at: <http://www.acadpubl.eu/hub/>[Accessed1August 2022].
[13] Jimoh, R., Adewole, K., Aderemi, T. and Balogun, A., 2021. Investigative Study of Unigram and Bigram Features for Short Message Spam Detection. International Conference on Emerging Applications and Technologies for Industry 4.0 (EATI’2020),pp.70-81.
[14] KALAIVANI,K.andKUPPUSWAMI,S.,2019.Exploring the use of syntactic dependency features for document-levelsentimentclassification. Bulletinofthe Polish Academy of Sciences. Technical Sciences,67(2), pp.339-347.
[15] Awachate, P. and Kshirsagar, V., 2016. Improved Twitter Sentiment Analysis Using N Gram Feature Selection and Combinations. International Journal of Advanced Research in Computer and Communication Engineering,5(9),pp.154-157.
[16] Forman, G., 2003. An Extensive Empirical Study of Feature Selection Metrics for Text Classification. Journal of Machine Learning Research, pp.1289-1305.
[17] Kilgarriff, A. and Fellbaum, C., 2000. WordNet: An ElectronicLexicalDatabase. Language,76(3),p.706.
[18] Pang, B. and Lee, L., 2004. A sentimental education. Proceedings of the 42nd Annual Meeting on Association for Computational Linguistics - ACL '04,.
[19] Pang, B. and Lee, L., 2004. A sentimental education. Proceedings of the 42nd Annual Meeting on Association for Computational Linguistics - ACL '04,.
[20] GeeksforGeeks.2022. FeatureExtractionTechniquesNLP - GeeksforGeeks. [online] Available at: <https://www.geeksforgeeks.org/feature-extractiontechniques-nlp/>[Accessed1August2022].
[21] Guyon, I., and Elisseeff, A. 2003. An introduction to variable and feature selection. J. Mach. Learn. Res. 3, pp.1157–1182.
[22] Turney, P., 2001. Thumbs up or thumbs down?. Proceedings of the 40th Annual Meeting on Association for Computational Linguistics - ACL '02,.
[23] A.Go,R.Bhayani,andL.Huang.(2015)Sentiment140 api. [Online].Available: http://help.sentiment140.com/api
[24] Li, X., Xie, Q., Jiang, J., Zhou, Y. and Huang, L., 2019. Identifyingandmonitoringthedevelopmenttrendsof emerging technologies using patent analysis and Twitterdatamining:Thecaseofperovskitesolarcell technology. Technological Forecasting and Social Change,146,pp.687-705.
[25] Chamlertwat,W.,Bhattarakosol,P.,Rungkasiri,T.and Haruechaiyasak, C., 2012. Discovering Consumer InsightfromTwitterviaSentimentAnalysis. Journalof Universal Computer Science,18(8),pp.973-992.
[26] Narayanan,V.,Arora,I.andBhatia,A.,2013.Fastand AccurateSentimentClassificationUsinganEnhanced Naïve Bayes Model. Intelligent Data Engineering and Automated Learning – IDEAL 2013,pp.194-201.
[27] Hung, L. and Alfred, R., 2017. A Performance Comparison of Feature Extraction Methods for Sentiment Analysis. Advanced Topics in Intelligent Information and Database Systems,pp.379-390.
[28] Sharma, A. and Dey, S., 2012. Performance Investigation of Feature Selection Methods and Sentiment Lexicons for Sentiment Analysis. International Journal of Computer Applications 3,pp.975-8887.
[29] Pang, B. and Lee, L., 2008. Opinion Mining and Sentiment Analysis. Foundations and Trends® in Information Retrieval,2(1–2),pp.1-135.
[30] Pak, A. and Paroubek, P., 2011. Text Representation Using Dependency Tree Subgraphs for Sentiment Analysis. Database Systems for Adanced Applications, pp.323-332.
[31] Nguyen, D., Nguyen, D., Vu†, T. and Pham, S., 2014. Sentiment Classification on Polarity Reviews: An Empirical Study Using Rating-based Features. Proceedings of the 5th Workshop on Computational Approaches to Subjectivity, Sentiment and Social Media Analysis,pp.128-135.
[32] O'Keefe,T.andKoprinska,I.,2009.Featureselection and weighting methods in sentiment analysis. Proceedings of the 14th Australasian document computing symposium, Sydney,pp.67-74.
[33] TAN, S. and ZHANG, J., 2008. An empirical study of sentiment analysis for chinese documents. Expert Systems with Applications,34(4),pp.2622-2629.
[34] Kalaivani,K.,Kuppuswami,S.andKanimozhiselvi,C., 2019. Use of NLP Based Combined Features for Sentiment Classification. International Journal of
International Research Journal of Engineering and Technology (IRJET) e-ISSN: 2395-0056 Volume: 09 Issue: 08 | Aug 2022 www.irjet.net p-ISSN: 2395-0072 © 2022, IRJET | Impact Factor value: 7.529 | ISO 9001:2008 Certified Journal | Page441
International Research Journal of Engineering and Technology (IRJET) e-ISSN: 2395-0056
Volume: 09 Issue: 08 | Aug 2022 www.irjet.net p-ISSN: 2395-0072
Engineering and Advanced Technology (IJEAT), 9(1), pp.621-626.
[35] Asiaee T., A., Tepper, M., Banerjee, A. and Sapiro, G., 2012. If you are happy and you know it... tweet. Proceedings of the 21st ACM international conferenceonInformationandknowledgemanagement - CIKM '12,.
[36] Hassan,S.,Yulan,H.andHarith,A.,2012.Alleviating data sparsity for Twitter sentiment analysis. CEUR Workshop Proceedings (CEUR-WS. org).,pp.2-9.
[37] Mohammed Badr, B. and Fatima, S., 2015. Using Skipgrams,Bigrams,andPartofSpeechFeaturesfor Sentiment Classification of Twitter Messages. In Proceedings of the 12th International Conference on Natural Language Processing,pp.268-275.
[38] Nakov, P., Kozareva, Z., Ritter, A., Rosenthal, S., Stoyanov,V.andWilson,T.,2013.SemEval-2013Task 2: Sentiment Analysis in Twitter. Second Joint Conference on Lexical and Computational Semantics (*SEM) Proceedings of the Seventh International Workshop on Semantic Evaluation (SemEval 2013),2, pp.312-320.
[39] Go, A.; Bhayani, R. & Huang, L. (2009), 'Twitter Sentiment Classification using Distant Supervision', Processing ,1 6.
[40] Pak,A.andParoubek,P.,2010.TwitterasaCorpusfor SentimentAnalysisandOpinionMining. InProceedings of the Seventh International Conference on Language Resources and Evaluation (LREC'10), Valletta, Malta. European LanguageResourcesAssociation(ELRA),10, pp.1320-1326.
[41] AnalyticsVidhya.2022. WhatAren-gramsandHowto Implement Them in Python?. [online] Available at: <https://www.analyticsvidhya.com/blog/2021/09/w hat-are-n-grams-and-how-to-implement-them-inpython/>[Accessed3August2022].
[42] Kavita Ganesan, PhD. 2022. What are N-Grams?Kavita Ganesan, PhD. [online] Available at: <https://kavita-ganesan.com/what-are-ngrams/#.Ytwi6b3MLIU>[Accessed3August2022].
[43] Medium.2022. LeveragingN-gramstoExtractContext From Text. [online] Available at: <https://towardsdatascience.com/leveraging-ngrams-to-extract-context-from-text-bdc576b47049> [Accessed3August2022].
[44] DASH, M. and LIU, H., 1997. Feature selection for classification. IntelligentDataAnalysis,1(1-4),pp.131156.
[45] Ren Diao and Qiang Shen, 2012. Feature Selection WithHarmonySearch. IEEE Transactions on Systems, Man, and Cybernetics, Part B (Cybernetics), 42(6), pp.1509-1523.
[46] Sumaiya Thaseen, I. and Aswani Kumar, C., 2017. Intrusiondetectionmodelusingfusionofchi-square featureselectionandmulticlassSVM. Journal of King Saud University - Computer and Information Sciences, 29(4),pp.462-472.
[47] Zhang, H., Li, L., Luo, C., Sun, C., Chen, Y., Dai, Z. and Yuan,Z.,2014.InformativeGeneSelectionandDirect Classification of Tumor Based on Chi-Square Test of Pairwise Gene Interactions. BioMed Research International,2014,pp.1-9.
[48] Mesleh, A.M., 2007. Chi Square Feature Extraction Based Svms Arabic Language Text Categorization System. International Journal of Computer Science, 3(6),pp.430-435.
[49] DharmendraKumarsingh,PragyaPatel,AnjaliKarsh, Dr.A.S.Zadgaonkar,AnalysisofGeneratedHarmonics Due To CFL Load On Power System Using Artificial NeuralNetwork,Volume5,Issue3,March(2014),pp. 56-68,InternationalJournalofElectricalEngineering andTechnology(IJEET).
[50] Bachri,O.,Hatta,K.andNurhayati,O.,2017.FEATURE SELECTION BASED ON CHI SQUARE IN ARTIFICIAL NEURALNETWORKTOPREDICTTHEACCURACYOF STUDENTSTUDYPERIOD. InternationalJournalofCivil EngineeringandTechnology(IJCIET),8(8),pp.731-739.
[51] Lei, S., 2012. A Feature Selection Method Based on Information Gain and Genetic Algorithm. 2012 International Conference on Computer Science and Electronics Engineering,.
[52] Hung, L., Alfred, R. and Ahmad Hijazi, M., 2015. A Review on Feature Selection Methods for Sentiment Analysis. Advanced Science Letters, 21(10), pp.29522956.
[53] Tung M Phung's Blog. 2022. Information Gain, Gain Ratio and Gini Index. [online] Available at: <https://tungmphung.com/information-gain-gainratio-and-gini-index/>[Accessed3August2022].
[54] Piao, M., Piao, Y. and Lee, J., 2019. Symmetrical Uncertainty-Based Feature Subset Generation and
© 2022, IRJET | Impact Factor value: 7.529 | ISO 9001:2008 Certified Journal | Page442
International Research Journal of Engineering and Technology (IRJET) e-ISSN: 2395-0056
Volume: 09 Issue: 08 | Aug 2022 www.irjet.net p-ISSN: 2395-0072
Ensemble Learning for Electricity Customer Classification. Symmetry,11(4),p.498.
[55] Johfischer.com. 2022. Correlation-based Feature Selection in Python from Scratch – Johannes S. Fischer [online] Available at: <https://johfischer.com/2021/08/06/correlationbased-feature-selection-in-python-from-scratch/> [Accessed3August2022]
[56] Javed, K., Maruf, S. and Babri, H., 2015. A two-stage Markovblanketbasedfeatureselectionalgorithmfor textclassification. Neurocomputing,157,pp.91-104.
[57] Prusa, J., Khoshgoftaar, T. and Dittman, D., 2015. Impact of Feature Selection Techniques for Tweet Sentiment Classification. FLAIRS Conference 2015, pp.1-6.
[58] Baldi, P., Brunak, S., Chauvin, Y., Andersen, C. and Nielsen,H.,2000.Assessingtheaccuracyofprediction algorithms for classification: an overview. Bioinformatics,16(5),pp.412-424.
[59] Marcot, B. and Hanea, A., 2020. What is an optimal value of k in k-fold cross-validation in discrete Bayesiannetworkanalysis?. Computational Statistics, 36(3),pp.2009-2031.
[60] Manorathna, R., 2020. k-fold cross-validation explained in plain English (For evaluating a model's performance and hyperparameter tuning). [online] Availableat:<https://towardsdatascience.com/k-foldcross-validation-explained-in-plain-english659e33c0bc0>[Accessed3August2022].
[61] Hung, L. and Alfred, R., 2017. A Performance Comparison of Feature Extraction Methods for Sentiment Analysis. Advanced Topics in Intelligent Information and Database Systems,pp.379-390.
2022, IRJET | Impact Factor value: 7.529 | ISO 9001:2008 Certified Journal | Page