International Research Journal of Engineering and Technology (IRJET) e-ISSN: 2395-0056

Volume: 09 Issue: 08 | Aug 2022 www.irjet.net p-ISSN: 2395-0072
International Research Journal of Engineering and Technology (IRJET) e-ISSN: 2395-0056
Volume: 09 Issue: 08 | Aug 2022 www.irjet.net p-ISSN: 2395-0072
Er. Saurabh S. Joshi1, Dr. V. V. Karjinni2, Dr. A V. Shivapur3, Er. Prital Chougule4
1Assistant Professor, Department of Civil & Environmental Engineering, KITs College of Engineering (Autonomous), Kolhapur, Maharashtra, India 2Director, KITs College of Engineering (Autonomous), Kolhapur, Maharashtra, India 3Professor, Department of Civil Engineering, VTU Belgavi 4Research Scholar, Department Environmental Engineering, KITs College of Engineering (Autonomous), Kolhapur, Maharashtra, India ***
Abstract-
Global warming and climate change have recently risen to the forefront of the international community's concerns. Calculating one's carbon footprint (CFP) is an important first step in reducing emissions in a quantitative way since it shows how individuals, organizations, nations, and the entire planet respond to global warming. A person, organization, event, or product's carbon footprint is a measurement of their overall GHG emissions, which are expressed as a carbon dioxide equivalent. To understand how much the company contributes to global warming and to find measures to lessen that contribution, it is essential to calculate its carbon footprint. Finding solutions to lessen the company's impact on global warming and learning about the possibility for energy saving potential it is necessary to assess the company's carbon footprint. Additionally, customers are showing an increasing amount of interest in openness on the environmental effects of the companies and products they use. The idea of a carbon footprint, its importance, the effects it has on the environment, and carbon management for the textile sector are all covered in this paper. CFP reduction can be accomplished by making investments in clean, low-carbon technologies such as renewable energy sources, energy efficient equipment, employee awareness, and others. In this study carbon footprint assessment is carried out of Baldev Textile Mills Pvt. Ltd. Located in Hatkanangale, India. This study also suggests further carbon footprint reduction methods for the industry.
The world has recently been witnessing worsening climate shifts, which are largely due to an increase in greenhouse gas emissions. A long-term change in the typical weather patterns that have come to characterize local, regional, and global climates on Earth is referred to as climate change. The world's average temperature is rising, extreme weather events are getting worse, ocean levels are rising, and there is acidification. These environmental dangers are all a result of human activities. Current climate change encompasses both the effects of global warming on the planet's weather patterns. Global warming is the gradual warming of the Earth's surface that has been seen since the pre-industrial era (between 1850 and 1900), and is attributed to human activity, particularly the burning of fossil fuels, which raises the levels of heat-trapping greenhouse gases in the atmosphere. The idea that human activity is mostly to blame for the current warming is backed by substantial data Theassessment ofindustrial sustainabilityandthe formulationofsustainabledevelopment policiesrevolve aroundtheissuesofclimatechangeandcarbonfootprint.
According to researchers, the main factor causing global warming is greenhouse gas emissions.The different climate models estimatethatearthsurfacetemperaturewillincreaseintherangeof1.6upto5.8°Cbyendofthiscenturyinlinewithcurrent rates of population growth and GHG emissions [4]. Six greenhouse gases have been named by the Kyoto Protocol, an international accord on climate change: carbon dioxide (CO2), methane (CH4), nitrous oxide (N2O), hydrofluorocarbons (HFCs),perfluorocarbons(PFCs),andsulphurhexafluoride(SF6).Accordingtothislist,CO2isregardedastheprimarycause of the problems associated with climate change. Carbon accounting has thus become a crucial component of evaluating anthropogenic activity and, consequently, of lowering GHG emissions. As a result, the idea of a carbon footprint emerges to measure GHG emissions as a result of particular processes or activities. It is impossible to deny the dramatic and obvious connectionsbetweengreenhousegasemissionsandclimatechange.
International Research Journal of Engineering and Technology (IRJET) e-ISSN: 2395-0056
Volume: 09 Issue: 08 | Aug 2022 www.irjet.net p-ISSN: 2395-0072
Amongstthevariousmeasuresofenvironmentalimpactsaffectingourplanet,theconceptof‘carbonfootprint’isconsideredto be one of the most significant. A carbon footprint is a way of assessing the impact of an activity on the environment, specificallytheproductionofgasessuchascarbondioxide(theso-called‘greenhouse’gases[GHGs])thathavebeenlinkedto climatechange.Governmentsaroundtheworldhavebeguntomakeitmandatoryformanyindustriestodisclosethecarbon footprintofaproductorprocess.
Carbon footprint is frequently used in analyses of carbon emissions at many sizes, including those of items, people/households,companies,cities,andnations.Theterm"carbonfootprint"referstotheentireamountofcarbondioxide emittedbyanactivity.Itsimplyinvolvescalculatingtheentirequantityofcarbondioxideemissionsfromaparticularactivity, population, or system while taking into account all of the stores and sinks that are present within the spatial and temporal boundariesofthesystem,activity,orpopulationunderconsideration.Itcanbecharacterizedasameasurementoftheoverall GHGemissionscreateddirectlyandindirectlybyaperson,agroupofpeople,anoccasion,oraproduct,anditisexpressed asa carbon dioxide equivalent (CO2e). By measuring a product's carbon footprint, one may determine the overall quantity of greenhouse gas emissions that it produces during its entire life cycle, from the production of the raw materials used in manufacturing it through the disposal of the finished product (excluding in-use emissions).The generalized formula to calculateCFPcanbegivenas,
Where;E=emissionsfromtheemissionssourceinkgCO2-eperyear
Q =activitydata
E.F.=emissionfactor
In order to find solutions to lessen a company's impact on global warming and to learn about the possibilities for energy savings, calculating its carbon footprint is a critical first step. Additionally, it might result in long-term financial gain andlessentheimpactofclimatechange.Additionally,customersareshowinganincreasingamountofinterestinopennesson theenvironmentaleffectsofthecompaniesandproductstheyuse.Theideaofarecognizablelabeltoshowthattheitemshave beenmanufacturedwithacommitmenttoassessingandreducingtheircarbonimpactissupportedbyconsumers.Therefore, firms can increase consumer satisfaction and create a favorable brand image by estimating carbon footprint and publicly releasingCFPspecificsoftheirproducts.
Many governments are taking action to lower GHG emissions through national policies that include the implementation of emissions trading schemes, voluntary initiatives, carbon or energy taxes, rules and standards on energy efficiencyandemissions,amongotherthings.Inordertomaintainlong-termsuccessinacutthroatbusinessenvironmentand tobereadyforfuturenationalorregionalclimatelegislation,businessesmustbeabletocomprehendandmanagetheirGHG risks. The Indian government promised to fully support carbon footprint reduction plans at the 2009 Copenhagen climate changesummit AlsoattheCOP26SummitinGlasgow,besidesgovernments,manybusinessespledgedtogocarbon-freeinthe comingyears.RelianceIndustries,oneofthetopexportersofsoftwareservicesfromIndia,statedthatitwillbecomecarbonfree by 2030. TCS, the country's second-largest exporter of software services, promises to cut greenhouse gas emissions by 2025.By2030,IndianRailwaysalsoaspirestohavethefirstcarbon-freerailsystemintheentireglobe.
Tobecarbonneutral,onemuststrikeabalancebetweengeneratingcarbonandabsorbingitincarbonsinks.Carbon sequestration is the process of removing carbon dioxide from the atmosphere and storing it later. All global greenhouse gas (GHG) emissions must be offset by carbon sequestration in order to reach net zero emissions. To offset emissions from one sector with emissions from another is another strategy to cut emissions and work toward carbon neutrality. This can be accomplished by making investments in clean, low-carbon technologies such as renewable energy, energy efficiency, and others.
International Research Journal of Engineering and Technology (IRJET) e-ISSN: 2395-0056
Volume: 09 Issue: 08 | Aug 2022 www.irjet.net p-ISSN: 2395-0072
Theterm"netzero"isincreasinglyusedtodenoteabroaderandmorethoroughcommitmenttodecarbonizationand climate action, moving beyond carbon neutrality by including more activities under the scope of indirect emissions and frequently including a science-based target on emissions reduction rather than relying only on offsetting. Some climate scientists claim that the idea of net zero "has authorized a recklessly careless "burn now, pay later" strategy that has seen carbonemissionscontinuetorise."Wecanlessenourcarbonfootprintandtransitiontoalow-carboneconomybyswitching toenergysourcesandindustrialactivitiesthatproducefewergreenhouseemissions.Greenhousegasemissionsaredecreased by using more nuclear power and renewable energy sources like solar, wind, and geothermal energy. Carbon emissions are produced during the production of energy from both renewable and non-renewable sources, although these emissions are extremelylowornonexistentwhenitcomestorenewablesources.
The following steps are typically followed to attain carbon neutrality, though they may differ depending on who is implementingthestrategy:individuals,businesses,organizations,cities,regions,ornations.
Fig -1:Stepstoachievecarbonneutrality
According to a review of recent literature on carbon footprint studies, it is first important to decide if the CFP assessmentistobecarriedoutforasingleproductoracertainorganizationinordertomeasurecarbonfootprint.Thenotion of life cycle assessment provides the foundation for calculating a product or organization's carbon footprint. A widely used method for calculating the environmental effects of items or processes is life cycle assessment (LCA). LCA is a method for addressing environmental issues and potential environmental impacts across a product's life cycle, from raw material acquisitiontomanufacture,consumption,end-of-lifetreatment,recycling,andfinaldisposal,accordingtothedefinitiongiven byISO14044.(i.e.cradle-to-grave).Determiningthescopeofthesystemtobeexamined,orwhichactivitiesshouldbeincluded in the assessment, is a significant difficulty in carbon footprint estimation (as in LCA generally). Numerous options are available,somemorepertinentthanothersdependingonthenatureofthestudyandthequestion(s)itisintendedtoaddress.
The carbon footprint assessment for "Baldev Textile Mills Pvt. Ltd.," Hatkanangale, is done in this study. It is situated in Hatkanangale, India, at Laxmi Sahakari Audyoik Vasahat. This textile business uses cutting-edge infrastructure to produce shirtingfromyarn-dyedtextiles.Theindustry'scarbonfootprintisevaluatedfortheperiod2019–20utilizingthefourstages below.
Inthisstudy,thecarbonfootprintassessmentisdonefor“BaldevTextileMillsPvt.Ltd.”,Hatkanangale.Itislocatedat LaxmiSahakariAudyoikVasahat at Hatkanangale. Plot No. II/D/24, Shri LaxmiSahakariAudyogikVasahat Limited, Hatkanangale,ShriLaxmiCo-op.IndustrialEstate,Maharashtra416118.
Observationsduringvisittostudyarea:
Industryname:BaldevTextileMillsPrivateLimited
Address:HNo5975,GatA1/1A-3LaxmiProcessRd,B/hM.S.E.BIchalkaranji,416115,India
International Research Journal of Engineering and Technology (IRJET) e-ISSN: 2395-0056
Volume: 09 Issue: 08 | Aug 2022 www.irjet.net p-ISSN: 2395-0072
Sector:ConsumerDiscretionary
Industrycategory:ConsumerDiscretionaryProducts
Sub-industry:Apparel&TextileProducts
Incorporated:05/25/2005
No.ofemployees(2019-20):152 Website:www.baldevgroup.com
This textile company is engaged in manufacturing of textile yarn dyed shirting with state-of-the-art infrastructure. It manufactures export quality fabrics and garments. The company policy includes quality production as well as sustainable developmentconsideringenvironmentalimpacts.Theindustryitselfisinterestedandsupportstheideaofreductionofcarbon footprint. It is a textile company who engaged in manufacturing of textiles yarn dyed shirting with state-of-the- art infrastructure. It all began when a group of three masters from different fields of textiles came together with a vision and entrepreneur with proficiency in every sphere of textiles. Mr. Hari Shankar Panchloriya, Mr. LaxmikantPurohit and Mr. Subhash Kumar Sonthalia brought together with them 35 years of experience in yarns, fabrics, processing, wholesaling and retailingandgavebirthtoa companynamedBaldev TextileMillsPvt.Ltd.Earlierthecompanywassellingthe grey fabricin themarketdecidedtocomeintofinishedproductandthequalityoftheultimateproductleadtheorganizationto branditas “TEXIDORIA”whichmeansfabricwithvalueofgold.
The company in its statement states that they are committed to customer satisfaction along with improvement in the environment & quality through system & process reliability, employees’ involvement &training and targets & objectives monitoring.
Followingarethestagesofprocessingunitsintheindustry.
i. First process is to take yarn inward. In this process, raw material i.e. grey yarn or died yarn is taken for further processing.
ii. Afterthisthenextprocessisdirectwarpingorbeamwarping.Theobjectofthisprocessistoprepareacompactbeam withpredeterminednumberofendsandlength.Theoutputofthisprocessiswarpingbeam.
iii. After warping, next process is sizing. The object of sizing is to prepare compact beam with chemical (size paste) applicationtoimprovestrengthofyarnwithpredeterminednumberofendsandlength.
NOTE:Topreparethesizedbeam,weapplysizepasteonthewarpsheetandafterapplicationofpastethewarpsheet is immediately dried. For drying, steam is used which is taken from the boiler. The fuel for the boiler is coal. The outputofthisprocessisknownassizedbeam.
iv. Thesizedbeamisnowreadyforthenextprocessknownasweaving.Theobjectofweaving processistopreparethe fabric on the weaving machine (Rapier & Air-jet looms). Then finally the grey fabric is produced i.e. the output of weavingprocess.
v. Thenthisgreyfabricisthentakentonextprocessi.e.forprocessing.Theobjectofthisprocessisbleachingordying thefabricaccordingtorequirement.Theoutputofthisisfinishedfabric.Thenthisfinishedfabricisprovidedinlocal marketasperrequirement.
As a first step in establishing organizational boundaries, a suitable method for comprehending GHG emissions should be chosen.Thechosenstrategyshouldthenbeconsistentlyusedtodescribeallorganizationalproceduresandoperationswitha view to recording and disclosing GHG emissions. The organizational boundary is established in this study and includes emissionsourcesaswellasadministrative,development,andserviceunitactivities.Inotherwords,emissionsourcesthatare physicallya partofthe industryare taken into account. Regardless of the strategy employed,the organizational boundary is thesamebecausethisindustryownsalloperations.
The operational boundary should be established after the organizational boundary has been evaluated. In order to do this, emissionsconnectedtocompanyoperationsmustbeidentifiedanddividedintodirectandindirectemissions.Tobetterdefine
International Research Journal of Engineering and Technology (IRJET) e-ISSN: 2395-0056
Volume: 09 Issue: 08 | Aug 2022 www.irjet.net p-ISSN: 2395-0072
direct and indirect emission sources, increase transparency, and be useful to many organizations and climate policies, GHG emissionfromvariousoperationswillbedividedintothree"scopes"(scope1,scope2,andscope3).
Scope1comprisesdirectGHGemissionsthatcamefromsourcesthatthecompanyownsorcontrols.Operations fallingunder scope1inthisstudywillbethedirectemissionsresultingfromactionstakingplaceinsidetheactualboundariesofthetextile industry.
GHGemissionsfromthegenerationofpurchasedpowerusedbytheorganizationareincludedinscope2emissions.
Scope3emissionsresultfromcompanyoperationsbut comefromsourcesthatthecompanydoesnotownorcontrol.Water useandemployeecommuteswillbecoveredbyscope3ofthisstudy.
Data collectionisan essential component ofLCA.Themajorityofthe data will beprimarydata,whichwill begathered from chosenunitsviainterviews,observations,businessdocuments,etc.Allactionsoccurringinsidethespecifiedborderswillhave theiractivitydatarecordedforayear.Thetablebelowliststheparametersandpertinentsourcesoftheactivitydata.
Table -1: ParametersandsourcesofactivitydatausedtocalculateCFP
Aspects
Parameters of activity data
Source
Electricity–onsite Electricity consumption Annually (kWh) Electricitybills
Fuel Coalconsumption(tons) Purchasebills
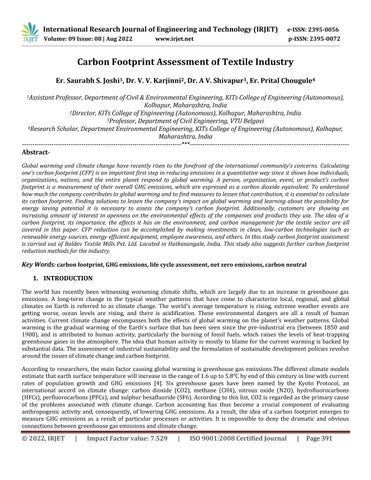
LPG–onsite LPGconsumptionAnnually(kg) Purchasebills
Generator–onsite Fuelconsumptionannually(l) Runningchart
Employee commuting
Distancetravelledannually(km)
AveragefuelefficiencyofVehicles(l)
Typeofvehicle
No.ofdaysperweektravelled No. of weeks per year worked in the office
Typeoffuel
AverageNo.ofpersonspervehicle
Wastegeneration Amount of waste generation annually (kg) Personal communication
Waterconsumption Waterconsumptionannually(m3) Waterbills
Activitydataarecollectedfromallactivitieswithinthedefinedboundariesforone-yearperiod2019-20.Specially,commuting data were collected from all employees (152 persons) of the industry as well. Parameters and values of the activity data relatedtoeachandeveryoperationarepresentedinfollowingtables.
International Research Journal of Engineering and Technology (IRJET) e-ISSN: 2395-0056
Volume: 09 Issue: 08 | Aug 2022 www.irjet.net p-ISSN: 2395-0072
Table 2: Annualelectricityconsumption
Sr. No. Month Electricity consumed(kWh)
1 January 574845 2 February 487260 3 March 475930 4 April 493500 5 May 567420 6 June 646320 7 July 347355 8 August 791490 9 September 475170 10 October 519090 11 November 500805 12 December 779160
Table 3:Annualcoalconsumption
Sr. No. Month Coal consumed(Tons)
1 January 103 2 February 152 3 March 82 4 April 145 5 May 154 6 June 165 7 July 161 8 August 119 9 September 114 10 October 102 11 November 104 12 December 157
International Research Journal of Engineering and Technology (IRJET) e-ISSN: 2395-0056
Volume: 09 Issue: 08 | Aug 2022 www.irjet.net p-ISSN: 2395-0072
Table 4:AnnualLPGconsumption
Table 5: Annualdieselconsumption
International Research Journal of Engineering and Technology (IRJET) e-ISSN: 2395-0056
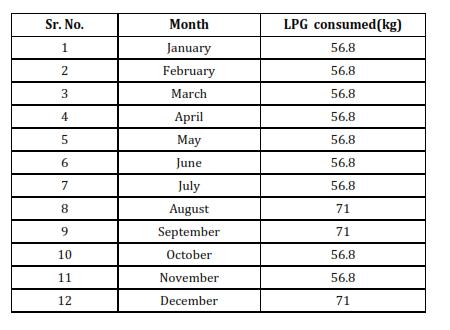
Table 6: Annualpetrolconsumption
Table 7: Annualwaterconsumption
Sr. No. Month Water consumed (m3) 1 January 981.600 2 February 422.200 3 March 1082.700 4 April 976.200 5 May 513.600 6 June 1327.400 7 July 588.800 8 August 641.500 9 September 1740.700 10 October 22.700 11 November 1331.300 12 December 101.500
Annual waste generation:
AccordingtoguidelinesofMinistryofHousingandUrbanAffairspercapitawastegenerationvariesbetween0.2Kgto 0.6 Kg per day. By communicating with operating manager of Baldev Textile Mills, it has been noted that waste generation frommanufacturing,operatingandotherunitsintheindustryisabout2500to3000kgpermonth.Thatmeanstheindustry generates30to36tonsperyear. ThecompositionofMSWgeneratedintheindustryisshownbelow.
Volume: 09 Issue: 08 | Aug 2022 www.irjet.net p-ISSN: 2395-0072 © 2022, IRJET | Impact Factor value: 7.529 | ISO 9001:2008 Certified Journal | Page398
International Research Journal of Engineering and Technology (IRJET) e-ISSN: 2395-0056
Volume: 09 Issue: 08 | Aug 2022 www.irjet.net p-ISSN: 2395-0072
Table 8: Annualwastegeneration
Sr.No. Categoryofwaste Amount(%)
1 Wasteyarnmaterial 12.83 2 Foodwaste 28.59 3 Paperwaste 22.50 4 Plasticwaste 16.20 5 Gardenwaste 11.20
6 Hazardousandotherwaste 8.68
Alongwithsolidwastegeneration,theindustrygenerateswastewaterfromitsfabricmanufacturingprocess.Theindustryhas aneffluenttreatmentplantofcapacity10MLDwithinitsphysicalboundariestotreattheeffluentgeneratedinindustry.
Asaresultofmultiplyingactivitydatabytheemissionfactor,theCFPofeachemissionsourceandactivitywillbedetermined inkgCO2e/year(EF).Theseratios,whichrelateGHGemissionstoafictitiousindicatorofactivityat anemissionssource,have been calculated. A hierarchy of computation methods and procedures, ranging from the use of general emission factors to directmonitoring,ismentionedintheIPCCguidelines(IPCC,1996).Anemissionfactor,whichrelatestheamountorquantity of a pollutant released into the atmosphere with an associated activity for that pollutant release, is provided as a representativevalue.Basedonthechosenboundariesofthelifecycleofaproduct,emissionfactorsmustbeinvestigated and verifiedforeachcomponentandactivityconnectedwiththevariousphasesofthelifecycleofaproduct.
Inordertounderstandthecarbonfootprintoftextileindustryofoneyearperiod,calculationsweredonebyconsidering relevantemissionfactorfromIPCCguidelines. Thescopebasedcarbonfootprintassessmentvaluesofyear2019-20ofBaldev TextileMillsPrivateLimitedisgivenbelow.
Table 9: CalculationCFPoftextileindustry
Scope Activity Emission factor CFP(kgCO2e/year) % CFP
Scope1 (Direct emissions)
LPG usage 2.987 2163.185 1.9271 Coalconsumption 6.552 10208.02
Dieselconsumption 2.738 42155
Wastedisposal 0.770 5005
Scope2 Electricity 0.4368 2908365 94.15045
Scope3 Commuting 2.243 119158.2 3.925813
Waterusage 0.1871 2006.778
The CFP under scope 1, 2 and 3 are 1.9271 %, 94.15045 % and 3.925813% respectively as shown in Table 9. In this study scope2thatispurchasedelectricityconsumptionshowedhighestCFPwhichis 94.15%.ThehighestCFPvalueforscope3is arisen due to the complex nature of activities performed by different types of organizations and the varying scales in which theyoperate.
International Research Journal of Engineering and Technology (IRJET) e-ISSN: 2395-0056
Volume: 09 Issue: 08 | Aug 2022 www.irjet.net p-ISSN: 2395-0072
Excepttransportationandelectricity,allotheractivitiesshowlesscontributionfortotalCFPoftheindustry.Carbonfootprint offoodwasteaccounts0.77%andwaterusageaccounts0.19%ofthetotal(Table9)byrepresentingthelowestimpactofthis organization.
LPG usage
Coal consumption Diesel consumption Waste disposal Electricity Commuting Water usage
Fig 5.1: Carbon footprint of industrial activities
Scope 1 Scope 2 Scope 3
Fig 5.2: Scope based carbon footprint assessment
1) In this project study, carbon footprint assessment for Baldev Textile Mills Pvt. Ltd. Was done for one-year period (2019-20) in three scopes. The carbon footprint study was done by establishing organizational and operational boundariestotheindustry.
2) Thecarbonfootprinttheindustryunderscope1,2and3are1.9271%,94.15045%and3.925813%respectively.
© 2022, IRJET | Impact Factor value: 7.529 | ISO 9001:2008 Certified Journal | Page400
International Research Journal of Engineering and Technology (IRJET) e-ISSN: 2395-0056
Volume: 09 Issue: 08 | Aug 2022 www.irjet.net p-ISSN: 2395-0072
3) The scope based carbon footprint study shows maximum CFP is from electricity consumption which is 94.12 %. To reduceelectricityconsumption,theindustryshouldinstallsolarpanelsofsufficientsupply.
4) Excepttransportationandelectricity,allotheractivitiesshowlesscontributionfortotalCFPoftheindustry.
5) Sincescope3(indirectemissions)showedthehighestCFP,knowledgeofthiscarbonfootprintsmayassistindustries topursueemissionsmitigationprojectsnotjustwithintheorganizationbutalsoacrossindirectemissionactivities
6) The industry management and employees should be provided proper energy management training for sustainable developmenttoimplementabetterEnvironmentalManagementSystem.
7) By implementing better Environmental Management System in industry and training to employees, industry can achievegoalofcarbonneutrality.
There are certain ways to reduce greenhouse gas emissions from the industrial sector, including energy efficiency, fuelswitching,combinedheatandpower,useofrenewableenergy,andthemoreefficientuseandrecyclingofmaterials.Once you know where you are using or possibly wasting energy, you can tighten up and become more efficient. Reducing unnecessary energy inefficiencies is a vital step to minimizing industrial carbon footprint. Small changes such as switching lightsoff,turningoffcomputerswhenthey’renotrequiredandfiguringoutwhichmachinesneedtobeonstandbyandwhich canbeswitchedoff,canallcontributetothecause.
BystudyingtheemissionsourcesandcarbonfootprintdataofBaldevTextileMillsPvt.Limited,followingremedialmeasures aresuggested.
1. Toreducecarbonfootprintgeneratedbyelectricityconsumptioninindustry,solarenergyasrenewablesourcecanbe used. Solar PV installations can be combined to provide electricity on a commercial scale, or arranged in smaller configurations for mini-grids or personal use. Using solar PV to power mini-grids is an excellent way to bring electricityaccessto people whodo notlive near power transmissionlines, particularlyindevelopingcountries with excellentsolarenergyresources.
2. To reduce carbon footprint generated by petrol consumption for commuting, the industry can provide its own transportationfacilitylikeofficebus,sharecars,etc.totheiremployees.Publictransportationshouldbepromoted.A cycle-to-workschemecouldbeagreatincentiveforsomeonetojumpontheirbikeinsteadofgettinginthecar.This could have a positive impact on both the environment and their well-being. Another idea can be introducing a carpoolingscheme,whichisoftenwelcomedbyemployeestoo.
3. To reduce carbon footprint by LPG consumption, biogas plant can be installed within the industry premises. Food waste generated from canteen and other organic biodegradable waste can be used as raw material for biogas generation.
4. Thehighheatingvaluesofpreparedbio-coalsfromtherepresentativebiomassarewithin25.4to28.2MJkg−1,which are comparable to that of the commercial coals. Life cycle assessment further shows that the bio-coal production processcouldachievenetpositiveenergy,financial,andenvironmentalbenefits.
5. Also industry can implement a better waste management plan for solid waste management. The most effective methodsofindustrialwastemanagementareonesthataimtoreduce,reuse,andrecyclewhenpossible,andthatare guaranteedtocausenoharmtotheenvironment.Recyclingandwaste-to-energyoptionsshouldalsobepracticed.It should be ensured to have a proper recycling system in place, and that people use it. Have it in all aspects of the business,sothehugepackagingfromthelarge-scalemachineryandthepaperfromtheofficehavesomewheretobe recycled.Thefirststepisalwaystotryandminimizewaste,butwhenthat’snotpossible,thinktorecycleorreuse.
International Research Journal of Engineering and Technology (IRJET) e-ISSN: 2395-0056
Volume: 09 Issue: 08 | Aug 2022 www.irjet.net p-ISSN: 2395-0072
[1] G. Peters, M. Svanstrom, S. Roos, G. Sandin, B. Zamani. 2015. Carbon footprints in the textile industry. Handbook of Life Cycle Assessment (LCA) of Textiles and Clothing, Woodheadpublishing series in Textiles
[2] GokhanEgilmaz, KhurrumBhutta, Bulent Erenay, Yong Shin Park, RidvanGedik. 2017. Carbon Footprint Stock Analysis of U.S.Manufacturing:ATimeSeriesInput-OutputLCA. Industrial Management & Data Systems, Vol. 117 Issue 5, pp.853-872
[3] Jianyi Lin, Yuan Liu, FanxinMeng, Shenghui Cui, Lilai Xu. 2013. Using hybrid method to evaluate carbon footprint of XiamenCity,China. Energy Policy 58, (2013)220–227
[4] M.G.G. Awanthi, C.M. Navaratne. 2018. Carbon Footprint of an Organization: a Tool for Monitoring Impacts on Global Warming. Procedia Engineering, 212 (2018) 729–735
[5] Madhuri Nigam and BhawanaChanana. Assessment of Environmental Impact of Textile Industry and a Roadmap to Life CycleThinking. Energy Research and Environmental Management: An Innovative Approach, ISBN 978-81-930585-2-7
[6] Muthu S.S. 2020. Textile Processing and greenhouse gases emissions: Methods for calculating the Product Carbon FootprintofTextileProducts. Assessing the Environmental Impact of Textiles and the Clothing Supply Chain.
[7] Ranganathan, J. Corbier, L. Bhatia, P. Schmitz, S. Gage, P. and Oren, K. 2004. The greenhouse gas protocol: a corporate accounting and reporting standard (revised edition). Washington, DC: World Resources Institute and World Business Council for Sustainable Development.
[8] SanaAkhtar,ShahzeenFatimaBaig,SamiaSaif,AsimMahmood,SajidRashidAhmad.2017.FiveYearCarbonFootprintofa TextileIndustry:APodiumtoincorporateSustainability. Nature Environment and Pollution Technology, Vol. 16, No. 1, 2017
[9] Shaoqing Chen, Huihui Long, Bin Chen, KuishuangFeng, Klaus Hubacek. November 2019. Urban carbon footprints across scale:Importantconsiderationsforchoosingsystemboundaries. Applied Energy
[10] TheGreen HouseGasProtocol,2004.ACorporateAccountingandReportingStandard. World Resources Institute and World Business Council for Sustainable Development, ISBN 1-56973-568-9