International Research Journal of Engineering and Technology (IRJET) e-ISSN: 2395-0056

Volume: 09 Issue: 08 | Aug 2022 www.irjet.net p-ISSN: 2395-0072
International Research Journal of Engineering and Technology (IRJET) e-ISSN: 2395-0056
Volume: 09 Issue: 08 | Aug 2022 www.irjet.net p-ISSN: 2395-0072
Katare A P1 , Tande S N2
1PG Student, Dept of Civil Engineering, Walchand College of Engineering, Sangli, Maharashtra, India, 416415 2Professor, Walchand College of Engineering, Sangli, Maharashtra, India, 416415 ***
Abstract - An attempt is made to compare response of Study the structure behaviors whether it has floating columns, floating columns and shear walls, and compare the results to the behavior of a normal building models. Additionally, compare the time period, storey displacements, storey drift, and storey shear. Three models for a G+20-story [M1, M2, M3] and three model of G+10 structure [P1, P2, P3]. The normal building will be taken into account for the first model [M1], building with floating columns will be second model[M2], and model with floating column and shear wall are considered third model [M3]. The response spectrum methods are used to analyse the seismic analysis of the G+20 storey and G+10 structure. Used pushover curve to find of performance point of the building. ETABS-2019 software and Indian Standard code IS 1893(Part-1) 2002. Obtained parameter likes storey displacements, storey shear, storey drift and time period for seismic zone IV. Obtained pushover curve for the M2 & M3 model and checked the performance point of buildings. Also compared the result between G+20 &G+10 storey buildings. The story displacements is increased 6% in (M2), decreased 27% in (M3). The story shears is decreased 4.5% in (M2), and increased 12% in model (M3) on comparing model [M1].Comparing all three models the time period of floating column building model II (M2) is greater between all three model. The storey shear increased by 24 percent in model III, by 23 percent in model IV, and by 4.5 percent in model II as compared to a normal structure. When comparing the three models, the floating column building model [M2] has a longer lifespan than the other three buildings. Comparing all variants, Model [M3] offers greater performances with lower displacements and more strength.
Key Words: ETABS, Floating column, Shear wall, Response spectrum method, Pushover curve.
Thefirstflooropeningofmanyurbanmulti-story structuresinournationisaninevitablefuturedevelopment. This is being used to accommodate parking for cars, receptionoflobbies,among otherthings,inthefirstfloor. The distribution of stiffness and mass along of the height affectstheseismic forcedistributionand thetotal seismic baseshearofthebuildingduringanearthquake.Inaddition of how the sesmic forces are transmitted to the ground, a
building's overall design, size, and geometry have a significantimpactonhowitrespondstoearthquakes.The architect will probably use a variety of techniques to increase the amount of space available for one or more storeys inside the multi-story building. One of these techniquesistheuseoffloatingcolumns,whichmeansthat theendsofanyverticalelementsrestonabeamandcausea discontinuityinthecolumnsinsuchmulti-storybuildings. Shearwallshavethereforebeenutilisedintheirdirectionof orientation to provide the buildings more strength and stiffness.
Acolumnisintendedtobeaverticalelementthatbegins atthefoundationlevelandtransfersweighttotheground. The phrase "floating column" also refers to a vertical element where the column ends rest on a beam that is a horizontal member due to structural design or site conditions.Thesebeamschangehowtheloadistransferred to the columns below. The load on these columns was regarded as the point load. Where there are floating columns,thefloorandthefloorsbelowitshouldhavehefty beamsandcolumnsmadeofheavymaterials.Thesizeofthe beams and columns should be increased because floating columns act on concentrated loads and transfer loads horizontally.
Ashear wall is thatisused towithstand shear thatis causedbylateralforcesorseismicstresses.Shearwallsare frequentlypresentinhigh-risestructures.Itwillbestarted at the ground level and extended to the height of the building. Shear walls can range in thickness of 150mm to 400mm.Shearwallsareorientedvertically,likewidebeams, to withstand lateral stresses that would otherwise push them downward into the base. Shear walls are typically provided by the breadth and length of the constructions. Shear walls are offered when there is a greater than 30% differencebetweenthebuilding'scentreofgravityandthe loaditiscarrying.Inordertobringthecentreofgravityand thecentre,concreteshearwallswillbeprovided.Shearwall structuresareidenticaltoregularframedstructuresinevery manner.Whenitcomestothetransferenceoflateralloads, however,therearesubstantialdifferences.Shearwallsare
International Research Journal of Engineering and Technology (IRJET) e-ISSN: 2395-0056
Volume: 09 Issue: 08 | Aug 2022 www.irjet.net p-ISSN: 2395-0072
verticalstiffeningcomponentsmadetowithstandthelateral stressesthatwindorearthquakescanapplytoastructure. Shear walls are vertical components of the system whichresistshorizontalforces.
1. Formulationofproblemstatement,developmentof methodology, and possible validation with high qualityresearcharticle.
2. Evaluate seismic response of high rise RCC buildingswithfloatingcolumns.
3. Evaluate the seismic response of high rise RCC framedbuildingswithfloatingcolumnsandshear walls.
4. Tocompareresponseparametersofthestructures consideringnonlinearanalysisresultsobtained.
Table 1 Model details
Heightofbuilding 64m PlanArea 1050m^2
PlanDimension 30X35m
Columnsize 600X600mm
Beamsize 300X450mm ThicknessofSlab 150mm UnitweightofConcrete 25kN/m3 GradeofConcrete M25 GradeofSteel Fe415 Seismiczone 4 Importancefactor 1 Responsereductionfactor 5 Typeofsoil II
SteelGrade:Fe500
ConcreteGrade:M40
Floorheight:3m
Shearwallthickness:250mm Thicknessofslab:150mm
BasicWindSpeed:50m/s TerrainCategory:II SoilType:II ImportanceFactor:1 K1&K3:1
SeismicZone:III SeismicZoneFactor:0.16 SoilType:II ImportanceFactor:1 ResponseReductionFactor:5
BasicWindSpeed:50m/s TerrainCategory:II SoilType:II ImportanceFactor:1 K1&K3:1
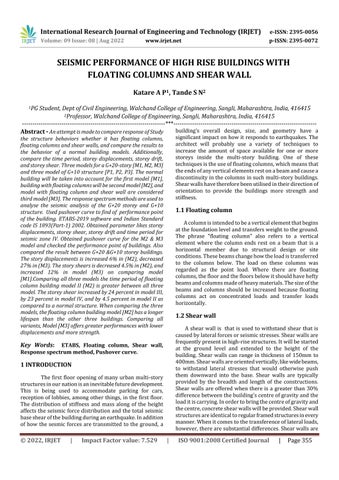
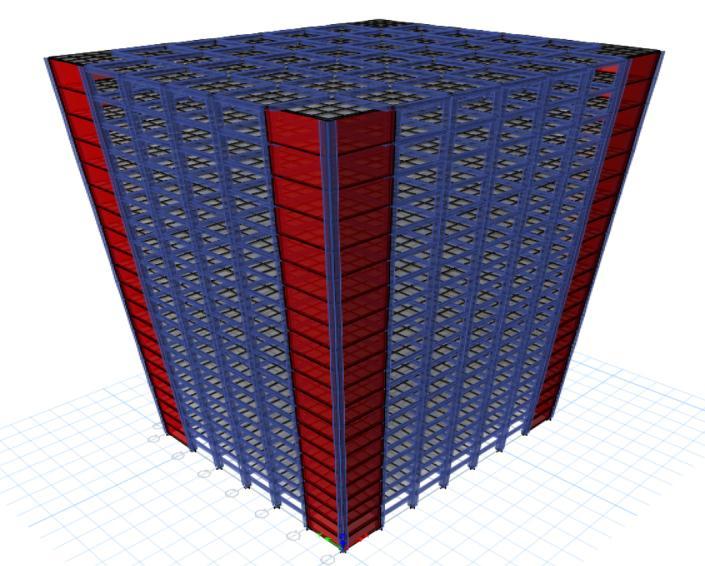
Fig -1 3D Structural model
International Research Journal of Engineering and Technology (IRJET) e-ISSN: 2395-0056
Volume: 09 Issue: 08 | Aug 2022 www.irjet.net p-ISSN: 2395-0072
Fig -4 Deformed shape in X-direction
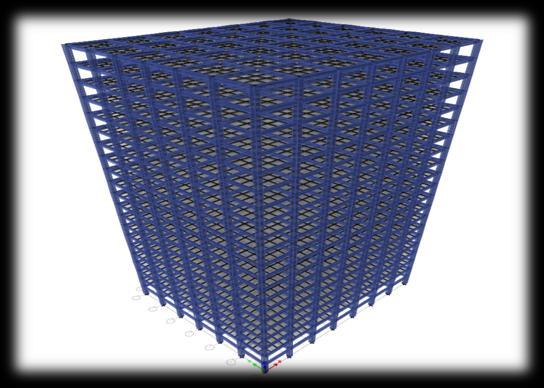
Figure 2 Elevation view (M2)
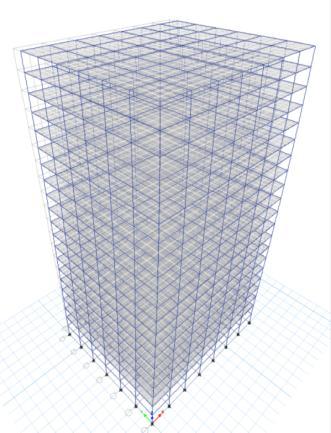
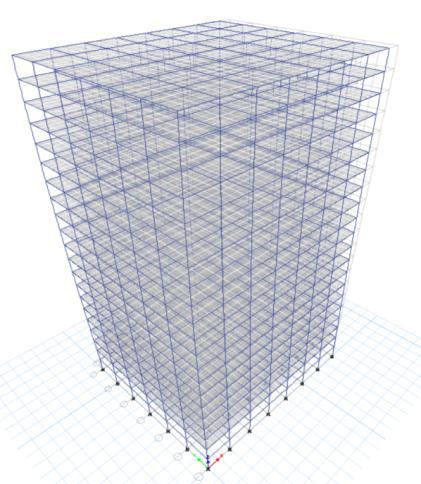
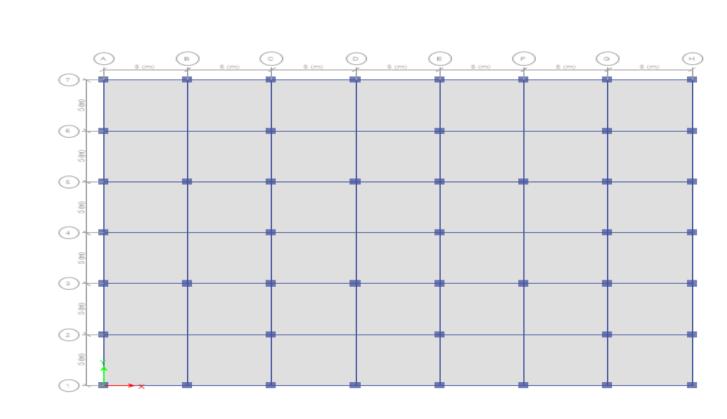
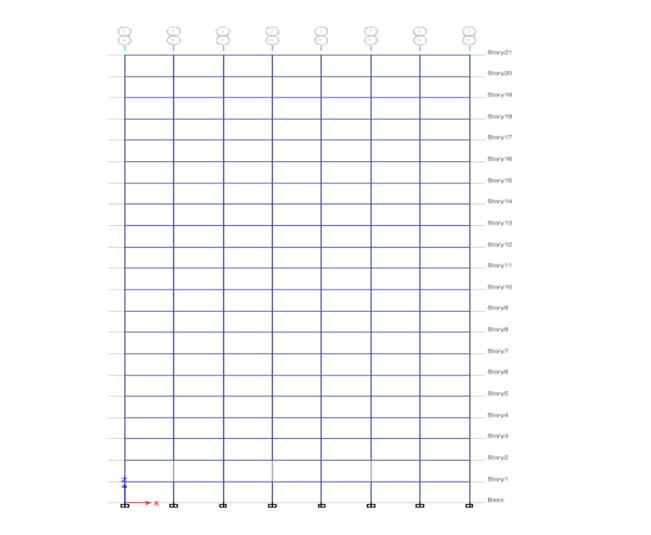
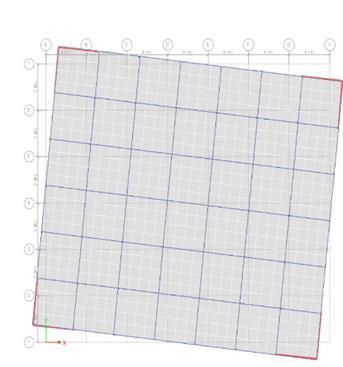
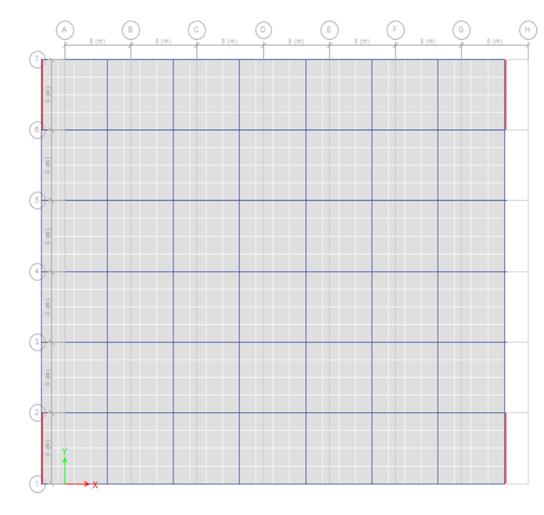
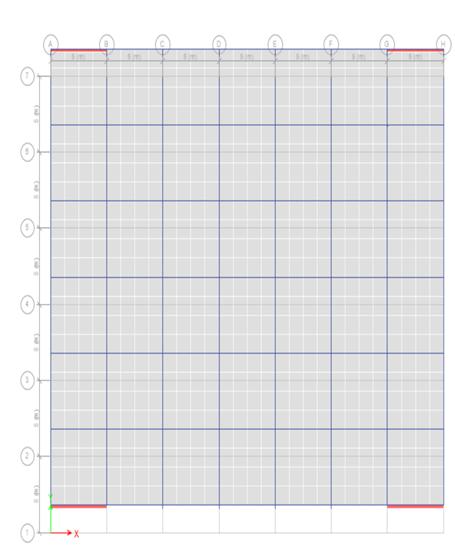
Fig -3 Floor Plan of building
Mode shapes [M1]
Fig -5 Deformed shape in Y-direction
International Research Journal of Engineering and Technology (IRJET) e-ISSN: 2395-0056
Volume: 09 Issue: 08 | Aug 2022 www.irjet.net p-ISSN: 2395-0072
Mode shapes [M2]
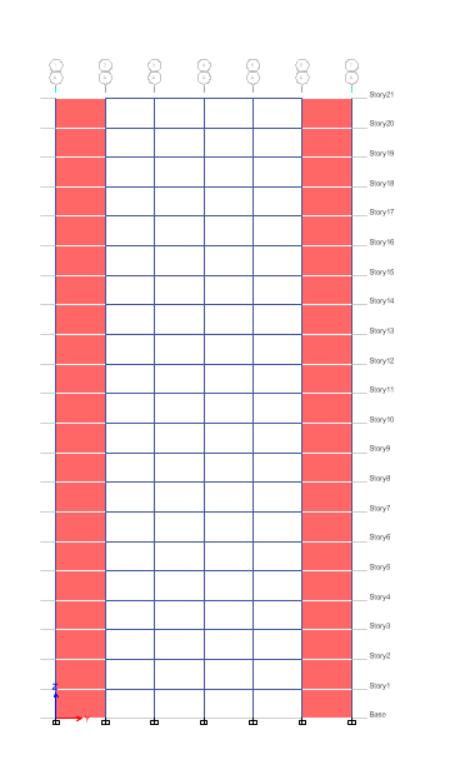
Fig -7 Deformed shape in X-direction
Figure 11 Elevation (M3)
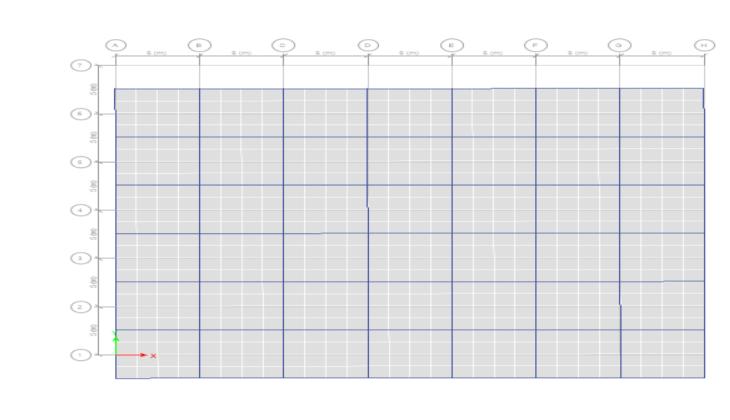
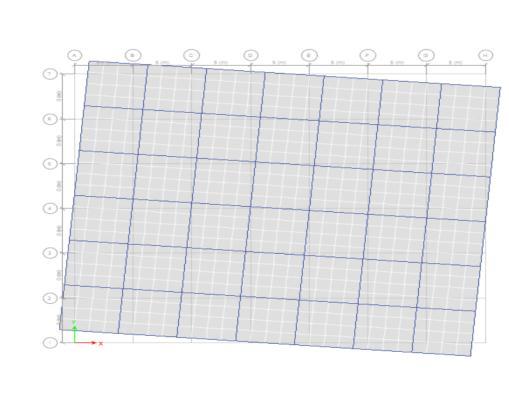
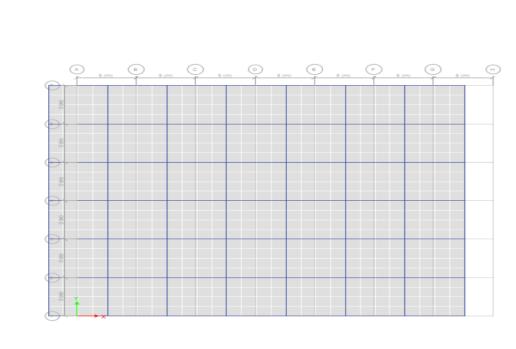
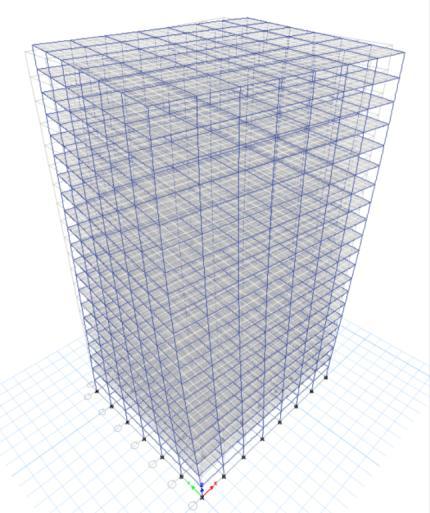
Fig -6 Deformed shape in torsion
Fig -8 Deformed shape in Y-direction
Fig -9 Deformed shape in torsion
International Research Journal of Engineering and Technology (IRJET) e-ISSN: 2395-0056 Volume: 09 Issue: 08 | Aug 2022 www.irjet.net p-ISSN: 2395-0072
results Table 2 Time period ModeNo. M1 M2 M3 1 2509 255 1768 2 2482 2495 1754
2279 228 1229 4 0821 0829 0456
0813 0818 0454
0748 0748 0277
0473 0473 0206
International Research Journal of Engineering and Technology (IRJET) e-ISSN: 2395-0056
Volume: 09 Issue: 08 | Aug 2022 www.irjet.net p-ISSN: 2395-0072
Story M1 M2 M3
Story21 0000237 0000234 0000845
Story20 0000393 0000395 0000885
Story19 0000562 0000562 0000919
Story18 0000722 0000722 0000956
Story17 0000868 0000868 0000994
Story16 0000998 0000998 000103
Story15 0001113 0001113 0001062
Story14 0.001213 0.001213 0.001088
Story13 00013 00013 0001107
Story12 0.001375 0.001375 0.001117
Story11 0001438 0001438 0001116
Story10 0001491 0001491 0001104
Story9 0001535 0001535 000108
Story8 000157 000157 0001041
Story7 0001598 0001598 0000987
Story6 0001619 0001619 0000915
Story5 0001633 0001633 0000824
Story4 0001636 0001636 0000711
Story3 0001613 0001613 0000573
Story2 0001576 0001576 0000407
Story1 0000788 0000788 0000189
Base 0 0 0
This method is applicable for those structures where modes other than the fundamental one affect significantly the response of the structure In this method the response of Multi-Degree of freedom (MDOF) system is expressed as the modal response, each modal response determined by the spectral analysis of single degree of freedom (SDOF) system, whicharethencombinedtocomputethetotalresponse Modal analysis leads to the response history of the structure to a specified round motion, the method is usuallyusedinconjunctionwitharesponsespectrum
ToSelect designspectrum
Determine the mode shapes and period of vibrationtobeincludedintheanalysis
Readlevelforresponsefromthespectrumfor theperiodofeachofthemodesconsidered
Calculate the participation for each mode correspondingtothesingledegreeoffreedom
readtheresponsefromthecurve
Add the effects of modes to obtain combine maximumresponse
Convertthecombinedmaximumresponsefor shearsandmomentsforusingindesignofstructure
Analyzethebuildingfortheresultantmoments andtheshearinforsamemanner
International Research Journal of Engineering and Technology (IRJET) e-ISSN: 2395-0056
Volume: 09 Issue: 08 | Aug 2022 www.irjet.net p-ISSN: 2395-0072
Parameter Studied
M2 model M3 model TimePeriod(Sec) Modes Modes
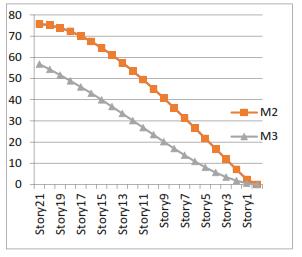
1st 2nd 3rd 1st 2nd 3rd 2.509 2.482 2.279 1.768 1.754 1.229 StoryShear(KN) EQX 1.2(DL+LL+FF+EQ X) EQX 1.2(DL+LL+FF+EQ X) 3353.93 4024.73 4261.3007 5113.56
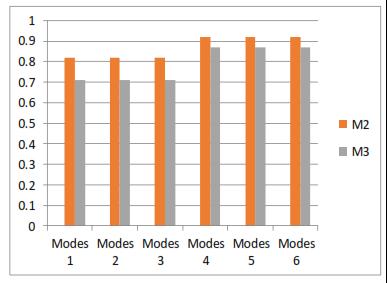
TopStorydisplacement(mm) 75 66 Mass Participation Ratio(%) 91.93 86.96
Pushoveranalysisisanapproximateanalysismethod inwhichthestructureissubjectedtoincreasing of lateral forces with an invariant height related distribution until a target displacement is reached andPushoveranalysisconsistsofaseriesofiteration of elastic analyses, superimposed to a forcedisplacementcurveoftheoverallstructure.
Table 4 Displacement
Story P2 P3 Base 0 0 Story1 1601 0529 Story2 4757 1587 Story3 792 3001 Story4 11056 4692 Story5 14064 6573 Story6 16852 8565 Story7 19321 10601 Story8 21365 12621 Story9 22.886 14.584 Story10 23.857 16.437
International Research Journal of Engineering and Technology (IRJET) e-ISSN: 2395-0056
Volume: 09 Issue: 08 | Aug 2022 www.irjet.net p-ISSN: 2395-0072
Table 5 Time period Table 7 Frequency
Story P2 P3
Story10 6590916 1274423
Story9 1258754 2486076
Story8 1732561 3443431
Story7 2095.319 4176.407
Story6 2361836 4714919
Story5 2546917 5088886
Story4 2665368 5328225
Story3 2731.998 5462.853
Story2 2761245 5522022
Story1 2764287 5529033 Base 0 0
Figure 20 Shear force vs story
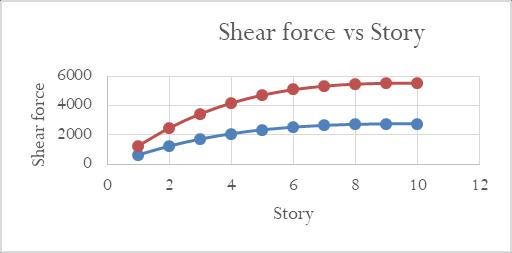
Table 6 Base shear
Mode P2 P3 1 1142 0632 2 1133 063 3 1047 039 4 0.362 0.154 5 0359 0153 6 0332 0091 7 0.198 0.071 8 0197 0071 9 0182 0045 10 0127 0045 11 0127 0043 12 0.117 0.033
Mode P2 P3
1 5.5031 1.583 2 55446 1588 3 60033 2566 4 173776 6514 5 174958 6522 6 18934 10937 7 317189 14096 8 318823 14105 9 344457 22256 10 494021 22266 11 496028 23285 12 53609 30375
1.Structurewhichhavingfloatingcolumnwillreducedead loadofstructure.
2. Story drift is decreasing with increasing height of structureineverymodel.
3. Maximum story drift and displacement values are increasingforfloatingcolumn.
4.Asthetransferofloadoffloatingcolumnstoconventional columns because of that axial forces are increasing in conventionalcolumns.
5.Itisfoundthatthedisplacementmoreinfloatingcolumn buildingascomparetobuildingwithoutfloatingcolumn.
6.Providingshearwallwillgiveupto70%morestrength and stability to the structure. Displacement in shear wall modelwillbelesserascomparetootherstructure.
7.Installationofshearwallinhavinglesserheightwon’tbe asofeconomicnote.
8.Pushoveranalysisisusedtodetermineperformancepoint and target displacement method is used and targeted displacementis250mmwhichisinlimit.
9.Baseshearisincreasedwithincreaseinnumberofstory andalsoinshearwallcase.
10. Base shear is much higher in pushover analysis than linearanalysis.
International Research Journal of Engineering and Technology (IRJET) e-ISSN: 2395-0056 Volume: 09 Issue: 08 | Aug 2022 www.irjet.net p-ISSN: 2395-0072
[1]. C.M. Wanga and Z.Y. Tay (20110), “Very Large Floating Structures: Applications, Research and Development”, Elsevier Procedia Engineering Vol.14,pp62–72.
[2]. A. Wonglert , P. Jongpradist and P. Jamsawang(2018) , “Bearing capacity and failure behaviorsoffloatingstiffeneddeepcementmixing columns under axial load”. Elsevier Soils And Foundation.
[3]. L.M.Shaik ,S.Karri,K.VSathiandJ.Kalla(2020), “Seismic behaviour of RCC buildings with and withoutfloatingcolumns”,ElsevierMaterialsToday: Proceedings.
[4]. K.Yue , B.Liang , Y.Shao, M. Zhao , Z.Chen and W.Lu(2021),“Lateralbehaviorofwoodframeshear walls sheathed with densified plywood under monotonic loading”, Elsevier Thin-Walled Structures.
[5]. Balsamoa A, Colombo A, Manfredi G, Negro P & ProtaP(2005),”Seismicbehaviorofafull-scaleRC framerepairedusingCFRPlaminates”.Engineering StructuresVol.27,pp769–780.
[6]. Bardakis V.G., Dritsos S.E. (2007), “Evaluating assumptions for seismic assessment of existing buildings “.Soil Dynamics and Earthquake EngineeringVol.27,pp223–233.
[7].GarciaReyes,HajirasoulihaIman,PilakoutasKypros, (2010),”Seismic behaviour of deficient RC frames strengthenedwithCFRPcomposites”.Engineering StructuresVol.32,pp3075-3085.
[8].MaisonBruceF.andNeussCarlF(1985),“Dynamic analysisofafortyfourstorybuilding”,ASCE:Journal ofStructuralEngineering,Vol.111,pp1559-572.
[9]. Maison Bruce F. and Ventura Carlos E (1981), “Dynamic analysis of a thirteen story building”, ASCE:Journal of Structural Engineering, Vol. 117, pp3783-3803.
[10].MortezaeiA.,RonaghH.R.,KheyroddinA.,(2009), “Seismic evaluation of FRP strengthened RC buildings subjected to near-fault ground motions havingflingstep”,CompositeStructuresVol.92,pp 1200–1211.
[11].NiroomandiaA.,MaheribAandMahiniS.S.(2010) “Seismic performance of ordinary RC frames
retrofitted at joints by FRP sheets”, Engineering StructuresVol.32,pp2326-2336.
[12].VasilopoulosaA.AandBeskosD.E.(2006),“Seismic design of plane steel frames using advanced methodsofanalysis”,SoilDynamicsandEarthquake EngineeringVol.26, pp1077-1100.
[13].Hossam El-Sokkaryand Khaled Galal (2020),“MaterialQuantitiesofReinforcedMasonry versus Reinforced Concrete Shear Walls,” Structures Vol.27,pp767-779