International Research Journal of Engineering and Technology (IRJET) e-ISSN: 2395-0056

Volume: 09 Issue: 08 | Aug 2022 www.irjet.net p-ISSN: 2395-0072
International Research Journal of Engineering and Technology (IRJET) e-ISSN: 2395-0056
Volume: 09 Issue: 08 | Aug 2022 www.irjet.net p-ISSN: 2395-0072
Anurag Kumar1 , Lalsingh Chouhan2
1Assistant professor, CSE, Dr. A.P.J. Abdul Kalam UIT Jhabua, Madhya Pradesh, India
2Assistant professor, CSE, Dr. A.P.J. Abdul Kalam UIT Jhabua, Madhya Pradesh, India ***
Abstract - : Weather and climate prediction are dominated by high dimensionality, interactions on many differentspatialandtemporalscales,andchaoticdynamics. Machine learning techniques can predict rainfall by extracting hidden patterns from historical weather data. In this technique apply the Multiple Linear regression (MLR) and Support vector regression (SVR) model for rainfall prediction. To design and implement the system, we have gathered 115 years of data from 1901 to 2017 from Kaggle. Our proposed model has been tested and validated with respect to Multiple Linear regression and Support Vector regression. Compared results reveal the satisfactory performance, the SVR had provided maximum accuracy
Key Words: Rainfall prediction, Machine Learning, Linear Regression, Support Vector Regression, Accuracy
Weather forecasting on the basis of historical data is a complexbutveryhelpfultask.Whichcomeswithseveral problems that require to be solved in order to achieve optimalresult.Rainfallpredictionisimportantalloverthe worldanditplayakeyroleinhumanlife.It’sdifficultto predict rainfall precisely with varying atmosphere conditions. Accurate rainfall predictions are crucial for severalareasofsocietyspeciallyinagriculture.Indiaisan agricultural country and therefore the success of agriculturedependsofrainfall.Thereareseveralrecourses forwaterbutinIndiaagricultureisusuallydependenton rainfall. The weather has a significant impact on the agriculturalindustryandbecauseofthat,havingtheability to predict it helps farmers in their day-to-day decisions such as how to plan efficiently, minimize costs and maximize yields. The concept of machine learning is gettingusedineverysectortoreducethelabourcostand increase the productivity. Every Machine learning algorithm has three steps: Depiction, judgment, development. Depiction guides us to represent the discoveredknowledgedonefromthedatamining.Herewe have used the two most popular machine learning techniques to predict the rainfall. Those techniques are SupportVectorregressionandMultipleLinearRegression
Linear Regression [1][12] is very useful for finding
relationship between two continuous variables, one is independentvariableandanotherisdependentvariable.In Statistics,Linearregressionreferstoamodelwhichshow relationship between two variables and how one can impacttheother.InLinearRegression,itshowshowthe variationinthe“dependentvariable”canbecapturedby changeinthe“independentvariables”.LinearRegressionis statistical technique which used to generate insights on consumerbehaviour,understandingbusinessandfactors influencingprofitability.Linearregressionscanbeusedin business to evaluate the trends and make decision for future. For example, if an organisation’s sales have increasedregularlyeverymonthforthelastfewyears,by conductinglinearanalysisonthesalesdatawithmonthly sales,thecompanycouldforecastsalesinfuturemonths. We have used Multiple linear regression model, unlike simple linear regression MLR has multiple independent variables. SVRisaregressionalgorithm,sowecanuseSVR forworkingwithcontinuousValuesinsteadofClassification which is SVM [2]. In regression technique we try to minimisetheerrorratewhileinSVRwetrytofittheerror withinacertainthreshold.
Therearemanyworksintheliteraturefortheprediction ofrainfall.Thissectiondiscussessomeoftheworkrelated toourproposedmethodology.
KumarAbhisheketal.haveproposedarainfallprediction technique using neural network in [3]. The proposed model in [3] predicts the rainfall of Udupi district from Karnataka state of India. BPNN with feed forward, layer recurrent and BPNN with cascade feed forward neural networks are experimented. The proposed model takes 70% of the data for training and 30% for testing. The recurrentnetworkgivesbetteraccuracywhencompared toBPNN.TheMSEishighinBPNN
NasimulHasan,NayanNath(2015)thispaperexhibitsa robust rainfall prediction technique in view of recent rainfall data of Bangladesh using Support Vector Regression(SVR),arelapsemethodologyofSupportVector Machine(SVM).Itwaschallengingtomakea100percent perfectpredictionandthedatawaspreprocessedmanually
International Research Journal of Engineering and Technology (IRJET) e-ISSN: 2395-0056
Volume: 09 Issue: 08 | Aug 2022 www.irjet.net p-ISSN: 2395-0072
to suit the algorithm [5]. The evaluation results of the study conducted on the data shows that the projected technique performs higher than the conventional frameworksintermofaccuracyandprocessrunningtime [5]. Approach yielded the utmost prediction of almost 99.92%.
G.Mahalakshmi and S.Sridevi (2016) presented a paper which gives detailed survey of the various techniques appliedforforecastingdifferenttypesoftimeseries.This survey covers the overall forecasting models, the algorithmsusedwithinthemodelandotheroptimization techniquesusedforbetterperformanceandaccuracy[6]. Thevariousperformanceevaluationparametersusedfor evaluatingtheforecastingmodelsarealsodiscussedinthis paper [6]. This study gives the reader an idea about the variousresearchesthattakeplacewithinforecastingusing thetimeseriesdata.
Paper proposed by [7] introduced rainfall prediction systemusingdeepminingKNNtechnique.AsingleKvalue isgivenwhichisusedtofindthetotalnumberofnearest neighbours that helps to determine the class label for unknowndata.Similarparametersareclusteredintosame typeofclusterandthuswiththehelpofKNNwedetermine thecategoryofaspecificdatasets.Thisalgorithmdoesnot require time for training of classification or regression. Thissystemmaynotleadtogoodaccuracyiftheincorrect valueofKispicked.
Sandeep Mohpatra and Animaka Upadhyay (2017) presented a paper that focuses on use of data mining techniques for predicting rainfall of an area on basis of some dependent features like precipitation and wet day frequency.Theyhavecollecteddataforyearsrangingfrom 1901to2002ofBangalore,India[8].Theregressionmodel developed has been trained and validated against the actual rainfall of that area. The performance of the algorithmwasfurtherboostedusingEnsembletechniques usingk-fold[8].
Chandrasegar,KSHarsha(2017)carriedexperimentona heuristic prediction of rainfall using machine learning techniques. This paper discusses the rate of rainfall in previousyearsaccordingtovariouscropseasonslikeRabi, KharifandZaidandpredictstherainfallinfutureseasons [9]. Also, it measures the different categories of data by linear regression method. Results help farmers to make correctdecisiontoharvestaparticularcropaccordingto cropseasons.Linearregressionmethodsuggeststhelower correlationbetweenvariouscropseasons[9].
InthispaperwehaveusedMultipleLinearregression andSupportVectorregressiontopredicttheamount ofrainfall.
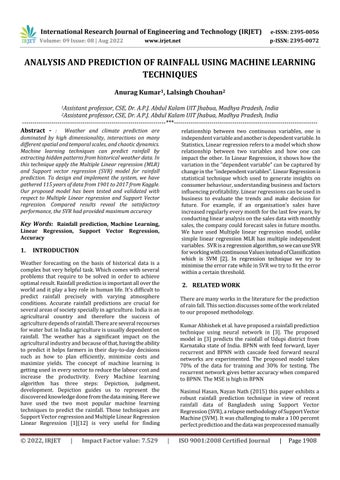
The proposed method is based on the multiple linear regressionandsupportvectorregression.Thedataforthe predictioniscollectedfromthepubliclyavailablesources andthe70percentageofthedataisfortrainingandthe30 percentage of the data is used for testing. Figure 1 describestheblockdiagramoftheproposedmethodology. Multipleregressionisusedtopredictthevalueswiththe helpofdescriptivevariablesandisastatisticalmethod.It is having a linear relationship between the descriptive variable and the output values. The following is the equationformultiplelinearregression:
Yi = β0 + β 1x1 + β 2x2 + ... β kxk + ε
Here we are using "k" for the number of predictor variablesandwehave k+1regressionparametersWhere, β0 is constant term, β1 variable is coefficient of x1, β2 variable iscoefficientfor x2, βk is xk coefficientvariable and ε is error associated with predicted value. Support VectorRegression(SVR)usesthesame principleasSVM,
Figure 1. block diagram of the proposed methodology
International Research Journal of Engineering and Technology (IRJET) e-ISSN: 2395-0056
Volume: 09 Issue: 08 | Aug 2022 www.irjet.net p-ISSN: 2395-0072
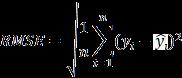
but only for regression problems. SVR works on the principle of structural risk minimization from statistical learningtheory[2]andestablishesahyperplanethatcan predictthedistributionofdata.TheprincipleoftheSVR algorithmhasagivensetofinputtrainingdataset {(Ai, Bi), i = 1, 2,...,k}, xi ∈ RM ,whereAi istheinput3-Dvector, Bi ∈ R is the response output data, and k is the number of samplings.Theoptimallineardecisionfunctioninthehighdimensionalfeaturespaceisexpressedasfollows:
f (xI) = ωA + b
where ω referstoweightvectorsand b denotesthebias.
For this study data has been collected from the publically available source Kaggle [11], it contains the monthlyrainfallofeachstateofIndiaformJan1901toDec 2017.
MAE [10] is the average of the absolute differences betweentheactualvalueandthemodel’spredictedvalue. ThebiggertheMAE,themoreserioustheerroris.
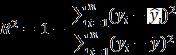
RMSEorRootMeanSquaredError[10]issimilartoMSE, just the final value is square rooted and calculated the squareoferrorsinMSE.
MSEorMeanSquaredError[10]isoneofthemostpopular metricsforregressionalgorithms.Itissimplytheaverage oftherealvalue’ssquareddifferencewiththeregression model’spredictedvalue.
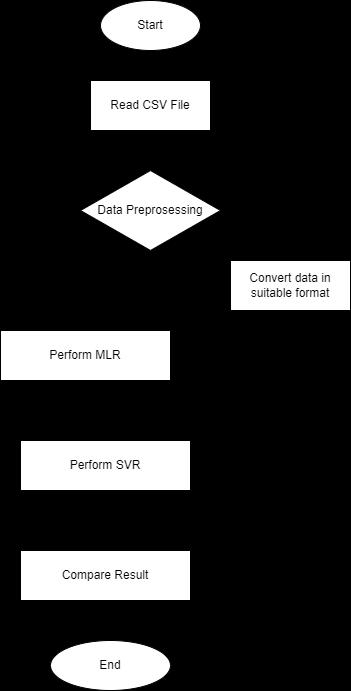
R² or Coefficient of Determination is a prevalent metric [10].R²usestwomeansquarederrorcalculations.While thefirstisthemeansquareofeachrealvalueversusthe averageofobservations,thesecondisthemeansquared erroroftheactualvalueversusthepredictedone.
MAPE or Mean Absolute Percentage Error [10] is the averageabsolutedifferencebetweentheactualvalueand thevaluepredictedbythemodeldividedbytherealvalue
Wehaveconsidereddatasetfrom1901to2017ofBihar state,India.Visualizationfromdifferentgraphshelpusto understandmoreaboutthe dataanddrivesus todecide thenextsteptotaken.Itprovidesimportantperceptions.
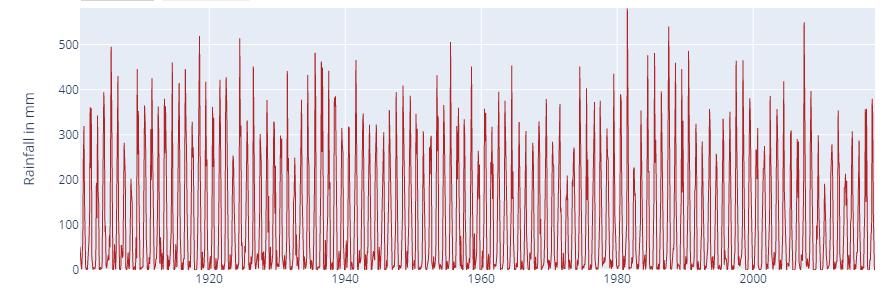
Forecastinggivesappropriateandreliableinputregarding to present, past and future activities with definite numerical and scientific methods. There are some steps involvedinpredictingthenumericalvaluesforaspecific task.Initialstepistorecognizetheproblemwithcomplete analysisandsecondiscollectingtheappropriatedata to analyze the problem for further estimation. After estimation,comparetheactualandestimatedvalueswith necessaryactions.Thedataisarrangedinsuchawaythat rainfall is plotted according to year i.e., yearly counts of rainfallshowningraph1.
International Research Journal of Engineering and Technology (IRJET) e-ISSN: 2395-0056
Volume: 09 Issue: 08 | Aug 2022 www.irjet.net p-ISSN: 2395-0072
Graph 1 Overall monthly data plot of rainfall from 1901 to 2017
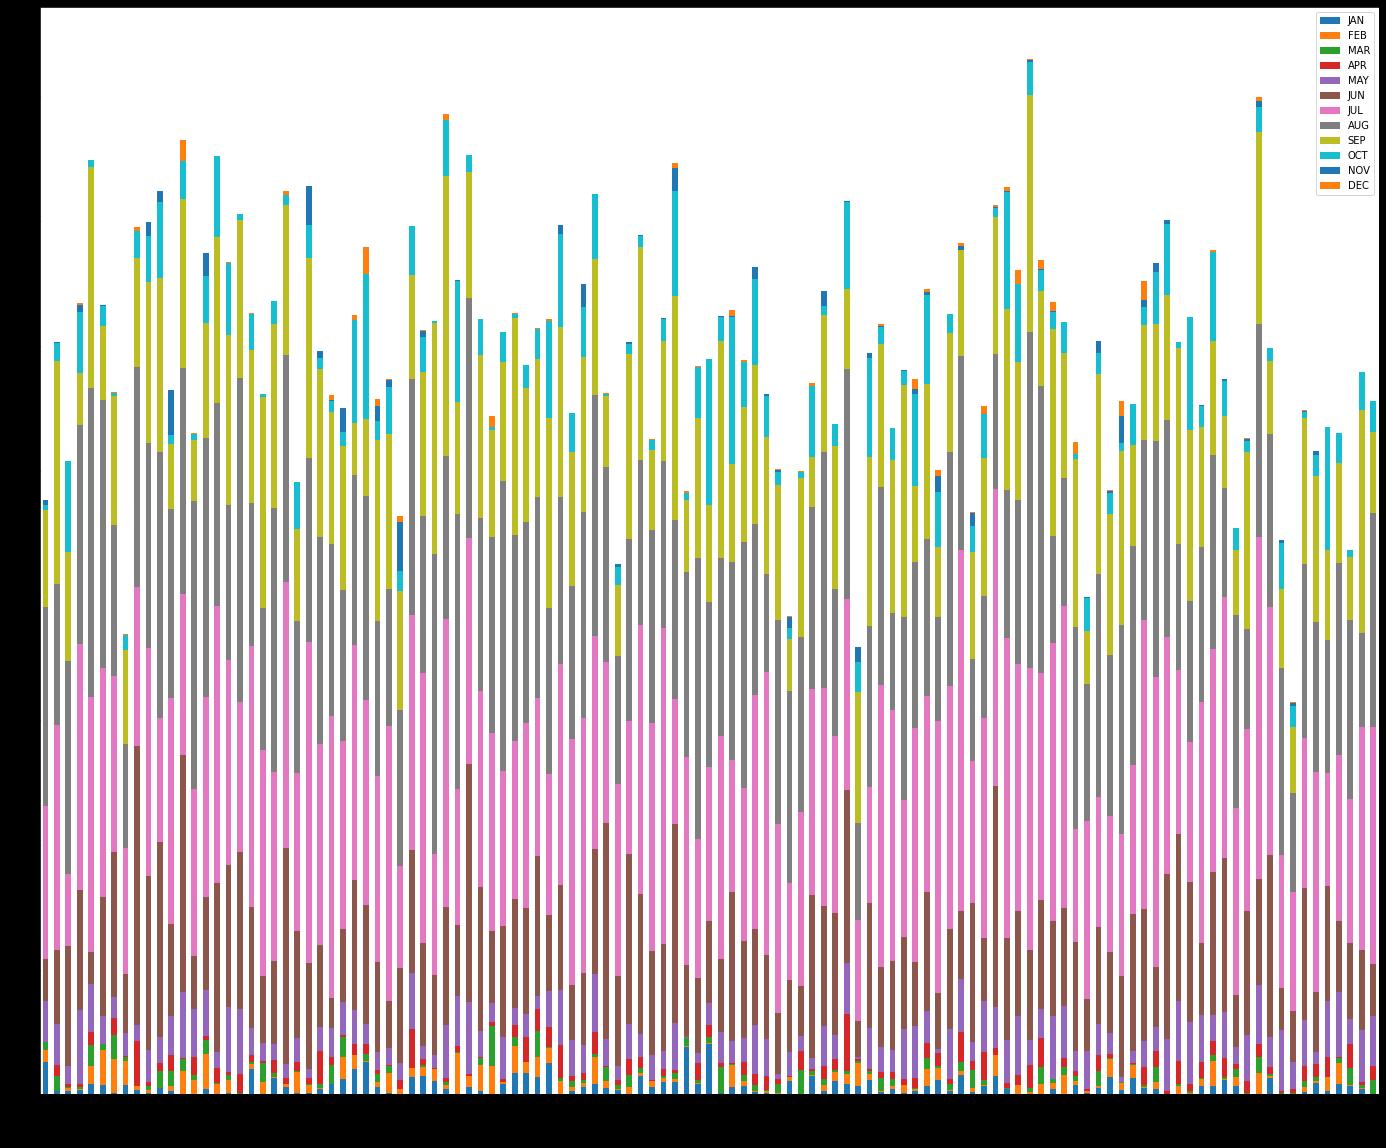
Graph 2: Stacked bar chart of each year © 2022, IRJET | Impact Factor value: 7.529 | ISO 9001:2008 Certified Journal | Page1911
International Research Journal of Engineering and Technology (IRJET) e-ISSN: 2395-0056
Volume: 09 Issue: 08 | Aug 2022 www.irjet.net p-ISSN: 2395-0072
The stacked bar chart above depicts the rainfall of each monthforaparticularyear,acrosseachmonth.wecansee fromthesortedoverallbarheightsthatyear1987hasthe highestrainfalland2010haslowest.
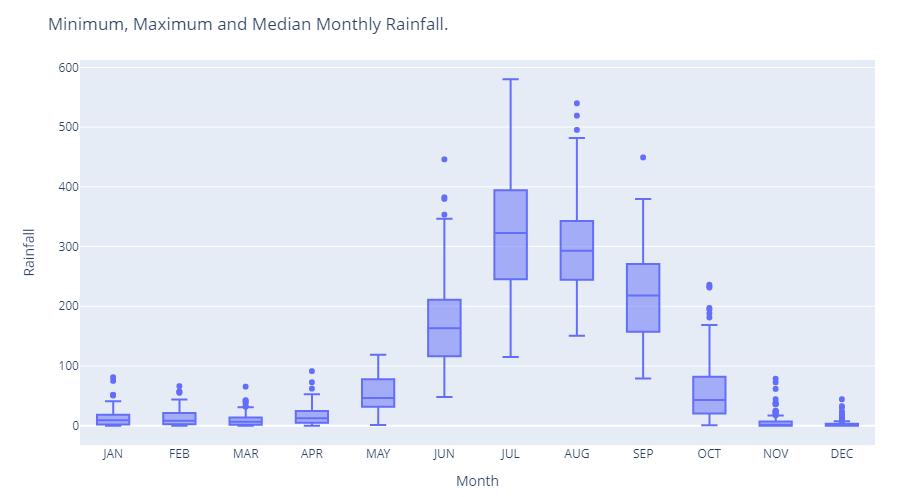
Graph3showtheminimum,maximumandmadianrainfall ineachmonthusingboxplot.Itclearlyindicatesthat,
The rainfall in the months January, February, March, April, November and December is very less.
TherainfallinthemonthsMayandOctoberis average.
TherainfallinthemonthsJune,July,August,and Septemberarehighcomparedtorainfallin othermonthsoftheyear.
Wecanseeaseasonaleffectwithacycleof12months.
Graph 3: Box Plot graph describing the rainfall in each month.
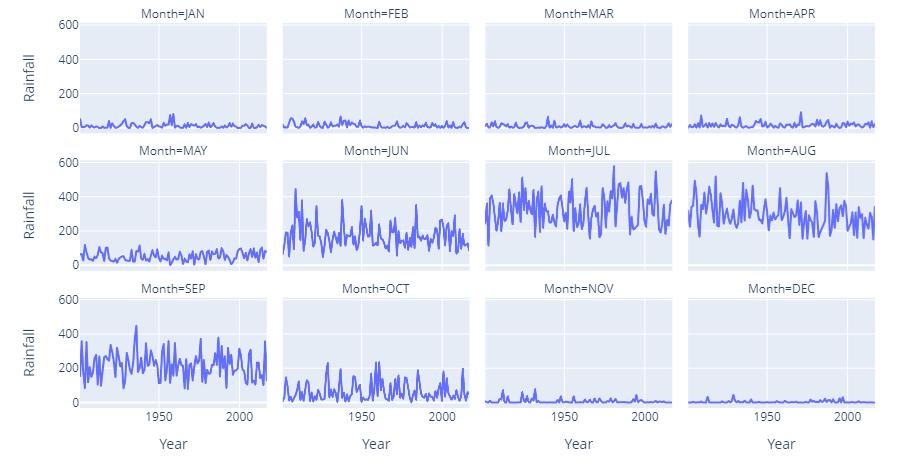
Graph4 showsrainfallineachmonthfrom1901to2017.
Graph 4: Monthly rainfall through history.
International Research Journal of Engineering and Technology (IRJET) e-ISSN: 2395-0056
Volume: 09 Issue: 08 | Aug 2022 www.irjet.net p-ISSN: 2395-0072
we divide the data into Train and Test Sets: Number of entries(trainingset,testset):(982,422)Nowwecompare theMLRandSVRmodeltounderstandwhichmodelgives betterresult. Splittingthedatasetintotrainandtestdatawe havetaken70%fortrainingand30%fortestingthemodel. Atotalof982traindataand422testdataisused. Plotting
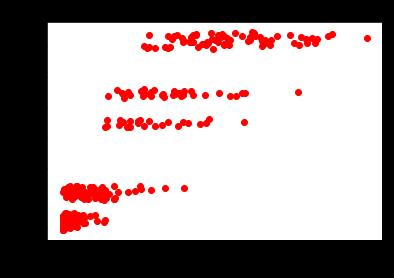
thescatter plotof actual andpredicted rainfall weget the followinggraphs.Graph5showsthescatterplotofactualvs predicted rainfall using MLR model. In Graph 6 we can clearly see the comparison between each actual and predictedvalue.
Graph 5: Scatter Plot of Actual vs Predicted rainfall using MLR
Graph 6: Actual vs Predicted rainfall using MLR
International Research Journal of Engineering and Technology (IRJET) e-ISSN: 2395-0056
Volume: 09 Issue: 08 | Aug 2022 www.irjet.net p-ISSN: 2395-0072
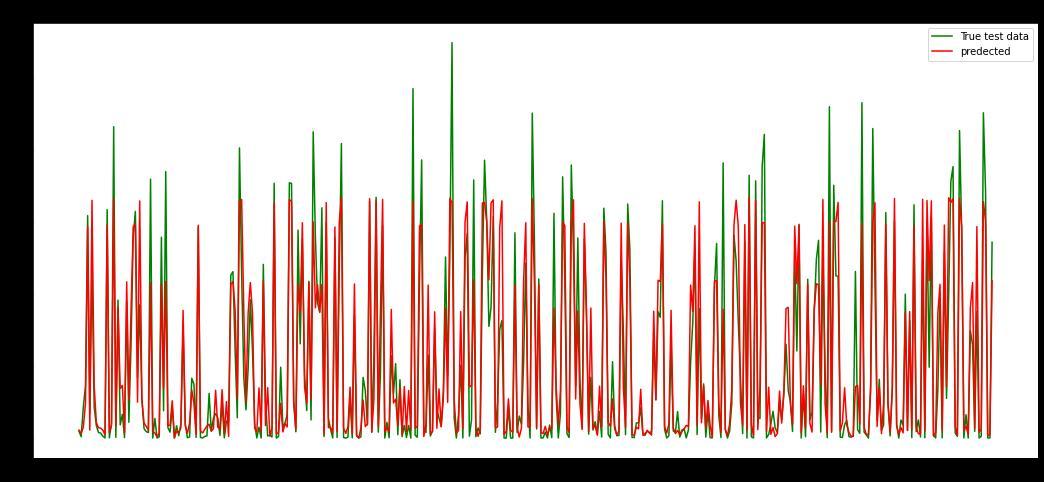
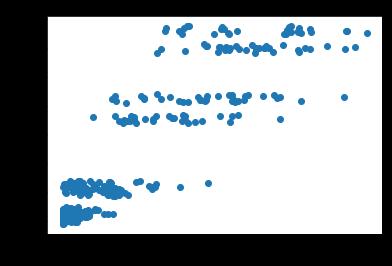
Graph 7: Scatter Plot of Actual vs Predicted using SVR
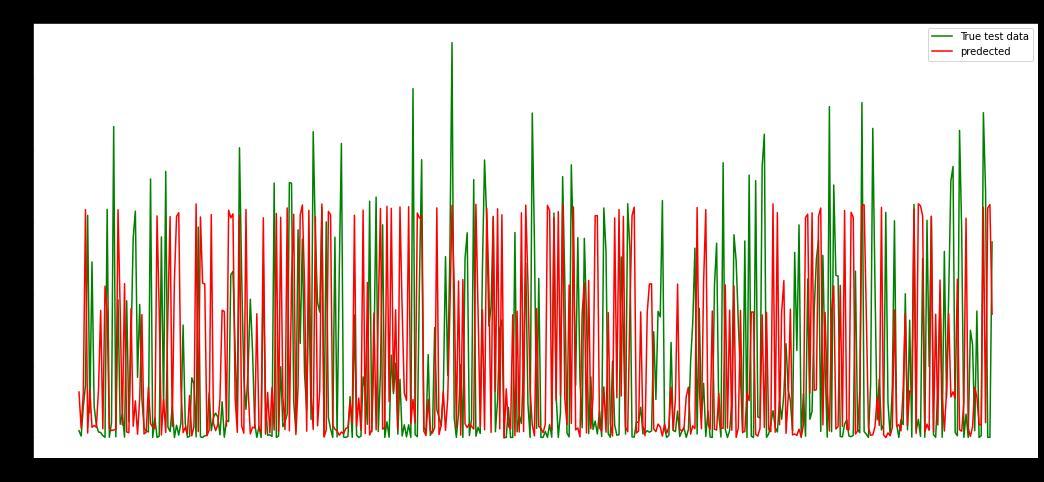
Graph 8: Actual vs Predicted rainfall using SVR
International Research Journal of Engineering and Technology (IRJET) e-ISSN: 2395-0056
Volume: 09 Issue: 08 | Aug 2022 www.irjet.net p-ISSN: 2395-0072
Graph7showsthescatterplotofactualvspredicted rainfallusingSVRmodel.
InGraph8wecomparedeachactualandpredictedvalue.
Table 1 Comparison of MLR and SVR Performance
S. No. matrices LR SVR
1 Trainscore 0.827149236683498 0.828585087676299
2 Testscore 0.811790903215551 0.836907038442013
3 MAE 0.249229855446679 0.248383868743224
4 MSE 0.154636268612835 0.151737104047022
5 RMSE 0.393238183055556 0.389534470935528
6 MAPE 0.674927107614465 0.614009940253406
7 R2Score 0.833790903215551 0.836907038442013
Here,weareusingtimeseriesanalysistopredicttherainfall usingmonthlyrainfallfromyear1901to2017.Foryieldto accuracy,machinelearningalgorithmssuchasMLRandSVR, wereimplementedandtestedonthegivendatasetsfromthe Bihar states. Both algorithms are compared with their accuracy.Comparingthedifferentperformancematrices,we canconcludethatSVRaccuracyisbetterthanMLR.
[1] AmanpreetSingh,NarinaThakur,AakankshaSharma “Areviewofsupervisedmachinelearningalgorithms”, 20163rd InternationalConferenceonComputingfor SustainableGlobalDevelopment(INDIACom)IEEEOct 2016.
[2] Mariette Awad, Rahul Khanna, “Support Vector Regression, “Efficient Learning Machines Theories, Concepts,andApplications forEngineersandSystem Designers”Apress(pp.67-80),January2015.
[3] KumarAbhishek,AbhayKumar,RajeevRanjan,Sarthak Kumar, “A Rainfall Prediction Model using Artificial Neural Network”, 2012 IEEE Control and System GraduateResearchColloquium(ICSGRC2012),pp.8287,2012.
[4] H.M.Meighani,C.Ghotbi,T.J.Behbahani,andK.Sharifi, “Evaluation of PC-SAFT model and support vector regression(SVR)approachinpredictionofasphaltene precipitation using the titration data,” Fluid Phase Equilibria,vol.456,pp.171–183,Jan.2018.
[5] NasimulHasan,NayanChandraNath,RisulIslamRasel, “A Support Vector Regression Model for Forecasting Rainfall”, Proceeding of International Conference on ElectricalInformationandCommunicationTechnology (EICT2015),IEEE,554-559.
[6] G.Mahalakshmi,Dr.S.Sridevi,Dr.S.Rajaram,“ASurvey onForecastingofTimeSeriesData”,IEEE,2016.
[7] Zahoor Jan, Muhammad Abrar, Shariq Bashir and Anwar M Mirza, "Seasonal to interannual climate prediction using data mining KNN technique", InternationalMulti-TopicConference,pp.40-51,2008.
[8] Sandeep Kumar Mohpatra, Anamika Upadhyay, ChannabasavaGola,“RainfallPredictionBasedon100 yearsofMeteorologicalData”,InternationalConference on Computing and Communication Technologies for SmartNation(IC3TSN),IEEE,2017,162-166.
[9] Chandreshekhar Thirumalai , M. Laxmi Deepak, K Sri Harsha,KChaitanyaKrishna,“HeuristicPredictionof Rainfall using Machine Learning Techniques”, International
[10] Ravish Raj “Evaluation Metrics for Regression Models in Machine Learning” https://www.enjoyalgorithms.com/blog/evaluationmetrics-regression-models
[11] https://www.kaggle.com/datasets/saisaran2/rainf all-data-from-1901-to-2017-for-india
[12] Thirumalai, C., Harsha, K. S., Deepak, M. L., & Krishna, K. C. (2017). Heuristic prediction of rainfall usingmachinelearningtechniques.2017International Conference on Trends in Electronics and Informatics (ICEI)