International Research Journal of Engineering and Technology (IRJET) e-ISSN: 2395-0056

Volume: 09 Issue: 08 | Aug 2022 www.irjet.net p-ISSN: 2395-0072
International Research Journal of Engineering and Technology (IRJET) e-ISSN: 2395-0056
Volume: 09 Issue: 08 | Aug 2022 www.irjet.net p-ISSN: 2395-0072
1M.Tech. (Geotech.) Student, Civil Engineering Department, G.N.D.E.C. Ludhiana, Punjab. 2Associate Professor, Civil Engineering Department, G.N.D.E.C. Ludhiana, Punjab 3Assistant Professor, Civil Engineering Department, G.N.D.E.C. Ludhiana, Punjab ***
Abstract - This paper consists of analysis of numerical modelling of strip footing over sandy slope supported with number of piles to improve its bearing capacity. For this investigation, the FEM-based PLAXIS-3D version 2013 programme was adopted. The footing width was assumed to be 0.8m. The sand slope was taken 3:2 (H:V). Piles were the only reinforcements used in the sandy slope. BCI was reviewed for both piled and non-piled case to evaluate which was the most efficient case. The variables were pile diameter, pile spacing, pile length, pile row positioning and footing position with respect to the slope crest. The findings show that stabilizing the soil slope with piles has major influence on the BC of strip base footing. The enhancement in BCI develops when pile spacing is reduced and simultaneously further improvement rises as pile diameter along with pile length increases. As a result, reducing pile spacing improves BCI by approximately 67% and reducing crest distance of pile improves BCI by approximately 47%. The effective increment in BCI in piled cases can be seen up to 2B, but in non-piled cases it is up to 3B. R² = 0.75 and R² = 0.79 is obtained from regression analysis for piled and nonpiled case respectively via excel. Regression analysis-based settlement equations is likely to be beneficial for researchers for rapid calculation as a part of the design considerations for similar conditions.
Key Words: FEM, PLAXIS, piled, non-piled, sandy slope,BCI,regressionanalysis.
Abbreviations: FEA = Finite Element Analysis, FEM = Finite Element Method, BC = Bearing Capacity, BCI = Bearing Capacity Improvement, BCR = Bearing Capacity Ratio, CoV = Coefficient of Variation.
Footings are built on sloping surfaces or near to a slope crestinavarietyofscenarios.Whenafootingisplacedon sloping terrain, the BC of a footing may be drastically reduced, depending on where the footing is placed in relationtotheslope.Asaresult,usingafoundationsystem may be impossible, and adopting uneconomic foundation types such as piles or caissons, becomes the only viable choice. As a result, throughout the time, the issue of soil slope stabilisation has become one of the most attractive
fields of scientific research and attracting a great deal of attention
Slope stability can be improved by changing the slope surface geometry, utilising soil reinforcement, or adding continuous or discontinuous retaining barriers like as walls or piles or sheet piles. The stability of such foundations over slope is a hard subject in geotechnical engineering since both overall stability and BC must be considered.
In the present research, the study on piled and non-piled slopes was conducted, and PLAXIS-3D was adopted to exploretheBCenhancementoffootingslyingonpiledand non-piledslopes.
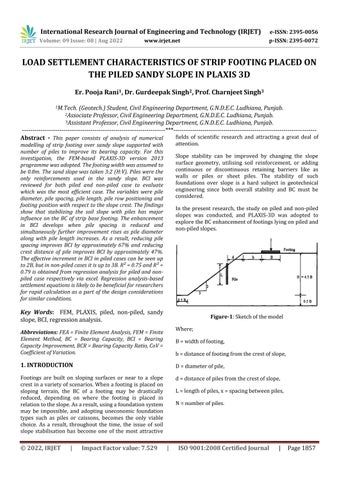
Figure-1:Sketchofthemodel
Where;
B=widthoffooting, b=distanceoffootingfromthecrestofslope, D=diameterofpile, d=distanceofpilesfromthecrestofslope, L=lengthofpiles,x=spacingbetweenpiles, N=numberofpiles.
International Research Journal of Engineering and Technology (IRJET) e-ISSN: 2395-0056
Volume: 09 Issue: 08 | Aug 2022 www.irjet.net p-ISSN: 2395-0072
Followingweretheobjectivesofcurrentresearch:
1. Toanalysetheeffectofthe varyingcrestdistance ofthefootingontheloadbearingcapacityofslope inPLAXIS3D.
2. To study the effect on load carrying capacity of strip footing due to different spacing and size of pilesinPLAXIS3D.
3. Tostudytheeffectofvaryingcrestdistanceofpile andevaluatingtheoptimallocationofrowofpiles inslopeinPLAXIS3D.
4. To develop regression models to determine the settlement of strip footing in PLAXIS 3D for piled andnon-piledslope.
In the present research, the study on piled and non-piled slopes was conducted, and PLAXIS-3D was adopted to explore the BC enhancement of strip footing. Total 156 models were constructed and evaluated to fulfil the objectives.Firstthreeobjectiveswerefulfilledbyanalysing 60modelsand96modelswererequiredforthefulfilment of last objective. For extreme accuracy, the mesh is generated via fine meshing. The details of model parametersaretabulatedbelow–
Table-1:Parametersformodelevaluation
Series Constant Parameters Variable Parameters No. of models
1. D/B=0.075, d/B=0.0,L/B=1.00 x/B=0.5,1.00, 1.25,2.5 4
2. D/B=0.075, d/B=0.0,L/B=1.25 x/B=0.5,1.00, 1.25,2.5 4
3. D/B=0.075, d/B=0.0,L/B=2.00 x/B=0.5,1.00, 1.25,2.5 4
4. D/B=0.075, d/B=0.0,L/B=3.00 x/B=0.5,1.00, 1.25,2.5 4
5. D/B=0.10,d/B=0.0, L/B=1.00 x/B=0.5,1.00, 1.25,2.5 4
6. D/B=0.10,d/B=0.0, L/B=1.25 x/B=0.5,1.00, 1.25,2.5 4
7. D/B=0.10,d/B=0.0, L/B=2.00 x/B=0.5,1.00, 1.25,2.5 4
8. D/B=0.10,d/B=0.0, L/B=3.00 x/B=0.5,1.00, 1.25,2.5 4
9. D/B=0.15,d/B=0.0, L/B=1.00 x/B=0.5,1.00, 1.25,2.5 4
10. D/B=0.15,d/B=0.0, L/B=1.25 x/B=0.5,1.00, 1.25,2.5 4
11. D/B=0.15,d/B=0.0, L/B=2.00 x/B=0.5,1.00, 1.25,2.5 4
12. D/B=0.15,d/B=0.0, L/B=3.00 x/B=0.5,1.00, 1.25,2.5 4
13. D/B=0.075, x/B=0.5,L/B=2.00 d/B=1.0,1.5,2. 0,2.5 4
14. D/B=0.10,x/B=0.5, L/B=2.00 d/B=1.0,1.5,2. 0,2.5 4
15. D/B=0.15,x/B=0.5, L/B=2.00 d/B=1.0,1.5,2. 0,2.5 4
Totalnumberofproposedmodelswere60.
WhereB=widthoffooting,b=distanceoffootingfromthe crest of slope, D = diameter of pile, d = distance of piles from the crest of slope, L = length of piles, x = spacing betweenpiles,N=numberofpiles.
Table-2:MaterialcriteriausedinPLAXIS3Dforthe currentwork
Parameter Sand Footing Piles MaterialModel MohrCoulomb Linear Elastic Embedded Piles
DrainageType Drained Nonporous -
DryUnitWeight (γ) 18.94 kN/ 25kN/ 25kN/
Young’sModulus (E) 20000 kN/ 3*107 kN/ 3*107 kN/ Poisson’sRatio (ν) 0.3 0.1Cohesion(C) 0kN/ -Internalfriction angle(ϕ) 42° - -
International Research Journal of Engineering and Technology (IRJET) e-ISSN: 2395-0056
Volume: 09 Issue: 08 | Aug 2022 www.irjet.net p-ISSN: 2395-0072
Where,
C=Cohesionofsand(kN/m²), E=Young’sModulusofsand(kN/m²), ϕ=Angleoffrictionofsand(:), γ=Unitweightofunsaturatedsand(kN/m³), ν=Poisson’sratioofsand.
4.RESULTS
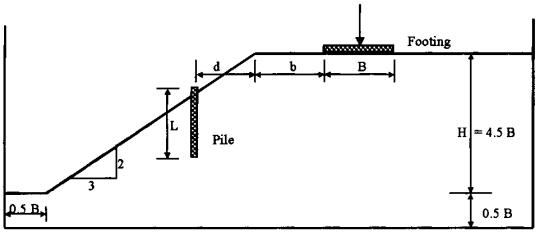
Figure-2:DimensionsofmodelconstructedinPLAXIS-3D
Thevaryingparameterswere
Distance of footing from crest of slope (b): 0B (0m), 0.5B (0.4m), 1B (0.8m), 2B (1.6m), 3B (2.4m),4B(3.2m).
Distance of pile from crest of slope (d): 2.5B (2m),2B(1.6m),1.5B(1.2m),1B(0.8m),0B(0m).
Diameter of piles (D): 0.075B (0.06m), 0.10B (0.08m),0.15B(0.12m).
Length of piles (L): 1B (0.8m), 1.25B (1m), 2B (1.6m),3B(2.4m).
Spacing between piles (x): 2.5B (2m), 1.25B (1m),1B(0.8m),0.5B(0.4m).
Strip footing dimensions were assumed to be constants such as Width of footing (B)= 0.8m and thickness of strip footing = 0.2m. Piles inserted in slope were taken as circular piles. The 96 models were tested to carry out the regressionanalysistoobtaintheloadsettlementequations, out of which 48 models were for non-piled case and 48 were of piled slopecase. This analysis was carried out for thecorrespondingloadat50mmallowablesettlementand factor of safety of 0.5 and 1.5, which results in the load valuesof1300kN,650kNand1950kNrespectively.
Representing all the results of model tests which were conductedforthefulfilmentofobjectives.Theinfluenceon pileloadbearingcapacityandpilecountonbothpiledand non-piledslopescenarioswasdiscussed.
4.1 Effect of varying crest distance of footing:
Two sets of modelling were done in both piled and nonpiled situation to investigate the influence of the edge distance (b) on sand slope. Curves clearly indicates the footing moves away from the edge of the slope, the load bearing capacity improves considerably in both piled and non-piled cases. The influence of piling on BC tends to grow. The footing's maximum load carrying capacity increases as the edge distance (b/B) gets larger on both piledandnon-piledslopes,buttheslope'soriginappearsto have little effect on the footing's load carrying capacity whenthecrestdistancesrisesmorethan3B.
2
1.5
1
0.5
2.5 0 1 2 3 4 5
BCI b/B NOPILESCASE PILESINSTALLEDCASE
0
Graph-1: VariationofBCIwithandwithoutpilesfor varyingcrestdistanceoffooting(b)
4.2 Effect of varying of pile diameter:
A series of experiments were carried out to analyse the effects of pile diameter using a row of piles placed at the slope peak with same pile length (L/B=3) and pile dimensions(D)of0.06,0.08,and0.12m.
International Research Journal of Engineering and Technology (IRJET) e-ISSN: 2395-0056
Volume: 09 Issue: 08 | Aug 2022 www.irjet.net p-ISSN: 2395-0072
2
1.5
1
2.5 0.05 0.1 0.15 0.2
BCI D/B
0.5
x/B=0.5 x/B=1 x/B=1.25 x/B=2.5
Graph-2: VariationofBCIwithpilediameter(D/B)for differentpilespacing(b/B=0,L/B=3.0)
Thegraphclearlyshowsthatevenaspilediametergrows, so does footing performance. An improvement of up to 210% is obtained for a pile diameter (D/B=0.15) as compared to that without piles. This demonstrates thatas thepilediametergrows,sodoesitsrigidityandresistance to deformation of soil beneath the footing, and thus the BCR. Enhancing the pile diameter reduces the spacing betweenpileswhenthereareanequalnumberofpilesina row. As a result, will enable less soil mass movement betweenpiles,resultinginbetterpilerowperformance.
The graph shows how the BCI factor varies with length (L/B) for a footingclose the slopecrest(b/B=0) and for a rowofpilespositionedattheslopecrest.Thethreecurves showasimilartrendoffootingresponseforthenumerous pile diameters. The greater the overall increase in performance in bearing capacity, the longer the pile. BC is improved by 22% when a row of piles placed to x/B=0.5 and D/B=0.15anda regularpilelength ofL/B=3. The rise inbearingcapacityisobtainedwithincreaseinpilelength. Increasing the pile length increases the pile's embedded portion in the stable soil beneath, resulting in improved pilestabilitybelowthefooting.
2
BCI L/B
1.75
1.5
2.25 0.75 1.25 1.75 2.25 2.75
Graph-3: VariationofBCIwithpilelength(L/B)for differentpilediameters(d/B=0andx/B=0.5)
ThegraphdepictsthefluctuationsinBCIwithpilespacing (x/B) for various lengths. With a decrease in pile spacing (x/B), the BC of the model footing increases significantly. x/B=0.5 and pile length L/B=3 might result in 2.20 times increase in bearing capacity over that without slope stabilisation. However, the improvement in bearing capacityisonly1.32timesforwithpilespacingx/B=2.5.As a result, reducing pile spacing from x/B=2.5 to x/B=0.5 improvesBCIbyapproximately67%.
2
1.75
BCI X/B
1.5
D/B=0.15 D/B=0.10 D/B=0.075 1
2.25 0 1 2 3
1.25
L/B=3 L/B=2 L/B=1.25 L/B=1
Graph-4: VariationofBCIwithpilespacing(x/B)for differentpilelengths(d/B=0andD/B=0.15)
International Research Journal of Engineering and Technology (IRJET) e-ISSN: 2395-0056
For various pile diameters, the chart depicts the variation in BCI with pile row place (d/B). It is clear that the BC increases as the pile row gets closer to the slope crest. Modelling with different pile diameters reveals a similar pattern. As a result, the most suitable pile location in aspectsoffootingmaximumloadisneartheslopecrest.
CASE 2: Regression analysis-based equation for piled slope-
δ = -9.209 + 1.179γ + 1.368ϕ – 0.00137E –54.479ν (ii)
Where,
δ=Settlementoffootinginslope(mm), E=Young’sModulusofsand(kN/m²),
ϕ=Angleoffrictionofsand(:),
2
1.75
γ=Unitweightofunsaturatedsand(kN/m³),
ν=Poisson’sratioofsand.
1.5
1.25
2.25 0 1 2 3
BCI d/B
1
D/B=0.15 D/B=0.10 D/B=0.075
Graph-5: VariationofBCIwithpilerowlocation(d/B)for differentpilediameters(x/B=0.5andL/B=2.0)
Researchersareunsureofthebestpositionforpilerowsto provide the best slope stability and safety factor. A most effective pile location for improved footing BC is at the slopecrest.Other pilelocations have enhancedtheslope's overall stability but these piles did not intersect with the failure plane, these cannot prevent lateral soil deformations beneath the footing and near the slope. As a result of decreasing the pile's crest distance from d/B=2.5 to d/B=0, the BCIincreasesfrom 1.33 to 1.95,indicatinga 47%improvement.
4.6 Regression analysis of strip footing placed on the sandy slope without and with piles intallation:
The regression analysis was performed via excel after obtainingthesettlementvaluesof96modelsforbothpiled andnon-piledcases.Followingequationsproduced–
CASE 1: Regression analysis-based equation for nonpiled slope-
δ = 20.268 + 0.985γ + 1.225ϕ – 0.00182*E –60.315ν (i)
Fornon-piledsituation,R=0.89whileR²=0.79wasfoundto be dependent variable as coefficient of determination in the regression analysis. Similarly, for piled situation, R=0.87 and R²=0.75 was found to be dependent variable known as coefficient of determination in the regression analysis. Based on these coefficients, the model may be assumed to predict the dependent variable quite good. Boththeregressionanalysissettlementequationsarevalid for non-piled and piled slope beneath strip footing of similarshapesanddimensionsevaluatedinthisstudyand is likely to be beneficial for researchers for rapid and appropriate estimation as a part of the design considerationsrespectively.
SuitabledimensionsandlocationimprovetheBCofastrip footing supported on granular soil significantly. The final conclusionmaybeformedbasedonthefindingsofcurrent studyare:
1. BCIincreasesrapidlywiththeincreaseindistance of footing from crest of slope in both cases. EffectiveincreaseinBCIinpiledcasecanbeseen up to 2B whereas in non-piled case up to 3B and fromthisonwardsriseinBCIislesssignificant.
2. The BCI improves the most when pile spacing is kepttoaleastandpilelengthismanagedtokeep to a maximum. Enhancing the pile diameter improves the BC performance of the footing even more. However, pile spacing has a much larger impactonBCIthanpilelengthordiameter.Ascan be seen, decreasing pile spacing from x/B=2.5 to x/B=0.5increasesBCbyapproximately67%.
3. Reducing crest distance of pile up to zero, improves BCI by approximately 47%. Thus, the bestpositionofarowofpilesisattheslopecrest, consideringBCIratherthantheoverallstabilityof theslope.
Volume: 09 Issue: 08 | Aug 2022 www.irjet.net p-ISSN: 2395-0072 © 2022, IRJET | Impact Factor value: 7.529 | ISO 9001:2008 Certified Journal | Page1861
International Research Journal of Engineering and Technology (IRJET) e-ISSN: 2395-0056 Volume: 09 Issue: 08 | Aug 2022 www.irjet.net p-ISSN: 2395-0072
4. For non-piled situation, R²=0.79 and for piled situation, R²=0.75 was found to be dependent variable known as coefficient of determination in the regression analysis. Obtained regression analysis settlement equations are valid for nonpiled and piled slope beneath strip footing of similar cases is beneficial for rapid and appropriatecalculation.
[1] Acharyya, R., & Dey, A. (2019). Assessment of bearing capacity for strip footing located near sloping surface considering ANN model. Neural Computing and Applications, 31(11), 8087–8100. https://doi.org/10.1007/s00521-018-3661-4
[2] Alamshahi, S., & Hataf, N. (2009). Bearing capacity of strip footings on sand slopes reinforced with geogrid and grid-anchor. Geotextiles and Geomembranes, 27(3), 217–226.https://doi.org/10.1016/j.geotexmem.2008.11.011.
[3] Altalhe, E. B., Taha, M. R., & Abdrabbo, F. M. (2015). Behaviorofstripfootingonreinforcedsandslope.Journal of Civil Engineering and Management, 21(3), 376–383. https://doi.org/10.3846/13923730.2014.890646
[4] As’ad Munawir, M. D., Zaika, Y., & Agoes Soehardjono, M. D. (2013). Bearing Capacity of Continuous Footing on Slope Modeling with Composite Bamboo Pile Reinforcement.
[5] Azzam, W., & Farouk, A. (n.d.). Experimental and Numerical Studies of Sand Slopes Loaded with Skirted Strip Footing Wave barriers for earthquake View project Screw piles View project. https://www.researchgate.net/publication/259196573
[6] Bhartiya, P., Basu, D., & Chakraborty, T. (2021). Nonlinear Settlement of Piled Rafts in Sandy Soil. International Journal of Geomechanics, 21(11). https://doi.org/10.1061/(asce)gm.1943-5622.0002192.
[7] Erenson, C., Terzi, N. U., & Yilmazturk, F. (2015). ISSN 2320-5407 International Journal of Advanced Research (2015), Volume 3, Issue 12, 1100 – 1102. In International Journal of Advanced Research (Vol. 3). http://www.journalijar.com
[8] Nasr, A. M. (2014). Behavior of strip footing on fiberreinforced cemented sand adjacent to sheet pile wall. Geotextiles and Geomembranes, 42(6), 599–610. https://doi.org/10.1016/j.geotexmem.2014.10.004.
[9] Pusadkar, S. S., Mankar, A. U., & Scholar, P. G. (n.d.). Performance of Strip Footings on Slope Reinforced with Inclined Pile. International Journal of Civil Engineering andTechnology,7(3),211–222.
www.jifactor.comttp://iaeme.com/Home/issue/IJCIET?Vo lume=7&Issue=3h.
[10]Sawwaf,M.A.el.(n.d.).StripFootingBehavioronPile and Sheet Pile-Stabilized Sand Slope. https://doi.org/10.1061/ASCE1090-02412005131:6705
[11]Sawwaf,M.el,&Azzam,W.(n.d.).Bearingcapacityof a strip footing adjacent to a sand slope with soft pocket. https://www.researchgate.net/publication/361561015
[12] Sawwaf, M. el. (2010). Experimental and numerical study of strip footing supported on stabilized sand slope. Geotechnical and Geological Engineering, 28(4), 311–323. https://doi.org/10.1007/s10706-009-9293-9.
[13] Sawwaf, M. el. (n.d.). Lateral Resistance of Single Pile Located Near Geosynthetic Reinforced Slope. https://doi.org/10.1061/ASCE109002412006132:101336
[14] Sharafi, H., & Sojoudi, Y. (2016). Experimental and numerical study of pile-stabilized slopes under surface loadconditions.InternationalJournalofCivilEngineering, 14(4),221–232.
2022, IRJET | Impact Factor value: 7.529 | ISO 9001:2008 Certified Journal | Page1862