International Research Journal of Engineering and Technology (IRJET) e-ISSN: 2395-0056

Volume: 09 Issue: 08 | Aug 2022 www.irjet.net p-ISSN: 2395-0072
International Research Journal of Engineering and Technology (IRJET) e-ISSN: 2395-0056
Volume: 09 Issue: 08 | Aug 2022 www.irjet.net p-ISSN: 2395-0072
Shewale S R1 , Pol C B2
1PG Student, Dept. of Civil Engineering, Walchand College of Engineering, Sangli, Maharashtra, India, 416415
2Professor, Walchand College of Engineering, Sangli, Maharashtra, India, 416415 ***
Abstract - Quality estimation of concrete is necessary and important part in any structural construction. Knowing the integral properties like moisture content of concrete, controlled monitoring can be done. Moisture effect on dielectric properties of fresh concrete remains as the focal point of research. Differentiation of Concrete grades based on its Dielectric parameters can be used for quality check, strength prediction and estimation of integrity of structure. Most of the works reported influence of moisture on limited range frequenciesofElectromagneticwavesthroughGPR.This work explores the effect of fresh concrete parameters on a wider band of frequencies. Concrete ingredient and curing response of concrete for 28 days is presented. Vector Network Analyzer is used over whole X-band to measure the dielectric response which is calibrated using NRW method through MATLAB program. After adding water to the dry mix, the Dielectric Properties (Permittivity, Permeability) of fresh concrete remain practically unchanged for the first 24 hours. Measurement uncertainties are alsodiscussedinterms oftheir causes and effects.
Allmaterialscanbeelectricallycharacterizedinthe frequency domain by their complex permittivity (ϵ) and permeability (μ), which influence their response to electromagnetic (EM) radiation. Not just for research but alsoforindustrialapplications,detailedknowledgeofthese constitutivepropertiesisnecessary.Duetotheuncertainties inproductionprocesses,measuringamaterial'sproperties frequentlyistheonlywaytodetermineitsframework.
Concrete is a dielectric material; various experiments are done based on dielectric response of concrete. Dielectric properties (Complex Permittivity and Permeability)representtheelectromagneticresponsewhen materialisplacedinelectricfield.Thedielectricproperties arebasedontheelectricalpolarizationofamaterial.Dueto Polarization, a material will store and absorb electrical energy when placed in an electrical field. Permittivity(ϵ) determines the amount of electrical energy that can be stored bya material.When permittivityis expressedwith relativetothepermittivityofvacuumisknownasrelative permittivity(ϵr).RelativePermittivityofAiris1,Wateris 80,Iceis3-4,Sandis3-5.Aswaterissocalledpermanent
dipole with highest relative permittivity, in a concrete mixturewatercanplayhugeroleinchangingitsdielectric properties. Hence water content becomes influencing parameterwhilemeasuringdielectricpropertyofconcrete [1]. The microwave techniques have a great potential for quality assessment of cement-based materials due to a numberofadvantages;theyaredirectlysensitivetowater content and can be non-contact, remote, one-sided and wireless [2]-[5]. A wide range of investigations into microwave characterization of cement-based materials includingdeterminationofw/cratioanddielectricproperty determination using different approaches have been conducted [6]-[10]. The dielectric response of M25 grade concrete according to curing days and response its ingredientismeasuredandpresentedinthispaper.
Permittivity- “The absolute permittivity, often defined as permittivity or simply permittivity andsymbolized by the Greekletter(ϵ),isameasureoftheelectricpolarizabilityofa dielectric in electromagnetism”. When an electric field is applied,amaterialwithahighpermittivitypolarizesmore than a substance with a low permittivity, allowing the materialtostoremoreenergy.[11]
Permeability-Permeabilityis“theamountofmagnetization thatamaterialacquiresinelectromagnetisminresponseto anappliedmagneticfield.The(μ)Greekletteriscommonly usedtodenotepermeability”.[11]
ScatteringParameters-TheScatteringparametersarealso known as ‘S-parameters’. S-parameters are ‘complex matrices that display the amplitude/phase (Reflection/Transmission)characteristicsinthefrequency domain’. S11,S12,S21,S22 are the scattering parameters. “Theportwherethesignalemergesisdesignatedbythefirst numberafterthe"S,"andtheportwherethesignalisapplied is designated by the second number. S21, then, is a measurementofthesignalleavingport2incomparisonto the RF stimulus going into port 1”. Since the input and output ports are the same, it implies a reflection measurementwhenthenumbersarethesame(forexample, S11).S11andS22denotesreflectionofwavewhileS12and S21representthetransmissionofwave[11]
International Research Journal of Engineering and Technology (IRJET) e-ISSN: 2395-0056
Volume: 09 Issue: 08 | Aug 2022 www.irjet.net p-ISSN: 2395-0072
1. Formulationofproblemstatement,development ofmethodology,andpossiblevalidationwithhigh qualityresearcharticle.
2. Toproposeamonitoringtechniqueforconcrete.
3. Checkdielectricresponseoffreshconcreteand responsewithdifferentdaysofcuring.
4. Tomonitorsettingandhardeningusing UltrasoundPulseVelocity.
The methodology includes creating a mould for fresh concrete testing and fixing the grade of concrete to test. Creating the MATLAB code for converting the response recordedbyVectorNetworkAnalyzer(VNA)intodielectric form. The wave is then passed through the sample and response is recorded, the recorded response is then run throughMATLABcodeandgraphsofresponseisplottedand observationisconcluded.
This method provides a direct calculation of both the permittivity and permeability from the s-parameters. It is the most commonly used method for performing such conversion. Measurement of reflection coefficient and transmissioncoefficientrequiresallfour(S11,S21,S12,S22) ora pair(S11,S21)ofs-parametersofthematerial under testtobemeasured.However,themethoddivergesforlow loss materials at frequencies corresponding to integer multiplesofone-halfwavelengthinthesamplewhichisdue to the phase ambiguity. Hence, it is restricted to optimum sample thickness of λg/4 and used preferably for short samples.NRWmethodisdivergentatintegralmultiplesonehalfwavelengthinthesample.Thisisduetothefactthatata point corresponding to the one-half wavelength the sparameter (S11) gets very small. For a small sparameter(S11)valuetheuncertaintyinthemeasurementof the phase of S11 on the VNA is very large. Therefore, the uncertainty caused the divergence at these frequencies. Thesedivergencescanbeavoidedbyreducingthesample length,butitisdifficulttodeterminetheappropriatesample lengthwhenits(ϵ)and(μ)areunknown[10].
AdvantagesofNRWmethod
_Fast,non-iterative.
_Applicabletowaveguidesandcoaxialline.
DisadvantagesofNRWmethod
_divergenceatfrequenciesthatarehalfwavelengthtimes thelengthofasample.
Useabriefsamplewheneverpossible.
_Lowlossmaterialsarenotappropriate.
The procedure proposed by NRW method is deduced from the following equations:
S11= andS21= ThecorrectrootandintermsofS-parameter.
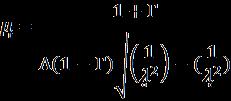
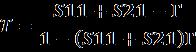
TheReflectionCoefficientcanbededucedas
TheTransmissionCanbeWrittenas
The‘Permeability’isgivenas
Where ‘λ is Free Space Wavelength’ and ‘λ is the cut off wavelength’and
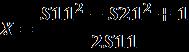
The‘Permittivity’canbedefinedas
By Solving with above equations Permittivity can be calibratedby Here,
International Research Journal of Engineering and Technology (IRJET) e-ISSN: 2395-0056
Volume: 09 Issue: 08 | Aug 2022 www.irjet.net p-ISSN: 2395-0072
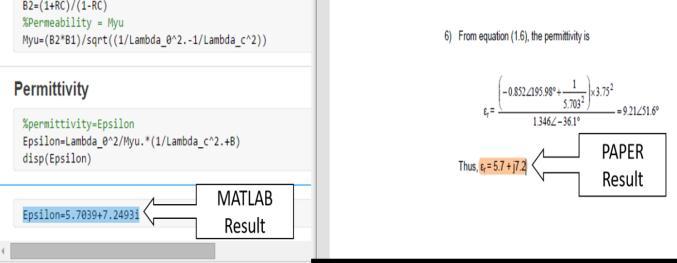
The MATLAB codes for NRW method was created and verifiedwiththeresultspublishedintheverifiedpaper[10].
concrete mix was prepared in concrete mixer. After the concretemixwaspreparedthecubesandmouldwerefilled and to avoid the air gaps and honey combing kept on vibrating table for 5 minutes. The cubes then left for 24 hoursinopenairforsettingofconcrete.Thesamplemould wasputtotestunderVNAandUPVfor24Hours.Proposed experimentalsetupisshowninfigure3
Fig -1: CodeValidation
Need of mould which can hold the concrete in its flowing stateandgiveeasyaccesstotheconnectionforVNAandUPV antennas and transducers respectively was noted. So accordingly,awoodenmouldwasprepared.Asemi-circular wooden mould with flexi glass fixed inside to fix the antennas and transducers was made. The wooden mould with radius 150 mm and width of 100 mm was built. The mouldwasthencuttofixtheflexiglassof3mmthicknessto attach the antennas and transducers. Figure 2 shows the mouldpreparedtotestthefreshconcreteusingVNA.
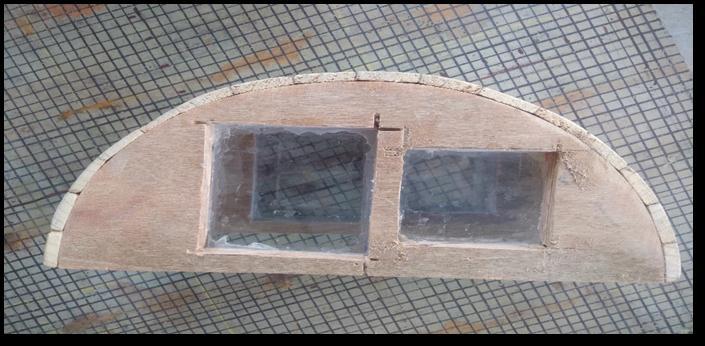
Fig -3: ExperimentalSetupSketchforTestingFresh Concrete
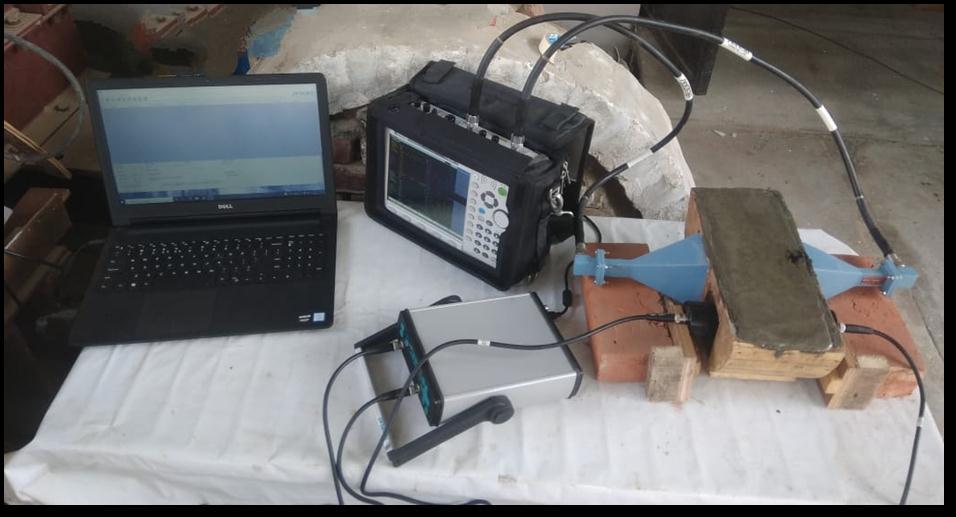
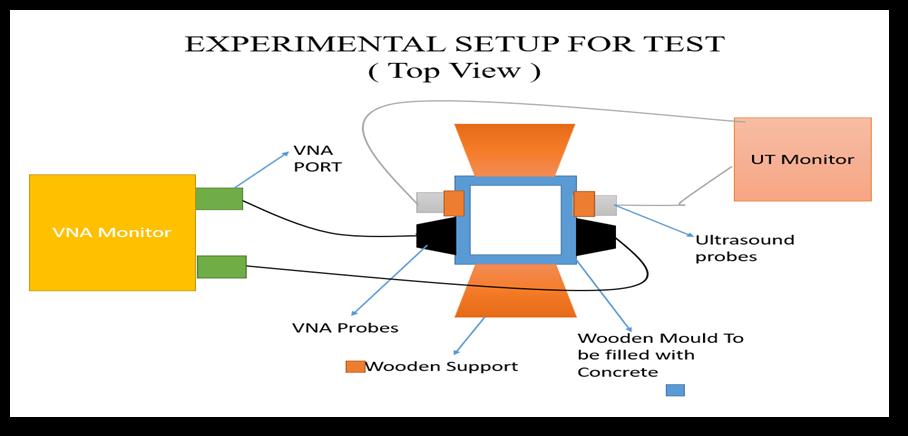
Fig -2: MouldforFreshConcreteTesting.
Testswerecarriedouton10cubeof150mmcastedwith mouldsampleofM25GradeConcrete.TheconcretehadW/C ratioof0.55tofacilitatemoisturemovementandCement, Sand,10 mm and 20 mm Aggregate mix ratio of “1:2:1.32:1.98”.TheconstituentswereOPC43gradecement, river sand and maximum 20 mm sized aggregates. The
Fig -4: ExperimentalSetupSketchforTestingFresh Concrete
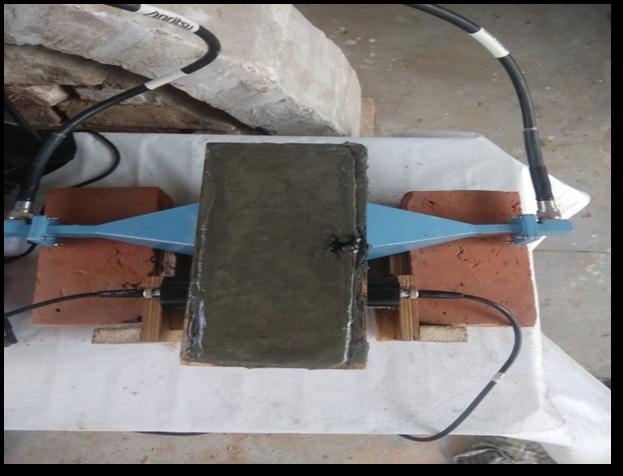
Fig -5: ExperimentalSetupforTestingFreshConcrete
International Research Journal of Engineering and Technology (IRJET) e-ISSN: 2395-0056
Volume: 09 Issue: 08 | Aug 2022 www.irjet.net p-ISSN: 2395-0072
TheVNAantennasandUPVtransducerswerefittedonthe mouldforproperreadingsandreducingerrors.TheUPVwas connected to laptop with installed Pundit link software which recorded the readings automatically. The VNA readingsweretakenmanuallypressingthesavebutton.The readingswererecordedforevery5minutesintervalfor24 hours. Figure 4 shows the connection of Antennas and Transducersonthemouldwhilefigure5presentstheactual setupwithLaptop,VNAandUPVwhichrecordsthedata.
Material which was used for mould preparation and its dielectric response is also recorded before and after experiment is done. The response is plotted as shown in figure6and7forpermittivityandpermeability.
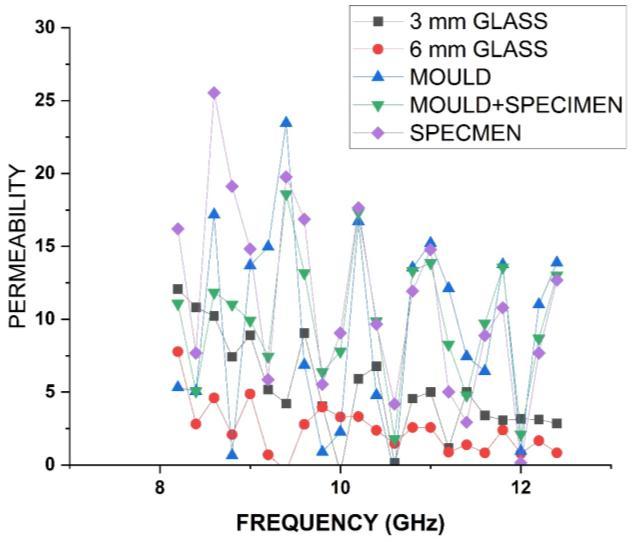
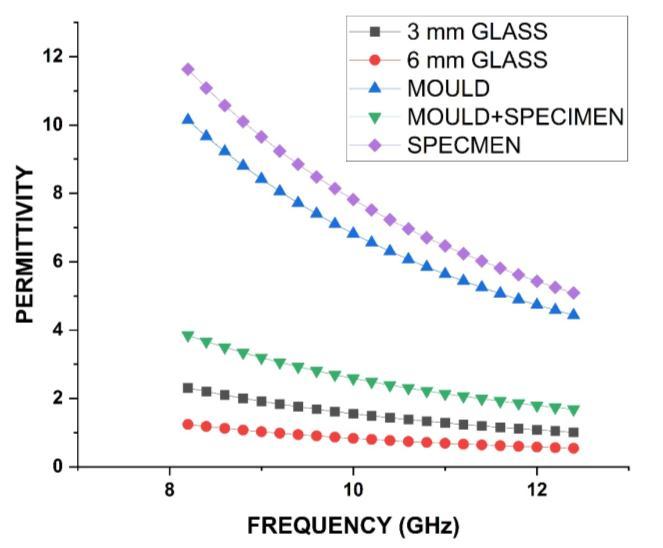
The Specimen obtained from mould gives highest permittivityreadingsaswaterispresentinit.Mouldtakes second place in permittivity value but when mould and specimenaretestedtogetherthewaveabsorptionismore andpermittivityvaluedrops.Thepermittivityvalueforflexi glassisexpectedtofallwhensizeisincreased.Complicated resultsareobtainedwhenpermeabilityisconsidered.
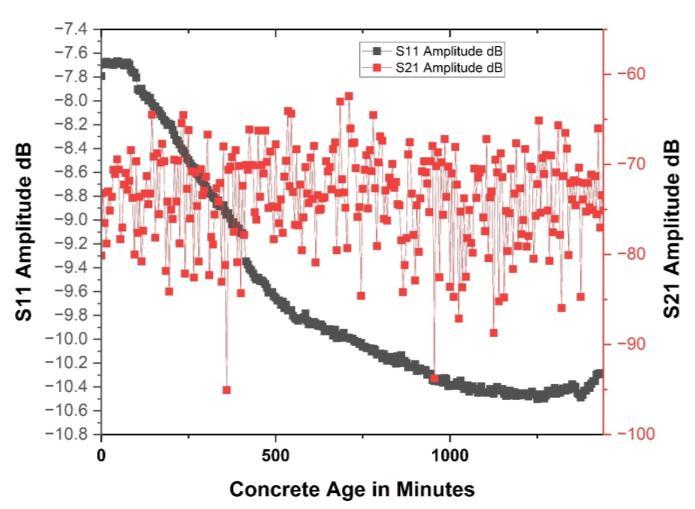
Transmission coefficient (S21) and Reflection coefficient (S11)amplitudechangewasobservedfor24hourssettingof concrete.TheS11amplitudechangedfrom-7.75dBto-10 dBovertheperiodof24hourswhichwasexpectedtrendof high amplitude corresponding to high water content as discussed in Hardened concrete. The curve gradually decreasesasconcretehardens.Fortransmissioncoefficient (S21)amplitudebeingsensitivetowatercontent,ingredient setting showed continuous ups and down throughout the observation.Thebehaviourwasshowningraphplottedin figure8
Fig -6: PermittivityvsFrequencyformould,flexiglassand Specimen
Fig -8: ReflectionandTransmissionCoefficient AMPLITUDEvsAgeofConcrete
Fig -7: PermeabilityvsFrequencyformould,flexiglass andSpecimen
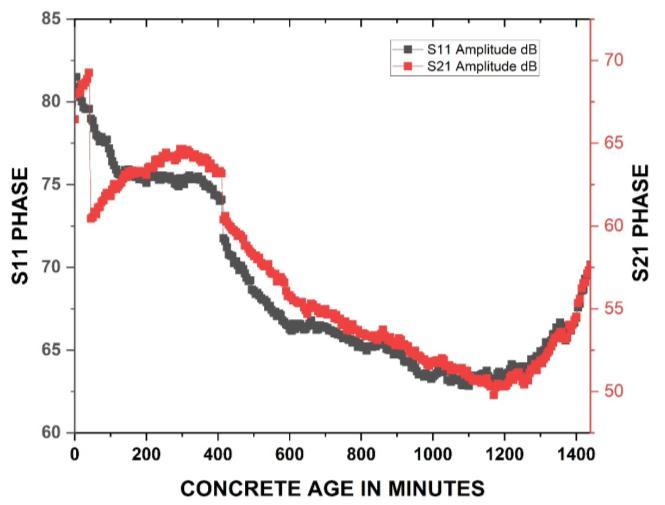
Fig -9: ReflectionandTransmissionCoefficientPHASEvs AgeofConcrete
International Research Journal of Engineering and Technology (IRJET) e-ISSN: 2395-0056
Volume: 09 Issue: 08 | Aug 2022 www.irjet.net p-ISSN: 2395-0072
Also,thetrendofS11phaseandS21phasewasobserved.As showninfigure9,theS11phaseandS21phasecurvenearly followsthesametrendbutvalueofS11phaseishigherthan S21phase.
S11amplitudewasalsoobservedfordifferentcuringdays. As from figure 10 we can conclude that S11 amplitude increaseswithcuringdays.
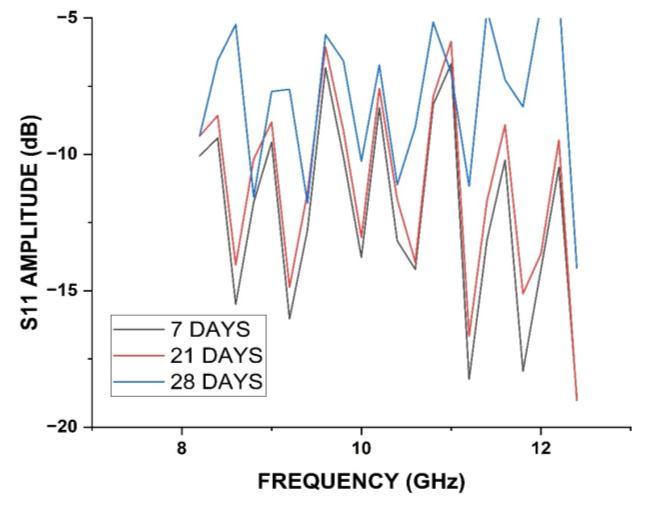
Table -1: ConcreteTestResultsfordifferentdaysofcuring
DAYS WEIGHT (kg) UTM Test (MPa)
Permittivity Permeability
7DAYS 8.25 21.20 0.9153 1.315
7DAYS 8.40 24.20 0.9155 1.321
7DAYS 8.80 14.64 0.919 1.326
13DAYS 8.15 20.44 1.406 0.881
13DAYS 8.25 24.24 1.405 0.880
13DAYS 8.50 21.20 1.404 0.878
21DAYS 8.25 20.44 1.440 1.220
21DAYS 8.30 24.25 1.39 1.30
21DAYS 8.15 27.49 1.47 1.15
28DAYS 8.20 28.99 1.91 0.78
28DAYS 8.20 28.34 1.41 0.669
28DAYS 8.25 24.34 1.40 075
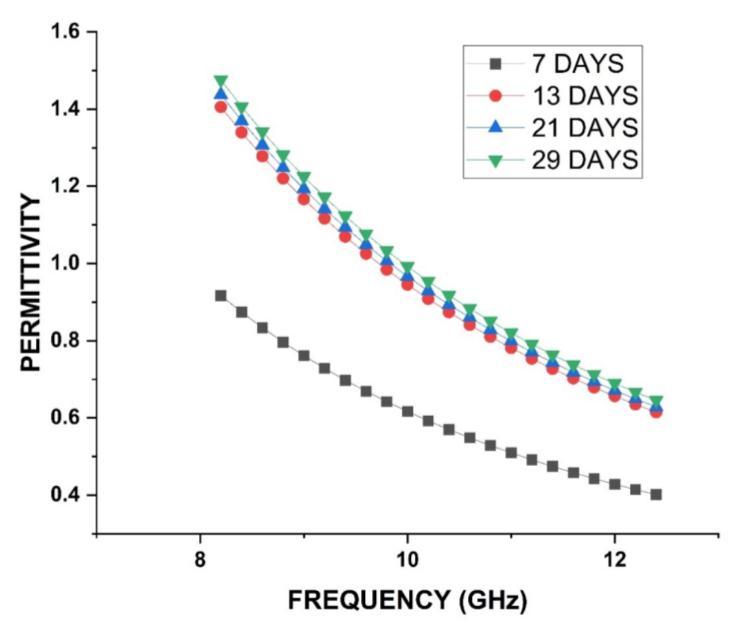
Increase in permittivity with increase in curing days of concrete was noted. As concrete Hardens the permittivity increased. The results were plottedasshown in figure 11 Thevalueof7th daypermittivitywasobservedlessthan1. Thepermittivityvalueat13,21and29th dayswereclose.
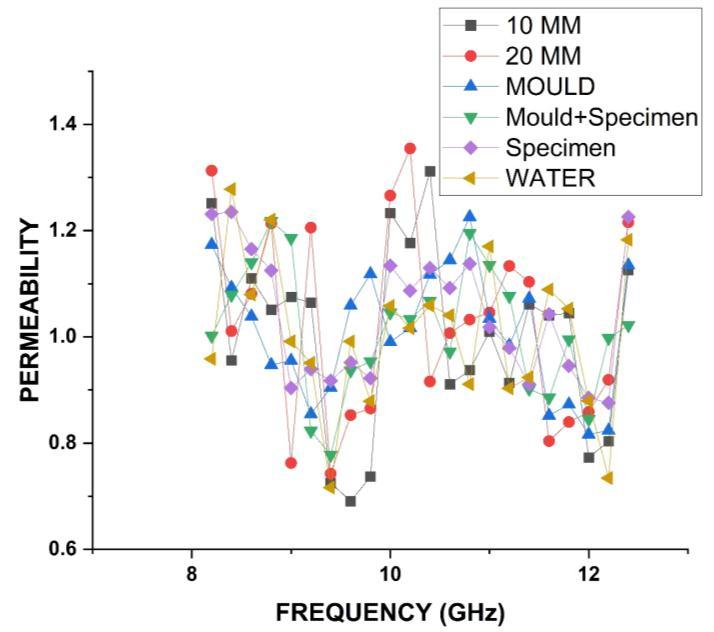
Theingredientsaretestedfortheirdielectricresponsewhen taken for concrete mixture. The ingredients are poured in mouldandtheirresponseisrecorded.Figure12showsthe permittivityresponseofingredientwhilefigure13showsthe permeabilityresponse.
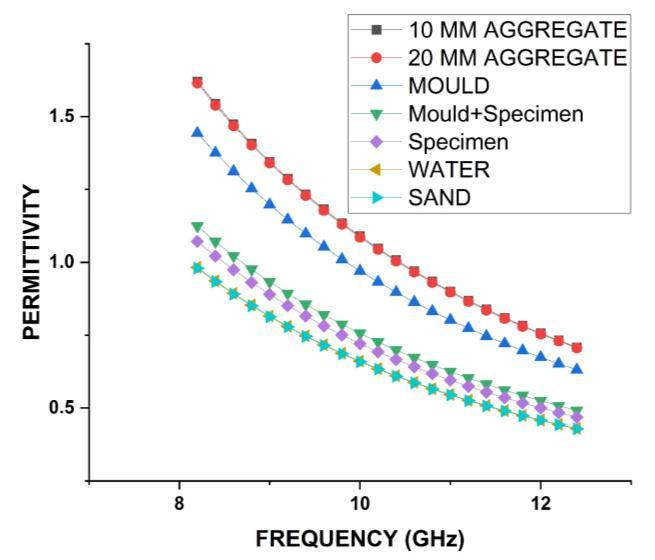
Fig -12: PermittivityvsFrequencyforconcreteingredients
International Research Journal of Engineering and Technology (IRJET) e-ISSN: 2395-0056
Volume: 09 Issue: 08 | Aug 2022 www.irjet.net p-ISSN: 2395-0072
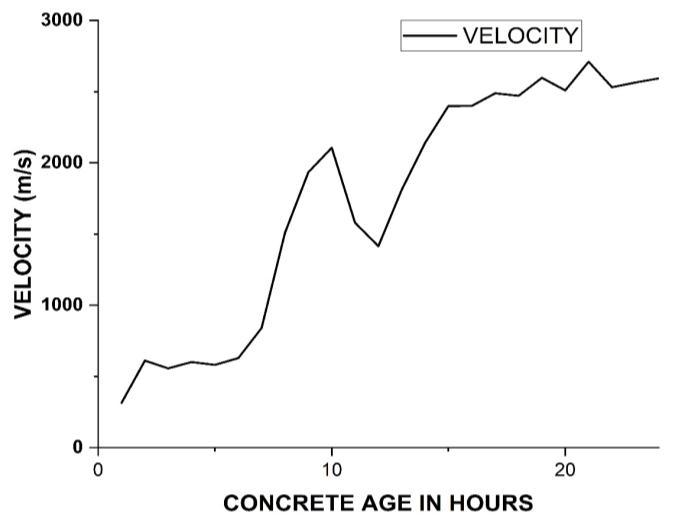
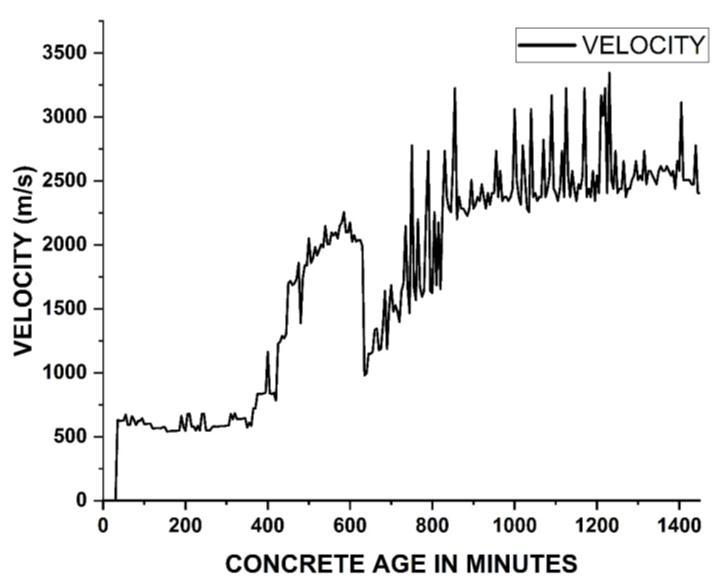
TheUPVobservationswererecordedforwhole24hoursof settingofconcrete.
Thevelocitychangewithtimewasrepresentedinfigure12 and13.Inaddition,theUPVpulsewascaptured.Thepulse data was gathered and processed using the MATLAB application.Thevelocitychangeper5minutesintervaland hourlyintervalwasnoted.Thevelocityincreasewithageof concretewasrecorded.Therewasslightdipinthecurvefrom 10 hours of setting to 13 hours as result of loss of tight contactoftransducerstothemouldaslubricantconnecting betweenreleased.
i. The basic concept of Dielectric properties was discussed.TheapplicationsofDielectricproperties werepresentedandexplained.Theequationsused toextractconstitutiveparametersfromsimulated S-parametersweredescribedandprogrammedin MATLAB.
ii. Decrease in S11 amplitude as concrete changes phase from liquid to semisolid and semisolid to solid was observed. As age of concrete increased, increase in permittivity value and decrease in permeabilityvalueisobserved.
iii. ThetotalS11amplitudechangeof2.5dBisobserve forwhole24hoursofsettingofconcrete.
iv. With increase in curing days the Permittivity increasesbutthechangeinsuccessivedaysresults reduces.
v. Thematerialresultwasalsoobservedandinfluence water can be easily noted with high permittivity valueofspecimen.
vi. Differentiation of ingredients of concrete can be donebasedonthepermittivityresult
vii. Magnetic aspect which is permeability gives complicatedresultsbutfollowssamepattern.
1) Laurens,S.,J.P.Balayssac,J.Rhazi,G.Klysz,andG. Arliguie. "Non-destructive evaluation of concrete moisture by GPR: experimental study and direct modeling." Materials and structures 38,no.9(2005): 827-832.
International Research Journal of Engineering and Technology (IRJET) e-ISSN: 2395-0056
Volume: 09 Issue: 08 | Aug 2022 www.irjet.net p-ISSN: 2395-0072
2) S. Popovics, Concrete Materials: Properties, Specifications, and Testing, 2nd ed. Park Ridge, NJ: Noyes,1992.
3) C.W.Chang,K.M.ChenandJ.Qian,“Nondestructive determination of electromagnetic parameters of dielectric materials at X-band frequencies using a waveguideprobesystem,” IEEE Trans. Instrum.Meas., vol.46,pp.1084-1092,Oct1997.
4) N. Han, “Role of NDE in quality control during constructionofconcreteinfrastructuresonthebasis of service life design,” Construction and Building Materials,vol.18,pp.163-172,2004.
5) D. Breysse, G. Klysz, X. Dérobert, C. Sirieix and J.F. Lataste, “How to combine several non-destructive techniques for a better assessment of concrete structures,” Cement andConcreteResearch,vol.38,pp. 783–793,2008.
6) K. J. Bois, A. D. Benally, and R. Zoughi, “Microwave near-fieldreflectionpropertyanalysisofconcretefor materialcontentdetermination,” IEEETrans.Instrum. Meas., vol.49,pp.49–55,Feb.2000.
7) S. Kharkovsky, M. F. Akay, U.C. Hasar, and C.D. Atis, “Measurement and monitoring of microwave reflection and transmission properties of cementbasedspecimens,” IEEE Trans. Instrum. Meas.,vol.51, no.6,pp.1210–1218,Dec.2002.
8) O. Buyukozturk, T. Y. Yu and J. A. Ortega, “A methodologyfordeterminingcomplexpermittivityof construction materials based on transmission-only coherent,wide-bandwidthfree-spacemeasurements,” CementandConcreteComposites,vol.28,pp.349–359, 2006.
9) U. C. Hasar, “Permittivity determinatation of fresh cement-basedmaterialsbyanopen-endedwaveguide probeusingamplitude-onlymeasurements,’’ Progress Electromag. Res.,vol.97,pp.27 43,2009.
10) Rohde, Schwarz, and H. Schwarz. "Measurement of dielectric material properties." Application Center Asia/Pacific. CY Kuek 7(2006).
11) A.Morales,S.S.AgiliandT.Meklachi,"S-Parameter Sampling in the Frequency Domain and its TimeDomain Response," in IEEE Transactions on InstrumentationandMeasurement,vol.70,pp.1-13, 2021, Art no. 6501113, doi: 10.1109/TIM.2020.3022440.
2022, IRJET | Impact Factor value: 7.529 | ISO 9001:2008 Certified Journal | Page1760