International Research Journal of Engineering and Technology (IRJET) e-ISSN: 2395-0056

Volume: 09 Issue: 08 | Aug 2022 www.irjet.net p-ISSN: 2395-0072
International Research Journal of Engineering and Technology (IRJET) e-ISSN: 2395-0056
Volume: 09 Issue: 08 | Aug 2022 www.irjet.net p-ISSN: 2395-0072
Shankar1 , Charan H V2 , Chitrashwa R3 , Hemal Jayachander4
1,2,3,4 Bachelor of Engineering, Computer Science & Engineering, Bangalore Institute of technology, Bangalore, Karnataka, India.
Under the guidance of Sushma H R, Asst. Professor, Department of Computer Science & Engineering, Bangalore Institute of technology, Bangalore, Karnataka, India ***
Abstract - The traffic has been transformed into the deranged issue in modern life due to increasing number of vehicles. Which leads to accidents Despite all that has been done to increase Road Safety in India so far, there are always regions that fall victim to the vulnerabilities that present in every corner. The issue leads to the need for an effective analysis so as to reduce the alarming figures by a significant amount. The objective of this paper is to have machine learning algorithm to come to aid to create a model that not only smooths out the heterogeneity of the data by grouping similar objects together tofindthe accident proneareasinthe city with respect to different accident-factors but also helps determine the association between these factors and casualties This situation has discovered road accidents problem, affectingfactors andremedies tobetakentoprevent it.
Key Words: Artificial Intelligence, Data Mining, Machine Learning, K-Means, Centroid, Cluster, Euclidean Distance, Tkinter, Rule Mining.
Roadaccidentsareoneofthemostfrequentcauseofdamage inmodernworld.It’soneofthemostsignificantcausesof thecasualties.Thecausesforthisaretheextremelydense roadtrafficandtherelativelygreatfreedomofmovement giventodrivers.Accidentsthatinvolveheavygoodsvehicles likeLorries,trucksandeventhecommercialvehicleswith thepublictransportationlikebusesareoneofthemostfatal kindsofaccidentsthatoccur,claimingthelivesofinnocent people[1].Theotherfactorsthatareattributedtoleadingto suchamishapcanrangeanywherefromvehiculardefectand weatherconditionstotransportationconditions.
Highways are always attracted for these accidents with injuriesanddeaths.Variousweatherconditionslikerain,fog etc., play a role in creating the risk of accidents. Having a properestimationofaccidentsandknowingthehotspotof accidentsanditsfactorswillhelptoreducethem.Providing timely emergency support even when the casualties have occurredisneeded,andtodothatakeenstudyonaccidents is required. In spite of having set regulations and the highwaycodes,negligenceofpeopletowardsthespeedof thevehicle,thevehicleconditionandtheirownnegligenceof not wearing helmets has caused a lot of accidents. These
accidentswouldn’thaveturned fatal,andclaimedinnocent livesifpeoplehadgovernedbytherules.
Machine learning which is a sub-branch of artificial intelligencesupplieslearningofcomputertakingadvantage ofdatawarehouses.Assumptionorclassificationabilitiesof computersystemshaveadvancedintheeventof machine learning.Utilizationofmachinelearningisaextensiveand functional method for taking veritable decisions by using experience. Machine learning is able to accomplish extracting informationfromdataandusestatisticalmethod. In this paper, we study the metropolitical city Bangalore contributing causes, Road structure, Environment factors andRoadconditionstodrawefficientconclusionsinorderto facilitate road safety in the country. We are focused on takingtheaidofclusteringtogroupsimilarobjectsoffthis dataset in order to group regions on the basis of vulnerability[6].Theclusterssoformedarelabelledtobe furtherclassifiedusingK-Meanstogivetheaccidentalzones inthecity[3].
Thetraffichasbeentransformedintothegruelingstructure in points of designing and managing by the reason of increasing number of vehicles. Large regulated data collections have increased by the reasons of the technologicalimprovementsanddatastoragewithlowcost. Arisingtheneedofelevationtoinformationfromthislarge calibrateddataobtainedthecornerstoneofthedatamining. In this study, the most compatible machine learning classification techniques for road accidents estimation by datamininghasbeenintendedtostudyandcompare.
Themainobjectiveofourroadaccidentpredictionsystem:
Analyse the previously occurred accidents in the locality which will help us to determine the most accident-prone area and help us to set up the immediaterequiredhelpforthem.
To make predictions supported constraints like weather,pollution,roadstructure,etc.
International Research Journal of Engineering and Technology (IRJET) e-ISSN: 2395-0056
Volume: 09 Issue: 08 | Aug 2022 www.irjet.net p-ISSN: 2395-0072
There are several problems with current practices for prevention of the accidents occurred within the localities. The database we’ll use is available officially by many institutes and government websites which is known n popular for data. The data collected will be analysed, implemented and grouped together based on different constraints considering important using the best suited algorithm. This estimation will be helpful to examine and recognizetheflawsandthereasonsoftheaccidents.Itwill also be helpful while making roads and bridges as a referencetoavoidthesame problemsfaced before andto build it in better way. The predictions made will be very muchusefulformanagementtoovercomesuchproblems. To develop a model to identify accident prone zone areas andtoclassifythethemashighriskandlowriskareas.
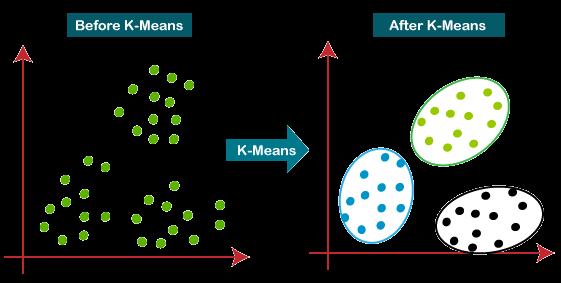
K-MEANSClusteringisusedtogroupsimilarobjectoffofthe heterogeneousdata.Asperthisalgorithm,anobjectcanbe allotted to only one cluster. Euclidean distance is the measure used to define the centroid of a cluster. K is the numberofclustersandisusuallygivenasmallintegervalue (1,2,3…).Kpointsarethenchosenrandomly-preferablythe initial ones which represent the centroids of k clusters withoutanymembersandareplacedtotheclusterwiththe centroidnearesttoit[2]. Thelessvariationwehavewithin clusters,themorehomogeneous orsimilarthedata points arewithinthesamecluster.
Thewaykmeansalgorithmworksinfollowingsteps:
1. Specifynumberofclusters K.
2. Initializecentroidsbyfirstrearrangingthedataset and then randomly selecting K data points for the centroidswithoutreplacement.
3. Keep iterating until there is no difference to the centroids. i.e. assignment of next data points to clustersisn’tchanging.
Computethesumofthesquareddistancebetween alldatapointsandallcentroids.
Below is a detailed steps of how we can solve it mathematically.
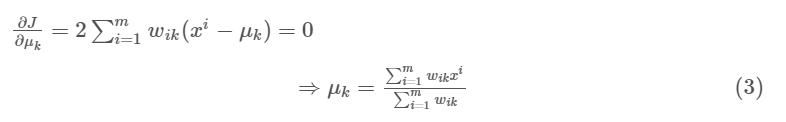
Theobjectivefunctionis:
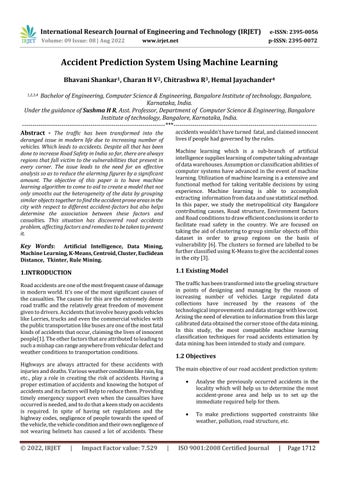
Assign each data point to the nearest cluster(centroid).
where wik=1 for a data point xi if it belongs to cluster k; otherwise,wik=0.Also,μkisthatthecentroidofxi’scluster. It’saminimizationproblemoftwoparts.WefirstminimizeJ w.r.t.wikandtreatμkfixed.ThenweminimizeJw.r.t.μkand treatwikfixed.Technicallyspeaking,wedifferentiateJw.r.t. wikfirstandupdateclusterassignments(E-step).Thenwe differentiate J w.r.t. μk and recompute the centroids again after the cluster assignments from previous step (M-step). Therefore,E-stepis:
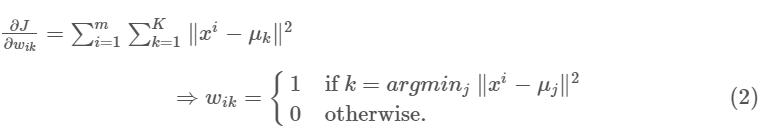
Compute the centroid for the clusters by taking averageofthealldatapointstoeachclusters.
The approach kmeans travel to solve the problem is called Expectation-Maximization.TheE-stepisassigning the new data points to the closest cluster. The M-step is computingthecentroidofeachclusterafteraddingnewdata.
Torephraseit,assignthedatapointxitotheclosestcluster calculated by its sum of squared distance from cluster’s centroid.
AndM-stepis:
Whichtranslatestorecomputingthecentroidofeachcluster toreflectthenewassignmentsadded.
Fig 2.1.1 K-Means
International Research Journal of Engineering and Technology (IRJET) e-ISSN: 2395-0056
Volume: 09 Issue: 08 | Aug 2022 www.irjet.net p-ISSN: 2395-0072
set contains the constraints which are not needed by the prediction system and including them makes the system unpredictabletolearnandmayextendtheprocessingtime duetonoisydata onemorereasonbehinddatacleaningis the dataset may contain null value and garbage values too.thereforethesolutiontothisissueiswhenthedatais transformedthegarbagevaluesareremovedandnullvalues arefilled.Therearemanydifferentmethodstoperformthat.
The datasets obtained willundergopreprocessing. We dividethefulldatasetintotwopartsthatcanbeeither70-30 or 80-20. The larger portion ofthe data setsis for the processing. The algorithm is implemented on that part of data. Which assist the algorithm to learn on its own and makepredictionforthenewupcomingdataortheunknown data.
Amoduledescriptiongivesdefinitedataaboutthemodule and its upheld parts, which is open in various habits. The modulesin thistechniqueare:
Datais that themost import part when you work on prediction systems. It playsa reallyvital role your whole project i.e., your system dependsthereondata. So selectionofknowledgeisthefirstandthecriticalstepwhich should be performed properly, For our project we gotthe infofrom the government website. These datasets were available for all. There are otherplenty ofwebsites who providesuchdata.Thedatasetweelectwasselectedbased onthevariousfactorsandconstraintsweweregoingtotake undertheconsiderationforourpredictionsystem.
Afterwe'veselected the dataset.the subsequentstep is to cleanthedataandtransformitintothedesiredformatasit is possible the dataset we use may be of different format.it'salsopossiblethatwemightusemultipledatasets fromdifferentsourceswhichcanbeindifferentfileformats. Sotousethemwe'dliketoconvertthemintotheformatwe wanttoorthetypethattypepredictionsystemsupports.the rationalebehindthisstepisthatitispossiblethatthedata
Afterthedatasetsarecleanedandtransformedit’sreadyto processfurther.Afterthedatasetshasbeencleanedandwe have taken the required constraints. We dividethe fulldatasetintothetwopartsthatcanbeeither70-30or 80-20. The larger portion ofdatais for the processing or learning. The algorithm is appliedon largepart of data. Whichhelpsthealgorithmtofindoutonitsownandmake prediction for the future data or the unknown data. The algorithm is executedduring whichwe take only the requiredconstraintsfromthecleaneddata.Theoutputofthe algorithmisin‘yes’and‘no’whichconvertedtoHIGHand LOWrespectively.Itgivestheerrorrateaswellas success rate.
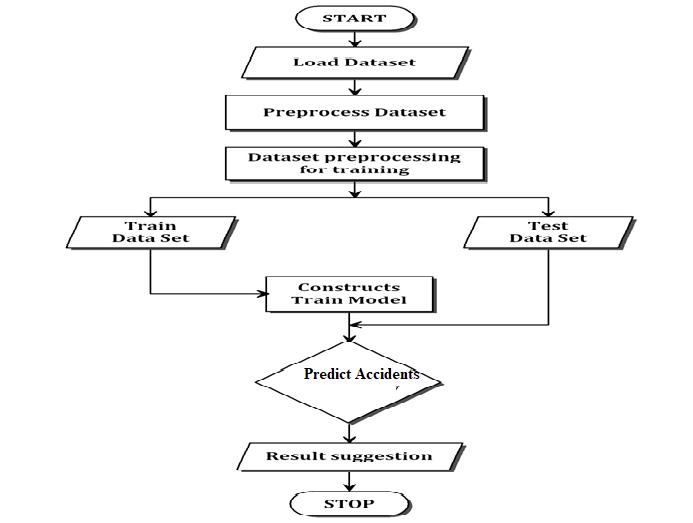
After the prediction systemis preparedto use. The user justhasgottologinfirst.Thereisanewpagewith different optionstheyneedtoselect.Theyarelikethepredict,graphs, rules,andnewdata. The newdata entry isusedto collect newaccidentdatafromuser.Oncetheusergotopredictand clickson“train”thealgorithmistriggeredandthedatasets arepassedtothepredictionsystem.Theuserisgivenhow accidentpronetheroadcanbeinHIGHorLOW
Fig 2.2 System Flow Chart
International Research Journal of Engineering and Technology (IRJET) e-ISSN: 2395-0056
Volume: 09 Issue: 08 | Aug 2022 www.irjet.net p-ISSN: 2395-0072
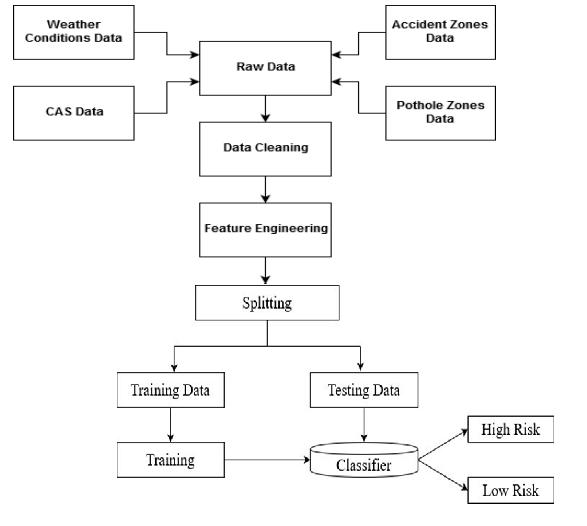
Wecollectthedatasetsandgiventoprocessinoursystem. Wepreprocessthecollecteddataandsplitthedataand constructthemodel.Wetrainthemodelwithlargersplit ofdatasetandpredicttheoutputfornewdata.
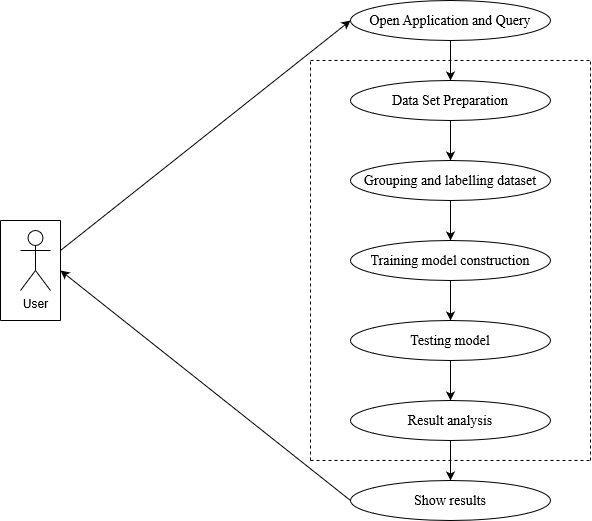
As per user perspective the diagram depicts the steps involed. User first open our application. He was given to choosetheoptionpredicttheaccidentpronezone.Oncethe userclicks,thedatapreprocessingandcleaningwilltakes placebuthiddentotheuser.Atfirsttimetheuserisaskedto clickontrainthemodel.Thetestingisalsoconsideredwhile doingthemodelconstruction.Oncethemodelisconstructed it'sreadytousefornewdata.theuserisaskedtoselectthe areafromthedropdownandthemodelpredictswhether theareaispronezoneornot.Theresultiscollectedandcan be used for further improvements. Once the purpose is fullfilledtheapplicationcanbeclosed.
Jupyterexiststodevelopopen-sourcesoftware.it'susedfor open-standards, and services for interactive computing acrossdozensofprogramminglanguages.it'sanopensource web application that allows you to create and share documentsandcodelive.Whichmaybeaverybigadvantage of Jupyter. Itare oftenused for data cleaning and transformation,numericalsimulation,statisticalmodelling, machine learningand farmore. We use Jupyter in our applicationtorunthealgorithm.
Python is an interpreted, fast, high-level and a generalpurpose programming language. Created by Guido van Rossumanditis firstreleased on1991,Pythonfeatures a designphilosophythatemphasizescodereadability,notably using significant whitespace. It’ s one of the most used programminglanguagepresently.Itprovidesconstructsthat enable clear programming on both small and enormous scales.TheK-meansusedwithinthesystemisimplemented inJupyterandthealgorithmiswritteninpythonlanguage.
TkinteristhestandardGUIlibraryforpython.Pythonwhen combinedwithTkinterprovidesadirect,quickandeasyway tocreateGUIapplications.It’sthestandardpythoninterface to the TK GUI toolkit for UI. It is used for creating user interfaceinoursystem.
The Raw data collected hasdifferent attributesand values associatedwithit.Thefirstandforemostthingtodoisfinda relationbetweenall thesedatasets.Forexample weather dataandaccidentcasesdataareconnectedviadate.Similarly theroadstructureandaccidentcasesdataareconnectedby areaname.Thisprocessstartsoncetheuserloggedintoour system. Once the login is successful, In view he has four different options to choose as functionalities. These are added as additional modules for making our system more informative. The functionalities available are Rules, Risk Prediction,PlotGraph,EntryNewData.Oncetheuserclicks onRules,Anewwindowopenswithtwoplaceholdersnamed supportandconfidence.Ifprovidedcorrectvaluesitshows thefrequentaccidentoccurringpatternsinaccidentdata.The secondfeature,RiskPredictionistheprimarymoduleofthe application.OnceuserclicksonRiskPrediction,therewillbe a button named “TRAIN” which starts the training for the model. Once the model is ready it’s shown by a message “FinishedclusteringusingK-Means”.Itmighttakeupsome minutestogetthemodelready.Oncethemodelisreadyyou canchoosetheareaspresentinthedropdownchoice.The placesprovidedbelongstothemetropoliticalcityBangalore. Once submitted, the model now take the selected city and startstheclassificationbasedonclustersbyusingK-Means. The model finally predicts whether the selected area is “HIGH” or “LOW” accidental prone zone. The third functionalityadditionallyaddedis“PlotGraph”.Thispresents a dropdown to select a state from list of states of country India. The collected data of these state wise accident are plotted in four different ways. Accident cause, weather condition,NumberofVictimsandyearlydeaths.Thesedata are static and different from the data collected for city Bangalore.Thelastfeatureis“Entrynewdata”whichgives user the ability toadd newaccident occurred. This data is collectedandaddedtothemaindatasetstomakeourmodel furtherstrongandaccuratetorealtime.
International Research Journal of Engineering and Technology (IRJET) e-ISSN: 2395-0056
Volume: 09 Issue: 08 | Aug 2022 www.irjet.net p-ISSN: 2395-0072
Fig 5.1 Log In Page Fig 5.2 Accident Prediction System Fig 5.3 Rule Mining
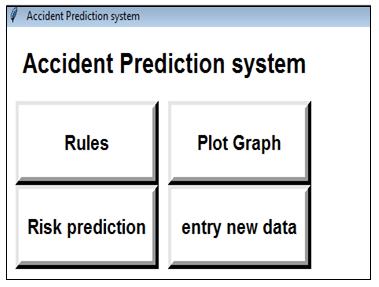
Fig 5.5 Graphs with states dropdown to select
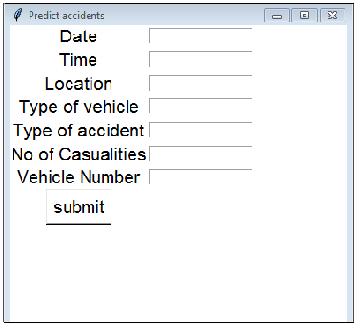
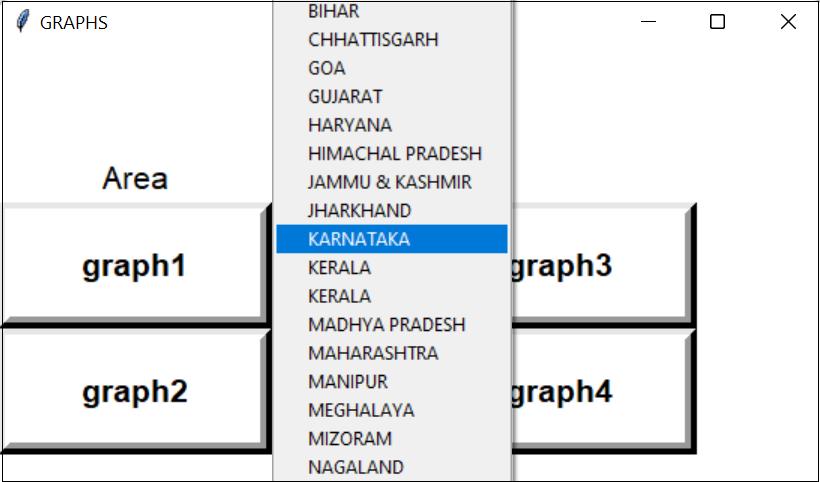
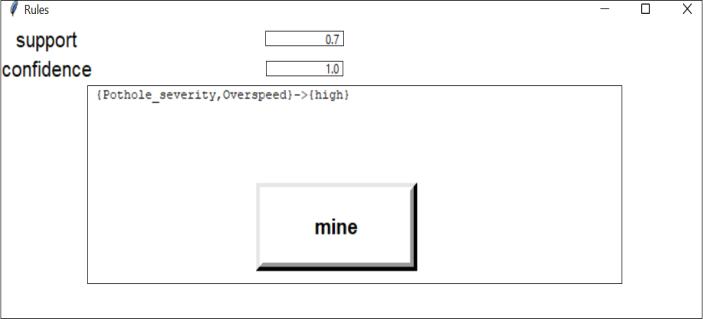
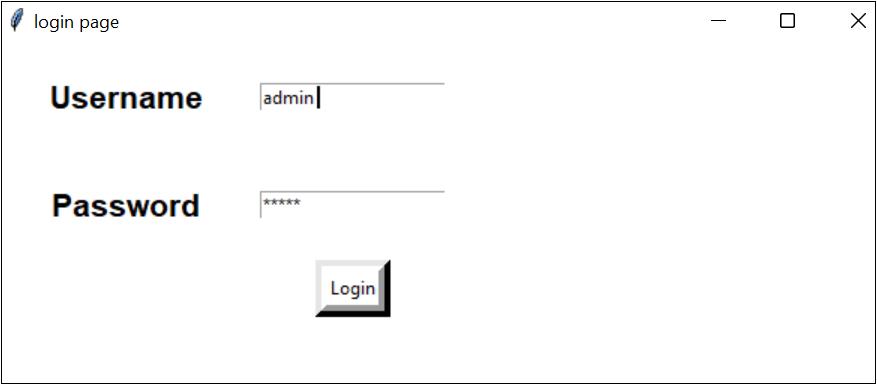
Fig 5.4 Risk Prediction Before and After Training
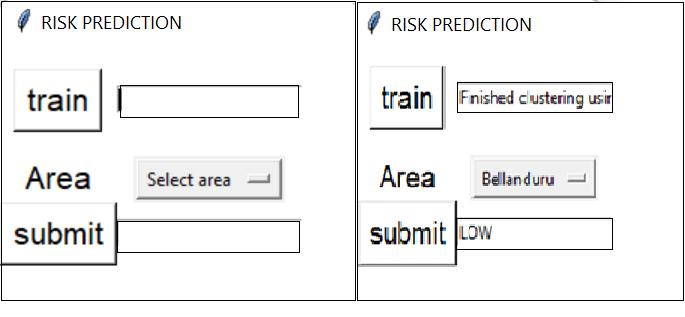
Fig 5.6 Graphs for state karnataka
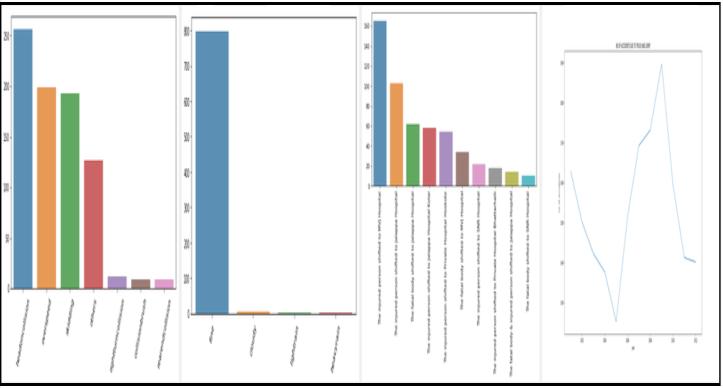
Fig 5.7 Entry New Data
The road accident prediction system aims to develop an applicationtopredictwhetherthegivenareainBangalore city is high accident prone or low accident prone. Road Accidentsarecausedbyvariousfactors.RoadAccidentcases
International Research Journal of Engineering and Technology (IRJET) e-ISSN: 2395-0056
Volume: 09 Issue: 08 | Aug 2022 www.irjet.net p-ISSN: 2395-0072
arehugelyaffectedbythefactorssuchastypesofvehicles, pothole severity, overspeed, weather condition, road structureandsoon.Usingtheabovefactorsasattributeswe havebuiltanapplicationwhichgivesefficientpredictionof road accidents based on the above mentioned factors. Additionally the application provides rule mining which givesthefrequentappearedattributesinaccidentcases.The applicationalsoprovidesdifferentGraphsbasedonstatein India.Thereisalsoausedformwherenewaccidentcases canbeaddedtotheapplicationforupdatedmodel.
[1] VipulRana,HemantJoshi,DeepakParmar,Pradnya Jadhav,MonikaKanojiya,RoadAccidentPrediction usingMachineLearningAlgorithm,IRJET,2019
[2] Ayushi Jain, Garima Ahuja, Anuranjana, Deepti Mehrotra, Data Mining Approach to Analyze the RoadAccidentsinIndia,procofICRTIO,2016.
[3] BayeAtnafu,GagandeepKaur,SurveyonAnalysis and Prediction of Road Traffic Accident Severity Levels using Data Mining Techniques in Maharashtra,India,Internationaljournal ofcurrent engineeringandtechnology,2017.
[4] Dinesh Singh, Chalavadi Krishna Mohan, Deep Spatio-Temporal Representation for Detection of Road Accidents Using Stacked Autoencoder, IEEE TransactionsonIntelligentTransportationSystems, 2016.
[5] MINGZHENG,TONGLI,RUIZHU,JINGCHEN,Traffic accident’s severity prediction: a deep-learning approachbasedCNNnetwork,IEEEAccess,2017.
[6] Helen W R, N Almelu, S Nivethitha, Mining Road Accident data based on Diverted Attention of Drivers,procofICICCS,2018.
[7] Irina Makarova, Ksenia Shubenkova, Eduard Mukhametdinov, and Anton Pashkevich, Safety relatedproblemsof transportsystemandtheir solutions,procofIEEE,2018.
[8] WHO, “Global status report on road safety 2015” 8.Peden,WorldHealthOrganization.Ed.byMargie2004. World report on road traffic injury prevention.Geneva:WorldHealthOrganization.
[9] M.Chang,L.Y.,&Chen,W.C."Dataminingof tree- based models to analyse freeway accident frequencies".JournalofSafetyResearch,36(4),365375
[10] Maze, T. H., Agarwai, M., & Burchett, G. "Whether weather factors matters to traffic demand, traffic safety,andtrafficoperationsandflow".
[11] Teseema, T. B., Abraham, A., & Grosan, C. (2015). "Rule mining and classification of road traffic accidents using adaptive regression trees". InternationalJournalofSimulation,6(10),80-94.
2022, IRJET | Impact Factor value: 7.529 | ISO 9001:2008 Certified