International Research Journal of Engineering and Technology (IRJET) e-ISSN:2395-0056

Volume: 09 Issue: 08 | Aug 2022 www.irjet.net p-ISSN:2395-0072
International Research Journal of Engineering and Technology (IRJET) e-ISSN:2395-0056
Volume: 09 Issue: 08 | Aug 2022 www.irjet.net p-ISSN:2395-0072
1Research Scholar, Department of Civil Engineering, Vidyavardhaka College of Engineering, Mysore, Karnataka, India,
2Dean Academics, Professor Department of Civil Engineering, Vidyavardhaka College of Engineering, Mysore, Karnataka, India,
3Assistant Professor, Department of Chemistry, JSS Science and Technology University, Mysore, Karnataka, India,
4Assistant Professor, Department of Chemistry, Vidyavardhaka College of Engineering, Mysore, Karnataka, India ***
This study has been ventured to envisage the viability of replacing Slag Sand to River Sand and Slag to Ordinary Portland Cement (OPC) individually and amalgamated in varied mix proportions. The 3, 7, 28, 56 and 90 days cured mortar cubes were subjected to compression and microstructural analysis. The 30% blended Slag Sand to River Sand yielded 38.71N/mm2, 35% Slag to OPC yielded 41.84N/mm2 and blending Slag and Slag Sand yielded 39.37N/mm2 compressive strength for 90 days curing, which were 17%, 23% and 18% higher than the reference. The EDS results of slag, slag sand and stabilized matrix cured for 3 and 7 days confirmed the presence of Mg, Al, Si, S, Ca, C, O and Fe. The sample composition consisted of CaO, SiO2, Al2O3 and MgO. SEM micrograph shows some larger particles embedded in the matrix with partial reaction during the activation process which indicates that the particle size distribution has a main role in completing the process. The XRD result of short-range order of Cao-Sio2-Al2O3-MgO was observed. In addition to thecommonC-S-H phase, the formation of α-C2SH wasalso observed in hydration product of slag sand and slag. From the Raman spectra’s, low intensity bands can be found at +316 cm" (lattice vibrations of Ca-O) and at -443 cm (symmetric bending v₂ (Si-O). Small band at 365 cm" ascribed to residual portlandite Ca(OH)₂. Partial replacement of OPC and River Sand by Slag and Slag Sand eliminates the waste management problems and impacts onthe environment.
Slag and slag sand are the by-products of iron and steel manufacturing industry. The total number of steel industries in India is approximately 3647. India is the secondlargestcrudesteelproducersintheworld. While
producing three tons of stainless steel, approximately one ton of stainless steel slag is generated. 50 million tons/year of steel slag is generated as a by-product in the world [2]. Major steel plants in India generate 7.76 million ton of BFS (Blast Furnace Slag) per annum. The main constituents of BFS include CaO, SiO2, and Al2O3. It alsocontainsa small amountofMgO,FeOandsulfideas CaS,MnSandFeS[3].
Cement industry consumes high energy industry, and CO2 emissionaccountsabout7%ofglobalCO2 emissions [1].Whencomparedwithcement,Slagrequireslessthan a fifthofenergyproducedandemitslessthana tenthof the CO2. The main constituent material in concrete production is aggregate, which makes up 70% of the concrete volume. To meet the coveted demand of aggregates, many mountains and rivers have been exhaustingly exploited, which destroy the environment disastrously.
Due to higher cost of natural sand used as a fine aggregate and the rising emphasis on sustainable construction,thereisaneedforconstructionindustryto searchforalternativematerials[5].
Research studies on utilization of industrial wastes and by-products in different fields have been carried out in recent years [4]. Industrial wastes are used as mineral admixtures to replace some part of cement. Utilizing mineral admixtures reduces the emission of greenhouse gasesandimprovesthemechanicalpropertiesofcement [3]. Fly-ash, a by-product of thermal power plants bearing pozzolanic property is widely used as a partial replacement to cement [2]. The properties of cement concrete using fly ash, silica fume and BFS as cement replacement materials have been evaluated. Nevertheless,notmuchworkhasbeencarriedoutonthe mechanical properties of mortar using supplementary materialslikeSlagsandandSlag.
International Research Journal of Engineering and Technology (IRJET) e-ISSN:2395-0056
Volume: 09 Issue: 08 | Aug 2022 www.irjet.net p-ISSN:2395-0072
This study intends to explore the possibility of utilizing Slag sand and Slag as a partial replacement to binder material and fine aggregate in cement mortar. The mechanical behaviour and morphological changes in solidified matrix are evaluated at different curing ages employingXRD,SEMandRamanSpectroscopy.
Thematerialsusedandthemethodologyadoptedinthis researchworkcomplieswithBureauofIndianStandards specifications. OPC of 43 Grade (Brand - Coromandel) was used. The properties of OPC and Slag (source - JSW Cement Ltd) are furnished in Table 1 & 2. Natural river bed sand and Slag Sand were used as fine aggregates. The cement was analysed for routine parameters. The cubes were cast using CM 1:3. Laboratory tap water (Source-Borewell) was used for mixing and curing. The mortar cubes (Dimension - 7.5cmX7.05cmX7.05cm) were tested using compression testing machine (2000kN, Aimil, 2014), at the curing ages of 3, 7, 28, 56 and 90 days. For each curing, cubes were tested in triplicatetogettheconcordantvalues.
X-RaydiffractionstudieswerecarriedoutusingPowder X-RayDiffractioninstrument(MACScienceCo.Ltd).The XRD patterns were recorded at a scanning speed of 2°/min,and2Өrangingfrom60to10degree.Thepeaks were compared with standard pattern of JCPDS data bank. SEM images of the synthesized Slag, Slag Sand, 3 and 7 Day cured reference, 3 and 7 Day cured M6 was captured using HITACHI (S-3400 N, Japan) with 10 kV acceleration voltages. For image analysis, samples were placed on a carbon-coated copper in a tiny amount and allowed to air dry and images of samples were taken. Raman shift recordings were carried out using the instrumentHoribascientific(ModelXploraPlus).
9 SulphideSulphur (%) 2.0(Max) 0.45
10 GlassContent(%) 85(Min) 90 11 MoistureContent (%) - 11.74 12 ParticleSizePassing 50.0mm 95% 100% 13 ChemicalModuli (CaO+MgO+Al2O3) /SiO2
≥to1.0 1.93
(Source: JSWCement Ltd)
The materials used in mortar specimens had diverse properties and behaviour. The properties of materials weredeterminedasperBISspecificationsandtheresults obtainedarerepresentedinTable2.ReferringtoTable3, itcanbeobservedthatalltheparametersarewellwithin the threshold limits. Nevertheless, the Initial and final setting time of Slag exceeded the threshold value. It is almost double the value of that of cement. This may be due to lack of calcium chloride content. Based on the sieve analysis results of fine aggregates, the River SandandSlagSandbelongstozoneII.
TABLE 2: BasictestresultsofOPC,Slag, RiverSandandSlagSand
Property OPC Slag Fine Aggregate Thre shol d Valu e
Specifi cation Rive r Sand
Slag Sand
Sp Gravity 3.14 3.24 2.57 2.61 Fine Aggr egate :2.62.8
IS 383(19 70) IS 23863(1963 ) Std. consisten cy(%)
323 303 - - 2633 IS 4031-4 (1988) Initial setting time (min)
Final setting time (min)
397 803 - - 30 (Mini mum )
497 1080 - - 600 (Max imu m)
IS 4031-5 (1988) ]
IS 4031-5 (1988) ]
International Research Journal of Engineering and Technology (IRJET) e-ISSN:2395-0056
Volume: 09 Issue: 08 | Aug 2022 www.irjet.net p-ISSN:2395-0072
Fineness Modulus - - 2.76 2.7 Fine sand: 2.22.6 Medi um sand: 2.62.9 Coar se sand: 2.93.2
Water absorptio n(%)
- - 0.41 0.56 Coar se aggr egate : <1.4 Fine Aggr egate :<2
IS: 383(19 70)
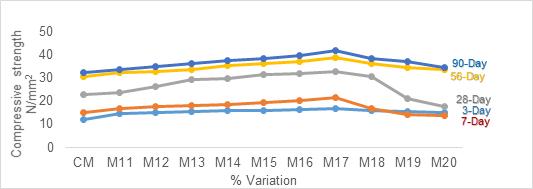
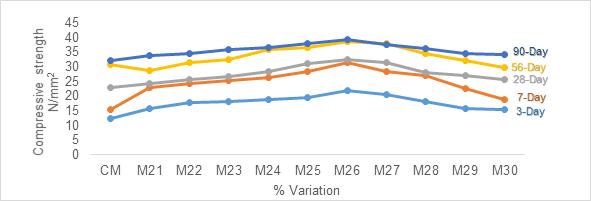
Figure 2: Compressivestrengthofpartially replacedSlagtoOPC
IS 23863(1963 )
Bulk density, (g/cc)
- - 1.6 1.4 - IS 23863(1963 )
%air voids - - 34.1 2.9 - IS 23863(1963 )
Figure1representsthecompressivestrengthofpartially replaced Slag Sand to River Sand. With the increase in replacement level of Slag Sand to River Sand, gain in strength was observed. This increment in strength was observed up to 30% replacement of Slag Sand. Then onwards,itstartedshowingadecliningprofileforallthe curing ages. The maximum value of compressive strengthobtainedattheendof90-daycuringwas38.71 N/mm2 which was 17% higher than the reference. Nevertheless, it can be observed that for all the curing ages, the values obtained were higher compared with referencecube.
Element Line Amount %
Slag Slag Sand CM3Day CM7Day M63Day M67Day
C K 5069 3552 4099 3276 4314 4657
O K 3951 5070 4909 5571 4818 4439
Mg K 0.95 0.96 0.35 0.36 0.24 0.22
Al K 2.16 2.58 0.73 0.72 0.58 0.51
Si K 3.10 4.24 3.07 3.80 1.98 2.74 Si L
S K 0.34 0.26 0.26 0.33 0.26 S L
Ca K 3.59 5.65 5.50 6.40 5.54 4.93 Ca L Fe K 0.39 Fe L
Total 100 100 100 100 100 100
The compressive strength results obtained for partial replacement of Slag to OPC is indicated in Figure 2. For Slag replacement to OPC, delay in setting time was observed. With every increase in replacement percent for a constant W/C ratio of 0.5%, the setting time got increased. When the replacement level was 35%, maximum gain in strength was observed for all the curing periods. For 90-day curing, a maximum compressive strength of 41.8N/mm2 was observed. Further for all the replacement levels the strength declined.
International Research Journal of Engineering and Technology (IRJET) e-ISSN:2395-0056
Volume: 09 Issue: 08 | Aug 2022 www.irjet.net p-ISSN:2395-0072
XRD result. The seven days cured M6 sample was also showed the same feature. These results confirmed that the crystallinity increases with increasing the curing period. The comprehensive strength decreases when the composition increases from30%(16.18N/mm2)to35%(15.52N/mm2).
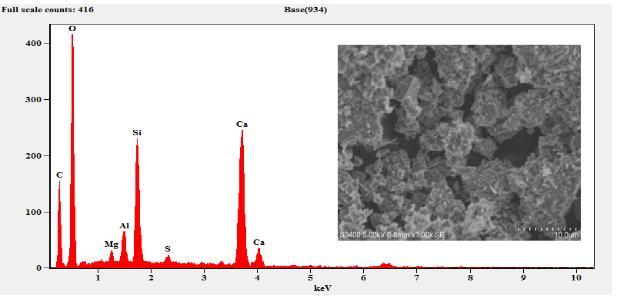
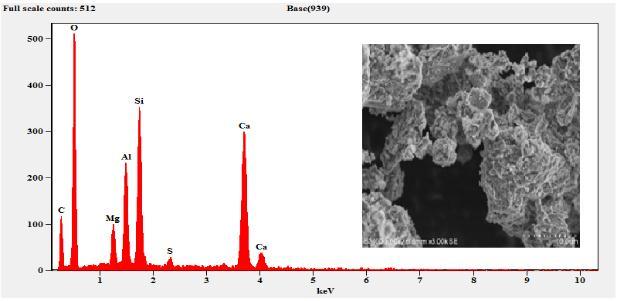
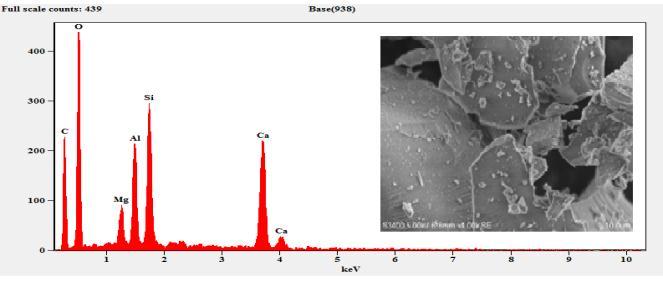
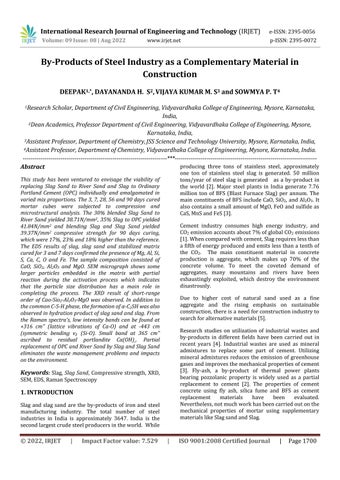
Figure 3 represents the compressive strength results of partial replacement of Slag and Slag Sand to River Sand andOPC.Themaximumgaininstrengthwasobservedat 30%(M26)was39.73N/mm2 attheendof90daycuring when compared to controlled specimens. Further increase in replacement decrease in strength was observed.
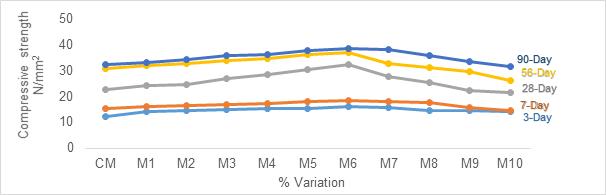
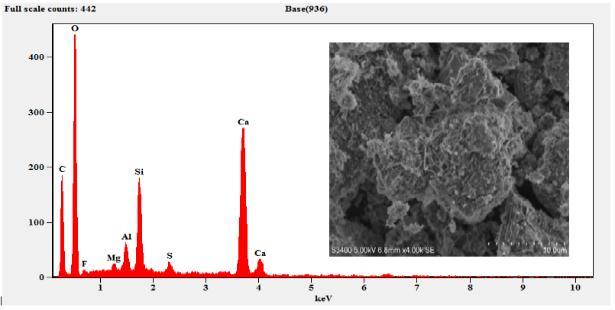
The sample composition was analysed by EDS (EDAX) andtheresultsobtainedaresummarizedinTable3.The EDSresultsconfirmthepresenceofMg,Al,Si,S,Ca,C,O and Fe. As expected, the sample composition mainly consists ofCaO,SiO2,Al2O3 andMgO. etc.TheFecontent wasobservedonlyinM6curedfor7daysandthe cured samplearewithhighdegreeofpurity.
Microstructural development is most important factor that affect the engineering and mechanical properties of stabilized matrix. The surface morphology of the slag and other samples were investigatedbySEManalysisasshowninFigure4-9. The SEM observation revealed that the samples consists of aggregates of particles with cluster like structure. Figure 4 show the amorphous phase as confirmed from the XRD results of Figure 10 whereas the GBFSS shows slight betterment in the crystalline phase with showing a slight peaks of quartz and C2S. As the curing time increases, the optimum compressive strength also increases from 16.8 N/mm2 to 38.71 N/mm2. The agglomerated structure can be seen in the reference materials showninFigure6and7butthethreedayscuredM6 sample showed a good compact and needle like structure.Thebettercrystallinitywiththemaximum intensity of a quartz peak was also observed in the
Figure 4: EDSandSEMofSlag
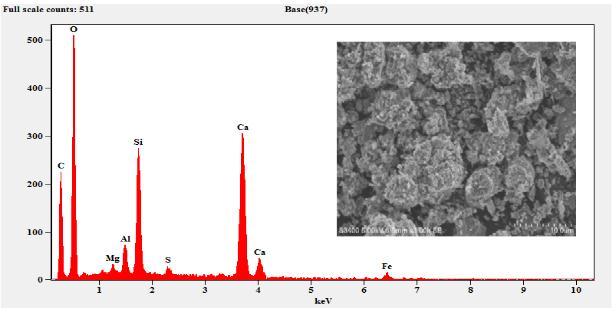
Figure 5: EDSandSEMofSlagSand
Figure 6: EDSandSEMof3-DayCuredCM
Figure 7: EDSandSEMof7-DayCuredCM
International Research Journal of Engineering and Technology (IRJET) e-ISSN:2395-0056
Volume: 09 Issue: 08 | Aug 2022 www.irjet.net p-ISSN:2395-0072
Figure 8: EDSandSEMof3-DayCuredM6
Figure 9: EDSandSEMof7-DayCuredM6
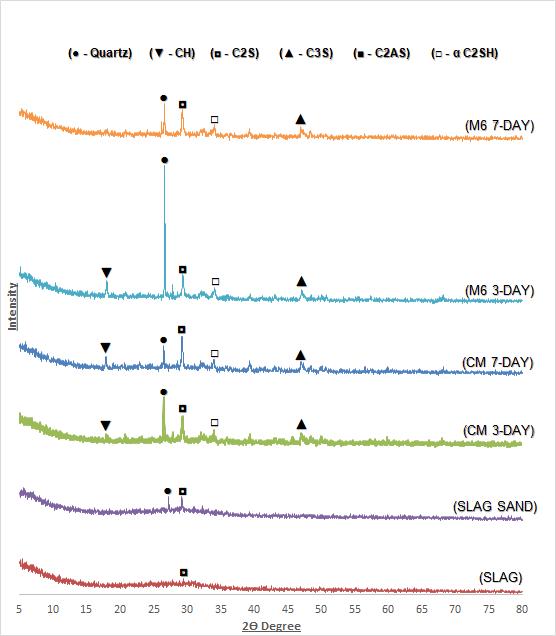
The raw Slag, Slag Sand and hardened solidified matrix were carried out using Powder X-ray Diffraction) to confirmthecrystallinenature.XRDpatternsofSlagSand, Slag,CM(3and7Daycured)andM6(3and7Daycured) samplesareshown inFigure10.It canbeobservedthat the some of the peaks are overlapped. The main compositions are calcium silicate phase (C3S, C2S), and RO phase. However, in case of slag, no diffraction was observed and this clearly indicates that slag is amorphous in nature.There are few amounts of olivine, rhodonite and alite were observed. The XRD patterns of 3 and 7 day hydrated cement indicates the presence of Quartz, Ettringite, Alite (C3S), Belite (C2S), Gehlenite (C2AS) and portiandite (CH) phase. The variation of characterisespeakofC3Swasconsumedinthehydration reaction.
The broad and diffuse background peak with maxima around 2≈26.6 & 28.04 in the hydrated sample of slag sand and slag. The result of short-range order of CaOSiO2-Al2O3-MgO was observed. In addition to the common C-S-H phase, the formation of α-C2SH was also observedinthehydration productofslagsandandslag. These data confirms the increase in crystallinity by increasing the curing period. The best crystalline phase was observed for the M6 sample cured for a period of three days. The highest intensity peak was observed at around 2 Theta of 26 indicating the presence of quartz and the sample is crystalline. This might be because of initialhydrationofcementandslag.
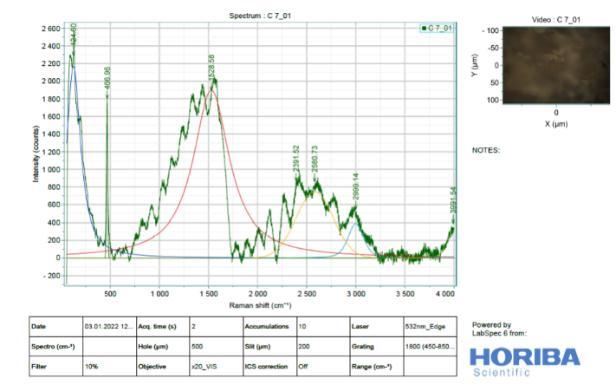
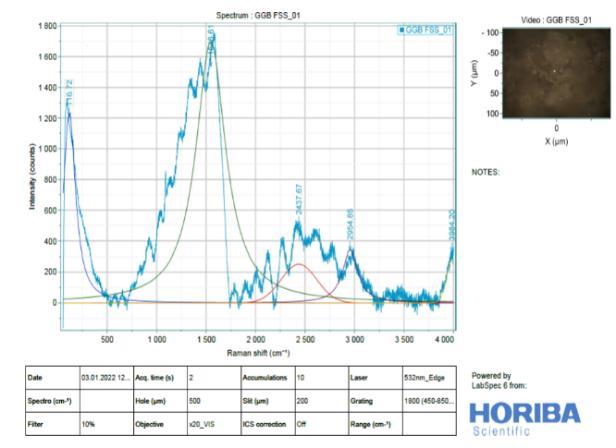
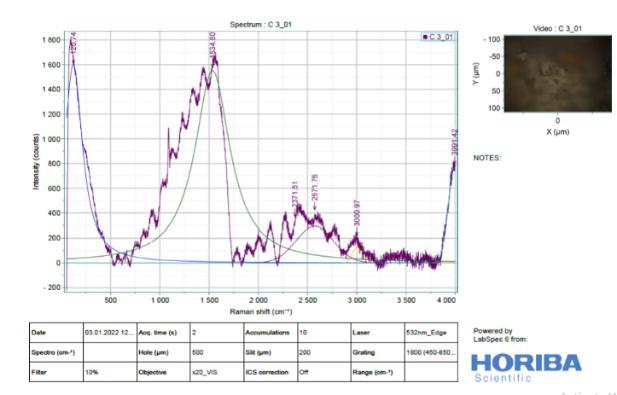
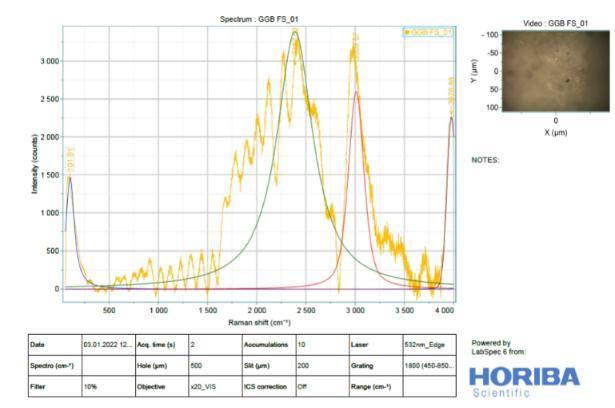
It is difficult to analyse Slag (Figure 11) by Raman spectroscopy due to its highly disordered amorphous phases. Raman spectra of River Sand, Slag Sand, OPC andSlagpastesatthedepthof0–2mm,clearlyshowed anintensesharppeakatabout1500-2500cm 1(From Figure 13 to 16). This is due to the symmetrical stretching vibration of CO3 of the CaCO3 phases, the intensity of CO3 band of the OPC blend was much weaker than those of Slag and OPC.In addition tothe weak Raman scatter nature of River Sand and Slag Sand, the weak intensity of River Sand, Slag Sand, OPC and Slag when blended could also be attributed to the dark colour of River Sand. This is because, as wellestablished, the phases with dark colour can absorb more illuminating light energy. As a result, the scattered light intensity could be reduced due to reduced incident light energy. This could partly explain the much reduced Raman intensity of the River Sand/OPC blend although the intensity of the CO3 band ofSlagandOPC wasnotreduced,astronger fluorescence background could be recognized. As the peakheightisnormally used to quantify the phases in a Ramananalysis,the interference caused by River Sand andSlag to thefluorescencebackgroundoftheRaman spectra could cause concerns aboutthe quantification of CaCO3 formed in the different type of mixes before establishing the carbonation profiles. Nevertheless, a strong background could be identified by Raman spectra in particular for the stabilized matrix blend with SlagSand,SlagandpureOPCsamples.
International Research Journal of Engineering and Technology (IRJET) e-ISSN:2395-0056
Volume: 09 Issue: 08 | Aug 2022 www.irjet.net p-ISSN:2395-0072
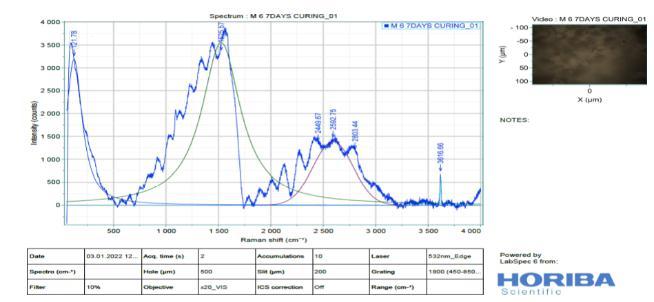
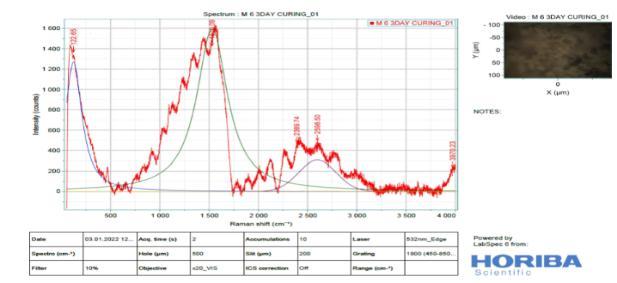
Figure 15: : Ramanspectroscopyof3-DayCured M6
Figure 16: : Ramanspectroscopyof7-DayCured M6
Based on experimental investigations conducted in this research paper following conclusions and recommendations were made for the potential use of SlagandSlagSand.
1. Slag Sand when partially replaced (30%) to River sand the optimum compressive strength results for 3, 7, 28, 56 and 90 day curing were 16.8N/mm2, 18.57N/mm2, 32.20N/mm2 , 36.98N/mm2 and 38.71N/mm2 on par with that of controlmix.
2. Slag when partially replaced (35%) to OPC optimum compressive strength results for 3, 7, 28, 56 and 90 day curing were 16.88 N/mm2 , 18.71N/mm2, 32.88N/mm2, 38.67N/mm2 and 41.84 N/mm2whencomparedtocontrolledmix.
3. Slag Sand and Slag when partially replaced (30% and 30%) to River sand and OPC in blending, the optimum compressive strength results for 3, 7, 28, 56 and 90-day curing were 21.94N/mm2 , 31.36N/mm2, 32.44N/mm2, 38.73N/mm2 and 39.37N/mm2 whencomparedtocontrolledmix.
International Research Journal of Engineering and Technology (IRJET) e-ISSN:2395-0056
Volume: 09 Issue: 08 | Aug 2022 www.irjet.net p-ISSN:2395-0072
4. The crystallinity increases with increasing the curing period and also the comprehensive strength decreases when the composition increases from 30%(16.18N/mm2)to35%(15.52N/mm2).
5. As the curing time increases, the optimum compressive strength also increases from 16.8 N/mm2to38.71N/mm2
6. The EDS results confirm the presence of Mg, Al, Si,S,Ca,C,OandFe.
7. TheXRDresultofshort-rangeorderofCao-Sio2Al2O3-MgOwasobserved.Inadditiontothecommon C-S-H phase, the formation of α-C2SH was also observed in the hydration product of slag sand and slag.
8. As the percentage increased beyond optimum thecompressivestrengthdeclined.
9. From the Raman spectra’s, low intensity bands can be found at 316 cm" (lattice vibrations of Ca-O) and at -443 cm (symmetric bending v₂ (Si-O) and Small band at 365 cm" ascribed to residual portlandite-Ca(OH)₂
10. Finally, it can be concluded that replacement of Slag as cementitious material and Slag Sand as fine aggregate in construction industry, not only solves the waste management problems and impacts on environment, but also reduces the carbon foot print and consumption of natural resources leading towardssustainabledevelopment.
1. Qiang Wang., Peiyu Yan& Jianwen Feng. (2011), “A discussion on improving hydration activity of steel slag by altering its mineral compositions”, Journal of Hazardous Materials,186(2–3),pp.1070–1075.
2. Perviz Ahmedzade & Burak Sengoz, (2009), “Evaluationofsteel slagcoarseaggregateinhot mix asphalt concrete”, Journal of Hazardous Materials, 165(1–3),pp.300–305.
3. Sanjay kumar., Rakesh kumar., Amitava bandopadhyay., T. C. Alex., Ravi Kumar B., S. K. Das., & S. P. Mehrotra. (2008), “Mechanical activation of granulated blast furnace slag and its effect on the properties and structure of Portland slag cement”, Cement and Concrete Composites, 30(8), pp. 679–685.
4. Shaopeng Wu., Yongjie Xue., Qunshan Ye & Yongchun Chen, (2007), “Utilization of steel slag as aggregatesforstonemasticasphalt(SMA)mixtures”, BuildingandEnvironment,42(7),pp.2580–2585.
5. Subathra Devi V., & Gnanavel B. K, (2014), “Properties of concrete manufactured using steel slag”,ProcediaEngineering,97,pp.95–104.
6. Gopalakrishnan R, (2018), “Influence of Concentration of Alkaline Liquid on Strength of GGBS and Fly Ash Based Alumina Silicate Concrete”, International Journal of Civil Engineering and Technology, 9(6),pp.1229–1236.
7. Kavitha S and Felix Kala T, (2017), “Effect of Bamboo Fiber in Self Compacting Concrete Partially Replacing Cement with GGBS and Alccofine”, International Journal of Civil Engineering and Technology, 8(3),pp.158–166.
8. Nithyanandham R and Augustine Maniraj PandianG,(2017),“StudyofStrengthCharacteristics of Pebble Concrete with Partial Replacement of Cement byGGBS”, International Journal of Civil EngineeringandTechnology,8(4),pp.1574-1579.
9. Nagendra V.,SashidharC.,PrasannaKumarS.M and Venkata Ramana N, (2016), “GGBS and Nano Silica (NS) Effect on Concrete”, International Journal of Civil Engineering and Technology, 7 (5), pp.477–484.
10. Palod R., Deo S. V & Ramtekkar G. D, (2015), “Preliminary Investigation on Steel Slag Production, Processing and Cementitious Properties”, Recent Trends inCivilEngineering& Technology,6(2),pp.1722.
11. Hasan Alanyali., Mustafa Col., Muharrem Yilmaz & Sadi Karagoz, (2009), “Concrete produced by steel-makingslag(basicoxygen furnace)additionin portland cement”, Journal of American Ceramic Society,6(6),pp.736–748.
12. Wang Q., Yan P. Y & Feng J. W, (2011), “A discussion on improving hydration activity of steel slagbyalteringitsmineral compositions”, Journal of Hazardous Material,186(2–3),pp.1070–1075.
13. YanShi.,HaiyanChen.,Jia Wang&Qiming Feng, (2015),“Preliminaryinvestigationonthepozzolanic activity of superfine steel slag”, Construction and Building Materials,82,pp.227-234.
International Research Journal of Engineering and Technology (IRJET) e-ISSN:2395-0056
Volume: 09 Issue: 08 | Aug 2022 www.irjet.net p-ISSN:2395-0072
14. TsakiridisP.E.,PapadimitriouG.D.,TsivilisS& Koroneos C, (2008), “Utilization of steel slag for Portland cement clinker production”, Journal of Hazardous Material,152(2),pp.805–811.
15.
16. Altun I. B & Yılmaz Ismail, (2002), “Study on steel furnace slags with high MgO as additive in Portland cement”, Cement and Concrete Research, 32(8),pp.1247–1249.
Mr. DEEPAK, is presently research scholar of Civil Engineering, Vidyavardhaka CollegeofEngineering,Mysore.


Dr. DAYANANDA H S, is a Professor of Civil Engineering and Dean-Academics & VTU Examination, Vidyavardhaka College of Engineering, Mysore. He has 34 Years of teaching experience. He has published more than 40 research papers including Scopus indexed JournalswithHandIindex.Heis a Fellow of IEI(I) & IEE(I). He is member of five professional bodies. He is presently guiding 2 research scholars for Ph.D. and onehassubmittedthesistoVTU.
Dr. VIJAYA KUMAR M S, currently working as Assistant Professor Department of Chemistry, JSS Science and Technology University, Mysore He has completed his Masters in Chemistry from the University of MysoreandDoctoraldegreefrom the Tokyo Metropolitan University, Japan. He has worked at ISAS, JAXA, Japan and Tufts University, USA. He is interested in Ceramics, Glasses, High temperature materials, nanocomposites and solidification.
Dr. SOWMYA P T currently workingasAssistantProfessorin the Department of Chemistry, Vidyavardhaka College of Engineering, Mysuru, India. She hasobtainedherpost-graduation (5 Year Integrated M.Sc.) and PhD from University of Mysore, India. She has 15 publications to her credit. She is the recipient of DST-INSPIRE fellowship from Government of India to pursue Ph.D. Her research interests are synthetic organic chemistry, synthesis and characterization of liquid crystals and natural products.