AN EFFECTIVE PREDICTION OF CHRONIC KIDENY DISEASE USING DATA MINING CLASSIFIERS AND DIFFERENT DATA SAMPLING TECHNIQUES
S.MAHESWARI1 , Dr. (Mrs) S. HEMALATHA2M.Sc.,M.C.A.,M.Phil., Ph.D., (CS), Assistant Professor, Department of Computer Science. Master of Philosophy, Department of Computer Science. Shrimati Indira Gandhi College, Trichy-2, Tamil Nadu, India ***

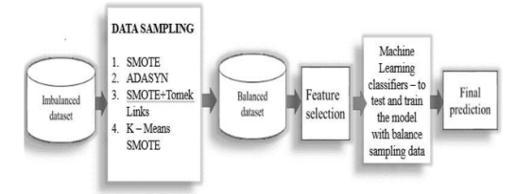
Abstract: Early prediction and proper treatments can possibly stop, or slow the progression of this chronic disease to end-stage, where dialysis or kidney transplantationistheonlywaytosavepatient'slife.This paper is done by Chronic Kidney Disease dataset from UCImachinelearningrepository.CKDdatasetcontainsconta inimbalancedatasetfeatures.The problem of imbalanced classes arises when one set of classes dominate over anothersetofclasses.Theformeriscalledmajorityclass whilethelatteriscalledminorityclass.Itcausesthedata miningmodel to be more biased towardsmajority class. It causes poor classification of minority classes. Hence, this problem throws the question of “accuracy” out of question.Sothatinthispaper,splitintotwophases.One is data sampling and other ones Prediction model. This paper is done by different data sampling methods like SMOTE, ADYSAN and SMOTE + Tome Links, K- means SMOTE. Aftergettingmodifieddatasamplingdataset,to apply the different data mining algorithms .e Decision tree, Random Forest, SVM and KNN to predict the prediction of Chronic Kidney Disease in early stage Based on accuracy, precision and sensitivity, specificity value from implemented tested data mining model to find out the best Sampling swell as Data mining algorithms.
INTRODUCTION
It is all know that Kidney is essential organ in human body. Which has main functionalities like excretion and osmoregulation? In simple words it’s said that all the toxic and unnecessary material from the body is collected and thrown out by kidney and excretion system. There are approximately 1 million cases of chronickidneydisease(CKD)peryearinIndia.Inveterate kidney illness is additionally called renal failure. It may be a perilous infection of the kidney which produces continuous misfortune in kidney usefulness. CKD is a slowandperiodicallossofkidneyfunctionoveraperiod of several years. A person will develop permanent kidneyfailure.IncaseCKDisn'trecognizedandcuredin early arrange at that point persistent can appear taking after Indications: Blood Weight, weakness, week beans, destitute sustenance wellbeing and nerve harm, diminished resistant reaction since at progressed stages perilouslevelsofliquids,Electrolytesandsquanderscan constructupinyourbloodandbody.Henceitisessential
todetectCKDatitsearlystagebutitisunpredictableas its Symptoms develop slowly and aren't specific to the disease. Some people have no symptoms at all so machine learning can be helpful in this problem to predictthatthepatienthasCKDornot.Machinelearning does it by utilizing ancient CKD understanding information to prepare anticipating show. Glomerular Filtration Rate (GFR) is the best test to measure your level of kidney function and determine your stage of chronic kidney disease. It can be calculated from the results of your blood keratinize, age, race, gender, and other factors. The earlier disease is detected the better chance of slowing or stopping its progression. Based upon GFR the renal damage severity by CKD is categorizedintofollowingfivestages
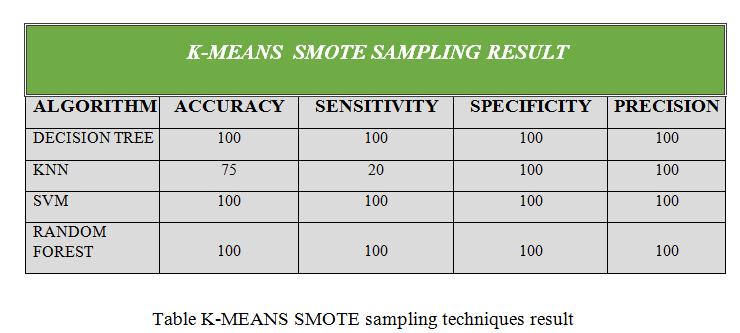
STAGE DESCRIPTION GFR(mL/min) - AtincreasedriskforCKD >=90withriskfactors 1 Kidney damagewith normalorincreasedGFR >=90 2 MilddecreaseinGFR 60-89 3 Moderate Decrease in GFR 30-59 4 SeveredecreaseinGFR 15-29 5 KidneyFailure <15ordialysis
Table1.1CKDiscategorizedintofollowingfivestages
Therearefewstudiesrelatedtotheautomaticdiagnosis ofCKDintheliteraturebuttheyarenotfullyeffectiveto help medical experts. For CKD, the authors usually use predictiveanalysismodelstopredictitsprogressionand, in the best of scenarios, try to stop the disease. Information Mining procedures are connected on it to assess the execution in case of foreseeing whether the individual has kidney maladies or not. Kidney disease is a growing problem. For most individuals, kidney harm happens gradually over numerous a long times, frequently due to diabetes or tall blood weight. This is called chronic kidney disease. When somebody includes a sudden alters in kidney work since of illness, or damage,orhastakencertaindrugsusuallycalledintense kidney harm. This can occur in a person with normal
International Research Journal of Engineering and Technology (IRJET) e-ISSN:2395-0056
Volume: 09 Issue: 08 | Aug 2022 www.irjet.net p-ISSN:2395-0072
kidneys or in someone who already has kidney problems. The main risk factors for developing kidney disease are: Diabetes, High blood pressure, cardiovascular (heart and blood vessel) disease, and familyhistoryofkidneyfailure.In2010,acasestudyfor predicting CKD in a local hospital in England was Presentedinwheretwoconditionswereconsidered:
(a)ModeratetosevereCKD (b)Endstagekidneyfailure.
PROBLEM STATEMENT
Lesson Awkwardness could be a common issue in machine learning, particularly in classification issues. Imbalancedatacanhamperourmodelaccuracybigtime. Machine Learning algorithms tend to produce unsatisfactory classifiers when faced with imbalanced datasets. Most machine learning algorithms work best when the number of samples in each class is approximately equal. This is because most algorithms aredesignedtomaximizeaccuracyandreduceerrors,so abalanceddatasetisneededinsuchcases.
OBJECTIVE
The objective of this work is to explore data sampling techniques and to balance the imbalanced dataset to improvetheperformanceoftheinputdataset.
LITERATUREREVIEW
There are many researchers who work on prediction of CKD with the help of many different classification algorithms.Andthoseresearchersgetexpectedoutputof theirmodel.
Gunarathne W.H.S.D et.al. Has compared results of different models. And finally, they concluded that the Multiclass Decision Forest algorithm gives more accuracythanotheralgorithmswhichisaround99%for thereduceddatasetof14attributes.
S.Ramya and Dr.N.Radha worked on diagnosis time and improvement of diagnosis accuracy using different classification algorithms of machine learning. The proposed work deals with classification of different stages of CKD according to its gravity. By analyzing different algorithms like Basic Propagation Neural Network,RBF and RF. The analysis results indicates that RBF algorithm gives better results than the other classifiersandproduces85.3%accuracy.
S.DilliArasu and Dr. R. Thirumalaiselvi has worked on missing values in a dataset of chronic Kidney Disease. Missingvaluesindatasetwillreducetheaccuracyofour model as well as prediction results. They find solution over this problem that they performed a recalculation
processonCKDstagesand bydoingsotheygotup with unknown values. They replaced missing values with recalculatedvalues.
Asif salekin and john stankovic they use novel approach to detect CKD using machine learning algorithm. They get result on dataset which having 400 records and 25 attributewhichgivesresultofpatienthavingCKDornot CKD. They use k-nearest neighbors, random forest and neuralnetworktogetresults.Forfeaturereductionthey use wrapper method which detects CKD with high accuracy.
Pinar Yildirim searches the effect of class imbalance whenthedataistrainedbyusingdevelopmentofneural network algorithm for making medical decision on chronic kidney disease. In this proposed work, a comparative study was performed using sampling algorithm. This study reveals that the performance of classification algorithms can be improved by using the samplingalgorithms.Italsorevealsthatthelearningrate is a crucial parameter which significantly effect on multilayerperception.
Sahil Sharma, Vinod Sharma, and Atul Sharma, has assessed12differentclassificationalgorithmsondataset which having 400 records and 24 attributes. They had compared their calculated results with actual results for calculating the accuracy ofprediction results. They used assessment metrics like accuracy, sensitivity, precision andspecificity.Theyfindthatthedecisiontreetechnique givesaccuracyupto98.6%,sensitivityof0.9720.
BaisakhiChakraborty, 2019 proposed development of CKD prediction system using machine learning techniques such as K-Nearest Neighbor, Logistic Regression, Decision Tree, Random Forest, Naïve Bayes, Support Vector Machine and Multi-Layer Perception Algorithm. These are applied and their performance is compared to the accuracy, precision, and recall results. Finally, Random Forest is chosen to implement this system.
Arif-Ul-Islam, 2019 proposed a system in which prediction of disease is done using Boosting Classifiers, Ant-MinerandJ48DecisionTree.Theaimofthispaperis twofold that is, analyzing the performance of boosting algorithms for detecting CKD and deriving rules illustrating relationships among the attributes of CKD. Experimental results prove that the performance of Gadabouts was less that of Logit Boost by a fraction. S.Belina V, 2018 proposed a system that uses extreme learning machine and ACO for CKD prediction. Classification is done using MATLAB tool and ELM has fewconstraintsintheoptimization.Thistechniqueisan improvementunderthesigmoidadditivetypeofSLFNs.
International Research Journal of Engineering and Technology (IRJET) e-ISSN:2395-0056
Volume: 09 Issue: 08 | Aug 2022 www.irjet.net p-ISSN:2395-0072
Siddheshwar Tekale, 2018 described a system using machine learning which uses Decision tree SVM techniques. By comparing two techniques finally. Concluded that SVM gives the best result. Its prediction process is less time consuming so that doctors can analyzethepatientswithinalesstimeperiod.
The algorithms provide a basis to identify high risk patients who might benefit from more detailed assessment,closermonitoringorinterventionstoreduce theirrisk.Later,in2011,Tangrietal.developprediction models using demographic, clinical, and laboratory data.The most accurate model included age, sex, estimatedGlomerularFiltrationRate(GFR),albuminuria, serum calcium, serum phosphate, serum bicarbonate, and serum albumin. In 2014, the use of data mining techniques for predicting kidney dialysis survival was presented, where three data mining techniques were used namely ANN, Decision tree and Logical Regression, beingthefirstonethebestamongthethreeachievingan accuracyvalueof93.852%,asensitivityof93.87%anda specificityof93.87%.
In data mining, data is acquired from distinct sources; however, these datasets are often distorted. Majority of the real-world datasets are imbalanced, viz, majority of the instances are labeled to be belonging to one class called majority class while very few are labeled to be belonging to another class called minority class. This class misbalancing problem is highly prevalent in medical data and currently is the hot topic of research.With such sort of imbalanced datasets, classifiers built have a inclination of creating tall exactness for lion's share course and destitute expectationprecisionforminorityclasses.
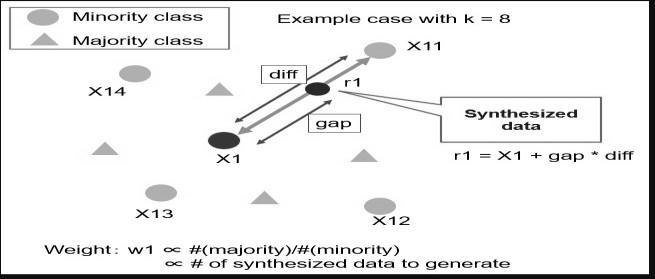
For dealing with of imbalanced information, analysts have proposed arrangements both at information and algorithmic level, but the Destroyed procedure utilized inpondershasappearedwaybetterexecutionwithinthe accessiblewriting.Thishavebeenproposedinadecision support predictive model based on SMOTE dataset rebalancing algorithm and various data mining classification techniques. In utilized Destroyed to diminish course lopsidedness in our dataset within the first step and within the moment step, the rebalanced dataset was utilized with different information mining classifierstofindthebestclassifierforCKDdisease.
EXISTING SYSTEM
There is many research work done on imbalanced dataset.
•DalPozzoloAworkedonincrementallearningtogether withutilizingexaminingproceduresandlastexpectation was done utilizing gathering of those models..They observed better results with random forest classifier
along with Synthetic Minority Oversampling Technique (SMOTE)samplingtechnique.
• Drummond C and Holte RC provided a new insight on the two sampling techniques. It directs us to adapt the machine learning algorithms to imbalanced data by balancing it. They observed that under-sampling techniquebeatsover-sampling.Theirinvestigateimplied the utilize of arbitrary timberland classifier with information adjusting, to realize way better forecast exactness.
PROPOSED SYSTEM
• This paper is done by chronic kidney disease dataset from UCI machine learning repository. CKD dataset containscontainimbalancedatasetfeatures.
•Theproblemofimbalancedclassesariseswhenoneset of classes dominate over another set of classes. The former is called majority class while the latter is called minority class. It causes the data mining model to be more biased towards majority class. It causes poor classification of minority classes. Hence, this problem throwsthequestionof“accuracy”outofquestion.
•Sothatinthispaper,splitintotwophases.Oneisdata samplingandotheroneisPredictionmodel.
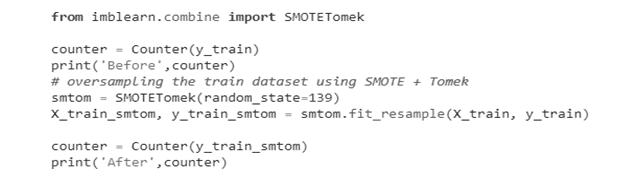
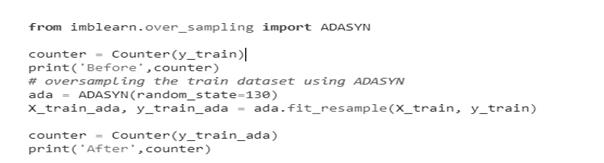
•Thispaperisdonebydifferentdatasamplingmethods like SMOTE, ADASYN: Adaptive Synthetic Sampling Approach,SMOTE+TomekLinks,K-meansSMOTE.
• After getting modified data sampling dataset, to apply the different data mining algorithms i.e Decision tree, Random Forest, SVM and KNN to predict the prediction ofchronickidneydiseaseinearlystage.
•Basedonaccuracy,precisionandsensitivity,specificity value from implemented tested data mining model to find out the best Sampling as well as Data mining algorithms. This is used by Scikit Learn library to implementandtestingourgoal.
•Anddifferentclassifiermodelswillbetrainedwiththe balanceddatasettoimprovetheperformance.
METHODOLOGY
This paper is done by different data sampling methods like SMOTE, ADASYN: Adaptive Synthetic Sampling Approach,SMOTE+TomeLinks,K-meansSMOTE.After getting modified data sampling dataset, to apply the different data mining algorithms Decision tree, Random Forest,SVMandKNNtopredictthepredictionofchronic kidney disease in early stage. This is used by Sickest Learnlibrarytoimplementandtestingourgoal.
International Research Journal of Engineering and Technology (IRJET) e-ISSN:2395-0056
Volume: 09 Issue: 08 | Aug 2022 www.irjet.net p-ISSN:2395-0072
DATAMININGOVERVIEW
The definition of Information Mining or Information Disclosure in Databases is the activity that extricates a few modern imperative data contained in expansive databases. The target of information mining is to discover startling characteristics, covered up highlights orothervagueconnectionswithintheinformationbased ontechniques’combination.Today,manyapplicationsin a wide and various ranges of business founded and worked in this regulation. In 1996, U. Fayyad, G.Shapiro characterized the common information disclosure prepareasanintuitivelyanditerativeprepareincluding more or less the taking after steps: understanding the application field, information selecting, preprocessing andcleaningdata,integrationofdata,datareductionand transformation, selecting algorithms of data mining, interpretation and description of the results and using thediscoveredknowledge.Infact,thedataminingcanbe classified into two categories descriptive and predictive. Really,withinthelateralongtime,informationminingis involving extraordinary position of consideration zone within the society of commerce or managing an account since its flexibility in working with a huge sum of information, and turning such information into clear dataandknowledgeMostofthepeoplemaybeconfused in understanding between the terms “knowledge discovery” and “data mining” in different areas. Information revelation in databases is the method of distinguishing substantial, novel, likely valuable and at long last reasonable patterns/models with information. On the other hand, data mining is a step in the knowledge discovery process consisting of particular data mining algorithms that under some acceptable computational efficiency limitations, finds patterns or modelsindata.
DATAMININGTASKS
Data mining used in different type of techniques to extracttheknowledgefromthedata,thetechniquesare:
Anomaly detection (Outlier/deviationdetection)–The identification of unusual data records, that might be interesting or data errors that require further investigation.(Ex-bankfraudidentification)
Threetypesofanomalydetections:
Unsupervised Anomaly Detection techniques detect anomalies in an unlabeled test data set under the assumption
Supervised Anomaly Detection Techniques require a data set that has been labeled as "normal" and "abnormal"andinvolvestrainingaclassifier.
Semi-Supervised Anomaly detection techniques construct a model representing normal behavior from a given normal training data set, and then testing the likelihoodofatestinstancetobegeneratedbythelearnt model
Association rule learning (Dependency modeling) –Searches for relationships between variables. For example, a supermarket might gather data on customer purchasinghabits.
Utilizing affiliation run the show learning, the grocery store can decide which items are habitually bought together and utilize this data for showcasing purposes. Thisissometimesreferredtoasmarketbasketanalysis.
Clustering – is the task of discovering groups and structures in the data that are in some way or another "similar",withoutusingknownstructuresinthedata.
Classification – is the errand of generalizing known structure to apply to unused information. For illustration, an mail program might endeavor to classify anemailas"trueblue"oras"spam".
Regression – attempts to find a function which models the data with the least error.
Summarization –providingamorecompactrepresentationofthedataset, including visualization and report generation. In this dataminingtechniquesusedtominingthedifferentkind of data, the forms of data for mining applications are database data, data warehouse data, transactional data, datastreams,graphornetworkeddata,spatialdata,text data,multimediadata,andtheWorldWideWebdata.
Prediction - Predictionindataminingistoidentifydata points purely on the description of another related data value. It is not necessarily related to future events but the used variables are unknown. Prediction derives the relationship between a thing you know and a thing you needtopredictforfuturereference.
For illustration, forecast models in information mining areutilizedbyashowcasingdirectorwhoanticipatethat howmuchsumaspecificclientwillspendamidadeal,so that up and coming sale amount can be planned accordingly.
CLASSIFICATION TECHNIQUES
Classification may be a prepare revelation demonstrate (capacities) that portray and recognize classes of information or concept that points to be utilized to foresee the course of the protest which name. Class is unknown. Classification is part of data mining, where data mining is a term used to describe the knowledge discovery in databases. Information mining is additionallyahandlethatemploymentsfactualmethods,
International Research Journal of Engineering and Technology (IRJET) e-ISSN:2395-0056
Volume: 09 Issue: 08 | Aug 2022 www.irjet.net p-ISSN:2395-0072
science,manufacturedinsights,andmachinelearningfor extricating and distinguishing valuable data and important information from a assortment of large datasets. The classification process is based on four components
Class -Categoricalsubordinatevariablewithintheframe thatrepresentsthe'label'containedwithinthequestion.
For example: heart disease risk, credit risk, customer loyalty,thetypeofearthquake.
Predictor -The independent variables are represented by characteristic (attribute) data. a. For example: smoking, drinking alcohol, blood pressure, savings, assets,salaries.
Training dataset -Onedatasetthatcontainsthevalueof bothcomponentsaboveareusedtodetermineasuitable class based on predictor. Testing dataset -Containing new data which will be classified by the model that has beenClassificationcouldbeaninformationminingwork thatallocatesthingsinacollectiontotargetcategoriesor classes. The objective of classification is to precisely predict the target course for each case within the information.
There is some classical data-mining classification algorithmslistedbelow.
Associationrulemining
Bayesian Classification
Decisiontreeclassification
NearestNeighbor
NeuralNetworks(BackPropagation)
SupportVector Machines(SVMs)
This paper is done by using
Decisiontree
KNN
SVM
RandomForest
DETAILSOFALGORITHMS
DECISIONTREE
Decision Trees (DTs) are a non-parametric supervised learning method used for classification and regression problems in which classification is done by the splitting criteria. The decision tree is a flow chart like a tree structure that classifies different instances by sorting them based on the attribute (feature) values. Each and every node in a decision tree represents an attribute in an instance to be classified for given data set. All branches represent an outcome of the test; each leaf node holds the class label. The occasion is classified
based on their include esteem. There are numerous methods for finding the feature that best divide the training data such as information gain, gain ratio, Gini indexetc.Theforemostcommonwaytoconstructchoice trees by utilizing top-down eager strategy dividing, beginningwiththepreparingsetandrecursivelyfinding a part include that maximizes a few neighborhood model. They are the three basic algorithms are widely usedthatareID3,C4.5andCART.
ID3ALGORITHM
ID3isaniterativeDichotomies3.Itisprimitivedecision tree algorithm introduced by Quinlan Ross in 1986. The basic idea is to make a decision tree by using the topdowngreedyapproach.ID3usestheinformationgainfor selecting the best feature For characterizing the data pick the calculation must be done first of the Entropy (X):-Σ[P(I)log(2)P(I)]
Where – P (I) alludes to extent of S have a place to LessonI,Sarealltherecords.(instance),CreferasClass, Σ is over C i.e., Summation of all the classifier. Information Gain (X, A) = Entropy(X) – Σ ((|Xv|/|S|) Entropy (Xv)) Where A is feature for which gain will be calculated,VisallthePossibleofthefeature,Xvistheno ofelementforeachV.
C4.5ALGORITHM
C4.5 is the decision tree algorithm generated Quinlan. It isanextensionofID3algorithm.TheC4.5canbeReferas thestatisticClassifier.ThisalgorithmusesGainradiofor feature selection and to be constructing the decision tree. It handles both continuous and discrete features. C4.5 algorithm is widely used because of its quick classificationandhighprecisionrate.
Thepickupradio“Normalized”thedatapick upastakes after(Quinlan1993).
GainRadio(A,X)=informationGain(X,A)/Entropy(X, A).
CARTALGORITHM
It is stand for Classification Regression Tree introduced by Bremen CART uses binary splitting that means the node has exactly two outgoing edges and splitting are donebytheGiniindex.GiniIndex=1–ΣP^2(I)
ThepropertiesofCARTarethatitisabletoproducethe relapsetree.
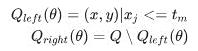
MATHEMATICALFORMULATION
Giventrainingvectors ����∈����,i=1…,landa labelvector y ∈����, and a label vector y ∈, a decision tree recursively
International Research Journal of Engineering and Technology (IRJET) e-ISSN:2395-0056
Volume: 09 Issue: 08 | Aug 2022 www.irjet.net p-ISSN:2395-0072
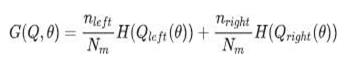
partitionsthespacesuchthatthesampleswiththesame labels are grouped together. Let the information at hub m be spoken to by Q. For each candidate split θ=(j,����)consisting ofa feature and threshold tm, partitionthedatainto����������(θ)and������������(θ)subsets.
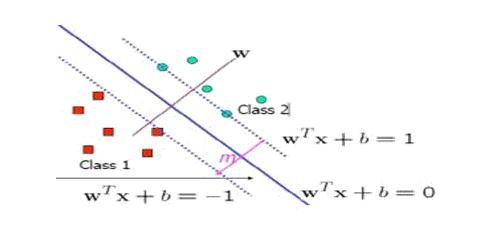
SUPPORTVECTORMACHINE (SVM)
SVM is a setof related supervised learningmethodused forclassificationandregressionSVMisrepresentedwith thehelpofhyperplane.For example,givenSetofpoints belong ingoted throne of the two classes, an SVM find shay per plane having the agree stops possible fraction ofpointsofthesameclassonthesameplane.
The impurity at m is computed using an impurity function H (), the choice of which depends on the task beingsolved(classificationorregression)
Thisseparatinghyperplanescalledtheoptima’spirating perplane(OSH)thatmaximizesthedistancebetweenthe two parallel hyper planes and could minimized her is kormas classifying Examples of the given test dataset. It is shown in followinfigure. Given sometraining data Q, setoffpointoftheform: Q={(X1,Y1),(X2,Y2)….(Xn,Yn)}
Selecttheparametersthatminimizetheimpurity. Recuseforsubsets������(θ*)and������������(θ*)untilthemaxi mumallowabledepthisreached,����<��������������������or�� ��=1.
KNEARESTNEIGHBOURS (KNN)
K Closest Neighbors (KNN) could be a straightforward calculation that stores all accessible cases and classifies unusedcasesbasedonasimilitudedegree(e.g.,separate capacities).A case is classified by a majority vote of its neigh bourse, with the case being assigned to the class most common amongst its KNN measured by a distance function. The Euclidean separate between two focuses x andyisgivenbythecondition
TheEuclideandistancebetween two points x and y is givenbytheequation
√∑(�� )
The esteem of k (the positive numbers) is decided by assessing the information set. Cross- validation is another way to subsequently determine a good k value by using an independent data set to validate the k. Here the value taken are (k =1, 3, 5 and 10) and it produces goodresultatk=10.
Thissuggeststhatthekesteemgetsbiggertheresultwill be more exact.Inmostcasesthe optimal k value will be between3and10.
Here Yi=-1/1thatdenotestheclasstowhich data point Xnbelongs. Any hyper planecanbewrittenasthesetofpointssatisfyingWT.X+b=0H ereWisnormaltohyperplane;bisaconstant.
FigureSVMtrainingwithtwoclasses
Thefollowingformulaconstraintisadded:WT.Xi+b<=1 for xi of first class andWT.Xi+b>=1forxiofsecondclassThiscanbewrittenas,T he formula is minimized by ||w||Subject toYi(WT.xi+b)>=1,foralli.
RBFKERNEL
Proper parameters setting might improve the SVM classificationcuracyforgivendataset.RBFernefunction is used as classifier. It is able to analyses eight dimensional data.Theoutput ofthekernels modified by the Euclidean distance. RBF Kernel function can be defined as:K (Xi,Xj)=EXP(-y||Xi- Xj||2)Here, yisKernelparameterandXi,XjareSupportvector and testingdatapointXi.
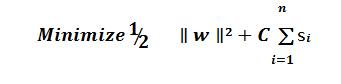
SOFTMARGIN
If the resists nosy per plane that can split the"yes"and"no"examples, the Soft Margin method will choose a hyper plane that splits the examples as cleanly
International Research Journal of Engineering and Technology (IRJET) e-ISSN:2395-0056
Volume: 09 Issue: 08 | Aug 2022 www.irjet.net p-ISSN:2395-0072
as possible. The method introduces nonnegative slack variables, which measure the degree of misclassification ofthedata. ����(������ ��
The objective function to be increased by a function which penalizes non-zero ξ, and the optimization becomesa trade-off betweena large margin andasmall errorpenalty.
If the penalty function is linear, the optimization problembecomes:
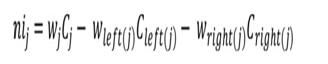
Nisub(j)=theimportanceofnodej
Wsub(j)=weightednumberofsamplesreachingnodej
Csub(j)=theimpurityvalueofnodej
left(j)=childnodefromleftsplitonnodej
right(j)=childnodefromrightsplitonnodej
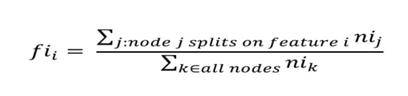
sub()isbeingusedassubscriptisn’tavailableinMedium
Theimportanceforeachfeatureonadecisiontreeisthencalc ulatedas:
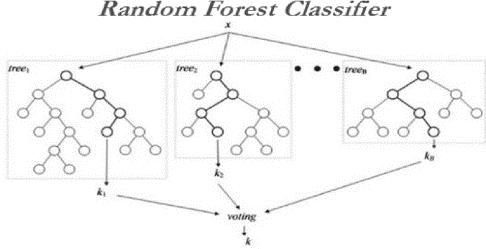
RANDOMFORESTS
Arbitrary woodlands (RF) develop numerous person choice trees at preparing. Predictions from all trees are pooled to make the final prediction; the mode of the classes for classification or the mean prediction for regression. As they use a collection of results to make a final decision, they are referred to as Ensemble techniques.
Fisub(i)=theimportanceoffeaturei
Nisub(j)=theimportanceofnodej
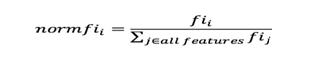
Thesecanthenbenormalizedtoavaluebetween0and1 bydividingbythesumofallfeatureimportancevalues:
FigureRandomForesttree
FEATUREIMPORTANCE
Include significance is calculated as the diminish in hub pollution weighted by the likelihood of coming to that hub.Thehublikelihoodcanbecalculatedbythenumber of tests that reach the hub, separated by the entire numberoftests.Thehighertheesteemthemorecritical theyinclude.
IMPLEMENTATIONINSCIKIT-LEARN
For each decision tree, Scikit-learn calculate a nodes importance using Gini Importance, assuming only two childnodes(binarytree):
Thefinalfeatureimportance,attheRandomForestlevel, isit’saverageoverall thetrees.Thesumofthefeature’s importance value on each tree is calculated and divided bythetotalnumberoftrees:
RFfisub(i)=theimportanceoffeatureicalculatedfromalltre esintheRandomForestmodel.
Normfisub(ij)=thenormalizedfeatureimportanceforiintre ej
T=totalnumberoftrees.

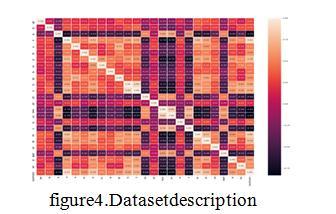
DATASETDESCRIPTION
The CKD dataset was collected from 400 patients from the University of California, Irvine Machine Learning Repository. The dataset comprises 24 features divided into 11 numeric features and 13 categorical features, in additiontotheclassfeatures,suchas“ckd”and“notckd” for classification. Features include age, blood pressure, specific gravity, albumin, sugar, red blood cells, pus cell, pus cell clumps, bacteria, blood glucose random, blood
International Research Journal of Engineering and Technology (IRJET) e-ISSN:2395-0056
Volume: 09 Issue: 08 | Aug 2022 www.irjet.net p-ISSN:2395-0072
urea, serum creatinine, sodium, potassium, hemoglobin, packed cell volume, white blood cell tally, ruddy blood cell tally, hypertension, diabetes mellitus, coronary course illness, craving, pedal edema, and frailty.The diagnosticclasscontainstwovalues:ckdandnotckd.All features contained missing values except for the diagnostic feature. The dataset is unbalanced because it contains250casesof“ckd”classby62.5%and150cases of“notckd”by37.5%.
False negatives (FN): Thesearethepositivetuplesthat were mislabeled asnegative(e.g.,tuplesofclassbuycomputer=yesforwhicht heclassifier predictedbuyscomputer=no).LetFNbethenumberoffalsen egatives.
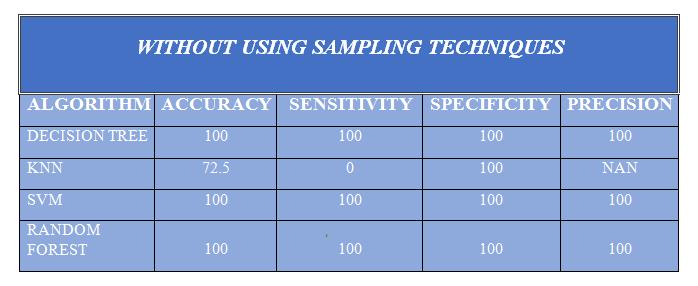
Fromtheconfusionmatrixtheaccuracy,sensitivityandspeci ficity,precisionarecalculatedasfollows.
Accuracy:
Classificationaccuracyisthepercentageofinstancesthatare correctly classifiedbythemodel.Itiscalculatedasthesumofcorrectcla ssificationdividedbythetotalnumberofsamples.
Accuracy = (TP+TN)/ TP+FP+TN +FN